Abstract
Although the importance of technological advancement in facilitating successful transitions to alternative energy is well recognized, the study of technological advancement strategies has been elusive. This study aims to investigate the technological advancement strategies for inventing alternative energy technologies by using patent data. This study empirically examines relationships between forward citation counts and the results of invention activities such as the degree and type of technological advancement (diversification), as well as other bibliographic information about the patent. Specifically, this study considers both the degree and the type of technological advancement of the patents, taking into account the scale and scope of technological knowledge. Finally, the study confirms the heterogeneous relationships between innovation impact and technological advancement in each field of alternative energy. It was confirmed that the innovation impact of patents related to wind energy was more significantly associated with the degree of technological advancement than that of patents related to other fields of alternative energy. In the case of patents related to fuel cells and biofuel, diversification of technological advancement was associated with a higher innovation impact. In the case of solar and hydro energy, specialization of technological advancement was found to be related to a higher innovation impact.
1. Introduction
Maximizing the expected impact of innovations is a crucial factor for the transition to alternative energy. Given the nature of energy industries, which necessitate significant production capabilities and competitive price advantages, the immaturity of technological advancements in alternative energy sources can function as entry barriers to their adoption. The potential high impact of innovations may expedite the introduction and implementation of alternative energy systems. Therefore, in an effort to overcome these entry barriers, this study aimed to investigate strategies for technological advancement that can lead to impactful innovations in alternative energy industries.
In innovation studies, researchers have underscored the importance of specialized patterns for conducting innovation within an industry [1]. Understanding and adhering to these specialized patterns can help maximize the expected impact of innovations. In fact, previous studies have suggested heterogeneous conditions for the high impact of innovations and effective technological advancement, considering industry, region, and period [2]. More specifically, prior research has empirically examined innovation strategies for the effective allocation of invention inputs by investigating relationships between inputs and the expected impact of innovations using patent data [3,4].
However, various and numerous arguments on the optimal strategy for maximizing the expected impact of innovations have been proposed in previous studies [3,5]. There is still a lack of an approach that considers both the degree and type of technological advancements simultaneously at the patent level. Thus, this study seeks to propose evaluation methods for indicators of the degree and type of technological advancement. Subsequently, empirical investigations are suggested to analyze the relationship between innovation impact and inputs based on the proposed indicators of the degree and type of technological advancement. Furthermore, to highlight the advantages of the proposed indicators, we will compare the fitness of the model based on these indicators to other models frequently adopted in previous studies.
Driven by the urgency of sustainable development goals and the global environmental crisis, alternative energy sources are at the center of humanity’s quest for sustainable development. Innovation in alternative energy sources, coupled with effective environmental policies, is the key to achieving sustainable solutions [6,7]. Previous studies have analyzed various aspects of innovation in the fields of alternative energy technologies, from identifying the key technological fields of alternative energy sources to examining their impact on pollution and technological pervasiveness [7,8,9,10,11,12,13]. In this study, we aim to provide an in-depth analysis of the relationship between technological advancement and innovation impact in the field of alternative energy sources, in order to contribute to a sustainable future by boosting the efficient implementation and maximization of the expected impact of innovation in the fields of alternative energy sources.
This study will conclude with empirical analyses based on patent data related to alternative energy sources, presenting relationships between input and the impact of innovation by focusing on the degree and type of technological advancements. Notably, heterogeneity in the relationships between impact and invention inputs is observed in each field of alternative energy sources. Before delving into the main results, we introduce the literature related to this study to provide rich insights into topics related to the alternative energy transition, the impact of innovation, and technological advancement.
Section 1.1 presents the related literature; the formulated hypotheses are presented in Section 2; Section 3 describes the methodology and data used in this study; Section 4 presents the empirical analysis results; and Section 5 provides the conclusion.
1.1. Literature Review
1.1.1. Alternative Energy
The demand for alternative energy sources largely stems from the sustainable development goals (SDGs) [6]. This is because alternative energy sources are seen as a potential way to overcome the comprehensive crisis caused by climate change, resource depletion, and environmental pollution [7]. Consequently, there is growing recognition of and participation in moving toward green growth, which aims for economic growth and low-carbon production systems through the utilization of alternative energy sources and pollution-reduction technologies [8,10]. The key to addressing the comprehensive crisis lies in implementing innovation in alternative and green energy technologies, coupled with effective environmental policies [7].
As mentioned before, technological innovations not only contribute to economic growth but also address social problems [10]. In this context, a global standard in critical technology fields can be useful to manage addressing social problems through technological innovations [10].
In fact, many researchers refer to the WIPO Green Inventory [11] when they investigate the impacts or activities of innovation in green or alternative energy technologies. For example, previous studies suggested various analyses, such as investigating key players in green or alternative energy technology innovations [10], examining the relationship between green technology innovations and the reduction in environmental pollution [12], evaluating the technological pervasiveness of green technology innovations [13], and exploring effective collaboration methods for impactful innovations in alternative energy technologies [3].
1.1.2. Innovation Impact
In this subsection, we explore the literature related to the impact of innovation, with a specific focus on studies based on patent data. The impact of innovation, within the patent context, results from the utilization of three aspects of patent value: direct economic value, indirect economic value, and technological value [14]. According to Lee [14], the technological value results from the role of a patent that links innovation paths from the incumbent to the up-to-date and that initiates new combinations of technologies (or innovations), referred to as technological convergence. In addition, many researchers have measured the impact and potential of the technological value by analyzing the citation data of patents [4,15,16,17]. Direct economic value means the pecuniary amount determined by the market valuation based on transferring or licensing costs [16]. Indirect economic value is closely related to the level of protection, with the duration of the property right of the patent considered as a proxy for the indirect economic value [17]. Regardless of the specific patent value under consideration, previous studies frequently utilized citation data to empirically investigate the impact of innovation.
In this study, the literature reveals two primary branches investigating the impact of innovation. Firstly, previous studies have concentrated on identifying a positive relationship between citation counts and economic value [18,19,20,21]. Secondly, another set of studies has delved into understanding the technological impact of innovation by focusing on the knowledge spillover effects [16,22].
Trajtenberg [23] emphasizes the role of patents as valuable information for economic analyses and innovation studies. According to Trajtenberg [23], the count of patents is strongly positively associated with R&D and other innovative activities, such as the implementation of industrial facilities. Additionally, citation counts are positively correlated with the social value of innovation [23]. Harhoff et al. [19] argued for a positive relationship between a patent’s economic value and citation count. They regressed citation coefficients on the surveyed pecuniary value at the patent level [19]. Hall et al. [18] employed the average citation count of patents to consider the heterogeneity of technological capability among firms. Their findings also indicated a positive correlation between the number of patents divided by tangible capital and average citations and the market value of a firm. Hirshleifer et al. [20] evaluated technological value indicators: technological originality, impact, and intensity using citation and technological classification index (TI) data at the firm level. Hirshleifer et al. [20] showed positive relationships between technological value indicators and financial performance, such as return on equity and assets. Kang et al. [21] investigated the relationship between Italian labor productivity and proxies for knowledge capability by evaluating patents at regional levels. The study argues that knowledge capabilities positively affect growth in labor productivity and, importantly, entrepreneurship is required to deliver and enhance the positive effect of knowledge capability accumulation on growth in labor productivity [21]. To measure proxies for knowledge capabilities, the study utilizes backward citation counts of patents and scientific articles to gauge knowledge assimilation capabilities, forward citation counts three years after patent application to assess the quality of knowledge, and the proportion of regional inventors relative to the total number of inventors as an indicator of knowledge creation capability [21].
Moreover, previous studies that analyzed technology spillover based on citation data provide a reason for using citation counts as a proxy for the technological impact of innovation [15,22]. Jaffe et al. [15] analyzed the geographical boundaries of technology spillovers using the citation data of patents in the United States (US) and found that technological knowledge flow occurs more frequently within standard metropolitan statistical areas than outside such areas. Malerba et al. [22] analyzed the impact of knowledge spillover on innovation activity using citation data of patents granted by the European Patent Office. In particular, Malerba et al. [22] emphasized that technological dissimilarity (distance) increases the difficulty of fostering knowledge spillover during innovation activities, while domestic technology spillover is more effortless than international technology spillover because spatial distance negatively affects the frequency of technology spillover. The effect of technology spillover increases according to the decreases in the technological similarity between cited and citing patents. In addition, technology spillover implies expanding advanced technology from a more developed region (or industry) to less developed regions (or industries). Therefore, citation count can be used as a proxy for the technological impact of innovation.
1.1.3. Technological Advancement
This subsection focuses on literature related to technological advancement. In this study, we investigate technological advancement within the context of the scale and scope of accumulated technological knowledge. Previous studies considered the scale and scope of accumulated technological knowledge as proxies for the degree and type of technological advancement [5,24,25]. Additionally, since we use forward citation counts as a proxy for the impact of innovation, we use TI data to calculate proxies for the degree and type of technological advancement. Consequently, our emphasis is on literature that employs TI data to assess the degree and type of technological advancement of patents. Appio et al. [5] utilized TI data as a proxy for a patent’s knowledge feature in terms of the knowledge amount for analyzing the patent’s value.
Appio et al. [5] regressed proxy variables representing a patent’s value on the number of TI, claims’ length and number, number of backward and forward citations, renewal, and number of families. In this study, the proxy variables are whether an infringement lawsuit is filed and whether the family size is weighted by the gross domestic product of the states in the family [5]. Appio et al. [5] showed that the number of TI negatively correlates with infringement lawsuits. Lee et al. [4] used TI data to build dummy variables for the technical field of a patent. Lee et al. [4] regressed the forward citation count on technical fields, number of inventors, co-applicants, the regional domain of backward citation, age, and so forth at the patent level. Positive correlations between forward citation counts and electricity and physics fields were obtained in the study [4]. Furthermore, previous studies have utilized TI data to measure the similarity (or relatedness) of patent assets at the firm, region, or country level [26,27]. In addition, Kim and Lee [3] utilized TI data to measure technical field and knowledge variables.
Moreover, some studies have evaluated the technological diversification of a firm’s patent assets using TI data [24,25]. Chen et al. [24] and Garcia-Vega [25] measured the diversification index by calculating the Herfindahl index of TI (HITI), which is cited in a firm’s patents. In addition, diversification is regarded as a critical knowledge feature of patents because it fosters the innovative benefit of knowledge spillover from the innovation activities of others [28]. Garcia-Vega [25] regresses innovation activity indicators, R&D expenditure per sale, and the number of patents on the diversification index of patents and other variables. Garcia-Vega [25] shows a positive relationship between the diversification index and innovation activity indicators. Chen et al. [24] regress the diversification index of patents on the scale and scope aspects of innovation activity: the number of patent applications and the portion of new technological fields that are not applied before patent applications and other variables. Chen et al. [24] showed that a firm’s technological diversification positively correlates with the scale and scope of innovation activity. Kwon et al. [29] utilized citation and classification information to analyze the innovation patterns of scientific research, academic papers, and commercial research applications, such as patents, for two nano-based technologies: nano-enabled drug delivery (NEDD) and graphene. The study shows that the innovation patterns of the two technologies differ by field of innovation activity. In detail, the NEDD developments followed a diversification pattern in the scientific research field but a specialization pattern in the commercial research application field. Meanwhile, the graphene developments followed a specialization pattern in the scientific research field but a diversification pattern in the commercial research application field [29].
Kogler et al. [26] suggest diversification and technological similarity (relatedness) as a knowledge feature fostering innovative benefits. Based on the cosine similarity of TI co-occurrence, Kogler et al. [26] evaluated the average relatedness of patents by region. According to Kogler et al. [26], patent intensity (patents per labor) is positively correlated with the average relatedness of patents, which is positively auto-correlated in the long term. In other words, the average relatedness of patents in the past implies higher average relatedness in the future endogenously; consequently, higher average relatedness induces higher patent intensity [26]. Average relatedness does not mean that technological knowledge, a critical knowledge feature of sustainable growth in technological advancement according to endogenous innovation theory, grows endogenously and fosters innovation benefits [26,28]. In addition, we do not suggest empirical evidence of positive relationships between knowledge features and innovative benefits, rather than economic features, in the literature review. However, patents, an expected outcome of innovation activity in developed economies, are positively correlated with economic benefits at the patent, firm, and country levels [18,19,20]. Therefore, some knowledge features of patents fostering innovative benefits would also induce economic benefits by increasing the outcomes of innovation activity. Consequently, the knowledge features that would induce economic benefits can be regarded as a proxy for technological advancement from the perspective of economics [28,30].
In summary, we reviewed the empirical studies that attempt to evaluate various knowledge feature variables related to the technological advancement of patents by using citation and TI data. The literature above provides empirical evidence linking various knowledge features with economic and innovative benefits. The literature on technological advancement utilizes patent data such as citations, technological classification indices, and quantities to capture various knowledge features of knowledge capital. However, most of the proxies for technological advancement in the literature do not directly deal with technological knowledge to represent the technological advancement of patents (or a patent). Therefore, we suggest new indicators representing the technological knowledge of a patent for the rest of this study.
2. Hypothesis
In this section, we suggest hypotheses based on the theoretical background of technological advancement. Furthermore, we refer to the literature related to the mechanism of progress in technological advancement, which is closely related to the technological knowledge feature of inventions.
In this study, the concept of technological advancement is rooted in theories of economic growth. According to classical economics, Solow [31] proposed that technology is the relationship between input and output in the aggregate production function. In this framework, technological advancement progresses exogenously and continuously through improvements in the productivity of the aggregate production function [31]. However, Romer [28] introduced a contrasting view, suggesting that progress in technological advancement is endogenous and driven by improvements in knowledge accumulation. Rivera-Batiz and Romer [30] proposed that knowledge, as the core of technology, can be produced by utilizing the existing knowledge stock and human capital. The economic perspectives on technological advancement have evolved from “detected but exogenous” to “recognized, endogenous, and knowledge accumulation, which leads to economic growth” by recognizing knowledge as the input and output of economic activity. It is necessary to adopt knowledge in a production system to link improvements in knowledge accumulation to technological advancement that combines technological knowledge with an input factor or process by consuming resources such as human, knowledge, and monetary capital. This process is known as innovation, leading to economic development. However, previous studies usually utilized the citation count, which means knowledge spillover frequency as a proxy for the degree of technological advancement of patents instead of a variable directly implicating the technological knowledge of a patent [18,19,20].
Therefore, we suggest hypothesis 1 regarding the assumption of technological advancement, in which technological knowledge means the degree of technological advancement and is positively related to the value of technology. In other words, if the proposed indicator of technological knowledge appropriately represents the degree of technological advancement, it positively correlated with the citation count. This is because the citation count implicates a patent’s technological and economic value [14], as evidenced by a positive correlation with economic development indicators, such as the market value of a firm, surveyed pecuniary value of a patent, and gross domestic production (GDP) [18,19,20].
Hypothesis 1.
A significant and positive relationship exists between the scale of technological knowledge and technological value (citation count).
Technologies have been developed as enterprises expand in scale and scope regarding function, region, and products [32]. Enterprises have undergone technological advancements and innovations since the Industrial Revolution and faced a tradeoff between standardization and production flexibility when they constantly attempted technological change by considering changing markets and technologies [33]. According to Pavitt et al. [2], innovation activities can aim for technological advancement by focusing on either specialization or diversification in firm- and industry-specific scenarios. Compared to other types of firms, more technological opportunities (which utilize progress in technological advancement) are available for scientific firms, and these opportunities vary depending on the type of technological advancement [2]. Scale-intensive and supplier-dominated firms, such as steel, vehicle, printing, and construction firms, tend to undergo technological diversification to expand their businesses into technology-related industries [2]. In contrast, small firms (with less than 1000 employees) in the mechanical engineering and instrumentation industries tend to specialize in technology that focuses on the incumbent industry [2].
In summary, technological advancement is based on an entrepreneur’s strategic decision in choosing between diversification and specialization as the innovation path to adopt technological opportunities and meet the ever-changing environment of the firm. This implies that an appropriately intended innovation by an enterprise can be technologically developed through any technological advancement, with tradeoffs between specialization and diversification. Specialization indicates that technological advancement can be achieved by accumulating intra-field knowledge, including intra-sectoral, intra-industrial, and intra-technological knowledge. Diversification indicates that technological advancement can be achieved through the accumulation of inter-field knowledge, including inter-sectoral, inter-industrial, and inter-technological knowledge. Maximizing potential outcomes based on technological advancement depends on the complementary use of related technologies [2]. Thus, technological advancement can be achieved by considering the various benefits of diversification [1,2,32,33]. Moreover, economic benefits of technological diversification have been found at national and firm levels [34]. We suggest hypothesis 2 about the scope of technological knowledge based on the literature mentioned above.
Hypothesis 2.
A significant and positive (or negative) relationship exists between the scope of technological knowledge and technological value (citation count).
Although specialization and diversification can aim for technological advancement, they are mutually exclusive. Therefore, if the scale of technological knowledge is uniform regardless of type, technological advancement in specialization implies a loss of the potential to accomplish technological advancement based on diversification. Similarly, diversification implies a loss of potential to accomplish technological advancement based on specialization under the same assumption on the degree of technological advancement. Thus, analyzing the scope of technological knowledge involves scenarios in which a choice between the two needs to be made. Therefore, based on the abovementioned argument, we suggest hypothesis 3 regarding the independent relationship between the degree and scope of technological knowledge.
Hypothesis 3.
A low or insignificant correlation exists between the scale and scope of technological knowledge.
In this section, we reviewed previous studies related to the indicators of technological advancement. Technological advancement is a process aimed at embedding technological knowledge into an invention. The process can be carried out by aiming for diversification or specialization according to the inventor’s strategic choice, proposing the invention’s impact. Based on the literature mentioned above, we suggested hypotheses for indicators of the scale and scope of technological knowledge that align with the theoretical framework of technological advancement.
3. Data and Methodology
3.1. Data
For this study, we retrieved granted Patent Cooperation Treaty patent applications (PCT patents) related to alternative energy sources, which correspond to the alternative energy technologies based on the IPC Green Inventory by the World Intellectual Property Organization [11]. There are 13 fields of alternative energy technologies in the IPC Green Inventory. We only retrieved 114,038 PCT patents applied from 2011 to 2015, because it takes several years for patents to accumulate records of forward citation, which is a proxy for the impact of innovation. However, this study utilized 105,556 patents that do not correspond to multiple fields of alternative energy technologies and are able to be transformed into analytical form. Moreover, we focused our quantitative analysis only on the fields of alternative energy technologies, with more than 1000 observations from the 105,556 patent data. Specifically, we propose empirical results by focusing on the fields of solar energy (Solar), wind energy (Wind), fuel cells (Fuel), biofuel (Bio), hydro energy (Hydro), harnessing energy from manmade waste (HE), and using waste heat (UW), because the numbers of patents are only sufficient for those fields of alternative energy to perform empirical analyses. Details on the dataset are provided in Appendix A.
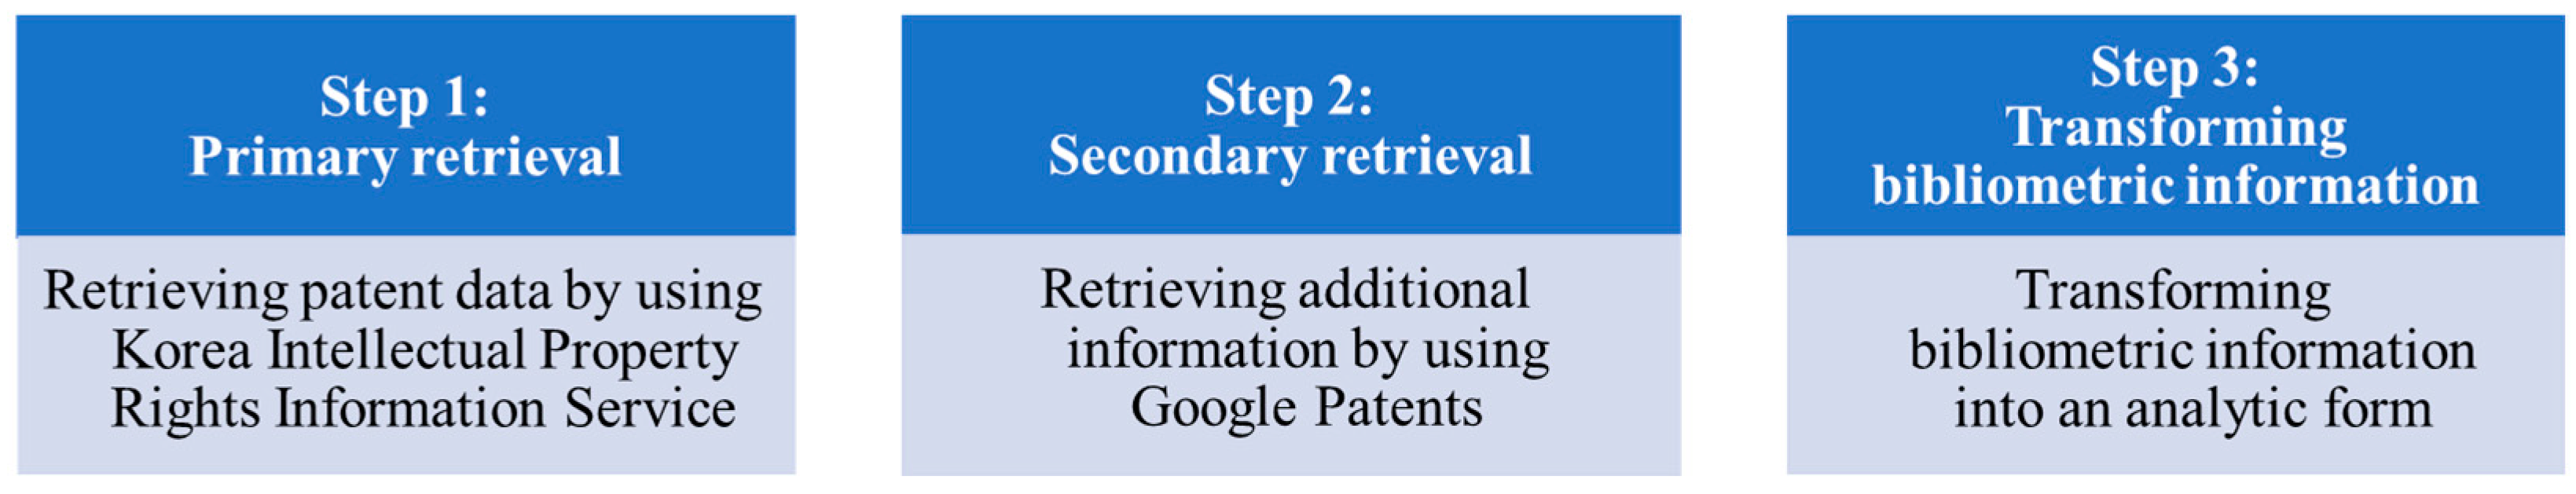
The data collection process of this study was performed in three steps, as shown in Figure 1. First, we retrieved the alternative energy patents by using the Korea Intellectual Property Rights Information Service (KIPRIS) [35]. Second, we retrieved additional information on citations by using Google Patents [36]. Third, we converted bibliometric information, such as forward and backward citations, TI, assignee, inventor, and application date, into an analytical form.
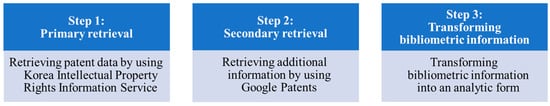
Figure 1.
Data collection process.
3.2. Variables
In this study, we transformed bibliometric information into various variables reflecting the value of patents to verify the hypotheses on technological advancement at the individual patent level. According to Lee [14], a patent simultaneously includes various aspects of the value of an invention, such as technological and direct and indirect economic values. Technological value, used as a measure of knowledge spillover performance, is reflected in forward citation counts [4,14]. Forward citation count was used as the dependent variable.
By transforming bibliometric information into variables of technological advancement and other control variables, the explanatory variables for technological impact were arranged into four categories: research team, invention, geographical localization, and technological field [4].
The variables of interest: The scale and scope of technological knowledge represent the degree and type of technological advancement of an invention at an individual patent level. The scale of technological knowledge quantitatively refers to the degree of technological advancement of an invention. The scale of technological knowledge is measured by calculating the Shannon information entropy (IE) or counting the number of decomposed forms of technological classification indexes (DTIs) in a patent. In addition, we will explain the DTI in the following sub-subsection. The scope of technological knowledge refers to the technological advancement of an invention in terms of diversification and specialization. Measuring the scope of technological knowledge calculates a diversification index based on Shannon IE or the ratio between the scope and scale of the DTI. In addition, we use the information entropy formula proposed by Shannon [37] to provide less advantage to duplicated TIs. We explain the reason for using Shannon’s IE in the following subsections.
The control variables which are related to a patent’s value were arranged in an analytical form by transforming bibliometric information [4]. The research team category included variables that indicated the size of the invention group, such as the number of inventors and co-assignees. Intuitively, several inventors would represent the scale of labor input, but Adams et al. [38] focused on its collaborative aspect for the patent application. Therefore, the number of inventors may positively affect the patent’s value when the researchers’ collaboration is successful. The co-assignees category refers to collaboration in terms of business between corporations. The invention category involves variables that imply invention-specific characteristics such as the number of family patents, backward citations of patents, and incumbent patents accumulated up to the previous year of application. The number of family patents represents the patent’s market range, which indicates the number of regions granting the patent’s novelty and property rights. The backward citation counts simultaneously implicate two aspects which are the number of prior technologies and the scale of required background knowledge. Intuitively, the incumbent patents are related to the technological newness of patents and their number is in inverse proportion to the technological newness. The geographical localization category involves variables that are the proportion of backward citation counts from patents granted in the US, Japan, and other patent office regions (or countries). The geographical localization variables indicate the locational domain of prior inventions (backward citing patents). The technological field category includes variables that indicate the type of technological domain, such as the proportion of cited TIs. A few technological domains of a patent such as electronics would contribute to the patent’s value more than other technological domains [14]. Additionally, we have included dummy variables for the application year to control for time-specific effects. The abbreviations and variables used in this study are summarized in Table 1.

Table 1.
Summary of abbreviations and variables.
The cumulative forward citation count, owing to its application, is used as the knowledge spillover performance (FCC) variable, a proxy for the innovation impact. The cumulative forward citation count for this study represents the integrated forward citation count of family patents. The scale of technological knowledge variable, a proxy for the degree of technological advancement and can be measured by calculating the IE or number of TIs in a patent. The details of the calculation of are provided in Equation (1). The scope of technological knowledge variables, proxy for the type of technological advancement and can be measured by the diversification index based on the IE or the ratio between the scope and scale of the DTI in a patent. The details of the calculation of are provided in Equation (2). The research team variable (INV) is the number of inventors. The invention collaboration variable (ASS) is the number of co-assignees whose value is one if the number of assignees is greater than one and zero otherwise. The extent of exposure to future inventions variable (FAM) indicates the number of family patents. The patent variable (PAT) extent is the number of backward citations of patents. In this study, the number of backward citations refers to the number of integrated backward citations of the family patents. A indicates a vector of dummy variables of the alternative energy sources according to the WIPO Green Inventory. T indicates a vector of dummy variables of major technological fields of the patent. U represents a vector of variables indicating the locational domains of major prior inventions, which is the proportion of backward citation counts by patent office region. V Indicates a vector of dummy variables of locational information on the patent office region of the patent and its patent family. Y indicates the vector of the application year dummy variable.
3.2.1. Transformation of the Technological Classification Index
Before calculating the variables of interest, the TIs were transformed into decomposed forms concisely expressed by the classification levels. In Table 2, three TIs are indicated by their distinct classification levels.
Table 2.
Decomposed form of the technological classification index (DTI).
The patents considered in this study cite the TI classified at either the main group or a more detailed classification level than the main group. However, the cited form of TI includes the classification information of the section, class, and subclass levels, as shown in Table 2. If the cited form of TI is used to measure the indicators of technological advancement, the values of the indicators with information loss can be inappropriate. Therefore, we utilized the decomposed form of the technological classification index (DTI) to calculate the variables of interest to avoid calculating variables with information losses.
By utilizing DTI, a more concisely classified index would overlap more frequently. Thus, a more concisely classified index is more likely to exist within the patent. For example, three TIs (Table 2) indicates that “E” is duplicated and cited with a probability of 2/15 in a patent. Consequently, this transformation method duplicates information if patent-cited TIs are classified similarly. For example, when calculating the variables of interest, we transformed the cited form of TI into DTI from “E21B 15/04; E21D 09/01; C09C 01/02” to “E, E21, E21B, E21B 15/00, E21B 15/04; E, E21, E21D, E21D 09/00, E21D 09/01; C, C09, C09C, C09C 01/00, C09C 01/02”.
In addition, transforming TI into DTI is vital because more detailed technological information involves more background technical information. For example, there are two imaginary patents, A and B. A patent of an ordinary (vertical) drilling machine’s support machine cites “E21B 15/00”. B patent of a support machine for an advanced (directional) drilling machine cites “E21B 15/04”. There must be differences in the amount of technological information between the two patents because patent B requires additional knowledge related to directional drilling. However, suppose an evaluation of technological advancement does not consider the structural features of a TI classification. In this case, the evaluation work fails to distinguish the differences between the two patents citing the TI count. Hence, we transformed TI into DTI before calculating indicators of technological advancement.
3.2.2. Calculation of Variables of Interest: Scale and Scope of Technological Knowledge
In this study, we used four indicators of technological knowledge to reflect the technological advancement features of a patent. There are two types of indicators: scale and scope of technological knowledge. The scale and scope of technological knowledge mean the scale and scope aspects of knowledge utilized for a technological invention (a patent). First, we calculated the IE of DTI and the number of DTIs as variables of the scale of technological knowledge in a patent. Equation (1) shows the calculation of the IE [37].
In Equation (1), denotes the number of DTIs without duplication. For example, if a patent cites the three TIs listed in Table 2, then the number of DTIs without duplication is 13. denotes the index of DTIs without duplication, and denotes the probability of the -th DTI in the patent. Therefore, is Shannon’s IE of a patent’s DTI and is the number of a patent’s DTIs. Both and represent the scale of technological knowledge of a patent. However, when measuring the scale of technological knowledge in a patent, only considers information loss regarding the redundant information of technological knowledge accumulated in a patent. If a patent includes redundant information about technological knowledge of some specific technological field, the patent may include a DTI which is classified into Main group and Section level.
Second, we calculated diversification indices based on IE and the number of DTIs, and , as the scope of technological knowledge in a patent. Thus, the and represent the scope of technological knowledge in a patent between specialization and diversification. Equations (2) and (3) show the calculations for and , respectively.
Here, denotes the number of DTI without duplication, denotes the index of the DTI, denotes the probability of the th DTI in the patent, and denotes the total number of DTI. For example, a patent cites the three TIs listed in Table 2, and the number of DTIs was 15. In addition, denotes the index of an element of all DTIs, and denotes the probability of the jth DTI.
In Equation (2), indicates and equals because equals in Equation (2). Consequently, equals . Where is the maximum potential IE.
Moreover, in Equation (2), is smaller if the DTI of a patent is more diverse because is greater than or equal to zero. The absolute value of is proportional to the IE loss from the duplicated information of DTIs, if does not vary according to the variety of DTIs.
In Equation (3), is calculated by dividing the number of duplicated DTIs by the total number of DTIs. For example, if a patent cites the three TIs in Table 2, is 13/15. Because the DTIs without duplication of the three TIs are “E, E21, E21B, E21B 15/00, E21B 15/04, E21D, E21D 09/00, E21D 09/01, C, C09, C09C, C09C 01/00, C09C 01/02,” all the DTIs of the three TIs are “E, E21, E21B, E21B 15/00, E21B 15/04, E, E21, E21D, E21D 09/00, E21D 09/01, C, C09, C09C, C09C 01/00, C09C 01/02.” Thus, and increase (or decrease) proportionally with the degree of technological diversification (or specialization).
Equations (2) and (3) represent the scope of technological knowledge obtained by dividing the scope aspect by the scale aspect. Therefore, the scope of technological knowledge variables, and , were designed to represent the scope aspect of technological knowledge regardless of the scale aspect of the technical information of a patent.
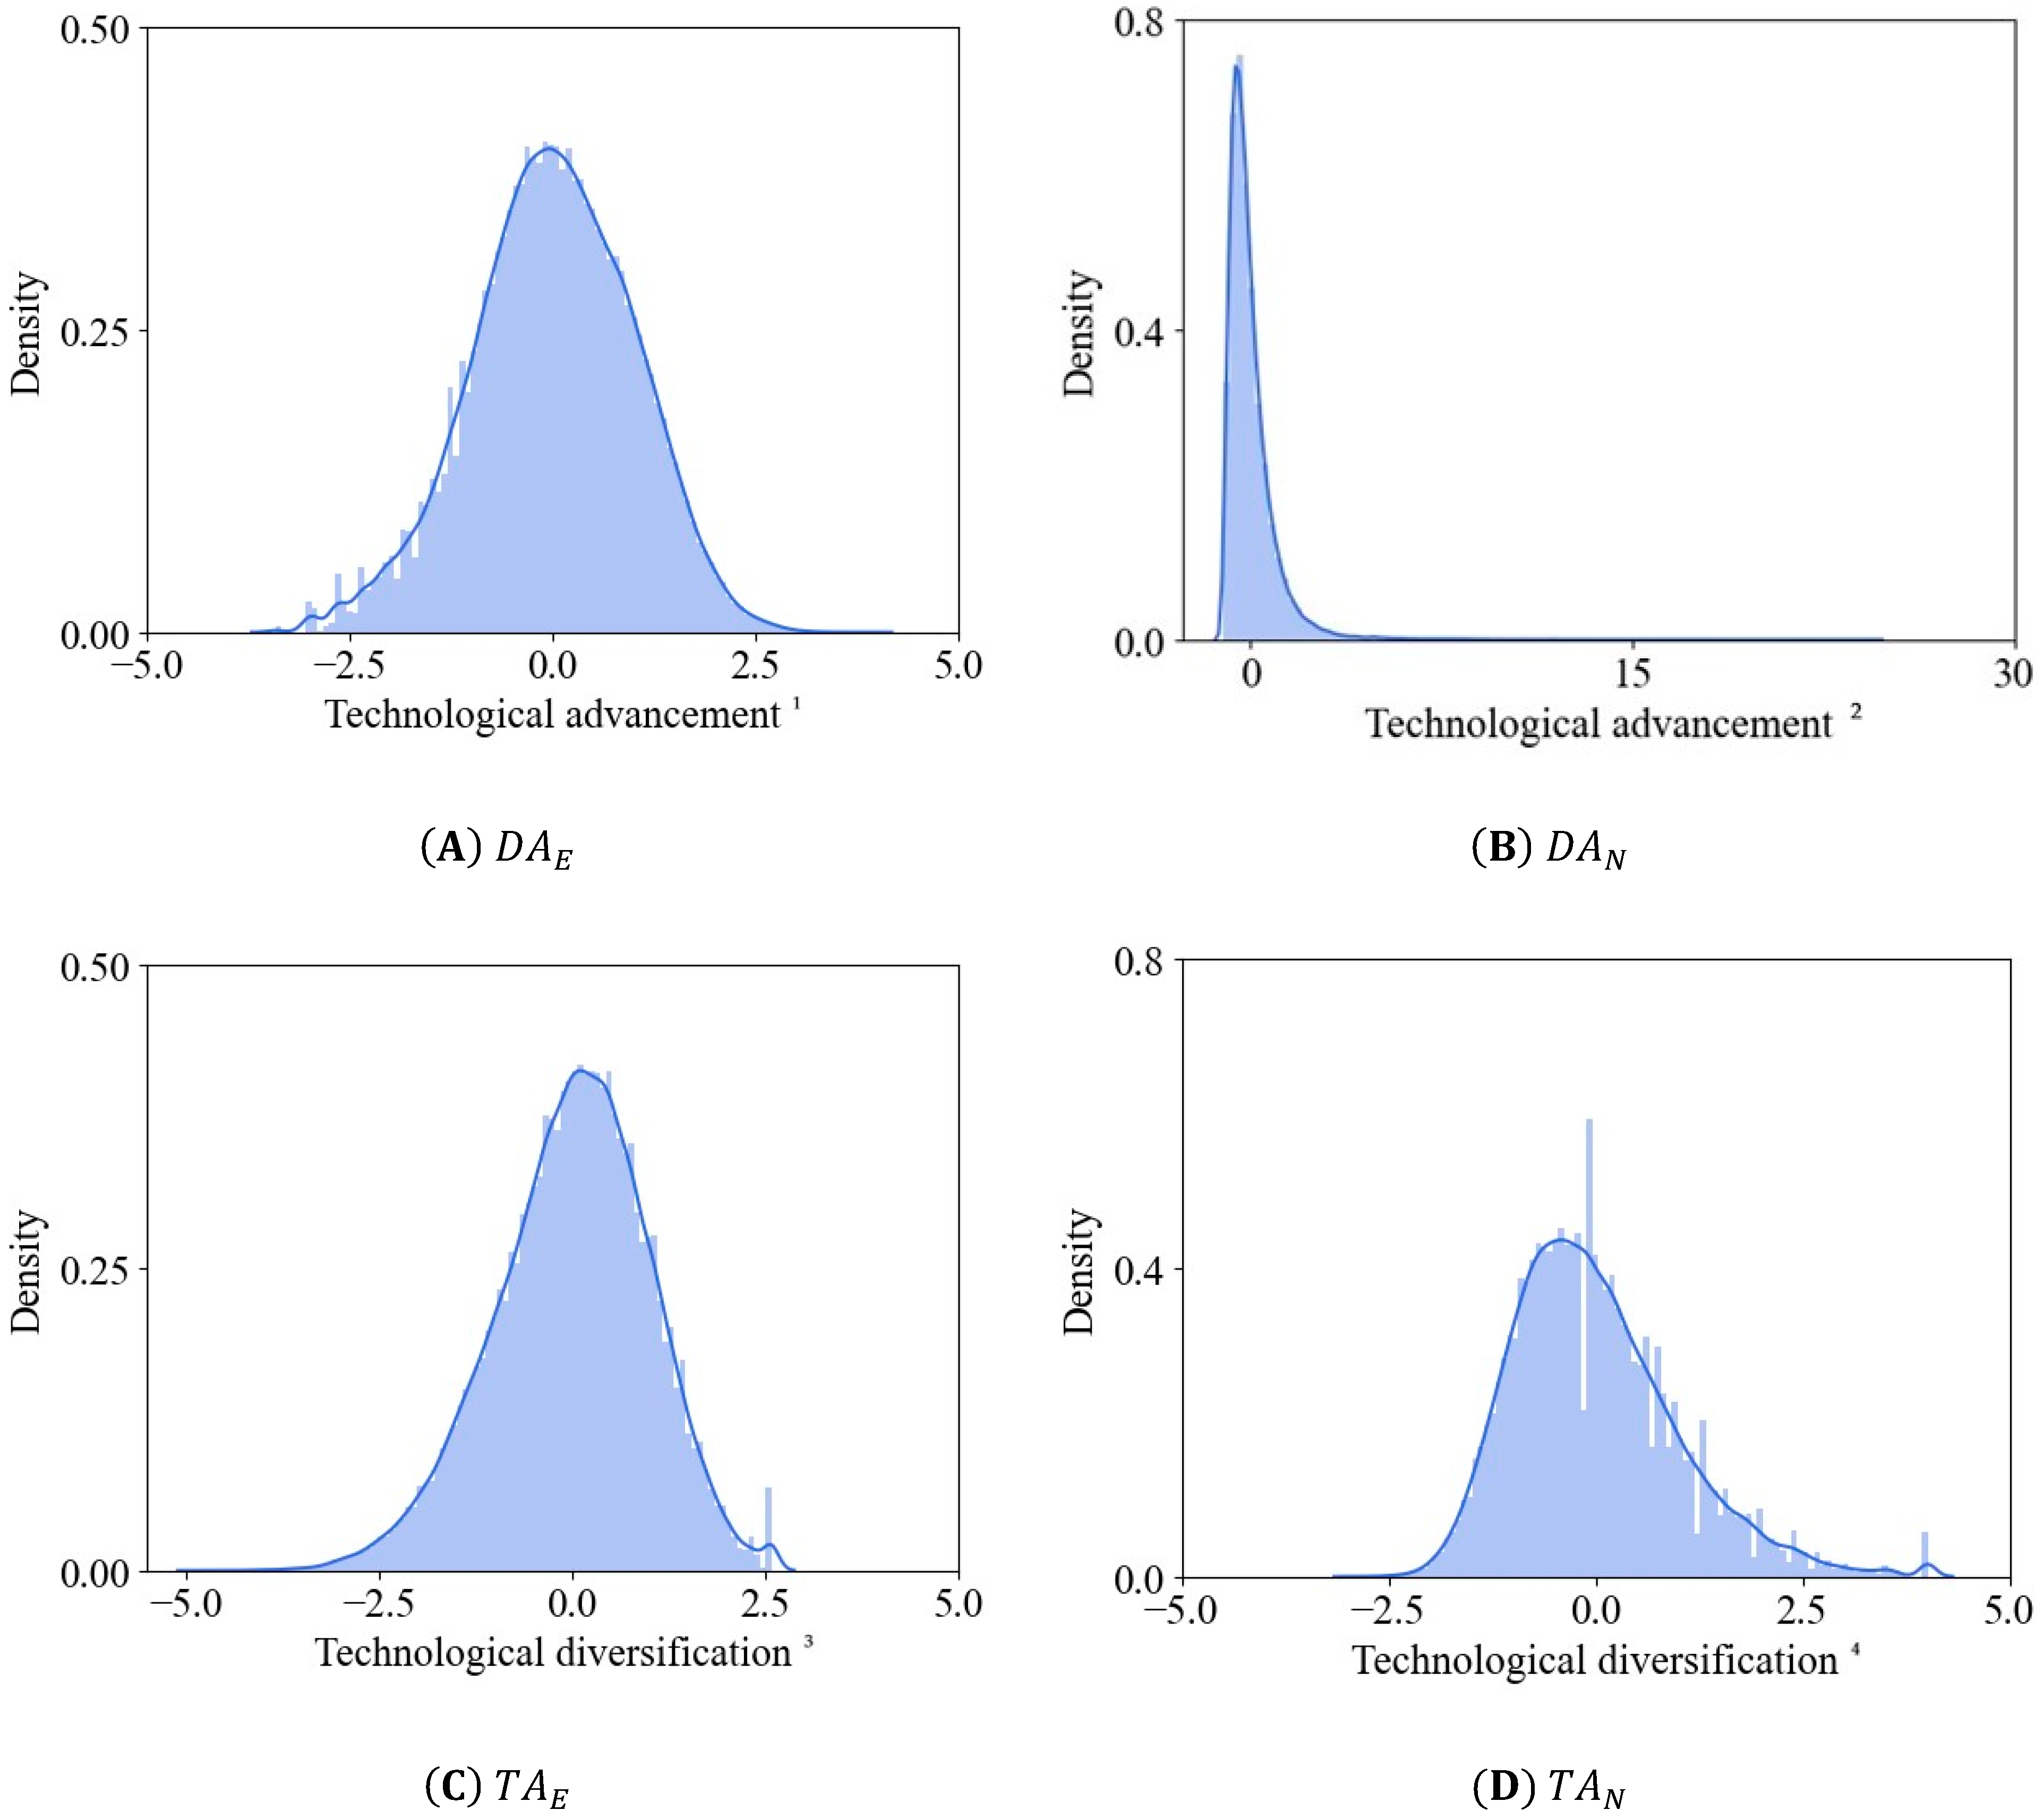
Additionally, for the convenience of interpretation of the result, we normalized the scale and scope of technological advancement variables (, , , and ). The distribution of the four variables of interest is shown in Appendix B Figure A1.
3.3. Methodology
3.3.1. A Regression Method for Zero-Inflated Data
We used forward citation counts as a proxy variable for innovation impact. As shown in Table 3, forward citation counts possess the characteristics of zero-inflated count data, which include the overspread of the zero-count observation. The frequency of observations with zero forward citation counts accounted for a large portion of the data (Table 3), with a value of 15.20%.
Table 3.
Frequency of forward citation counts.
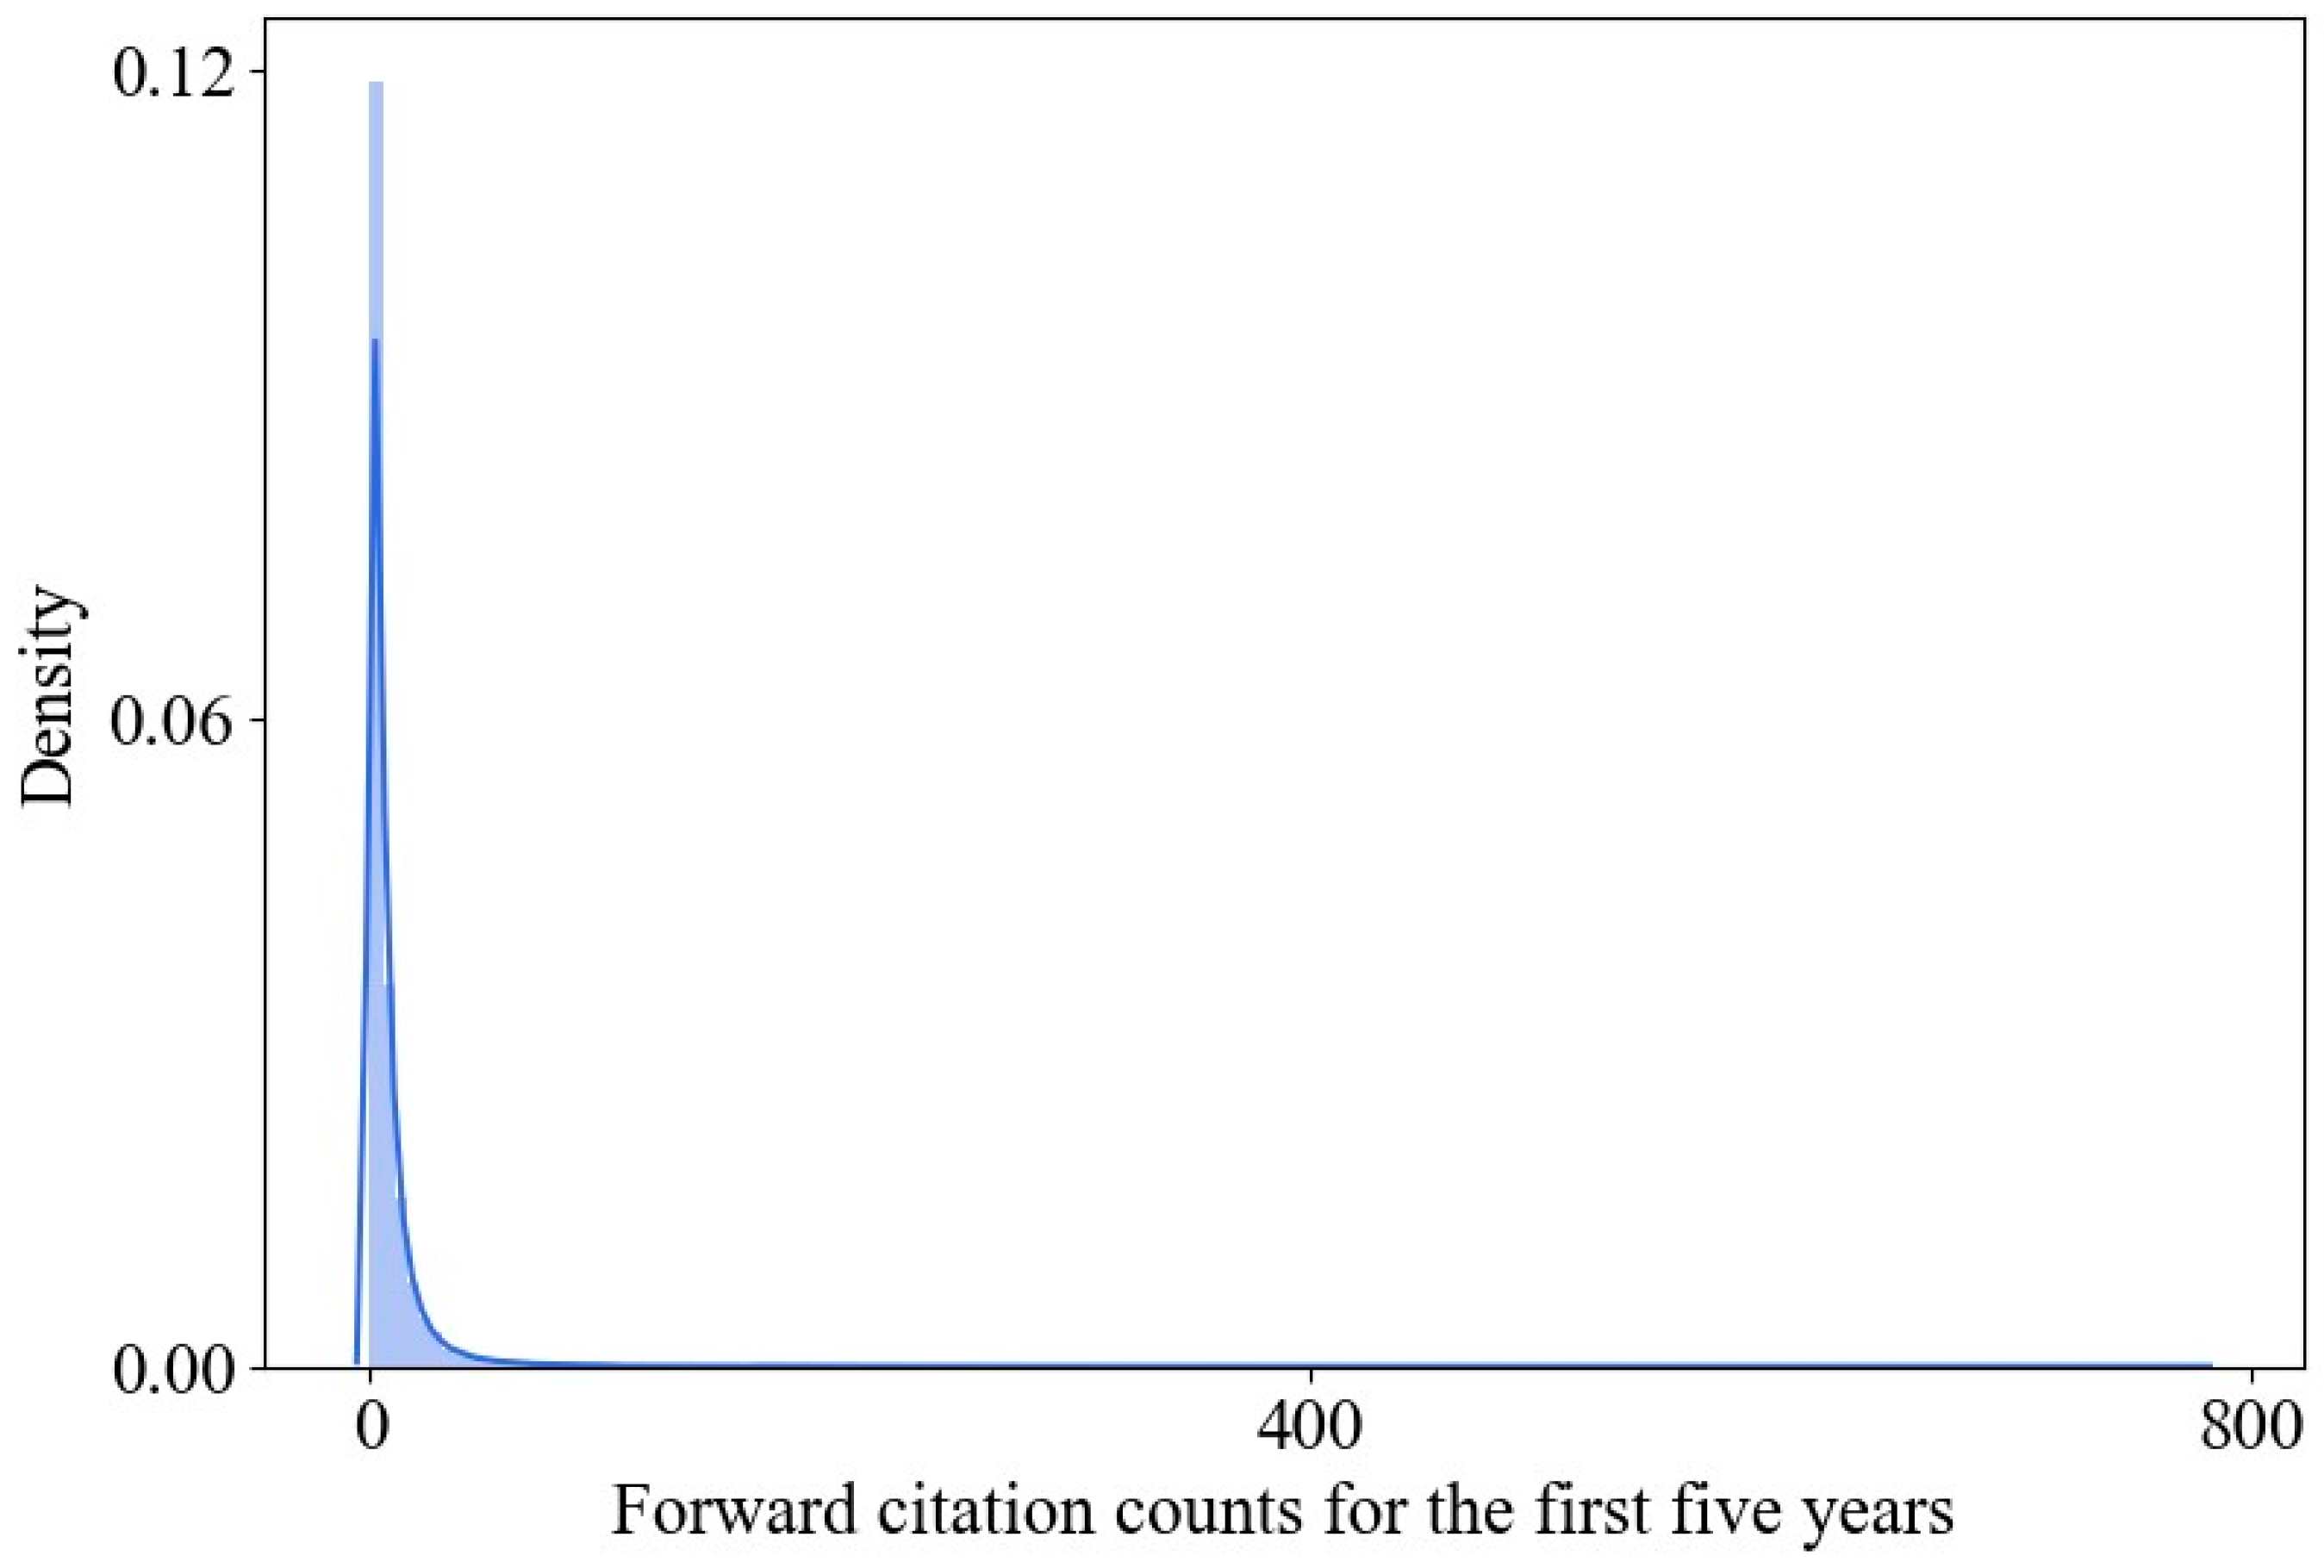
The frequency of forward citation counts ( decreased rapidly with increasing forward citation counts (Table 3). The weights of the 5, 10, and 15 forward citation counts were 6.15%, 2.55%, and 1.20%, respectively, as shown in Table 3. The graph is presented in Figure 2.
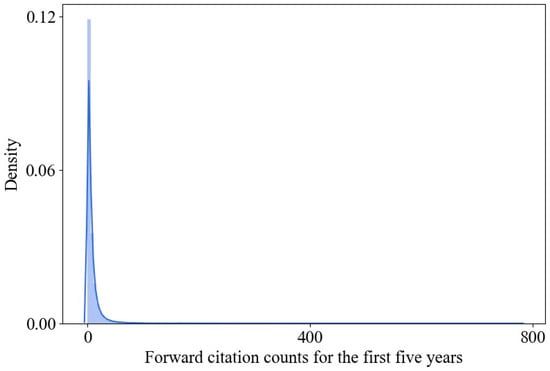
Figure 2.
Distribution of forward citation counts for the first five years.
In previous studies [39,40], many techniques have been suggested to analyze zero-inflated count data. According to Gardner et al. [39], ordinary least-squares and regression methods for integer counts, such as negative binomial and Poisson, can overestimate the confidence of the analysis results. Baccini et al. [40] suggested that various regression methods are suitable for analyzing zero-inflated data with precision and accuracy. Baccini et al. [40] suggested appropriate methods by comparing the information criteria among the regression analysis methods for these data. According to Baccini et al. [40], the zero-inflated negative binomial (ZINB), hurdle negative binomial (HNB), and generalized weight regression (GWR) are suitable for analyzing zero-inflated data. Hence, HNB was adopted in this study to analyze the relationship between technological value and technological advancement. We utilized the zero-inflated data to conduct HNB regression analyses using R-4.1.2 [41] with the software package: “pscl-1.5.5.1” [42]. In addition, HNB has the advantage of more robust standard error for zero-inflated data than the ordinary least-squares method, and by separating the probability distributions of the count part and the binomial part in the statistical estimation process, it is an appropriate method for patent data, the vast majority of which are merely applications and grants [40,42]. As shown in Figure 2, the number of patents with zero forward citation counts has no impact on subsequent inventions.
3.3.2. Economic Strategy
In this study, we estimate the coefficients using a regression model, as shown in Equation (4).
In Equation (4), is the abbreviation for the cumulative forward citation counts of family patents. FCC reflects the innovation impact of patents.
and are indicators of the technological advancement of patents. is the abbreviation for variables that represent the degree of technological advancement. can be chosen within the IE of the DTI () and the number of DTIs (). is an abbreviation for the variables that represent the type of technological advancement; it is negatively correlated with various technical information in a patent. can be chosen from a variety of indices based on IE () and the ratio between the scope and scale of DTI ().
and represent the specific characteristics of the research team of a patent. is an abbreviation for a variable that represents the number of inventors, and is an abbreviation for an indicator variable representing the number of co-assignees.
and represent the invention-specific characteristics of the patents. is the abbreviation for a variable that represents the number of family patents. is an abbreviation for a variable representing the backward citation counts of family patents.
, , U, V, and are the vectors of the control variables that capture fixed effects by type of alternative energy source, technological field, locational domain of prior inventions, locational information on the patent office region of the patent and its patent family, and application years, respectively. is the abbreviation of the vector that consists of dummy variables for the alternative energy sources, . is the abbreviation of the vector that consists of dummy variables for major technological fields, . is the abbreviation of the vector that consists of dummy variables for the main locations of patent offices of backward citations, . is the abbreviation of the vector that consists of dummy variables for location of patent and its family publications, . is the abbreviation for the vector that consists of dummy variables for the application year, .
In Equation (4), and are simultaneously included to predict FCC because it aims to precisely analyze the relationship between innovation impact and the degree of technological advancement of an invention under the condition of a given type of technological advancement (diversification or specialization). Thus, in the case of a specialized patent, if more similarly classified TIs are included, the is measured to be higher with more TIs and lower than those in the case of diversified patents. In the case of a diversified patent, if fewer similarly classified TIs are included, the is measured to be high, even with fewer TIs and higher than in the case of patents with diversified technological knowledge.
4. Results
In this section, we confirm the hypotheses on the important characteristics of the technological advancement indicators based on empirical study results. Specifically, the empirical results illustrate the relationship between the innovation impact and the degree and the type of technological advancement, with a focus on the fields of alternative energy sources.
4.1. Descriptive Statistics
To examine the empirical results by focusing on the hypotheses, we briefly introduce the associations among the dependent variable (), the variables of interest (, , , and ), and the control variables. Table 4 presents the correlation coefficients between the variables.
Table 4.
Correlation coefficients of variables.
As shown in Table 4, was positively associated with (0.142), (0.198), (0.470), (0.323), (0.088), and (0.095) and negatively associated with (−0.100) and (−0.122).
The positive associations between and , , , , and had small values (<0.3). The weak associations reject hypothesis 1. However, the reliability of Hypotheses 1 and 2 should be determined based on the regression analysis results. Therefore, we provide significant proofs of Hypotheses 1 and 2 in Section 2.
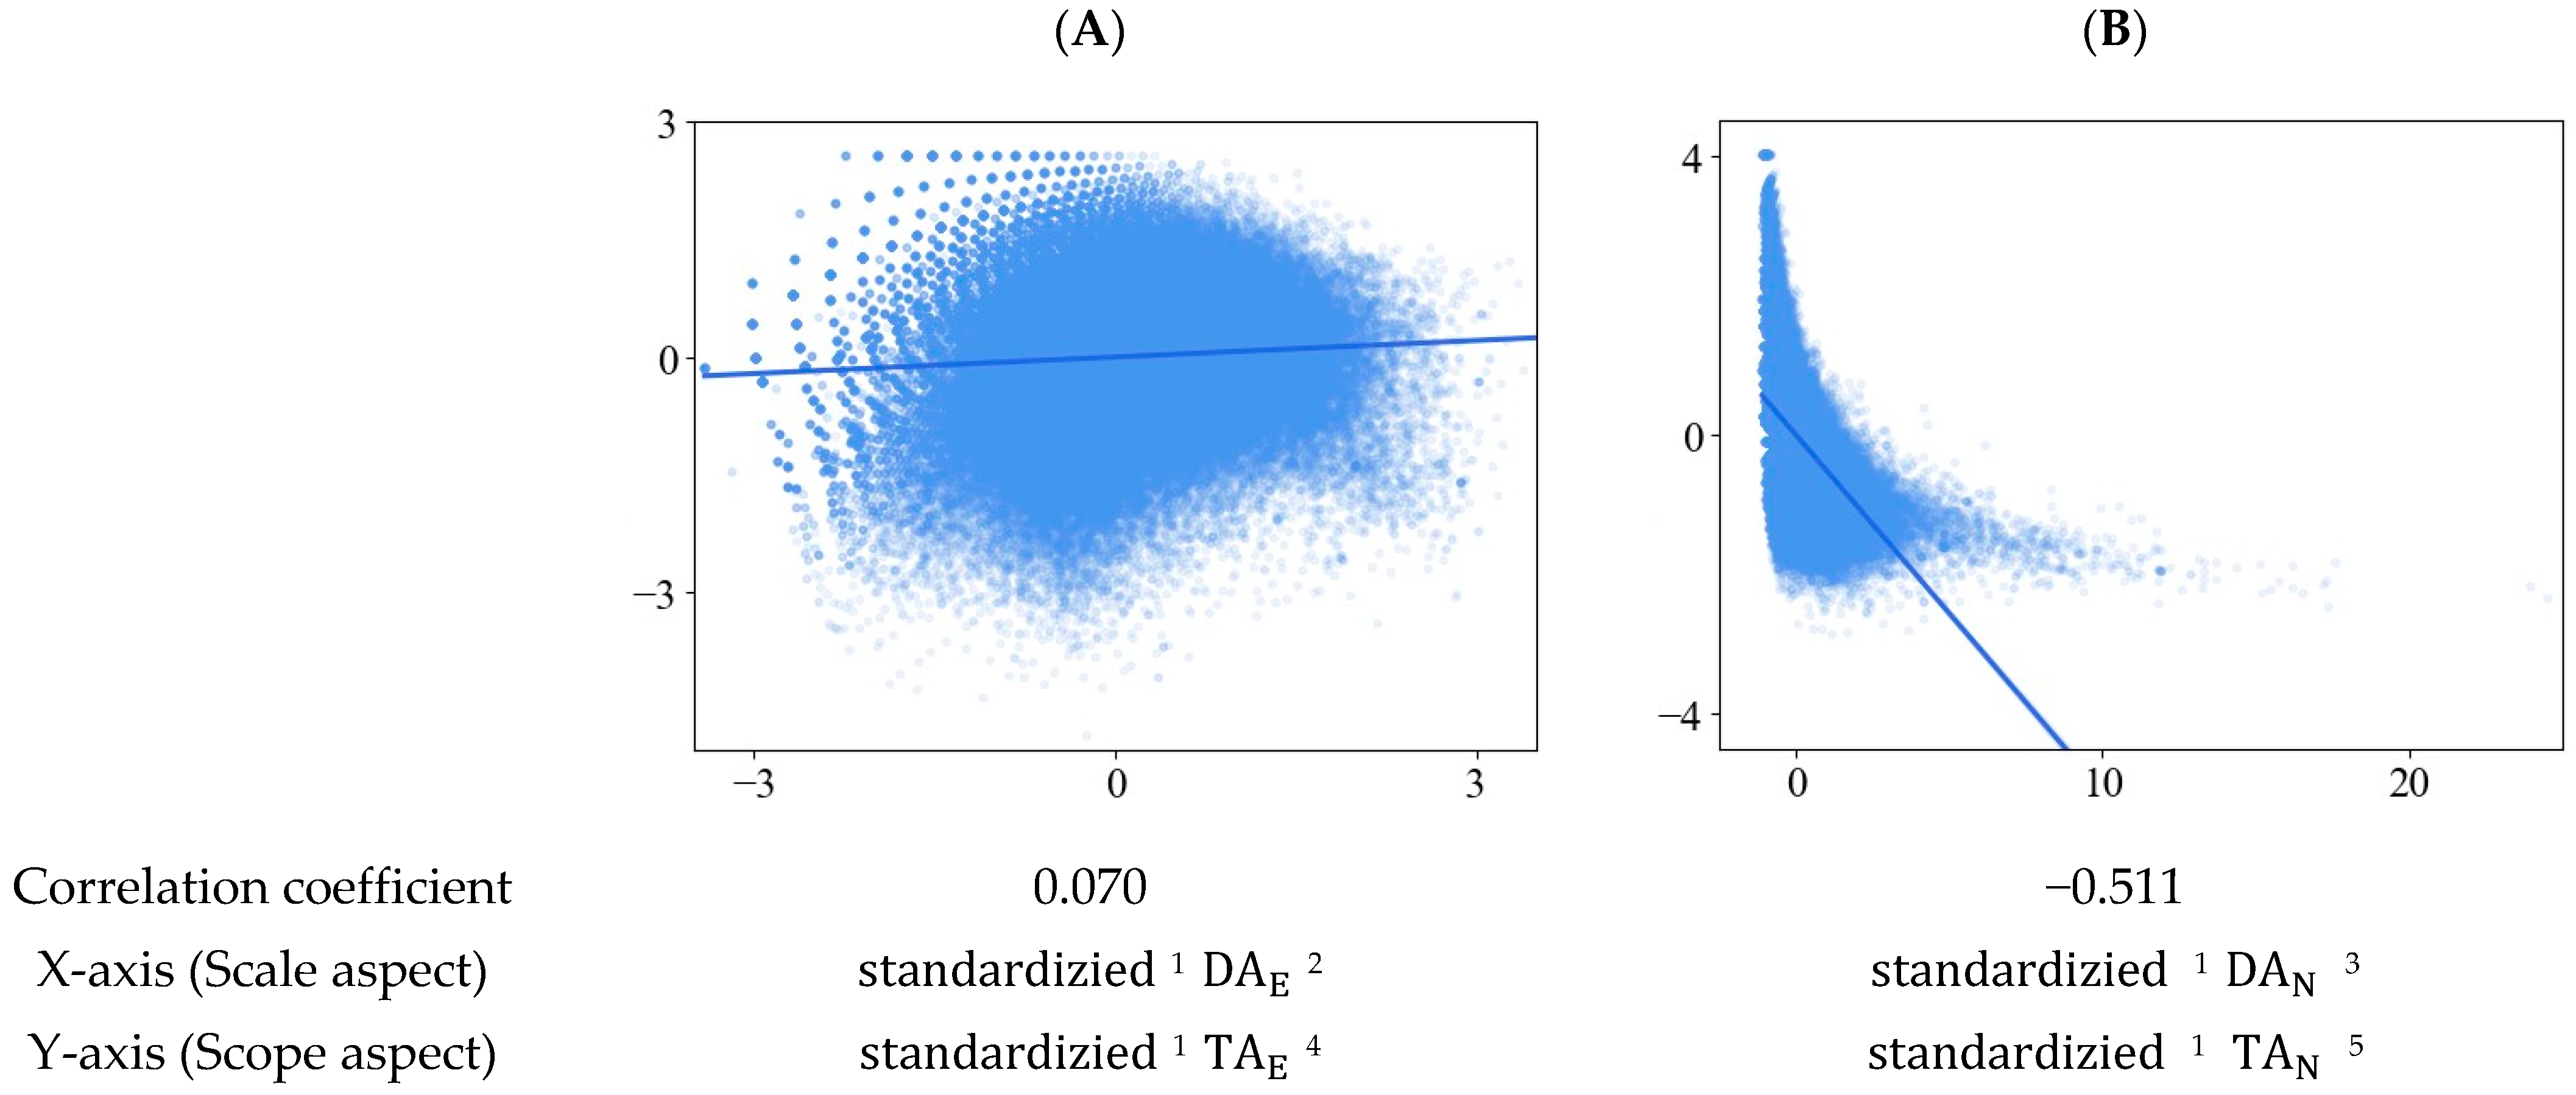
In Figure 3, the correlations between the degree and type of variables are notable. The coefficients of and were 0.07, whereas those of and were −0.511. As previously described, the degree and type of technological advancement must be uncorrelated. Figure 3 shows the correlation between the degree and type of technological advancement. Hypothesis 3 is supported when the variables are measured based on the Shannon IE.

Figure 3.
Scatter plots of the degree and type of technological advancement. Note: 1 all the variables represented in (A,B) are converted through z-score normalization, 2 : Shannon information entropy (IE) of technological classification index (TI), 3 : number of DTIs, 4 : variety index based on IE, and 5 : the ratio between the scope and scale of DTI.
4.2. Regression
In this subsection, we describe empirical results to test Hypotheses 1 and 2 by confirming the results of the regression analyses based on the model (Equation (4)) in Section 3.3.2. Therefore, empirical results that regress the innovation impact on the degree and type of technological advancement are highlighted.
Table 5 presents the results of the regression analysis. To compare the coefficients between the variables of interest, we standardized , , , and before performing the regression analyses. Thus, each coefficient of the standardized variables indicates changes in according to a unit standard deviation increase in the standardized variable.
Table 5.
Count parts of regression analyses based on the hurdle negative binomial model.
In Table 5, the results in columns (1), (3), and (5) are based on models that include and as variables of interest, whereas those in columns (2), (4), and (6) are based on models that include .
First, the scale and scope of technological knowledge variables, , , and , were found to be statistically significant in each column of Table 5. Therefore, Hypotheses 1 and 2 are supported, regardless of whether the degree variable is based on the Shannon IE of DTI or the number of DTIs. The impact of innovation in the fields of alternative energy sources is positively associated with the degree of technological advancement, which is represented by the scale of technological knowledge, and is negatively associated with the type of technological advancement, which is represented by the scope of technological knowledge. Therefore, the scale and scope of technological knowledge, which are based on the Shannon IE of DTI, meet the requirements for the indicator of technological advancement of Hypotheses 1 and 2.
In other words, the impact of innovation in the fields of alternative energy sources is greater if the degree of technological advancement is higher and the type of technological advancement is comparatively more specialized than others.
Moreover, in Table 5, the model fitness of regression analyses is always greater for the model with the variables of technological advancement based on the Shannon IE. Specifically, the maximum likelihood pseudo R2 of models (1), (3), and (5) are greater than models (2), (4), and (6), under the same conditions except for the variables of technological advancement. Moreover, the Akaike information criterion (AIC) and Bayesian information criterion (BIC) of models (1), (3), and (5) are lower than those of models (2), (4), and (6).
The binomial parts of the hurdle negative binomial regression analyses are presented in Appendix C.
In addition, as shown in Table 5, the coefficients of , , and are larger than those of the other coefficients. In particular, in column (5), the coefficient of is as large as 0.004 because , which indicates the number of backward citations, reflects both the degree of knowledge spillover and the number of related precedent patents. Therefore, simultaneously includes both the probability of forward citations following the invention of a broad range of innovation paths and forward citations due to high technological achievement leading to knowledge spillover. Moreover, , which indicates the number of family patents, is as large as 0.008 in column (5) because it represents the number of family patents and is highly proportional to the number of granted patent offices (or regions). Therefore, the probability of a forward citation can increase according to based on a broader granted location. In addition, was as large as 0.041 in column (5).
Therefore, and can have a significant association with and other variables of interest. However, an important difference between and compared to the other variables of interest is that they do not reflect the type of technological advancement. Therefore, other variables related to technological advancement cannot fully substitute for the variables of interest as indicators of technological advancement in this study because the variables suggested simultaneously describe the degree and type of technological advancement.
In the above, we presented results with the assumption of homogenous relationships between technological advancement variables and forward citation counts. However, as mentioned in the literature, innovation impact and technological advancement characteristics may be heterogeneous across industries. Therefore, we present results with the assumption that allows heterogeneity in the relationships between the technological advancement variables and the innovation impact by the alternative energy source. In Table 6, we suggest an empirical result based on the model, which includes interaction terms between technological advancement variables ( and ) and the alternative energy source dummy variables (, , , , , , and ).
Table 6.
Count parts of regression analyses based on the hurdle negative binomial model with interaction terms.
As shown in Table 6, the associations between the degree and type of technological advancement and innovation impact are 0.150 and −0.098, respectively. This also implies that patents of alternative energy sources basically tend to have a higher impact when the degree and type of technological advancement of patents is higher and more specialized. However, in the case of Wind, the expected impact of a patent can be greater than in other cases of alternative energy sources, the degree of technological advancement and all else being equal. This is because the coefficient of the interaction term of the degree of technological advancement and the dummy variable for patents related to wind energy show a positively significant value (0.120). Contrastingly, in the case of fuel cells, the expected impact of a patent can be smaller than in other cases of alternative energy sources. The coefficient of the interaction term of the degree of technological advancement and the dummy variable for fuel cells shows negative values (−0.069).
Moreover, the relationship between innovation impact and the type of technological advancement also appears to be heterogeneous. The coefficients of interaction terms between the type of technological advancement and the dummy variable for the classification of the alternative energy sources are significantly negative for the solar and hydro energy classifications (−0.075 and −0.080). However, the coefficients of interaction terms between the type of technological advancement and the dummy variable for the classification of the alternative energy sources are significantly positive for fuel cells and biofuel (0.057 and 0.104). Therefore, it seems that more diversified technological advancement of alternative energy patents leads to more innovation impact if the patents correspond to fuel cells and biofuel. Contrastingly, more specialized technological advancement of the alternative energy patents seems to have a greater innovation impact if the patents correspond to solar and hydro energy.
In the case of patents related to wind energy, the association between the expected impact of innovation and the degree of technological advancement is found to be at least 1.8 times and up to 3.3 times greater than patents of other fields of alternative energy sources. Moreover, in the case of solar and hydro energy, the association between the innovation impact and the type of technological advancements is found to be at least 1.8 times greater than for patents of harnessing energy from manmade waste and using waste heat.
To sum up, the impact of innovation in alternative energy patents is significantly influenced by both the degree and type of technological advancement, with higher and more specialized technological advancement generally leading to greater impact. However, the specific relationship varies depending on the alternative energy source. Wind energy patents benefit the most from a higher degree of technological advancement, while solar and hydro energy patents experience greater impact from more specialized technological advancement. In contrast, fuel-cell and biofuel patents see their impact amplified by more diversified technological advancement. Overall, the degree of technological advancement plays a more important role in wind energy patents. For the type of technological advancement, diversification is more impactful for fuel-cell and biofuel energy patents, while specialization is more impactful for solar and hydro energy patents.
The binomial parts of hurdle negative binomial regression analyses are presented in Appendix D.
5. Conclusions and Discussion
In this section, we discuss the implications of the suggested indicators based on the empirical results and the implications of the suggested measurement method based on the literature reviewed.
In Section 1 and its subsections, we discussed previous studies that utilized forward citation counts, which reflect the effects of knowledge spillover and the ever-changing environment when evaluating the technological achievement of patents. Furthermore, the forward citation counts do not seem to be concordant with the definition of technological advancement in the economic literature. Thus, using citation counts as a proxy for technological advancement has disadvantages. Accordingly, we argued that a new indicator is required that directly refers to technological knowledge in a patent and evaluates technological advancement based on information without including the effects of environmental changes. Moreover, we suggested the need for another indicator that reflects the scope of technological knowledge determined by the inventor’s strategic decision.
We formed three hypotheses on the appropriate characteristics of indicators of technological advancement in Section 2: “significant and positive relationship between the scale of technological knowledge and technological value (citation counts)” and “significant and positive (or negative) relationship between the scope of technological knowledge and technological value (citation counts).”
Section 4 describes the testing of these three hypotheses, which revealed that the degree and type of indicators based on Shannon IE and DTI have appropriate characteristics for evaluating technological advancement. In particular, these two indicators properly describe the degree and type of technological advancement. Because these indicators significantly predict the forward citation counts of a patent and are mutually uncorrelated, more informativeness (more knowledge) and specialization (less variety) induce more knowledge spillovers when other things are equal at the patent level. Moreover, models using the proposed two indicators, and , show better prediction fitness performance than other models using and .
Moreover, two indicators had invariable information characteristics since the invention was completed. Therefore, this study suggests the possibility of future studies attempting to determine the environmental effect that occurs after the completion of an invention (after application) on the patent’s value. The impact of environmental changes on a patent’s value can also be captured by examining the effect of interactions between two indicators (the scale and scope of technological knowledge) and environmental change, such as the number of follow-up inventions and the number of complementary or substitutive inventions in the future.
The analysis in Table 5 and Table 6 reveals noteworthy patterns in the relationship between technological advancement and innovation impact within the realm of alternative energy sources. The findings suggest that, on a general level, alternative energy patents tend to exhibit a higher impact when they are more technologically advanced and specialized. Notably, distinctions arise among different energy sources when the degree of technological advancement and effect from the other conditions are equal, with wind energy patents potentially yielding a greater expected impact, while biofuel patents may have a comparatively smaller impact. The observed heterogeneity in the relationship between innovation impact and the type of technological advancement underscores the influence of technological diversification and specialization. Specifically, a more diversified technological advancement in fuel-cell and biofuel patents appears conducive to a greater innovation impact, whereas the more specialized technological advancements in solar and hydro energy patents seem to be associated with a more substantial impact. These insights contribute to a nuanced understanding of strategic management of technological advancements in the alternative energy sector. In summary, this study suggests a new measurement method for technological knowledge indicators that describes the degree and type of technological advancement. These indicators require two appropriate properties that are useful for predicting technological value and are not correlated with each other. The results empirically prove that the suggested indicators meet the appropriate properties of the technological advancement indicators when calculated using Shannon IE and DTI. Moreover, the measurement method used in this study is advantageous because it can be easily transformed into a technological advancement indicator of a higher level by taking the average of a firm or country.
Conclusively, driven by the urgency of environmental concerns, transitioning to alternative energy sources stands as a pivotal necessity for achieving sustainable development. Addressing these concerns through proactive energy transformation demands overcoming technological hurdles with utmost haste. Recognizing this, our study delved deeply into exploring technological advancement strategies within different alternative energy sectors, with a laser focus on maximizing the expected impact of innovation. Our findings unveil the heterogeneity of optimal approaches across energy sources. We argue that there is a crucial need for tailored support policies within each sector.
In addition, we speculate on the reasons why effective technological advancement strategies may differ across alternative energy technology fields: during our sample period, best practices in how Bio and Fuel are utilized as energy sources for practical applications had not been established, and we speculate that a diversification of the technological advancement would therefore lead to higher innovative impacts. On the other hand, for energy sources such as Wind and Solar, the best practices of how they can be used as energy sources for practical applications are mature, and therefore, technological advancement in the form of specialization to improve productivity or efficiency is more likely to be required than the exploration of new practical applications. Therefore, for a more effective transition to alternative energy, policies for the technological advancement of alternative energy sources should prioritize the exploration of practical applications of energy sources and support the specialization phase to maximize productivity and efficiency after the practical applications of the alternative energy sources have been established.
However, our methodology, which relies on patent data, has limitations. First, it restricts the assessment of technological advancement in areas with fewer patents. Second, it overlooks innovation impacts and outcomes unrelated to patent activity. Lastly, our analyses exclude exploring regional differences in innovation paradigms within alternative energy technologies. Therefore, future research could explore the relationship between innovation impact and technological advancement for less-patented alternative energy technologies, potentially measured by economic value. Investigating regional differences in innovation paradigms for alternative energy sources would be a further area of valuable inquiry.
Author Contributions
Conceptualization, J.-H.K.; Methodology, J.-H.K.; Software, J.-H.K.; Validation, Y.-G.L.; Formal analysis, J.-H.K.; Investigation, Y.-G.L.; Resources, Y.-G.L.; Data curation, J.-H.K. and Y.-G.L.; Writing—original draft, J.-H.K.; Writing—review & editing, Y.-G.L. All authors have read and agreed to the published version of the manuscript.
Funding
This research was funded by Inha University [70394].
Institutional Review Board Statement
Not applicable.
Informed Consent Statement
Not applicable.
Data Availability Statement
Data are available upon request.
Conflicts of Interest
The authors declare no conflicts of interest.
Appendix A
Table A1.
Number of patents by the technological field of the alternative energy source.
Table A1.
Number of patents by the technological field of the alternative energy source.
| Fields | Number of Patents |
|---|---|
| Solar energy | 61,967 |
| Biofuels | 23,894 |
| Fuel cells | 14,996 |
| Wind energy | 6367 |
| Harnessing energy from manmade waste | 6093 |
| Using waste heat | 4662 |
| Geothermal energy | 3120 |
| Hydro energy | 2150 |
| Other production or use of heat, not derived from combustion | 1922 |
| Pyrolysis or gasification of biomass | 1522 |
| Integrated gasification combined cycle (IGCC) | 915 |
| Ocean thermal energy conversion | 49 |
| Devices for producing mechanical power from muscle energy | 48 |
| Total | 127,705 |
Appendix B

Figure A1.
Distribution of variables of interest. Note: 1 : Shannon information entropy (IE) of technological classification index (TI), 2 : number of TIs, 3 : variety index based on IE, and 4 : ratio between the scope and scale of TI.
Figure A1.
Distribution of variables of interest. Note: 1 : Shannon information entropy (IE) of technological classification index (TI), 2 : number of TIs, 3 : variety index based on IE, and 4 : ratio between the scope and scale of TI.
Appendix C
Table A2.
The binomial part of regression analyses using the hurdle negative binomial model.
Table A2.
The binomial part of regression analyses using the hurdle negative binomial model.
| Dependent Variable: Forward Citation Counts ( 1) for the First Five Years | |||||||
|---|---|---|---|---|---|---|---|
| Model | (1) | (2) | (3) | (4) | (5) | (6) | |
| Category | Variable | Coefficient | |||||
| Technological advancement | 2 | 0.439 *** (0.009) | 0.286 *** (0.009) | 0.233 *** (0.011) | |||
| 3 | 0.624 *** (0.018) | 0.377 *** (0.018) | 0.302 *** (0.019) | ||||
| 4 | −0.309 *** (0.009) | −0.194 *** (0.009) | −0.151 *** (0.010) | ||||
| 5 | −0.118 *** (0.010) | −0.076 *** (0.010) | −0.051 *** (0.011) | ||||
| Invention Research team | BCC 6 | - | - | 0.056 *** (0.001) | 0.059 *** (0.001) | 0.031 *** (0.001) | 0.031 *** (0.001) |
| FAM 7 | - | - | 0.062 *** (0.003) | 0.062 *** (0.003) | −0.003 ** (0.001) | −0.003 *** (0.001) | |
| INV 8 | - | - | 0.063 *** (0.006) | 0.064 *** (0.006) | −0.005 (0.008) | −0.004 (0.008) | |
| ASS 9 | - | - | 0.007 (0.005) | 0.005 * (0.005) | 0.047 *** (0.006) | 0.047 *** (0.006) | |
| Technology field | A 10 | x | √ | ||||
| T 11 | x | √ | |||||
| Geographic feature | U 12 | x | √ | ||||
| L 13 | x | √ | |||||
| Application year | Y 14 | x | √ | ||||
| Number of observations | 101,556 | 101,556 | 101,556 | 101,556 | 101,556 | 101,556 | |
| Degree of freedom | 7 | 7 | 15 | 15 | 197 | 197 | |
| Maximum likelihood pseudo R2 | 0.087 | 0.079 | 0.226 | 0.220 | 0.330 | 0.327 | |
| Log-Likelihood | −307,600 | −308,000 | −299,200 | −299,600 | −291,900 | −292,100 | |
| Akaike information criterion | 615,263 | 616,067 | 598,432 | 599,143 | 584,139 | 584,557 | |
| Bayesian information criterion | 615,330 | 616,134 | 598,575 | 599,286 | 586,016 | 586,434 | |
Note: maximum log-likelihood estimations, standard errors in parentheses. *** p < 0.01, ** p < 0.05, and * p < 0.1. 1 FCC: cumulative forward citation counts since application, 2 : Shannon information entropy (IE) of technological classification index (TI), 3 : number of DTI, 4 : variety index based on IE, 5 : the ratio between the scope and scale of DTI, 6 BCC: the number of backward citations of patents, 7 FAM: the number of family patents, 8 INV: the number of inventors, and 9 ASS: the number of co-assignees, 10 A: a vector of dummy variables for the alternative energy sources, 11 T: a vector of dummy variables for the major technological field, and 12 U: a vector of dummy variables for the main locations of patent offices of backward citations, 13 L: dummy variables for the location of patent publication, 14 Y: dummy variables for the application year.
Appendix D
Table A3.
The binomial part of regression analyses using the hurdle negative binomial model with interaction terms.
Table A3.
The binomial part of regression analyses using the hurdle negative binomial model with interaction terms.
| Dependent Variable: Forward Citation Counts ( 1) for the First Five Years | ||
|---|---|---|
| Model | (1) | |
| Category | Variable | Coefficient |
| Technological advancement | 2 | 0.199 *** (0.060) |
| 3 | −0.057 (0.061) | |
| Interaction terms of the degree of technological advancement and dummy variables for the alternative energy source | 0.054 (0.061) | |
| 0.154 * (0.088) | ||
| 0.049 (0.071) | ||
| −0.003 (0.100) | ||
| −0.056 (0.064) | ||
| −0.093 (0.062) | ||
| −0.200 ** (0.087) | ||
| Interaction terms of the type of technological advancement and dummy variables for the alternative energy source | 0.061 (0.067) | |
| −0.048 (0.097) | ||
| −0.106 (0.065) | ||
| 0.030 *** (0.001) | ||
| −0.003 ** (0.001) | ||
| −0.004 (0.008) | ||
| 0.047 *** (0.006) | ||
| Invention | BCC 4 | 0.004 *** (0.000) |
| FAM 5 | 0.008 *** (0.000) | |
| INV 6 | −0.002 (0.003) | |
| ASS 7 | 0.042 *** (0.002) | |
| Type of Alternative energy source | A 8 | √ |
| Technology field | T 9 | √ |
| Main location of prior inventions | U 10 | √ |
| Publication locations | L 11 | √ |
| Application year | Y 12 | √ |
| Number of observations | 101,556 | |
| Degree of freedom | 225 | |
| Maximum likelihood pseudo R2 | 0.332 | |
| Log-Likelihood | −291,800 | |
| Akaike information criterion | 583,981 | |
| Bayesian information criterion | 586,125 | |
Note: maximum log-likelihood estimations, standard errors in parentheses. *** p < 0.01, ** p < 0.05, and * p < 0.1. 1 FCC: cumulative forward citation counts since application, 2 : Shannon information entropy (IE) of technological classification index (TI), 3 : variety index based on IE, 4 BCC: the number of backward citations of patents, 5 FAM: the number of family patents, 6 INV: the number of inventors, and 7 ASS: the number of co-assignees, 8 A: a vector of dummy variables for the alternative energy sources, 9 T: a vector of dummy variables for the major technological field, and 10 U: a vector of dummy variables for the main locations of patent offices of backward citations, 11 L: dummy variables for the location of patent publication, 12 Y: dummy variables for the application year.
References
- Chen, J.; Yin, X.; Mei, L. Holistic innovation: An emerging innovation paradigm. Int. J. Innov. Stud. 2018, 2, 1–13. [Google Scholar] [CrossRef]
- Pavitt, K.; Robson, M.; Townsend, J. Technological accumulation, diversification and organisation in UK companies, 1945–1983. Manag. Sci. 1989, 35, 81–99. [Google Scholar] [CrossRef]
- Kim, J.H.; Lee, Y.G. Factors of Collaboration Affecting the Performance of Alternative Energy Patents in South Korea from 2010 to 2017. Sustainability 2021, 13, 10208. [Google Scholar] [CrossRef]
- Lee, Y.-G.; Lee, J.-D.; Song, Y.-I.; Lee, S.-J. An in-depth empirical analysis of patent citation counts using zero-inflated count data model: The case of KIST. Scientometrics 2007, 70, 27–39. [Google Scholar] [CrossRef]
- Appio, F.P.; Baglieri, D.; Cesaroni, F.; Spicuzza, L.; Donato, A. Patent design strategies: Empirical evidence from European patents. Technol. Forecast. Soc. Chang. 2022, 181, 121776. [Google Scholar] [CrossRef]
- Rahim, S.; Murshed, M.; Umarbeyli, S.; Kirikkaleli, D.; Ahmad, M.; Tufail, M.; Wahab, S. Do natural resources abundance and human capital development promote economic growth? A study on the resource curse hypothesis in Next Eleven countries. Resour. Environ. Sustain. 2021, 4, 100018. [Google Scholar] [CrossRef]
- Ullah, S.; Luo, R.; Nadeem, M.; Cifuentes-Faura, J. Advancing sustainable growth and energy transition in the United States through the lens of green energy innovations, natural resources and environmental policy. Resour. Policy 2023, 85, 103848. [Google Scholar] [CrossRef]
- Xie, X.; Hoang, T.T.; Zhu, Q. Green process innovation and financial performance: The role of green social capital and customers’ tacit green needs. J. Innov. Knowl. 2022, 7, 100165. [Google Scholar] [CrossRef]
- Wei, S.; Jiandong, W.; Saleem, H. The impact of renewable energy transition, green growth, green trade and green innovation on environmental quality: Evidence from top 10 green future countries. Front. Environ. Sci. 2023, 10, 1076859. [Google Scholar] [CrossRef]
- León, L.R.; Bergquist, K.; Wunsch-Vincent, S.; Xu, N.; Fushimi, K. Measuring Innovation in Energy Technologies: Green Patents as Captured by WIPO’s IPC Green Inventory; Economic Research Working Paper; WIPO: Geneva, Switzerland, 2018; Volume 44. [Google Scholar]
- WIPO IPC Green Inventory. Available online: https://www.wipo.int/classifications/ipc/green-inventory/home (accessed on 7 February 2021).
- Ghisetti, C.; Quatraro, F. Green technologies and environmental productivity: A cross-sectoral analysis of direct and indirect effects in Italian regions. Ecol. Econ. 2017, 132, 1–13. [Google Scholar] [CrossRef]
- Cecere, G.; Mancinelli, S.; Mazzanti, M. Waste prevention and social preferences: The role of intrinsic and extrinsic motivations. Ecol. Econ. 2014, 107, 163–176. [Google Scholar] [CrossRef]
- Lee, Y.-G. What affects a patent’s value? An analysis of variables that affect technological, direct economic, and indirect economic value: An exploratory conceptual approach. Scientometrics 2009, 79, 623–633. [Google Scholar] [CrossRef]
- Jaffe, A.B.; Trajtenberg, M.; Henderson, R. Geographic localization of knowledge spillovers as evidenced by patent citations. Q. J. Econ. 1993, 108, 577–598. [Google Scholar] [CrossRef]
- Lee, Y.-G. Patent licensability and life: A study of US patents registered by South Korean public research institutes. Scientometrics 2008, 75, 463–471. [Google Scholar] [CrossRef]
- Lanjouw, J.O.; Pakes, A.; Putnam, J. How to count patents and value intellectual property: The uses of patent renewal and application data. J. Ind. Econ. 1998, 46, 405–432. [Google Scholar] [CrossRef]
- Hall, B.H.; Jaffe, A.; Trajtenberg, M. Market value and patent citations. RAND J. Econ. 2005, 36, 16–38. [Google Scholar]
- Harhoff, D.; Narin, F.; Scherer, F.M.; Vopel, K. Citation frequency and the value of patented inventions. Rev. Econ. Stat. 1999, 81, 511–515. [Google Scholar] [CrossRef]
- Hirshleifer, D.; Hsu, P.-H.; Li, D. Innovative originality, profitability, and stock returns. Rev. Financ. Stud. 2018, 31, 2553–2605. [Google Scholar] [CrossRef]
- Kang, T.; Maliphol, S.; Kogler, D.F.; Kim, K. Regional Knowledge Capabilities, Entrepreneurial Activity, and Productivity Growth: Evidence from Italian NUTS-3 Regions. Int. Reg. Sci. Rev. 2022, 45, 293–320. [Google Scholar] [CrossRef]
- Malerba, F.; Mancusi, M.L.; Montobbio, F. Innovation, international R&D spillovers and the sectoral heterogeneity of knowledge flows. Rev. World Econ. 2013, 149, 697–722. [Google Scholar]
- Trajtenberg, M. A penny for your quotes: Patent citations and the value of innovations. RAND J. Econ. 1990, 21, 172–187. [Google Scholar] [CrossRef]
- Chen, J.; Jang, S.-L.; Wen, S. Measuring technological diversification: Identifying the effects of patent scale and patent scope. Scientometrics 2010, 84, 265–275. [Google Scholar] [CrossRef]
- Garcia-Vega, M. Does technological diversification promote innovation?: An empirical analysis for European firms. Res. Policy 2006, 35, 230–246. [Google Scholar] [CrossRef]
- Kogler, D.F.; Rigby, D.L.; Tucker, I. Mapping knowledge space and technological relatedness in US cities. Eur. Plan. Stud. 2013, 21, 1374–1391. [Google Scholar] [CrossRef]
- Goto, A.; Suzuki, K. R & D capital, rate of return on R & D investment and spillover of R & D in Japanese manufacturing industries. Rev. Econ. Stat. 1989, 71, 555–564. [Google Scholar]
- Romer, P.M. Endogenous technological change. J. Political Econ. 1990, 98 Pt 2, S71–S102. [Google Scholar] [CrossRef]
- Kwon, S.; Porter, A.; Youtie, J. Navigating the innovation trajectories of technology by combining specialization score analyses for publications and patents: Graphene and nano-enabled drug delivery. Scientometrics 2016, 106, 1057–1071. [Google Scholar] [CrossRef]
- Rivera-Batiz, L.A.; Romer, P.M. International trade with endogenous technological change. Eur. Econ. Rev. 1991, 35, 971–1001. [Google Scholar] [CrossRef]
- Solow, R.M. Technical change and the aggregate production function. Rev. Econ. Stat. 1957, 39, 312–320. [Google Scholar] [CrossRef]
- Chandler, A.D.; Hikino, T.; Chandler, A.D. Scale and Scope: The Dynamics of Industrial Capitalism; Harvard University Press: Cambridge, MA, USA, 2009; Volume 1, pp. 1–45. [Google Scholar]
- Dosi, G. Sources, procedures, and microeconomic effects of innovation. J. Econ. Lit. 1988, 26, 1120–1171. [Google Scholar]
- Kaulich, F. Diversification vs. Specialization as Alternative Strategies for Economic Development: Can We Settle a Debate by Looking at the Empirical Evidence? United Nations Industrial Development Organization (UNIDO): Vienna, Austria, 2012; pp. 1–51. [Google Scholar]
- KIPRIS. Available online: http://www.kipris.or.kr/khome/main.jsp (accessed on 18 May 2020).
- Google Patents. Available online: https://patents.google.com/ (accessed on 16 July 2021).
- Shannon, C.E. A mathematical theory of communication. Bell Syst. Tech. J. 1948, 27, 379–423. [Google Scholar] [CrossRef]
- Adams, J.D.; Black, G.C.; Clemmons, J.R.; Stephan, P.E. Scientific teams and institutional collaborations: Evidence from US universities, 1981–1999. Res. Policy 2005, 34, 259–285. [Google Scholar] [CrossRef]
- Gardner, W.; Mulvey, E.P.; Shaw, E.C. Regression analyses of counts and rates: Poisson, overdispersed Poisson, and negative binomial models. Psychol. Bull. 1995, 118, 392. [Google Scholar] [CrossRef]
- Baccini, A.; Barabesi, L.; Cioni, M.; Pisani, C. Crossing the hurdle: The determinants of individual scientific performance. Scientometrics 2014, 101, 2035–2062. [Google Scholar] [CrossRef]
- R: A Language and Environment for Statistical Computing. Available online: https://www.r-project.org (accessed on 5 November 2023).
- Zeileis, A.; Kleiber, C.; Jackman, S. Regression models for count data in R. J. Stat. Softw. 2008, 27, 1–25. [Google Scholar] [CrossRef]
Disclaimer/Publisher’s Note: The statements, opinions and data contained in all publications are solely those of the individual author(s) and contributor(s) and not of MDPI and/or the editor(s). MDPI and/or the editor(s) disclaim responsibility for any injury to people or property resulting from any ideas, methods, instructions or products referred to in the content. |
© 2024 by the authors. Licensee MDPI, Basel, Switzerland. This article is an open access article distributed under the terms and conditions of the Creative Commons Attribution (CC BY) license (https://creativecommons.org/licenses/by/4.0/).