Article

Identifying Optimally Sustainable Foods: A Four-Dimensional Analysis of Sustainable Foods in the American Diet

Department of Nutrition and Exercise Physiology, Elson S. Floyd College of Medicine, Washington State University, Spokane, WA 99202, USA
*
Author to whom correspondence should be addressed.
Sustainability 2024, 16(2), 551; https://doi.org/10.3390/su16020551
Submission received: 6 December 2023 / Revised: 29 December 2023 / Accepted: 3 January 2024 / Published: 9 January 2024
(This article belongs to the Section Sustainable Food)

Abstract

:
A holistic understanding of food sustainability is vital for making socially and environmentally conscious food choices. Sustainable diets have been defined by four dimensions: health, economics, environment, and society. The purpose of this study was to determine how metrics for nutritional quality, monetary cost, environmental impact, and social and cultural acceptability of foods and beverages vary across and within food groups and to identify which foods and beverages are optimally sustainable according to these metrics. Data from the Food and Nutrient Database for Dietary Studies (FNDDS) was linked with frequency of consumption, nutrient density, environmental impact, and cost data from publicly available databases. A sustainability index, based on the four dimensions, was developed to quantify overall sustainability. Nutrient density was correlated negatively with environmental impact and frequency of consumption but positively with cost (p < 0.001). Out of 5964 items, 165 were identified as optimally sustainable. Sustainability index scores varied within each food group. Less than 1% of optimally sustainable items were Dairy products, while 62% were Protein Foods—of which 92% were Plant Proteins. Few foods and beverages met the criteria to be considered optimally sustainable. However, Plant Protein foods may generally strike the best balance among these four indicators of sustainability. A holistic understanding of food sustainability is necessary to facilitate nutritious and environmentally conscious dietary choices that adhere to other needs, personal values, and preferences.

1. Introduction

Diet plays a significant role as a modifiable lifestyle behavior in the prevention and management of many chronic diseases [1,2]. With the prevalence of chronic diseases being higher among populations with lower socioeconomic status [3,4,5], it is particularly important that health-promoting diets are accessible and affordable.
Food patterns recommended by the Dietary Guidelines for Americans (DGA)—while more nutritious than current or typical diets—also tend to be more expensive than the typical American food pattern [6]. While federal food assistance programs, such as the Supplemental Nutrition Assistance Program (SNAP), exist to improve access to and consumption of healthy foods, they may still be insufficient for incentivizing consumer food choices to better align with dietary guidance [7]. Therefore, to make more appropriate nutritional recommendations for all populations, it is important not only to provide nutrition education but also to address the social and economic issues that impact access to healthy foods and food choices.
Another pressing issue related to diet and nutrition is the environmental impact of consumer food choices. The global food system is dependent upon natural resources yet is also a major driving factor for negative environmental impacts [8,9,10,11,12,13,14]. Globally, the food system accounts for 34% of all human-related greenhouse gas emissions, 20% of total land use, and 72% of surface and groundwater withdrawals, thus contributing to the degradation and depletion of natural resources [10,13]. In response to this ongoing issue, there has been an increase in the demand for goods with lower environmental impact [15,16]. Over half of Americans understand that their food choices have an impact on the environment and approximately 40% claim that environmental impact is a factor in their purchase decisions [15]. However, other drivers, like food prices, still exert a greater influence on most consumers, highlighting the need to identify options that minimize environmental impacts while remaining affordable [15].

Sustainable Foods

The concept of sustainable diets is not new; however, there is no consensus on its definition. Many use the term “sustainable” to refer solely to environmental sustainability, but its meaning can extend to a more holistic perspective. Based on the definition of sustainable diets from the Food and Agriculture Organization (FAO), the 2016 Chicago Consensus on Sustainable Food Systems Science (Chicago Consensus) proposed that sustainable diets consist of four dimensions: health, economics, environment, and society [12,17]. According to these parameters, sustainable diets should not only maximize nutritional quality and minimize environmental impact and cost but also be adaptable to diverse dietary patterns, ensuring inclusivity of social and cultural characteristics of food choices.
Many studies have analyzed two dimensions of sustainable diets [6,18,19,20,21,22,23,24], with fewer studies including three [25,26,27,28,29] and even fewer measuring all four [30,31]. It is key to consider that the amount of greenhouse gas emissions is often the only measurement of environmental impact explored in these studies [19,20,27,28,30,31]. Although greenhouse gas emissions are a major contributor to the environmental crisis and should be monitored [10,12,13,14], other vital natural resources, such as water and soil, are also affected [8,11,12,13,14] but are not captured by these analyses. Similarly, the social and cultural acceptability dimension of sustainable diets has not been thoroughly examined. Diets that are optimal for nutrition, cost, and environmental impact can differ drastically from the typical diet, indicating that the optimized diet may not be well-received by the general population [26]. Studies that did include a social aspect of diet choice used typical, self-selected dietary patterns as standards to represent socially and culturally acceptable diets in the area, but no objective measurement was used [22,26,30,31].
Proper nutrition is inarguably vital to sustaining good health. However, the desire and ability to consume healthy foods depends not only on nutritional content but also on cost, values—such as environmental impact—and how well those foods can fit into a person’s dietary preferences. Therefore, the purpose of this study was to determine how scores for nutritional quality, monetary cost, environmental impact, and social and cultural acceptability of foods and beverages vary across and within food groups and to identify which foods and beverages are optimally sustainable according to these metrics.

2. Materials and Methods

2.1. Food and Nutrient Data

The Food and Nutrient Database for Dietary Studies (FNDDS) is a corresponding database to What We Eat in America (WWEIA), the dietary component of NHANES. The FNDDS provides detailed information on the nutrient profiles and recipes for specific foods and beverages from WWEIA to aid dietary surveillance and research [32]. The Food Patterns Equivalents Database (FPED) converts the foods and beverages in FNDDS into USDA Food Patterns components, measured as cup equivalents for fruit, vegetables, and dairy; ounce equivalents of grains and proteins; teaspoon equivalents of added sugars; gram equivalents of solid fats and oils, and the total number of alcoholic drinks [33].
The present study used data from the 2015–2016 cycle of FNDDS and FPED to be consistent with the WWEIA cycle used to estimate cost data and due to the availability of environmental impact information. Data for food prices were estimated by the USDA using a list of products derived from the 2015–2016 WWEIA survey. Further details about the price estimations are provided below in the monetary cost methodology. Additionally, comprehensive analyses of the environmental impact of foods are limited; therefore, in order to use the most current data while also maintaining temporal consistency between data sources, FNDDS and FPED data from 2015 to 2016 were used.
Data obtained from WWEIA included a complete list of the individual food and beverage items with associated unique identifier codes that correspond to FNDDS and a count of the total number of times each item was reported to be consumed on the first and second days of the 24-h dietary recalls. Among the datasets available from FNDDS are the list of the foods and beverages with associated codes, a dataset containing the gram weights of various portion amounts of each item, and a dataset describing the content of calories and 64 nutrients per 100 g of edible portion for each item. Data from FPED includes the unit equivalents of each food pattern group, including added sugars, per 100 g of each FNDDS item. Data for foods and beverages intended for infants and toddlers, as well as alcoholic beverages, nutritional powders, and foods categorized as “mixed dishes”, were removed for this study. Data for the indicators of sustainability are described later.

2.2. Food Groups

Food groups are composed differently in the FNDDS and DGA. Therefore, for this analysis, food and beverage items were aggregated into five food groups based on the USDA MyPlate food groups, which serve as a dietary recommendation for food group portions based on the DGA [34]. The five food groups were Fruit, including processed fruit (frozen, canned, dried, etc.) and 100% fruit juice; Vegetables, including processed vegetables (frozen, canned, dried, etc.), 100% vegetable juice, and potatoes, but excluding plant proteins; Grains and Snacks, including bread, rice, cereals, pasta, tortillas, and popcorn; Protein Foods, including both animal and plant protein products; and Dairy, including milk, yogurt, cheese, and dairy alternatives. FNDDS contains items that did not align with one of the MyPlate food groups, so four additional groups were created based on the FNDDS food groups for Beverages, Fats and Oils, Condiments and Sauces, and Desserts and Sugars to encompass all FNDDS items.

2.3. Indicators of Nutrient Density, Environmental Impact, Monetary Cost, and Social and Cultural Acceptability

The following sections describe the indicators used to assess the four dimensions of sustainable diets—nutrition, environmental impact, cost, and social and cultural acceptability.

2.3.1. Nutrient Density

The Nutrient Rich Foods Index 9.3 (NRF 9.3) is a validated, objective measurement of nutrient density based on nine nutrients that are encouraged in the diet—protein, fiber, vitamin A, vitamin C, vitamin E, calcium, iron, potassium, and magnesium—and three nutrients that should be limited in the diet—sodium, saturated fat, and added sugar [35,36]. It is calculated on a 100-kilocalorie basis and is determined by the percentage of daily values (DV) of each nutrient to encourage and the percentage of maximum recommended values (MRV) for each nutrient to limit within a food item [36]. A higher NRF 9.3 score indicates higher nutrient density. Negative scores are possible if the item contains little of the nutrients to encourage and a relatively larger amount of nutrients to limit. Nutritional data for calculating the NRF 9.3 were obtained from the FNDDS dataset on nutrient values per 100 g (all nutrients to encourage, sodium, and saturated fat) for each item and from the FPED dataset (added sugar).
Equation (1) below details how the NRF 9.3 score per 100 kilocalories was determined.
NRF 9.3 per 100 kilocalories:
i = 1 9 ( N u t r i e n t i D V i E n e r g y ) i = 1 3 ( L i M R V i E n e r g y )
where Nutrienti is the amount of nutrient to encourage i in 100 g of the food item; DVi is the daily value amount for nutrient i; Energy is the number of calories in 100 g of the food item; Li is the amount of nutrient to limit i in 100 g of the food item; and MRVi is the maximum recommended value for the nutrient to limit i.

2.3.2. Environmental Impact

Environmental impact values were obtained from data published by Poore and Nemecek [8]. The environmental impact assessment considered five factors: land use (in squared meters), greenhouse gas emissions (in kilograms of carbon dioxide equivalents), acidifying emissions (in grams of sulfur dioxide equivalents), eutrophying emissions (in grams of phosphate equivalents), and stress-weighted water use (in liters). These factors were reported for 43 food categories, covering approximately 90% of global protein and calorie consumption. The FNDDS foods and beverages were linked to one of these 43 food categories to result in an estimated environmental impact. A composite score for the environmental impacts was calculated such that each of the factors received an equal weight. The five environmental impact factors were first normalized via min-max scaling so that all values ranged from 0 to 1, with 1 representing the highest impact within each factor. Then, the average of the normalized impacts for each FNDDS item was calculated. Finally, the average values were scaled up by a factor of 100 to better distinguish differences. The resulting values were the composite scores for environmental impact.

2.3.3. Monetary Cost

Prices in USD were retrieved from the USDA Purchase to Plate Suite (PP-Suite) data. The USDA produces a Thrifty Food Plan (TFP), which is developed to aid consumers in making decisions about purchasing more nutritious foods and beverages on a limited budget [37]. The Purchase to Plate data, accessible through the PP-Suite online [38], corresponds to the year cycles used by NHANES. As such, it is updated every two years and includes the estimated price per 100 g for 3231 items from the 2015–2016 FNDDS in as-consumed form [38]. FNDDS items were matched to the price corresponding to the same or least specific item in the same food group in the PP-Suite database. Cost per 100 g was converted to cost per 100 kilocalories using the FNDDS data containing the number of kilocalories per 100 g for each FNDDS item.

2.3.4. Social and Cultural Acceptability

Currently, there is no objective measurement of the social and cultural acceptability of diets or foods. However, the frequency by which foods are consumed may yield insights into their acceptability or preference within a given population [39]. The National Health and Nutrition Examination Survey (NHANES) is administered to a representative sample of individuals in the US and, via 24-h recalls, records dietary habits, including the total count of how many times a food was reported on a given day. The frequency of consumption data from this survey may provide a reasonable proxy for the social and cultural acceptability of foods in the US.
Social and cultural acceptability was quantified using the frequency of consumption as a proxy. This study assumes that foods and beverages self-selected by a representative sample of Americans are, therefore, representative of socially and culturally acceptable foods in the US. WWEIA consists of two 24-h recall interviews conducted in-person on the first day and over the phone on the second day, which occurs three to ten days later [40]. The WWEIA includes a count of the total number of times each food item was reported on days one and two of the dietary surveys. This value is a count of occurrences and is not associated with a specific serving size or amount of food. Each food item is associated with two separate counts of occurrences—one for each survey day. A calculation for the number of person-days per FNDDS item was performed and scaled to 1000 person-days to better recognize differences between values.

2.4. Identifying Optimally Sustainable Foods and Beverages

Following previous methods [25,27,30], a sustainability index based on the four indicators—nutrient density, environmental impact, cost, and consumption frequency—was created to determine which FNDDS foods and beverages were optimally sustainable. The sustainability index score for each food or beverage ranged from zero to four and was based on the sum of a binary score for each of the four sustainability indicators. The binary score was based on how a food or beverage scored relative to the median within its specific food group. Foods and beverages received one point for being above the food group-specific median for nutrient density and frequency and below the median for cost and environmental impact. Otherwise, the items received a zero for that indicator. Items with a score of four represented foods and beverages that were optimally sustainable.

2.5. Analysis

The analysis of nutrient density, environmental impact, and cost was based on units per 100 kilocalories. Frequency of consumption served as a proxy for social and cultural acceptability and was calculated per 1000 person-days for each food and beverage in the FNDDS. Shapiro-Wilk tests were performed for each indicator across food groups to assess the normality of the data, and results suggested significant non-normality among all indicators. Hence, non-parametric tests were selected for analysis. Spearman correlation tests were performed to evaluate the relationships between NRF 9.3 scores, environmental impact composite scores, cost, and frequency. Kruskal–Wallis tests were performed to assess the statistical significance of differences in indicators between food groups, with a Bonferroni correction.
Analyses of medians and statistics were performed using RStudio software, version 2023.06.0+421 “Mountain Hydrangea” release (base statistics functions for Shapiro-Wilk and Kruskal-Wallis tests and the “rcorr” function of the “Hmisc” package for Spearman correlations). Data visualizations were created using RStudio software (ggplot2), Microsoft Excel, and PowerPoint.

3. Results

Out of the 8690 food and beverage items included in the FNDDS, a total of 5964 items were included in the analysis. Of the total number of items, 300 were Fruits and 284 were Dairy (5% each of the total); 1548 (26%) were Vegetables, 935 (16%) were Grains, 1462 (25%) were Protein Foods, 345 (6%) were beverages, 108 (2%) were Fats and Oils, 181 (3%) were Condiments and Sauces, and 801 (12%) were Desserts and Sugars.

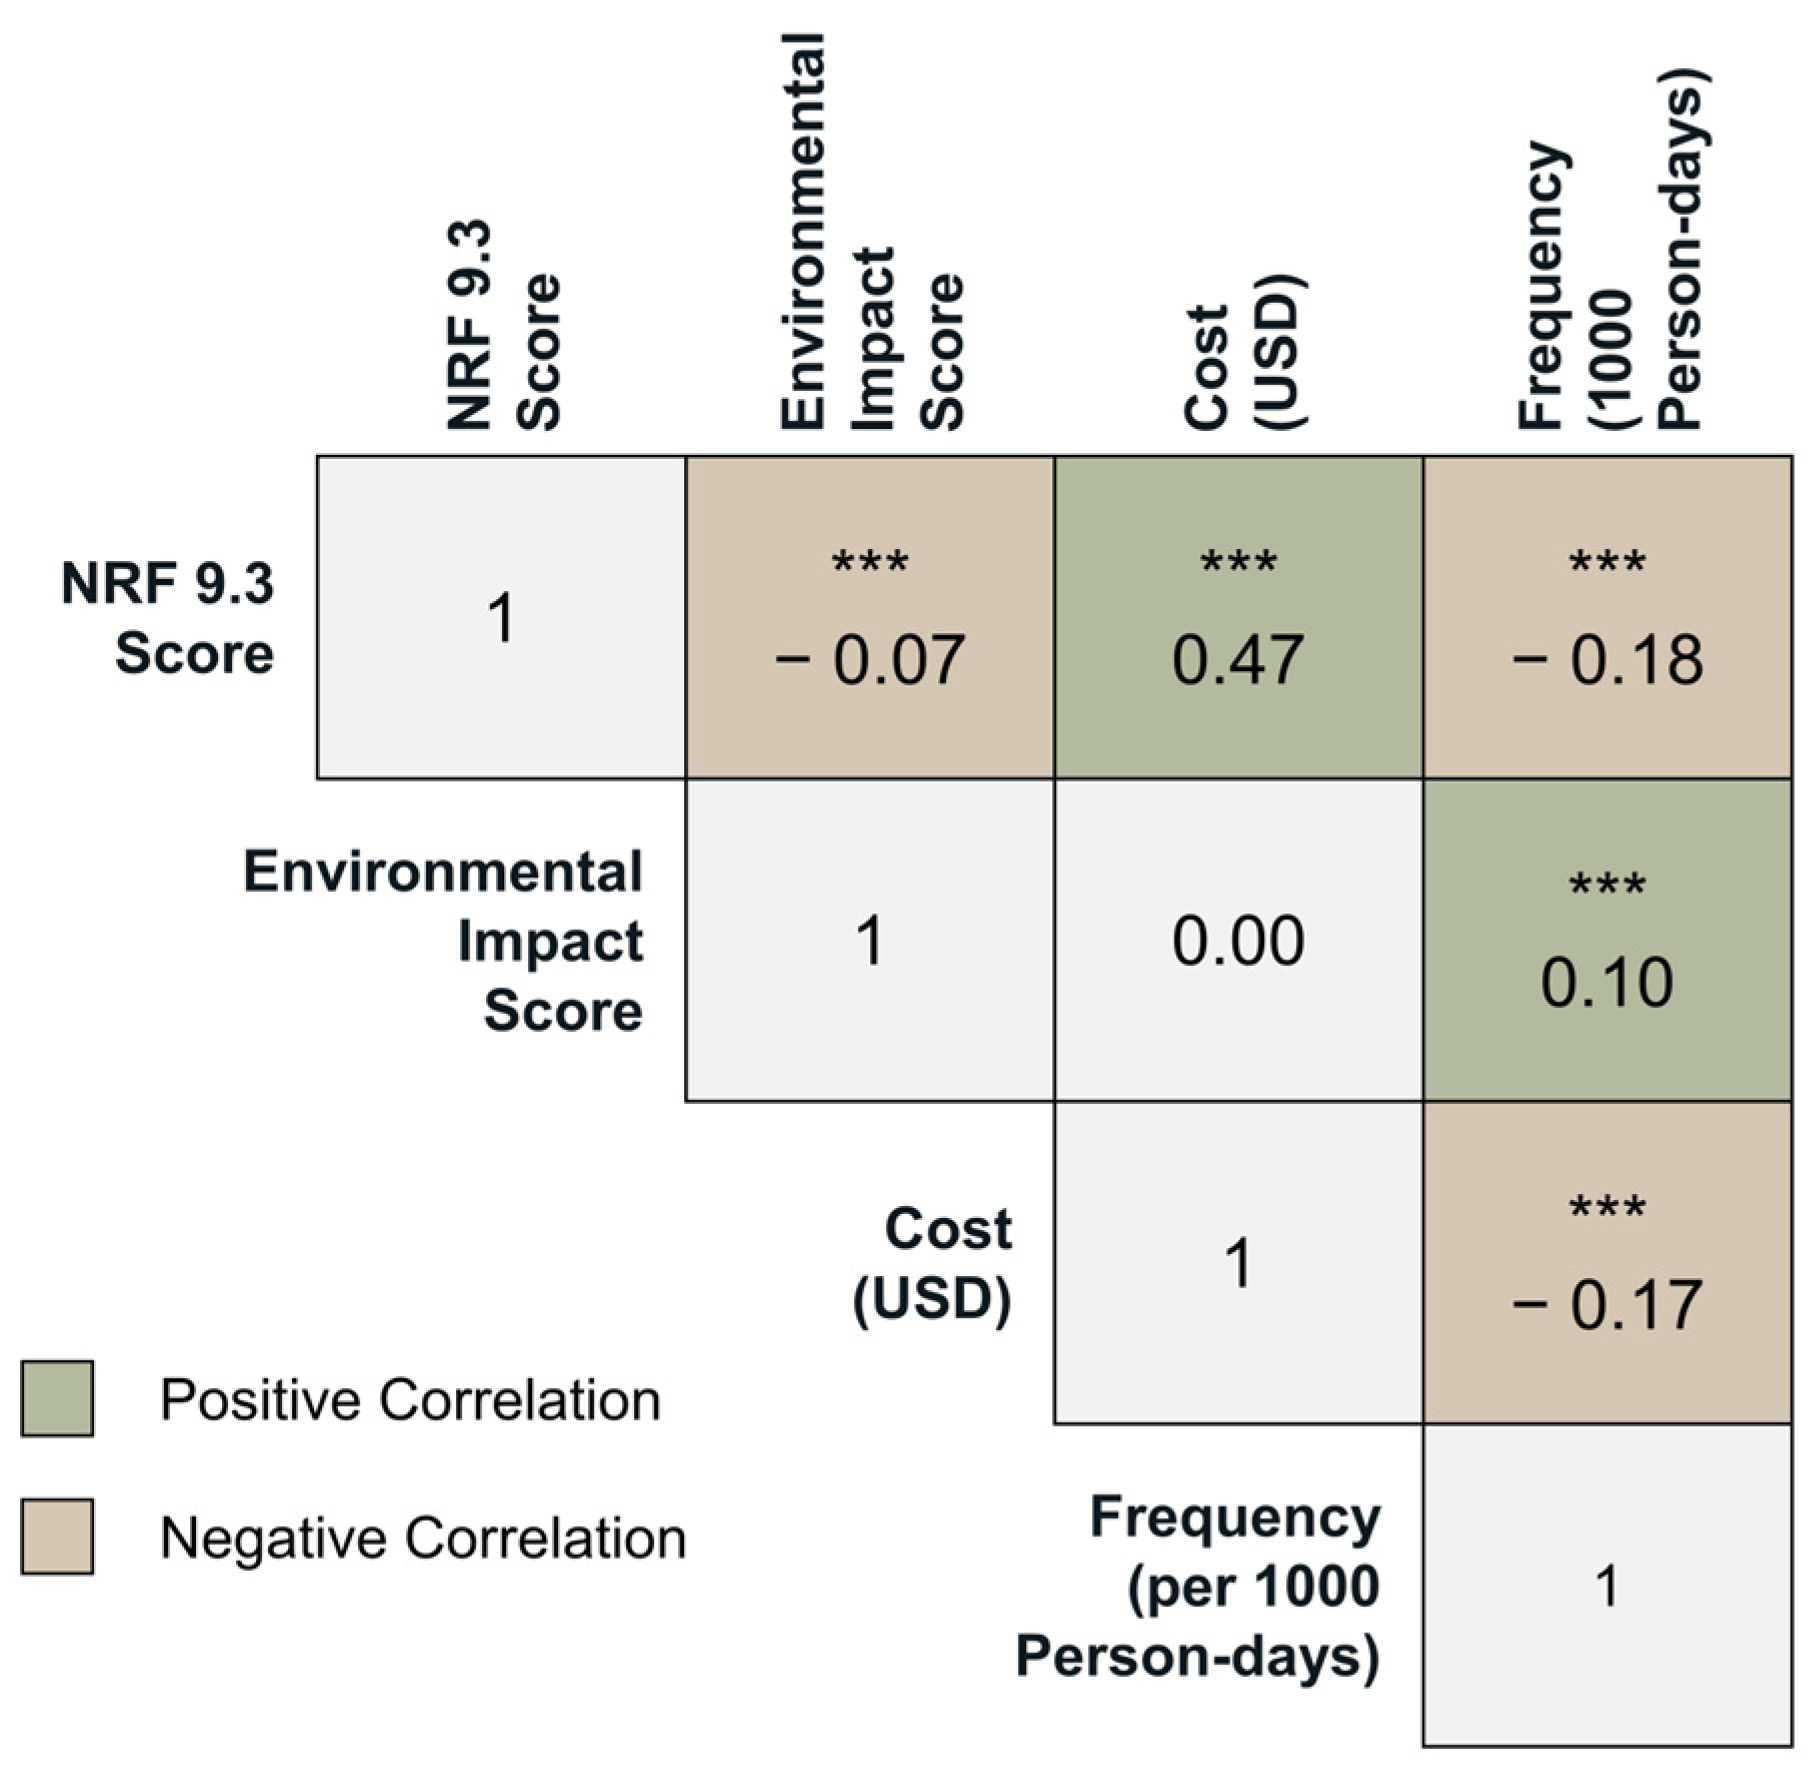
3.1. Correlations between Indicators

As depicted in Figure 1, among all items, there were significant correlations (p < 0.001) between NRF 9.3 and environmental impact, frequency, and cost, which indicated that higher nutrient density is associated with a lower environmental impact but also a lower frequency of consumption and a higher cost. Additionally, significant correlations (p < 0.001) between frequency and environmental impact and between frequency and cost were found, which suggest that foods and beverages that are consumed more often have a higher environmental impact and lower cost.

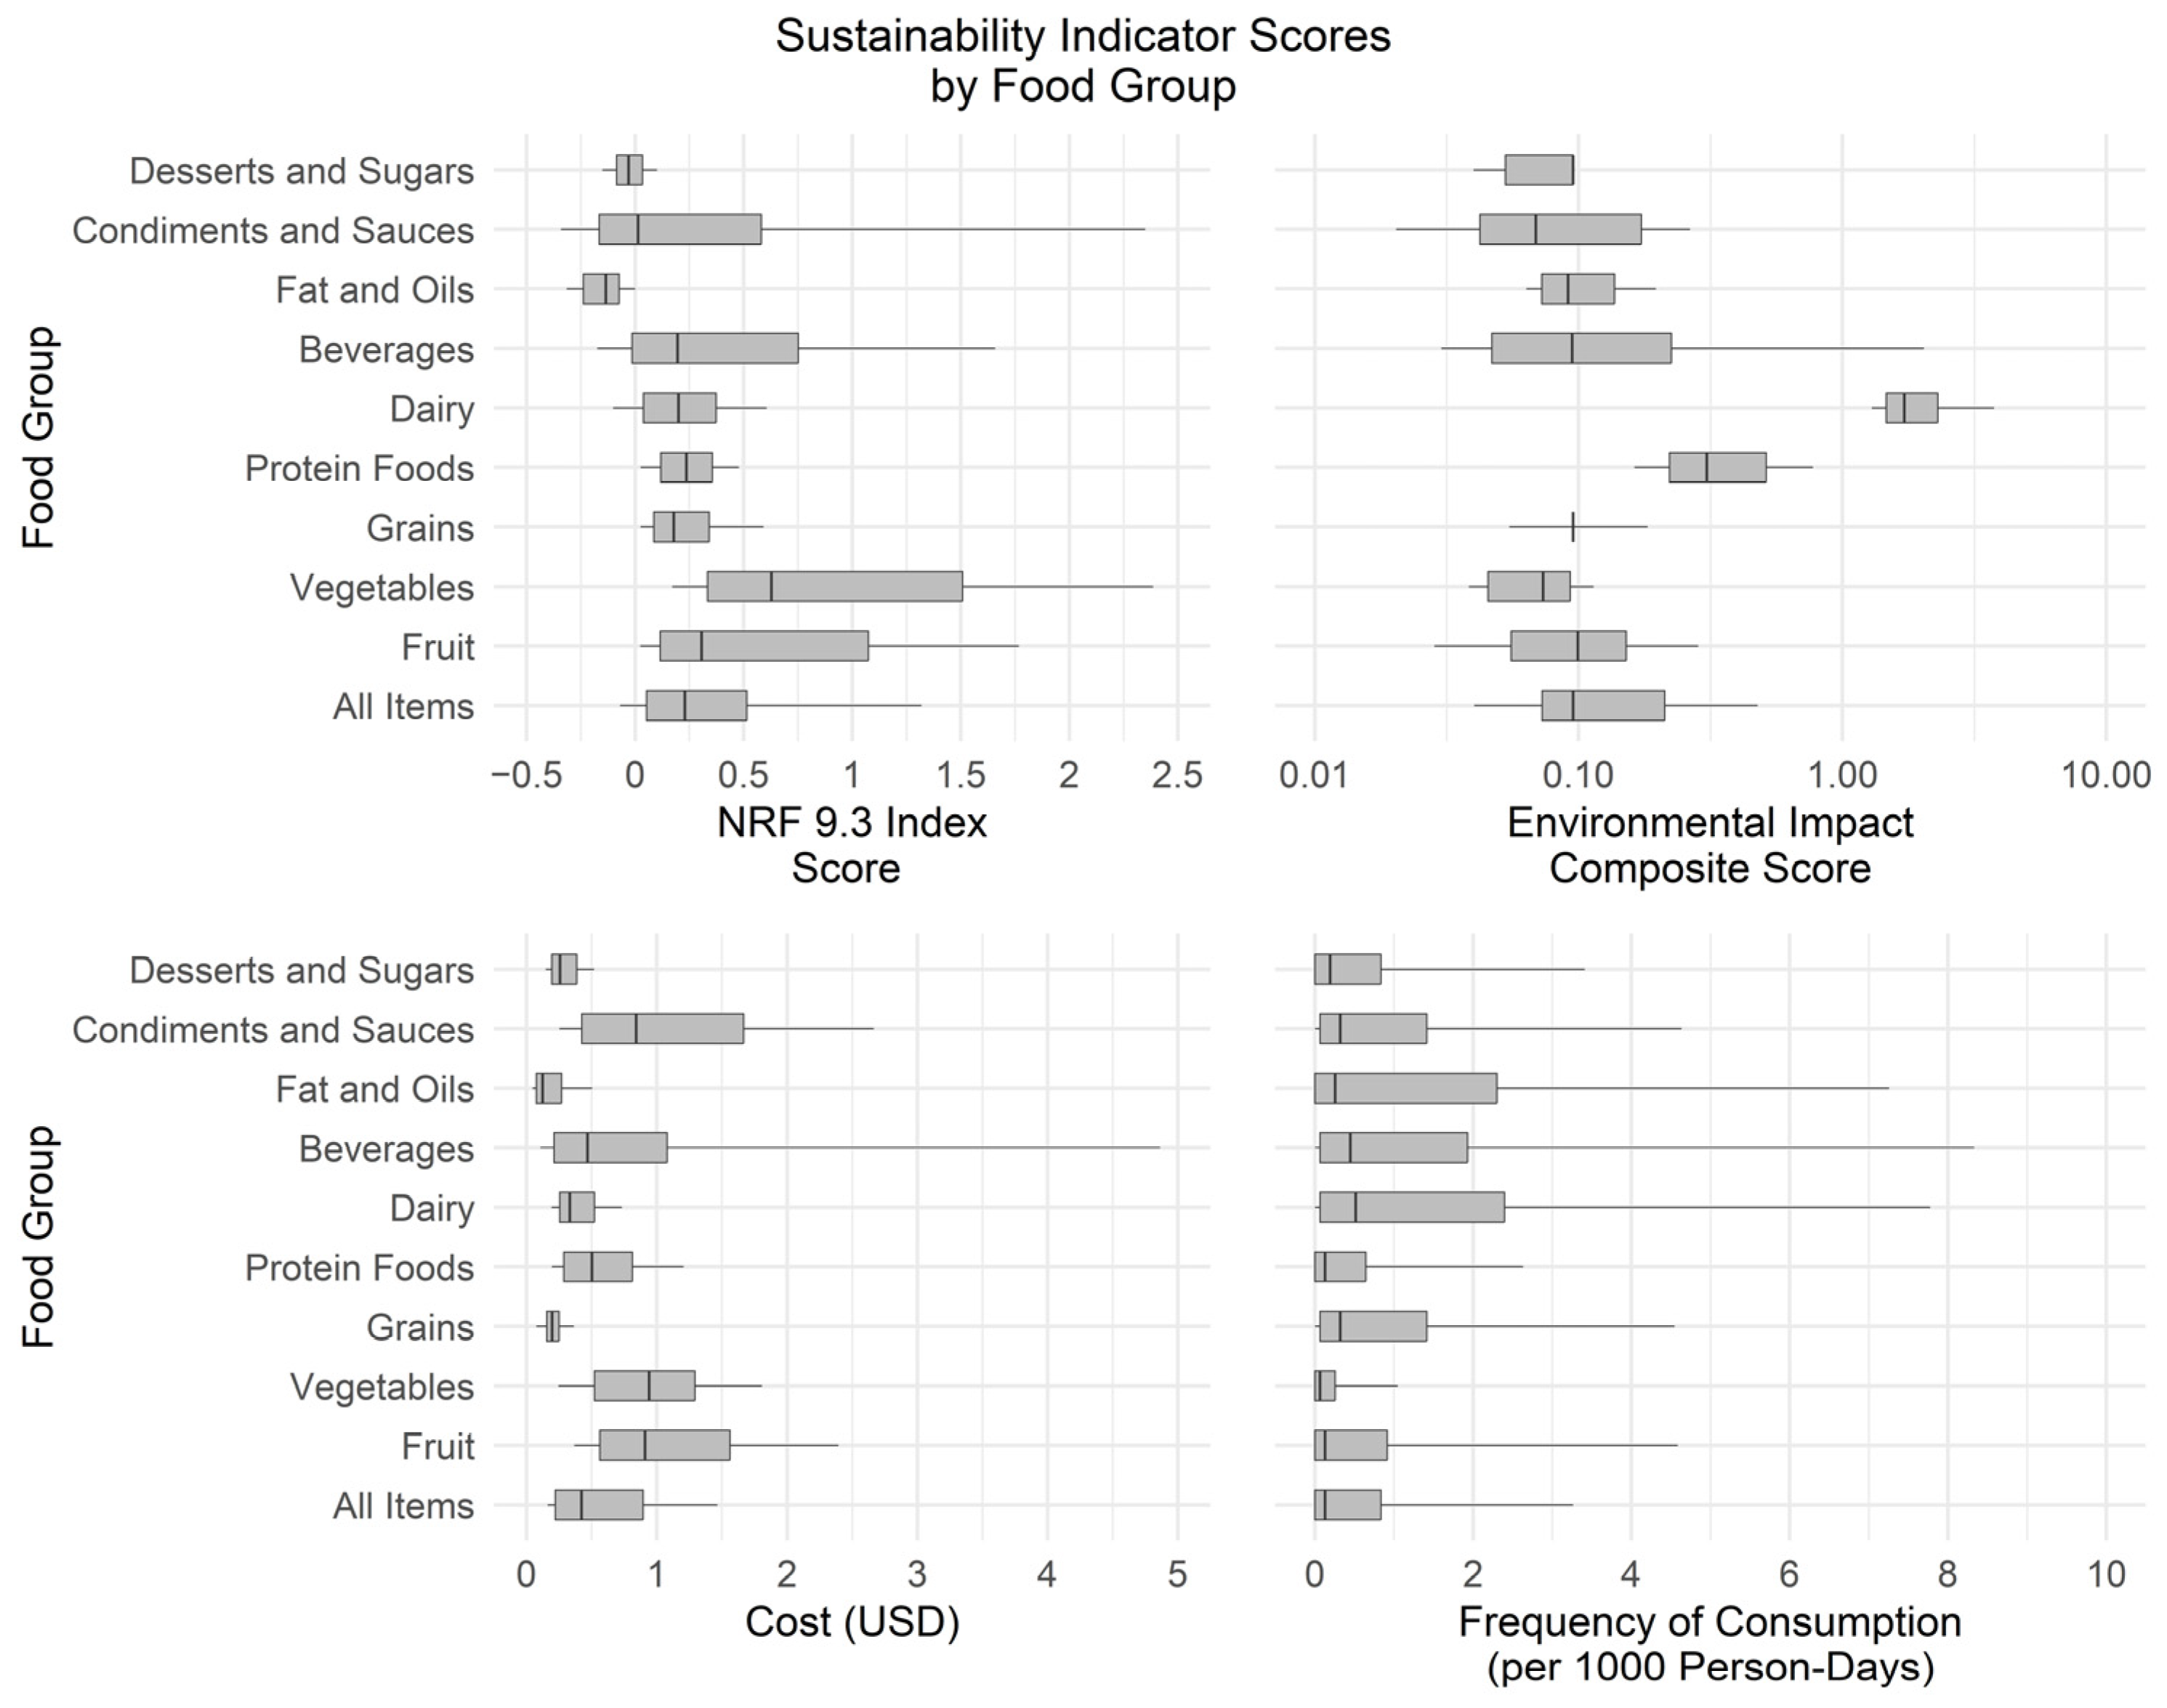
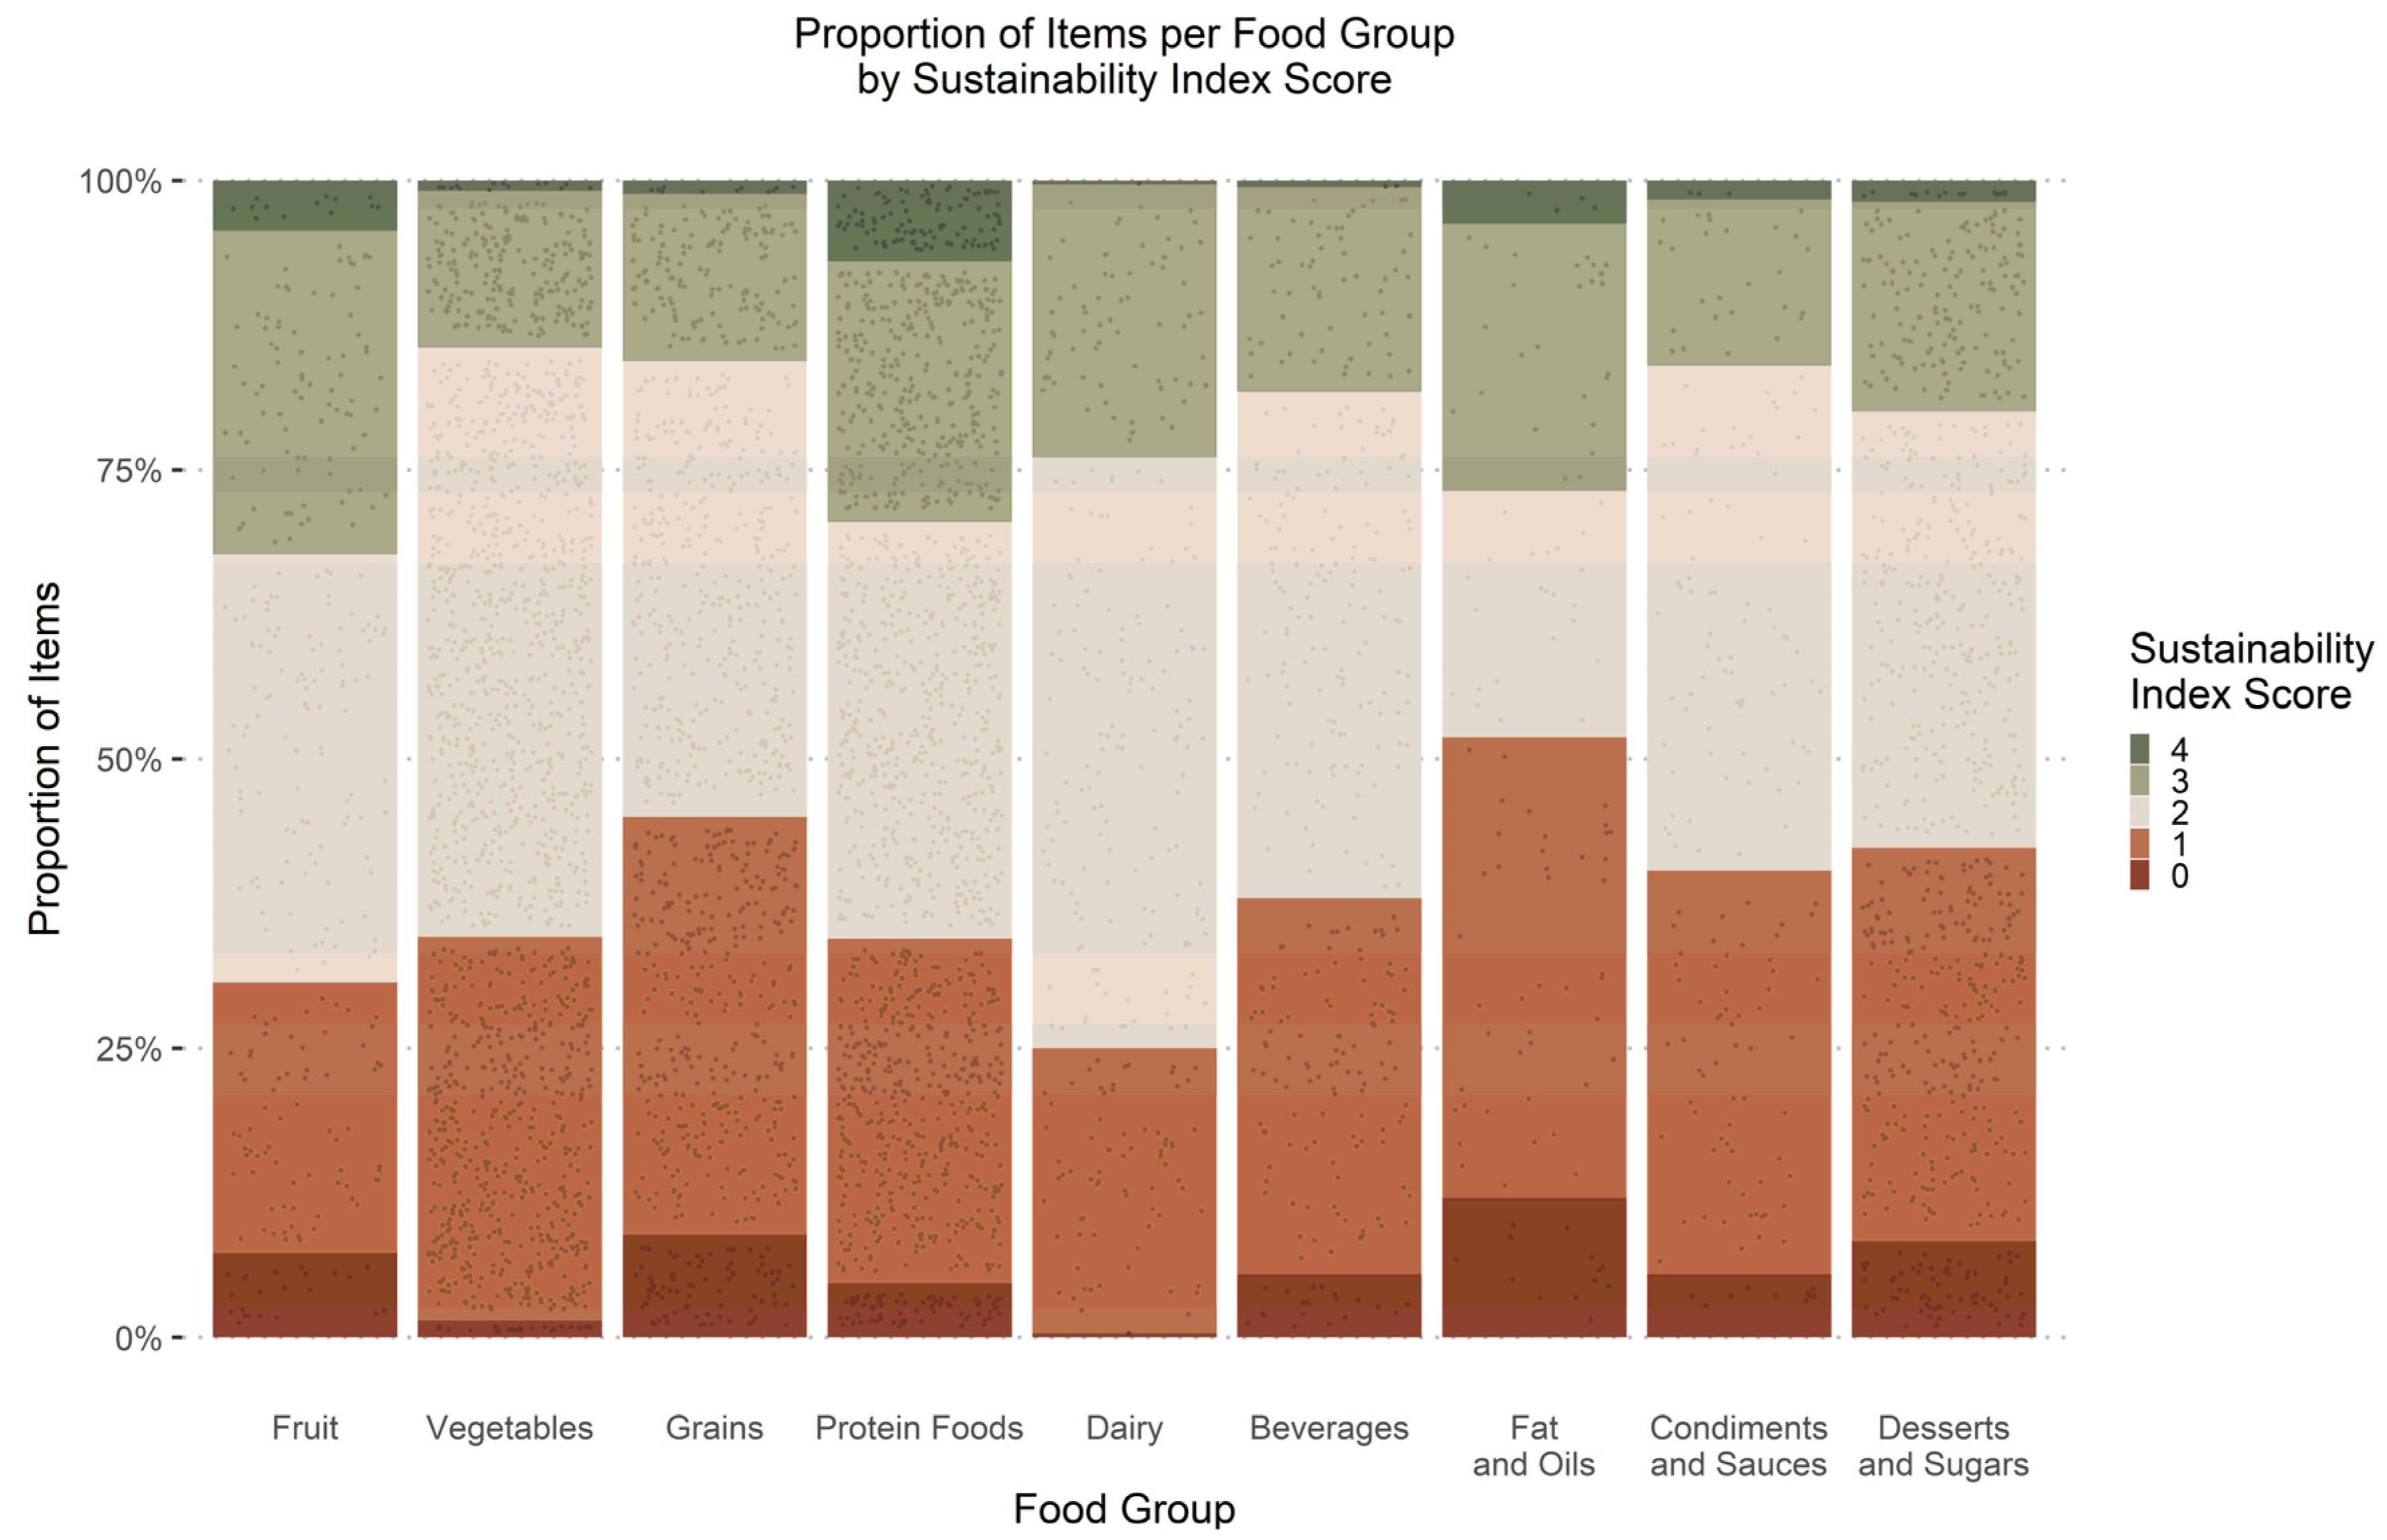
3.2. Indicator Scores across Food Groups

Figure 2 displays the medians and interquartile ranges for each indicator, separated by food group as well as overall. The median nutrient density score among all items was 0.23. The median environmental impact composite score was 0.10; the median cost was $0.42 per 100 kcal, and the median frequency of consumption was 0.13. Kruskal-Wallis tests indicated significant heterogeneity across food groups for all four indicators (p < 0.001). For both the nutrient density and cost indicators, the Vegetables food group had the highest median score, while Fats and Oils had the lowest score. Dairy had the highest median scores for both the environmental impact indicator and frequency of consumption. Condiments and Sauces had the lowest median environmental impact, and Vegetables had the lowest median frequency of consumption.

3.3. Sustainability Index Scores

A total of 165 foods and beverages were identified as optimally sustainable (i.e., scored a maximum Sustainability Index score of 4). Protein Foods comprised the majority, contributing to the highest number of optimal items (102 items, representing 62% of all optimally sustainable items). In contrast, Dairy had the lowest number of optimal items, with just one item accounting for less than 1% of all optimally sustainable items. As depicted in Figure 3, Protein Foods also had the highest proportion of optimally sustainable items, while Vegetables had the fewest items in that category. Items with a high sustainability index score of 3 or 4 accounted for a greater proportion of items among Fruit, Protein Foods, and Fats and Oils. Fats and Oils also had the highest proportion of items with a low sustainability index score of 0 or 1, followed by Grains and Desserts and Sugars. Dairy had the smallest proportion of items with a low, as well as high, sustainability index score.
Table 1 presents the number of items in each food group that received a Sustainability Index score of 1, 2, 3, or 4 (optimally sustainable), according to the combination of sustainability indicators for which the points were awarded. Among foods and beverages that scored only one point on the Sustainability Index, that point was awarded for nutrient density for the greatest proportion of items overall and all food groups except for Grains, Fats and Oils, and Condiments and Sauces. There was variability among food groups for which sustainability indicator combinations tended to reward more points when two or three points were awarded. However, relatively more items per food group seemed to earn points for combinations of nutrient density, cost, and frequency than the other combinations. For items receiving two points, there were four food groups (Fruit, Protein Foods, Beverages, and Fats and Oils) for which the greatest proportion of items received points for nutrition and frequency of consumption, followed by three food groups (Grains, Dairy, and Fats and Oils) with the largest proportion of items earning points for nutrition and cost. For items that received three points, the greatest proportion of items in four food groups (Fruit, Grains, Condiments and Sauces, and Desserts and Sugars) received those points for nutrient density, cost, and frequency of consumption. Notably, there were three instances for which zero points were awarded. There were no items within Fats and Oils that received a Sustainability Index score of one for environmental impact, nor were there Fats and Oils items that received a score of three for the combinations of nutrient density, environmental impact, and frequency, or environmental impact, cost, and frequency.

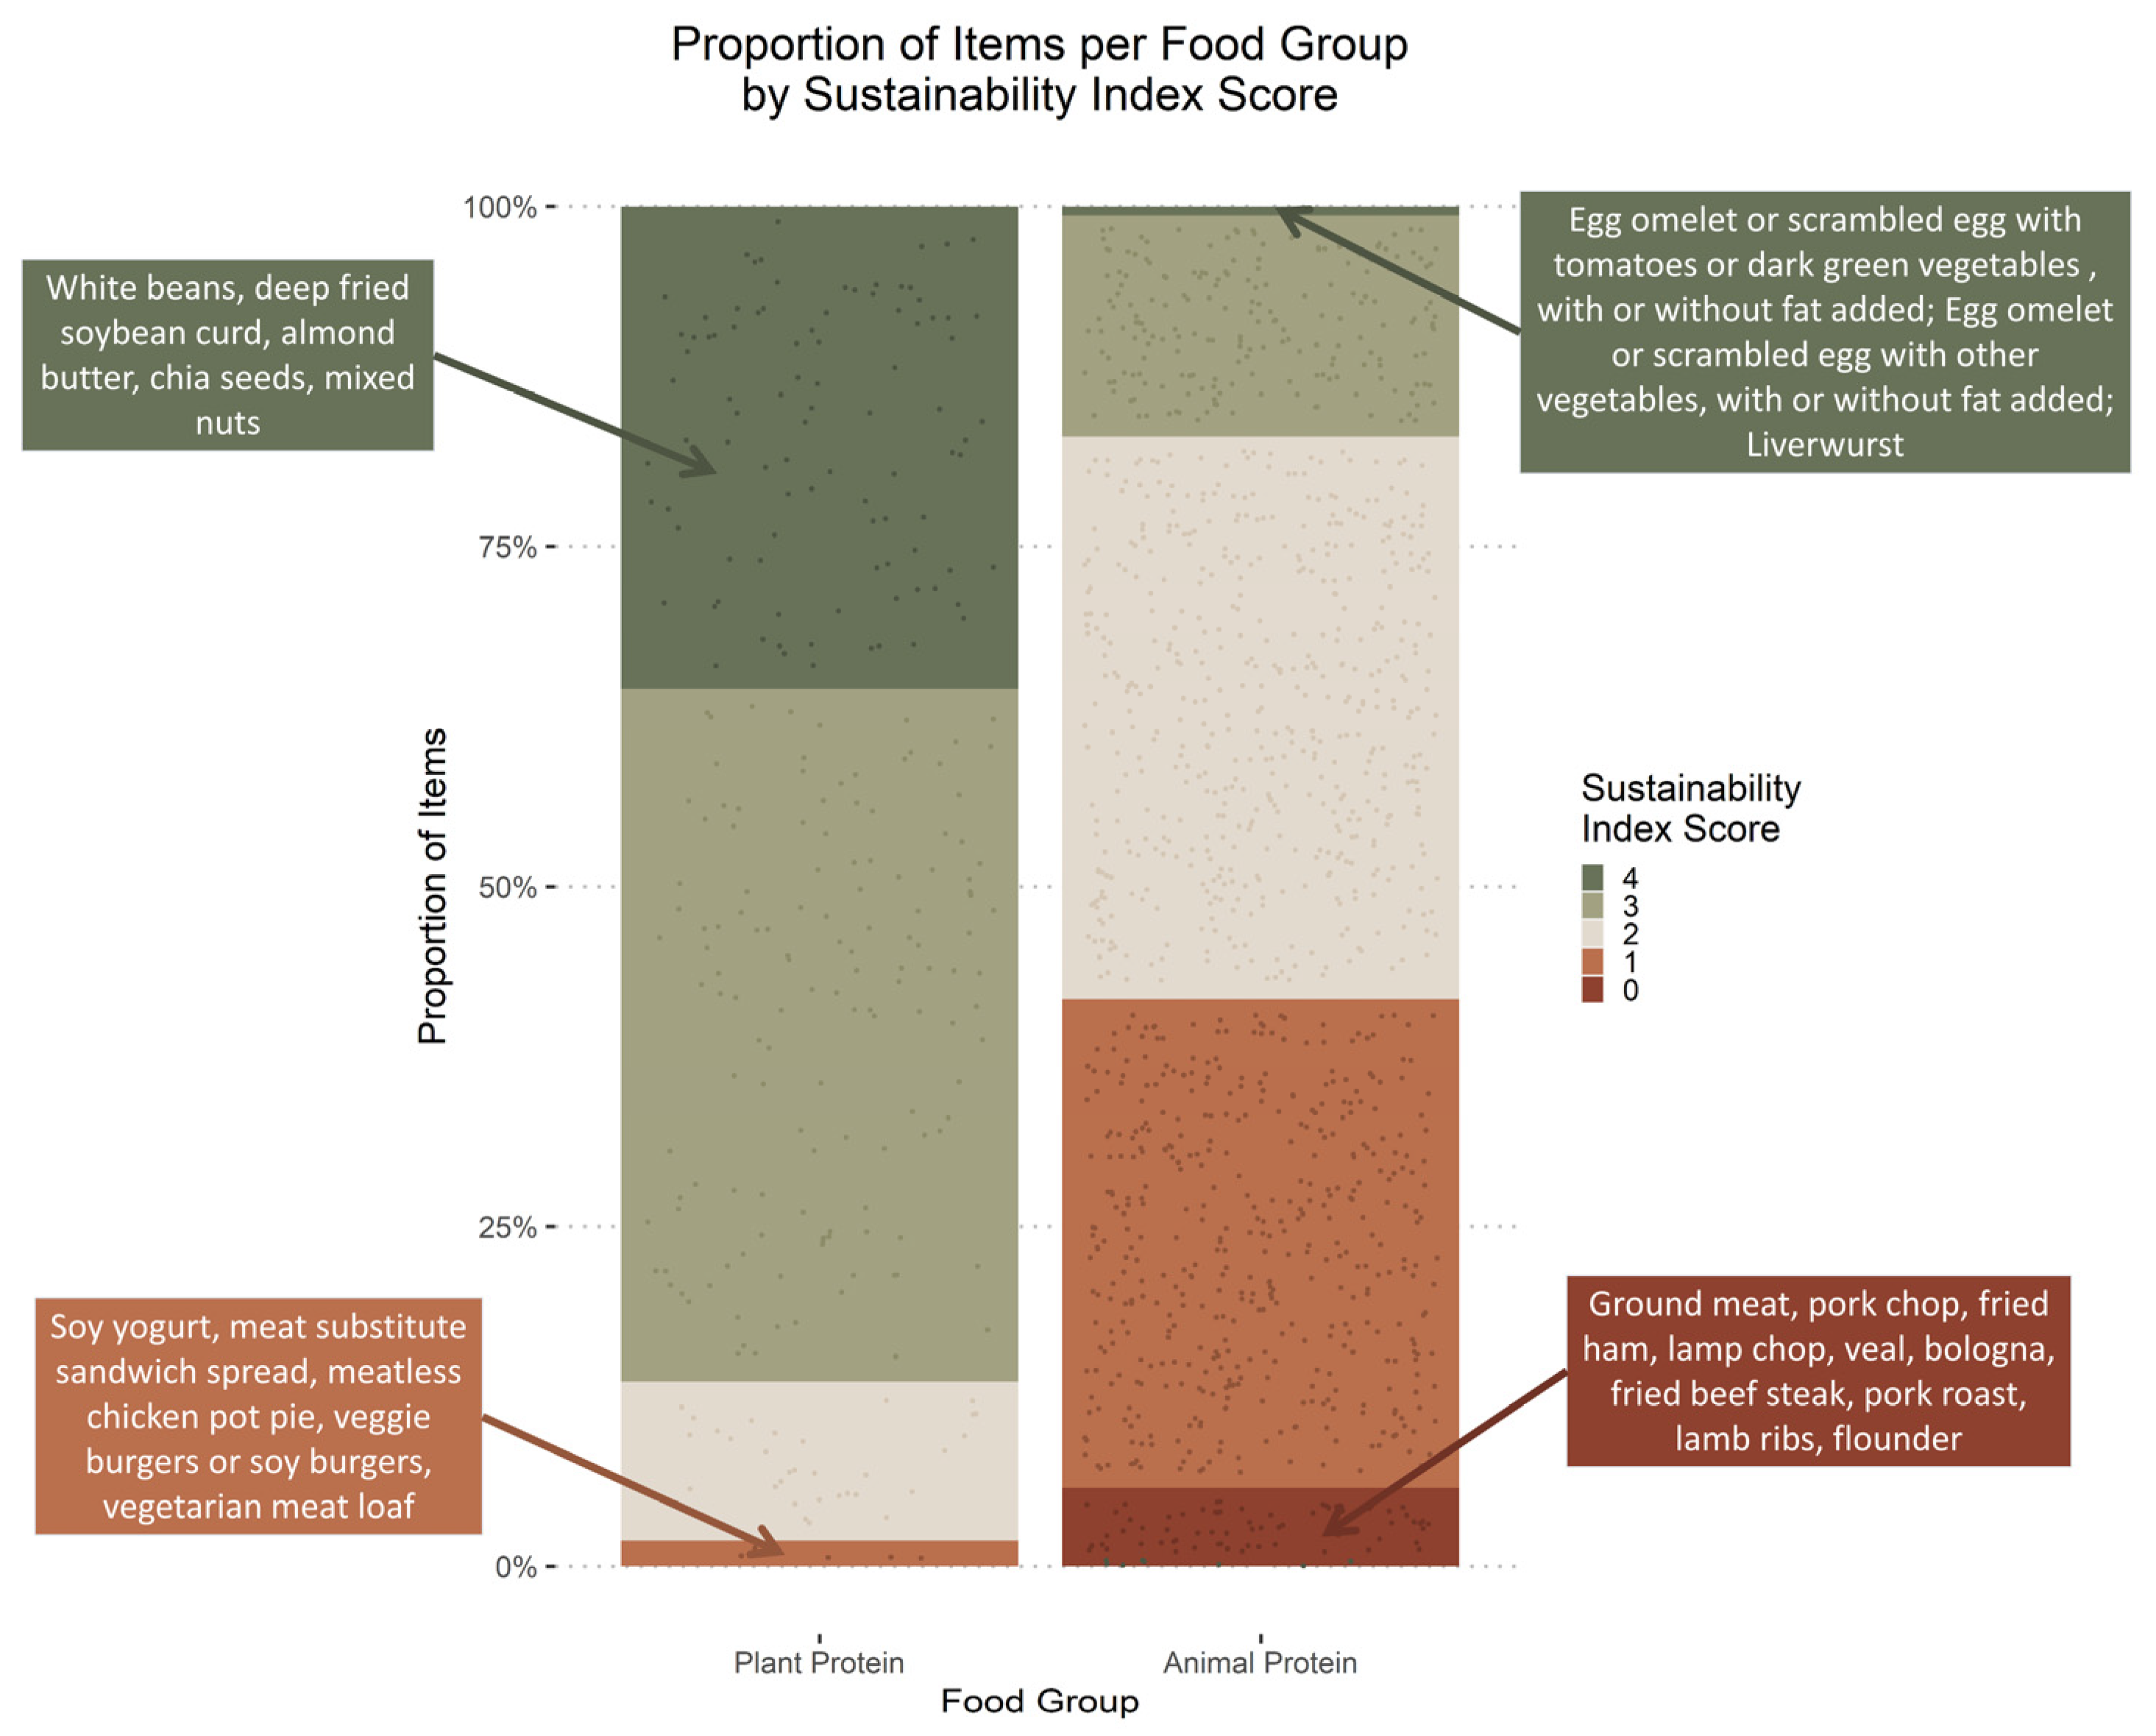
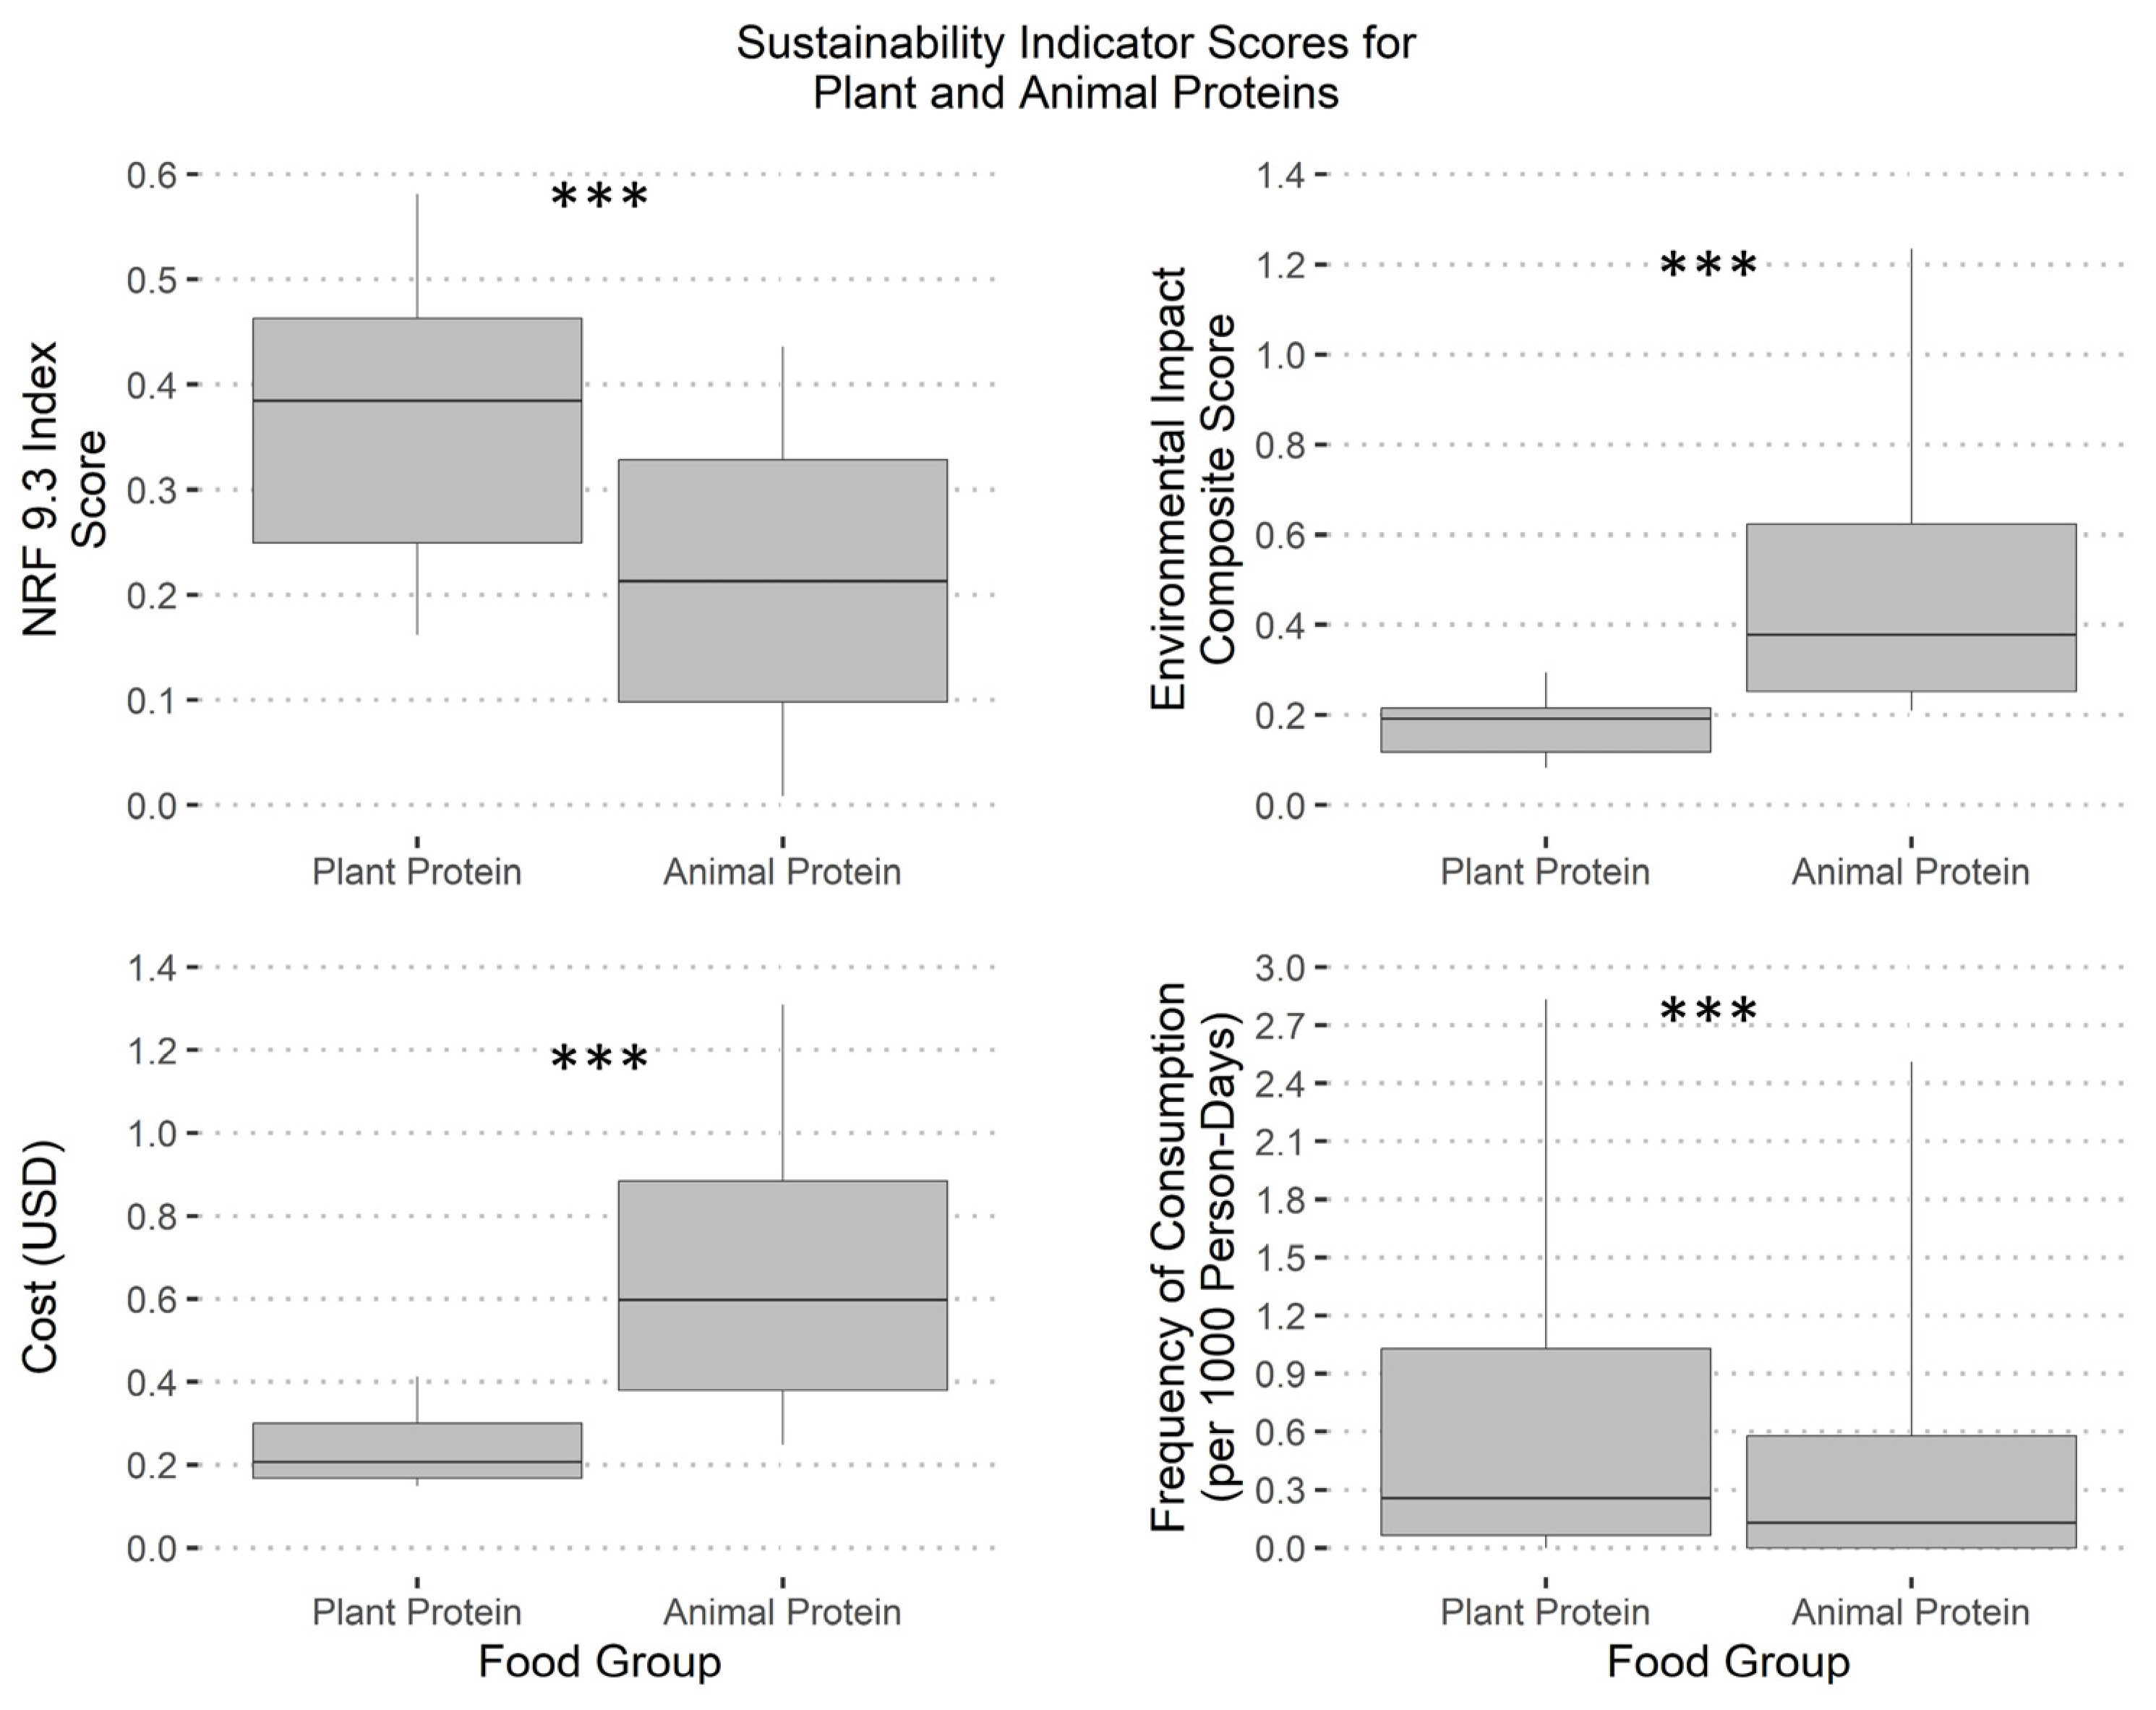
3.4. Plant versus Animal Proteins

Notably, the Protein Foods food group had a substantially smaller environmental impact than the Dairy food group (a composite score of 0.32 versus 11.42, respectively). This is contrary to the literature, which generally shows that protein foods, especially beef or lamb, tend to have a greater environmental impact than dairy products [8,41]. Both the Dietary Guidelines for Americans (DGA) and the FNDDS aggregate plant and animal proteins to some degree; however, it is possible that this aggregation may account for the discrepancy in environmental impact between Protein Foods and Dairy. This avenue was investigated further to delineate the relationships between sustainability indicators and plant and animal proteins. Compared to Animal Proteins, Plant Proteins had a significantly higher median NRF 9.3 Score (0.38 vs. 0.21, p < 0.001) and frequency of consumption (0.26 vs. 0.13, p < 0.001) and a significantly lower median environmental impact composite score (0.19 vs. 0.38, p < 0.001) and cost ($0.21 vs. $0.60, p < 0.001), shown in Figure 4.
Among all proteins, a total of 102 items were identified as optimally sustainable (i.e., scored a maximum Sustainability Index score of 4), 94 (92%) of which were Plant Proteins. As shown in Figure 5, optimally sustainable items accounted for 35% of all Plant Proteins but only 1% of all Animal Proteins. Additionally, 86% of Plant Proteins received a high sustainability index score of 3 or 4, while Animal Proteins with the same scores accounted for 17% of the group.

4. Discussion

This study aimed to determine how scores for nutrition, environmental impact, monetary cost, and frequency of consumption as a novel proxy for social and cultural acceptability vary across food groups and found that no one food group tended to have the most favorable median scores for all four indicators. Less than 3% of the nearly 6000 foods and beverages included were optimally sustainable. However, it appears that Plant Proteins may strike the best balance between the four indicators out of all the food groups analyzed.
The relationship between nutrient density and cost is well established, with numerous studies demonstrating that nutrient-dense foods and diets tend to be more expensive [30,42,43] yet also have a lower environmental impact [20,21,25]. The substantial positive correlation between nutrient density and cost, along with the significant negative correlation between nutrient density and environmental impact, aligns with patterns observed in the existing literature [25,42,43]. This provides additional support for the argument that addressing food affordability is crucial, not only for enhancing the accessibility of nutrient-dense foods but also for mitigating dietary environmental impacts. Correlations also revealed that foods and beverages that are consumed more frequently are associated with a lower nutrient density and lower cost. These results reflect previous findings on the potential mediating role of dietary cost in the positive relation between dietary quality and socioeconomic status [43,44,45]. The present study found similar patterns of more frequent consumption of less nutritious, lower-cost foods from a dietary survey of a representative sample of individuals in the US. Frequency of consumption was also found to be positively correlated with environmental impact. Although interest and attitudes toward foods with lower environmental impact have been shifting to increase the demand for such products [15,16], it does not appear that those patterns were reflected in the dietary data from the 2015–2016 FNDDS. Therefore, it may be worthwhile to investigate how the indicators for more recent consumption patterns compare to those from the 2015–2016 cycle.
Among the 5964 items analyzed, only 165 were identified as optimally sustainable, making up less than 3% of all items. The majority of these optimally sustainable items were found in the Protein Foods group. Notably, two other studies developed comparable optimal sustainability indices by considering median scores for nutritional density, environmental impact, and cost. One study identified “fruit and vegetables” [25], while another highlighted “potatoes, bread, rice, pasta, and other starchy carbohydrates” [27] as contributing the most to the number of items that scored the highest in sustainability. In a third study, a diet that optimized nutritional density, environmental impact, cost, and alignment with self-selected diet patterns emphasized an increased consumption of whole grains, legumes, and fruit [31]. Further investigation of Protein Foods and the distinction between plant and animal proteins yielded optimally sustainable items that were somewhat more aligned with these other results, as all identify plant products as more sustainable. However, the variability in which food groups may be optimal highlights the differences that may result from the use of different databases and the need for more objective definitions and measurements of sustainability.
It appears that the superior performance of the Protein Foods group on the Sustainability Index was due primarily to the Plant Protein items within the group. With 35% of plant proteins scoring the maximum 4 points and over 85% scoring 3 or 4 on the Sustainability Index, these results present further support for plant proteins as sustainable dietary components. Diets relying on plant products for protein sources—such as nuts, seeds, legumes, and soy products—have been demonstrated as a viable alternative to animal-protein diets, contributing to superior diet quality without necessarily sacrificing affordability [46,47]. However, care must also be taken to ensure that the overall quality of proteins consumed is adequate, particularly with respect to specific amino acids [46,48,49]. Additionally, the majority of plant proteins consumed are derived from cereal products, which also warrants concern for the glycemic load of the diet [49]. Support for the shift to dietary patterns emphasizing plant foods—and specifically, plant proteins—is strong. However, it also requires a diversification of foods consumed and further research regarding protein quality and methods to better integrate plant proteins into diet patterns [48,49,50].

4.1. Limitations and Methodological Considerations

A key limitation of this study is associated with the databases used for analysis, notably, the need to aggregate foods and beverages for environmental and cost metrics. Another significant limitation lies in the divergence between the databases for environmental impact and cost, which employed different lists of items and food categories. Importantly, neither of these lists aligned with the organization and level of detail in FNDDS, the source of data for nutrient density and frequency measures. Therefore, items were grouped by best match for these two indicators, thus potentially introducing errors in approximating metric values from available data. Additionally, the measurement of environmental impact could be improved in a few other aspects. The database used does not distinguish foods and beverages by production methods or location, which would be expected to largely impact the environmental footprint and relatedly may also be associated with different costs, frequencies of consumption, and potentially different nutrient profiles [51,52]. Further, the methods of equally weighting each component of the environmental impact composite score and of dichotomizing indicators for the Sustainability Index lack sensitivity and, therefore, may miss the nuances of these complex metrics. Other studies have applied methods of differentially weighting aspects of the environmental impact, which may capture more details related to the specific location and population involved [21]. Future research would benefit from an analysis of environmental impact specific to the location in question, with consideration of different production practices and priorities of environmental concerns.
It is important to recognize that a truly holistic understanding of “sustainable foods” includes more than the present factors. Environmental sustainability of foods may also include components such as biodiversity and soil degradation, and other topics such as animal welfare and fair trade were not considered in this analysis, yet they are equally important in achieving a more sustainable food system. The social dimension of sustainable diets also includes equity and social justice in the food system—elements that are not captured by analyzing dietary surveys and frequency of consumption [12,17,53]. Despite these limitations, the current study marks further headway in grasping a more holistic understanding of sustainable foods.

4.2. Strengths

A key advantage of the present study was the inclusion of all four dimensions of sustainable diets identified by the Chicago Consensus [17]. The frequency by which foods and beverages are consumed was used as a novel proxy for social and cultural acceptability [39], which is an important yet often overlooked feature of sustainable diets. There are no standard objective methods for measuring social and cultural acceptability, but the present analysis included a more thorough examination of patterns of consumption than has been used previously. Other strengths of this study include a greater breadth and number of foods and beverages than in other food-level analyses [25,27,30] and a comprehensive environmental impact analysis, incorporating data for five different metrics of environmental impact rather than relying on greenhouse gas emissions data alone to represent environmental impact as is often used [54].

5. Conclusions

In conclusion, this study revealed that only a limited number of foods and beverages met the criteria to be deemed optimally sustainable. Notably, Plant Protein foods emerged as potentially striking the best balance among the four sustainability indicators assessed. The Chicago Consensus notes a need for studies on sustainable diets to adopt a holistic approach due to the inherent interdisciplinary factors of the food system [17]. Shifting the food system to better support human health in a sustainable manner requires optimizing nutrition, cost, and environmental impact. Additionally, it necessitates considering whether certain foods align with the social and cultural context of a given population. Providing information at the food level and identifying which may be optimally sustainable can empower consumers to make dietary choices that align with their nutritional requirements, personal values, and preferences.

Supplementary Materials

The following supporting information can be downloaded at: https://www.mdpi.com/article/10.3390/su16020551/s1, Table S1: Sustainability Index Scores.

Author Contributions

Conceptualization, K.H. and P.M.; Data curation, K.H.; Formal analysis, K.H.; Investigation, K.H. and N.S.; Methodology, K.H. and P.M.; Supervision, P.M.; Visualization, K.H.; Writing—original draft, K.H.; Writing—review and editing, K.H., P.M. and N.S. All authors have read and agreed to the published version of the manuscript.

Funding

This research received no external funding.

Institutional Review Board Statement

Not applicable.

Informed Consent Statement

Not applicable.

Data Availability Statement

The dataset of sustainability index scores generated for this study can be found in the Supplementary Materials for this article. Environmental impact data was published by Poore and Nemecek: doi:10.1126/science.aaq0216. Other datasets used in this study are publicly available and can be found as follows: https://www.ars.usda.gov/northeast-area/beltsville-md-bhnrc/beltsville-human-nutrition-research-center/food-surveys-research-group/docs/fndds/ (accessed on 25 September 2022), https://www.ars.usda.gov/northeast-area/beltsville-md-bhnrc/beltsville-human-nutrition-research-center/food-surveys-research-group/docs/fped-overview/ (accessed on 26 February 2023), https://www.ers.usda.gov/data-products/purchase-to-plate/ (accessed on 21 June 2023).

Conflicts of Interest

The authors declare no conflicts of interest.

References

  1. CDC. About Chronic Diseases. Available online: https://www.cdc.gov/chronicdisease/about/index.htm (accessed on 28 March 2023).
  2. CDC. Poor Nutrition. Available online: https://www.cdc.gov/chronicdisease/resources/publications/factsheets/nutrition.htm (accessed on 27 March 2023).
  3. Hill-Briggs, F.; Adler, N.E.; Berkowitz, S.A.; Chin, M.H.; Gary-Webb, T.L.; Navas-Acien, A.; Thornton, P.L.; Haire-Joshu, D. Social Determinants of Health and Diabetes: A Scientific Review. Diabetes Care 2020, 44, 258–279. [Google Scholar] [CrossRef]
  4. Aggarwal, R.; Chiu, N.; Wadhera, R.K.; Moran, A.E.; Raber, I.; Shen, C.; Yeh, R.W.; Kazi, D.S. Racial/Ethnic Disparities in Hypertension Prevalence, Awareness, Treatment, and Control in the United States, 2013 to 2018. Hypertension 2021, 78, 1719–1726. [Google Scholar] [CrossRef] [PubMed]
  5. Leng, B.; Jin, Y.; Li, G.; Chen, L.; Jin, N. Socioeconomic Status and Hypertension: A Meta-Analysis. J. Hypertens. 2015, 33, 221–229. [Google Scholar] [CrossRef] [PubMed]
  6. Fulgoni, V.; Drewnowski, A. An Economic Gap between the Recommended Healthy Food Patterns and Existing Diets of Minority Groups in the US National Health and Nutrition Examination Survey 2013–14. Front. Nutr. 2019, 6, 37. [Google Scholar] [CrossRef] [PubMed]
  7. Mulik, K.; Haynes-Maslow, L. The Affordability of MyPlate: An Analysis of SNAP Benefits and the Actual Cost of Eating According to the Dietary Guidelines. J. Nutr. Educ. Behav. 2017, 49, 623–631. [Google Scholar] [CrossRef] [PubMed]
  8. Poore, J.; Nemecek, T. Reducing Food’s Environmental Impacts through Producers and Consumers. Science 2018, 360, 987–992. [Google Scholar] [CrossRef] [PubMed]
  9. Béné, C.; Fanzo, J.; Prager, S.D.; Achicanoy, H.A.; Mapes, B.R.; Alvarez Toro, P.; Bonilla Cedrez, C. Global Drivers of Food System (Un)Sustainability: A Multi-Country Correlation Analysis. PLoS ONE 2020, 15, e0231071. [Google Scholar] [CrossRef]
  10. Crippa, M.; Solazzo, E.; Guizzardi, D.; Monforti-Ferrario, F.; Tubiello, F.N.; Leip, A. Food Systems Are Responsible for a Third of Global Anthropogenic GHG Emissions. Nat. Food 2021, 2, 198–209. [Google Scholar] [CrossRef]
  11. Birney, C.I.; Franklin, K.F.; Davidson, F.T.; Webber, M.E. An Assessment of Individual Foodprints Attributed to Diets and Food Waste in the United States. Environ. Res. Lett. 2017, 12, 105008. [Google Scholar] [CrossRef]
  12. FAO. Sustainable Diets and Biodiversity—Directions and Solutions for Policy, Research and Action; FAO: Rome, Italy, 2012. [Google Scholar]
  13. FAO. The State of the World’s Land and Water Resources for Food and Agriculture—Systems at Breaking Points; Synthesis Report 2021; FAO: Rome, Italy, 2021; ISBN 978-92-5-135327-1. [Google Scholar]
  14. Benton, T.G.; Bieg, C.; Harwatt, H.; Wellesley, L.; Pudasaini, R. Food System Impacts on Biodiversity Loss: Three Levers for Food System Transformation in Support of Nature; Energy, Environment and Resources Programme; Chatham House: London, UK, 2021; pp. 1–75. ISBN 978 1 78413 433 4. [Google Scholar] [CrossRef]
  15. International Food Information Council. 2022 Food and Health Survey; International Food Information Council: Washington, DC, USA, 2022. [Google Scholar]
  16. Economist Intelligence Unit and World Wildlife Fund. An EcoWakening_Measuring Awareness, Engagement and Action for Nature; Economist Intelligence Unit: London, UK, 2021. [Google Scholar]
  17. Drewnowski, A.; Ecosystem Inception Team. The Chicago Consensus on Sustainable Food Systems Science. Front. Nutr. 2017, 4, 74. [Google Scholar] [CrossRef]
  18. Germani, A.; Vitiello, V.; Giusti, A.M.; Pinto, A.; Donini, L.M.; del Balzo, V. Environmental and Economic Sustainability of the Mediterranean Diet. Int. J. Food Sci. Nutr. 2014, 65, 1008–1012. [Google Scholar] [CrossRef] [PubMed]
  19. Monsivais, P.; Scarborough, P.; Lloyd, T.; Mizdrak, A.; Luben, R.; Mulligan, A.A.; Wareham, N.J.; Woodcock, J. Greater Accordance with the Dietary Approaches to Stop Hypertension Dietary Pattern Is Associated with Lower Diet-Related Greenhouse Gas Production but Higher Dietary Costs in the United Kingdom. Am. J. Clin. Nutr. 2015, 102, 138–145. [Google Scholar] [CrossRef] [PubMed]
  20. Rose, D.; Heller, M.C.; Willits-Smith, A.M.; Meyer, R.J. Carbon Footprint of Self-Selected US Diets: Nutritional, Demographic, and Behavioral Correlates. Am. J. Clin. Nutr. 2019, 109, 526–534. [Google Scholar] [CrossRef] [PubMed]
  21. Agyemang, P.; Kwofie, E.M.; Baum, J.I. Transitioning to Sustainable Healthy Diets: A Model-Based and Conceptual System Thinking Approach to Optimized Sustainable Diet Concepts in the United States. Front. Nutr. 2022, 9, 874721. [Google Scholar] [CrossRef] [PubMed]
  22. Mertens, E.; Kuijsten, A.; van Zanten, H.H.E.; Kaptijn, G.; Dofková, M.; Mistura, L.; D’Addezio, L.; Turrini, A.; Dubuisson, C.; Havard, S.; et al. Dietary Choices and Environmental Impact in Four European Countries. J. Clean. Prod. 2019, 237, 117827. [Google Scholar] [CrossRef]
  23. Drewnowski, A. The Cost of US Foods as Related to Their Nutritive Value. Am. J. Clin. Nutr. 2010, 92, 1181–1188. [Google Scholar] [CrossRef] [PubMed]
  24. Drewnowski, A. The Nutrient Rich Foods Index Helps to Identify Healthy, Affordable Foods. Am. J. Clin. Nutr. 2010, 91, 1095S–1101S. [Google Scholar] [CrossRef]
  25. Masset, G.; Soler, L.-G.; Vieux, F.; Darmon, N. Identifying Sustainable Foods: The Relationship between Environmental Impact, Nutritional Quality, and Prices of Foods Representative of the French Diet. J. Acad. Nutr. Diet. 2014, 114, 862–869. [Google Scholar] [CrossRef]
  26. Maillot, M.; Darmon, N.; Drewnowski, A. Are the Lowest-Cost Healthful Food Plans Culturally and Socially Acceptable? Public Health Nutr. 2010, 13, 1178–1185. [Google Scholar] [CrossRef]
  27. Aceves-Martins, M.; Bates, R.L.; Craig, L.C.A.; Chalmers, N.; Horgan, G.; Boskamp, B.; de Roos, B. Food-Level Analysis to Identify Dietary Choices with the Highest Nutritional Quality and Lowest Greenhouse Gas Emissions and Price. Front. Nutr. 2022, 9, 851826. [Google Scholar] [CrossRef]
  28. Macdiarmid, J.I.; Kyle, J.; Horgan, G.W.; Loe, J.; Fyfe, C.; Johnstone, A.; McNeill, G. Sustainable Diets for the Future: Can We Contribute to Reducing Greenhouse Gas Emissions by Eating a Healthy Diet? Am. J. Clin. Nutr. 2012, 96, 632–639. [Google Scholar] [CrossRef] [PubMed]
  29. Fresán, U.; Martínez-González, M.A.; Sabaté, J.; Bes-Rastrollo, M. Global Sustainability (Health, Environment and Monetary Costs) of Three Dietary Patterns: Results from a Spanish Cohort (the SUN Project). BMJ Open 2019, 9, e021541. [Google Scholar] [CrossRef] [PubMed]
  30. Masset, G.; Vieux, F.; Verger, E.O.; Soler, L.-G.; Touazi, D.; Darmon, N. Reducing Energy Intake and Energy Density for a Sustainable Diet: A Study Based on Self-Selected Diets in French Adults. Am. J. Clin. Nutr. 2014, 99, 1460–1469. [Google Scholar] [CrossRef]
  31. Sugimoto, M.; Temme, E.H.M.; Biesbroek, S.; Kanellopoulos, A.; Okubo, H.; Fujiwara, A.; Asakura, K.; Masayasu, S.; Sasaki, S.; Veer, P. van’t Exploring Culturally Acceptable, Nutritious, Affordable and Low Climatic Impact Diet for Japanese Diets: Proof of Concept of Applying a New Modelling Approach Using Data Envelopment Analysis. Br. J. Nutr. 2022, 128, 2438–2452. [Google Scholar] [CrossRef] [PubMed]
  32. Food and Nutrient Database for Dietary Studies. Available online: https://www.ars.usda.gov/northeast-area/beltsville-md-bhnrc/beltsville-human-nutrition-research-center/food-surveys-research-group/docs/fndds/ (accessed on 25 September 2022).
  33. Food Patterns Equivalents Database. Available online: https://www.ars.usda.gov/northeast-area/beltsville-md-bhnrc/beltsville-human-nutrition-research-center/food-surveys-research-group/docs/fped-overview/ (accessed on 26 February 2023).
  34. What Is MyPlate?|MyPlate. Available online: https://www.myplate.gov/eat-healthy/what-is-myplate (accessed on 17 April 2023).
  35. Fulgoni, V.L., III; Keast, D.R.; Drewnowski, A. Development and Validation of the Nutrient-Rich Foods Index: A Tool to Measure Nutritional Quality of Foods. J. Nutr. 2009, 139, 1549–1554. [Google Scholar] [CrossRef] [PubMed]
  36. Drewnowski, A. Defining Nutrient Density: Development and Validation of the Nutrient Rich Foods Index. J. Am. Coll. Nutr. 2009, 28, 421S–426S. [Google Scholar] [CrossRef] [PubMed]
  37. U.S. Department of Agriculture. Thrifty Food Plan, 2021; U.S. Department of Agriculture: Washington, DC, USA, 2021.
  38. U.S. Department of Agriculture. Purchase to Plate. Available online: https://www.ers.usda.gov/data-products/purchase-to-plate/ (accessed on 21 June 2023).
  39. Drewnowski, A.; Hann, C. Food Preferences and Reported Frequencies of Food Consumption as Predictors of Current Diet in Young Women. Am. J. Clin. Nutr. 1999, 70, 28–36. [Google Scholar] [CrossRef]
  40. What We Eat in America. Available online: https://www.ars.usda.gov/northeast-area/beltsville-md-bhnrc/beltsville-human-nutrition-research-center/food-surveys-research-group/docs/wweianhanes-overview/ (accessed on 25 September 2022).
  41. Clark, M.; Springmann, M.; Rayner, M.; Scarborough, P.; Hill, J.; Tilman, D.; Macdiarmid, J.I.; Fanzo, J.; Bandy, L.; Harrington, R.A. Estimating the Environmental Impacts of 57,000 Food Products. Proc. Natl. Acad. Sci. USA 2022, 119, e2120584119. [Google Scholar] [CrossRef]
  42. Monsivais, P.; Mclain, J.; Drewnowski, A. The Rising Disparity in the Price of Healthful Foods: 2004–2008. Food Policy 2010, 35, 514–520. [Google Scholar] [CrossRef]
  43. Darmon, N.; Drewnowski, A. Contribution of Food Prices and Diet Cost to Socioeconomic Disparities in Diet Quality and Health: A Systematic Review and Analysis. Nutr. Rev. 2015, 73, 643–660. [Google Scholar] [CrossRef]
  44. Pechey, R.; Monsivais, P. Socioeconomic Inequalities in the Healthiness of Food Choices: Exploring the Contributions of Food Expenditures. Prev. Med. 2016, 88, 203–209. [Google Scholar] [CrossRef] [PubMed]
  45. Wilcox, S.; Sharpe, P.A.; Liese, A.D.; Dunn, C.G.; Hutto, B. Socioeconomic Factors Associated with Diet Quality and Meeting Dietary Guidelines in Disadvantaged Neighborhoods in the Southeast United States. Ethn. Health 2020, 25, 1115–1131. [Google Scholar] [CrossRef] [PubMed]
  46. Aggarwal, A.; Drewnowski, A. Plant- and Animal-Protein Diets in Relation to Sociodemographic Drivers, Quality, and Cost: Findings from the Seattle Obesity Study. Am. J. Clin. Nutr. 2019, 110, 451–460. [Google Scholar] [CrossRef] [PubMed]
  47. Balandrán-Quintana, R.R.; Mendoza-Wilson, A.M.; Ramos-Clamont Montfort, G.; Huerta-Ocampo, J.Á. Chapter 4—Plant-Based Proteins. In Proteins: Sustainable Source, Processing and Applications; Galanakis, C.M., Ed.; Academic Press: Cambridge, MA, USA, 2019; pp. 97–130. ISBN 978-0-12-816695-6. [Google Scholar]
  48. Mariotti, F. Plant Protein, Animal Protein, and Protein Quality. In Vegetarian and Plant-Based Diets in Health and Disease Prevention; Mariotti, F., Ed.; Academic Press: Cambridge, MA, USA, 2017; pp. 621–642. ISBN 978-0-12-803968-7. [Google Scholar]
  49. Hoehnel, A.; Zannini, E.; Arendt, E.K. Targeted Formulation of Plant-Based Protein-Foods: Supporting the Food System’s Transformation in the Context of Human Health, Environmental Sustainability and Consumer Trends. Trends Food Sci. Technol. 2022, 128, 238–252. [Google Scholar] [CrossRef]
  50. Aimutis, W.R. Plant-Based Proteins: The Good, Bad, and Ugly. Annu. Rev. Food Sci. Technol. 2022, 13, 1–17. [Google Scholar] [CrossRef]
  51. McLennon, E.; Dari, B.; Jha, G.; Sihi, D.; Kankarla, V. Regenerative Agriculture and Integrative Permaculture for Sustainable and Technology Driven Global Food Production and Security. Agron. J. 2021, 113, 4541–4559. [Google Scholar] [CrossRef]
  52. Al-Kaisi, M.M.; Lal, R. Aligning Science and Policy of Regenerative Agriculture. Soil Sci. Soc. Am. J. 2020, 84, 1808–1820. [Google Scholar] [CrossRef]
  53. Drewnowski, A.; Finley, J.; Hess, J.M.; Ingram, J.; Miller, G.; Peters, C. Toward Healthy Diets from Sustainable Food Systems. Curr. Dev. Nutr. 2020, 4, nzaa083. [Google Scholar] [CrossRef]
  54. Auestad, N.; Fulgoni, V.L. What Current Literature Tells Us about Sustainable Diets: Emerging Research Linking Dietary Patterns, Environmental Sustainability, and Economics. Adv. Nutr. 2015, 6, 19–36. [Google Scholar] [CrossRef]
Figure 1. Correlations of nutrition, environmental impact, and cost indicators measured per 100 kilocalories and the frequency of consumption measured per 1000 person-days among FNDDS foods and beverages. The correlation matrix represents the Spearman correlation coefficients between indicators measured per 100 kilocalories and 1000 person-days for all foods and beverages. Significant correlations between indicator scores are indicated as *** p-value < 0.001.
Sustainability 16 00551 g001
Figure 2. Boxplots represent the median and interquartile range of nutrition, environmental impact, and cost indicators measured per 100 kilocalories and the frequency of consumption measured per 1000 person-days within each food group. Whiskers represent 90th and 10th percentile values.
Sustainability 16 00551 g002
Figure 3. Proportions of items within each food group that received each Sustainability Index score. Dots represent individual foods and beverages within each respective portion and food group.
Sustainability 16 00551 g003
Figure 4. Median and interquartile range of nutrition, environmental impact, and cost indicators measured per 100 kilocalories and the frequency of consumption measured per 1000 person-days within plant proteins and animal proteins. Bars represent 90th and 10th percentile values. *** p-value < 0.001.
Sustainability 16 00551 g004
Figure 5. Proportions of items within the Plant Protein and Animal Protein groups that received each Sustainability Index score. Dots represent individual items within each respective portion and food group. Five example items in the highest and lowest scoring groups are presented in colored boxes. There were no items that scored zero points among Plant Proteins.
Sustainability 16 00551 g005
Table 1. Count and proportion of items in each food group that received each Sustainability Index score according to the combination of sustainability indicators for which the points were awarded. The first row in each point category represents the count and proportion of all items in each food group with the respective score. Subsequent rows in each score category represent the count and proportion of items within each score category that received points for the respective sustainability indicators. For example, 111 Fruit items received a Sustainability Index score of 2, accounting for 37.0% of all Fruit, and 8 of those items with a score of 2 received those points for nutrient density and environmental impact, accounting for 7.2% of all Fruit items that scored 2 points on the index.
Sustainability Index Score Point CombinationsFood Group
All ItemsFruitVegetablesGrainsProtein FoodsDairyBeveragesFats and OilsCondiments and SaucesDesserts and Sugars
N = 5964N = 300N = 1548N = 935N = 1462N = 284N = 345N = 108N = 181N = 801
n (%)
1 Point1916 (32.1)70 (23.3)513 (33.1)338 (36.1)435 (29.8)70 (24.6)112 (32.5)43 (39.8)63 (34.8)272 (34)
N860 (44.9)34 (48.6)298 (58.1)106 (31.4)191 (43.9)23 (32.9)46 (41.1)5 (11.6)23 (36.5)134 (49.3)
E317 (16.5)28 (40.0)156 (30.4)6 (1.8)82 (18.9)22 (31.4)3 (2.7)0 (0.0)1 (1.6)19 (7.0)
C375 (19.6)1 (1.4)45 (8.8)109 (32.2)75 (17.2)20 (28.6)22 (19.6)13 (30.2)25 (39.7)65 (23.9)
F364 (19.0)7 (10.0)14 (2.7)117 (34.6)87 (20.0)5 (7.1)41 (36.6)25 (58.1)14 (22.2)54 (19.9)
2 Points2493 (41.8)111 (37)788 (50.9)368 (39.4)526 (36.0)145 (51.1)151 (43.8)23 (21.3)79 (43.6)302 (37.7)
N–E585 (23.5)8 (7.2)405 (51.4)5 (1.4)116 (22.1)19 (13.1)9 (6.0)1 (4.3)15 (19.0)7 (2.3)
N–C441 (17.7)9 (8.1)107 (13.6)138 (37.5)35 (6.7)42 (29.0)14 (9.3)9 (39.1)10 (12.7)77 (25.5)
N–F561 (22.5)34 (30.6)128 (16.2)106 (28.8)123 (23.4)17 (11.7)55 (36.4)9 (39.1)17 (21.5)72 (23.8)
E–C275 (11.0)40 (36)20 (2.5)21 (5.7)98 (18.6)13 (9.0)44 (29.1)1 (4.3)5 (6.3)33 (10.9)
E–F192 (7.7)8 (7.2)48 (6.1)23 (6.3)38 (7.2)32 (22.1)4 (2.6)1 (4.3)4 (5.1)34 (11.3)
C–F439 (17.6)12 (10.8)80 (10.2)75 (20.4)116 (22.1)22 (15.2)25 (16.6)2 (8.7)28 (35.4)79 (26.2)
3 Points1083 (18.2)84 (28.0)210 (13.6)135 (14.4)330 (22.6)67 (23.6)61 (17.7)25 (23.1)26 (14.4)145 (18.1)
N–E–C193 (17.8)12 (14.3)15 (7.1)4 (3.0)97 (29.4)4 (6.0)23 (37.7)15 (60)3 (11.5)20 (13.8)
N–E–F254 (23.5)9 (10.7)142 (67.6)22 (16.3)27 (8.2)23 (34.3)9 (14.8)0 (0.0)7 (26.9)15 (10.3)
N–C–F288 (26.6)31 (36.9)33 (15.7)75 (55.6)40 (12.1)13 (19.4)14 (23.0)10 (40.0)12 (46.2)60 (41.4)
E–C–F340 (31.4)24 (28.6)20 (9.5)34 (25.2)166 (50.3)27 (40.3)15 (24.6)0 (0.0)4 (15.4)50 (34.5)
4 Points165 (2.8)13 (4.3)14 (0.9)11 (1.2)102 (7.0)1 (0.4)2 (0.6)4 (3.7)3 (1.7)15 (1.9)
N = Nutrient density, E = Environmental Impact, C = Cost, F = Frequency of Consumption.
Disclaimer/Publisher’s Note: The statements, opinions and data contained in all publications are solely those of the individual author(s) and contributor(s) and not of MDPI and/or the editor(s). MDPI and/or the editor(s) disclaim responsibility for any injury to people or property resulting from any ideas, methods, instructions or products referred to in the content.

