Abstract
Selenium is an indispensable trace element in the human body that plays an important role in maintaining life activities. The consumption of Se-rich crops provides a practical and effective way for the body to supplement Se. However, the Se content in crops is affected by the soil Se content and the interactions between other elements in the soil. In this study, the Tibetan Plateau of China was chosen as the study area. The random forest algorithm was applied to select four key indicators—selenium (Se), bioavailable phosphorus (P), cadmium (Cd), and bioavailable copper (Cu)—from 29 soil variables to predict the Se content in rapeseed, wheat, potato, pasture, and chrysanthemum crops. The results showed that, despite the rich soil Se resources in the Tibetan Plateau, only 20% of the crop samples met the national Se enrichment standard (>0.07 mg kg−1). Compared with the traditional multiple linear regression method, the random forest model is more accurate, efficient, and reliable in predicting the Se content of crops. In cross-species crop prediction, which refers to the simultaneous cultivation and analysis of multiple distinct crop species within the same agricultural setting, the random forest model demonstrated superior performance, marking a significant breakthrough in cross-species crop research. This approach effectively eliminates the tedious process of conducting repetitive individual evaluations for different crop types in the same region, highlighting its innovative significance. Meanwhile, the Tibetan Plateau, known as the “Roof of the World”, is also of great research value. These results provide valuable references for the planning and management of Se-enriched farmlands, which will help improve the yield and quality of Se-enriched crops and promote the growth of farmers’ interests.
1. Introduction
Selenium is an indispensable trace element in the human body, and its importance cannot be ignored []. It is an important component of antioxidant enzymes that scavenge free radicals and protect cells from oxidative damage [,]. A deficiency of Se in the body may induce health problems such as osteoarthritis, Creutzfeldt–Jakob disease, and immune deficiency [], due to its critical role in maintaining the cellular integrity and the proper functioning of the immune system. Se intake in humans is usually low and rarely excessive, and its bioavailability also depends on its chemical form []. Se occurs predominantly in the Earth’s crust and is assimilated into the human body via the terrestrial vegetation interface within the food web structure []. Specifically, plants convert selenium into a bioavailable form through photosynthesis, a process that has a direct impact on the uptake of selenium through food by humans and animals [,]. The concentration of Se in the Earth’s crust serves as a crucial metric for evaluating its bioavailability, and an assessment of Se bioavailability based only on aggregate Se levels in the soil can lead to imprecise conclusions []. The Se content in crops is controlled by the soil pseudototal content, and the level of bioavailable Se is a key factor in determining the Se content of crops and Se transport behavior and toxicity in organisms []. Thus, a comprehensive understanding of the geochemical characteristics pertaining to Se within cultivable soils and its build-up pattern in crops is of substantial importance for advancing the cultivation of Se-enriched farms in specific regions and enhancing the protection of public health and well-being.
Worldwide, the geochemical dispersion of Se within soils exhibits pronounced heterogeneity, with international variations in the Se concentration of soils ranging from 0.01 to 2.00 mg kg−1 and an average concentration of 0.40 mg kg−1 []. China is a Se-deficient country, with approximately 51% of its land area being Se deficient []. Therefore, it is crucial to develop and utilize Se-enriched farmland. The consumption of Se-enriched crops is the safest, most effective, and most scientific method of Se supplementation for the human body []. It is particularly important to develop Se-enriched agriculture to provide people with rich and diverse Se-enriched crops [].
Traditional studies on soil–plant elemental content relationships are typically limited to a single crop species, for example, analyzing only specific crops such as rice and wheat. However, the study area is often characterized by the coexistence of multiple crops. This makes traditional research methods complicated and inefficient, making it difficult to fully reveal the commonalities and differences in element uptake and accumulation among different crops in the same soil environment. For example, Xu et al. [] indicated that rice kernels have an average Se concentration of 0.032 mg kg−1, which is below the accepted threshold for Se concentration in Se-fortified rice kernels (0.04 mg kg−1). Additionally, Kong et al. [] determined that applying N to areas with heightened Se levels influences the Se levels within the grains of Triticale Wittmack. Qian et al. [] found that cultivation led to an overall 9.5% decrease in the Se content in farmland across the country, and that, subject to geoclimatic conditions, the decrease in Se content was even greater when the number of crop rotations increased. The involvement of multiple crops in the study area is expected to shorten the research cycle and promote the unification and integration of research planning by efficiently and accurately revealing the interrelationships between soil and plant elements of different species, which will provide strong support for scientific research and agricultural production.
Dubbed the “Water Tower of China”, the Tibetan Plateau is essential for the worldwide hydrological cycle, carbon sequestration, biodiversity preservation, and livestock rearing [,]. Agricultural production on the plateau is constrained by the limited arable land and a sparse population, resulting in a single, low-intensity structure and slow development []. The region’s fragile ecosystem, once damaged, is difficult to repair [,]. A geochemical survey of eastern Qinghai provides a scientific basis for optimizing agricultural layouts and improving land-use efficiency. Researchers [,] have used multivariate linear regression (MLR) models because of the strong relationship between soil physicochemical indicators and Se bioconcentration coefficients to achieve an accurate prediction of the Se content in crops. MLR models have a wide range of applications for the analysis of agricultural soil conditions. Nevertheless, given the intricate interactions among pollutants, soil, and crops within extensive agricultural settings, conventional MLR models often struggle to precisely forecast nonlinear dynamics within the soil–plant matrix []. Recently, the random forest model has demonstrated considerable promise for the prognostication of complex systems. It does not need to consider the interrelationships between variables, is not bound by the assumptions of linear regression models, and maintains a stable predictive performance even in the absence of variables []. This model improves the accuracy of the prediction of the target variables, particularly when dealing with multidimensional feature datasets, and quantifies and ranks the contributions of different factors to the variables, which is a significant advantage over other nonlinear regression models and provides strong support for high-precision prediction.
The novelty of this study lies in transcending the confines of earlier research that posited a sole correlation between crop Se content and soil Se content and employed random forest for prognostication to identify the optimal marker over soil-bioavailable Se to strategize the growth of Se-fortified crops. Streamlining the selection of alternative indicators in planning for Se-enriched crops simplifies the planning model, reduces operational difficulties, improves the efficiency of implementation, and reduces the challenges of data collection and measurement, thus realizing the economics of planning for Se-enriched crops. Although previous studies have often been limited to the elemental evaluations of single crops, this study is the first to be conducted across species boundaries, which is a significant innovation.
2. Materials and Methods
2.1. Study Area
The research zone (Figure 1) resides within the Xining-Ledu region, distinguished as a customary zone for agricultural and pastoral transition, and is an area rich in Se on the Tibetan Plateau, with an area of 1500 km2. Characterized by low and medium hills devoid of irrigation, the elevation ranges from 2400 to 2800 m above sea level. It receives yearly rainfall amounting to 350–450 mm and experiences a semiarid continental climate. Soil genesis within the study area is largely attributable to Quaternary alluvial flood sediments, loess, and Tertiary red-layer substances. The predominant crops in this region are garlic (Allium sativum L.), wheat (Triticum aestivum L.), and oilseed rape (Brassica napus L.). The land-use types include cropland, grassland, and woodland, and the soil is mainly chestnut soils [].
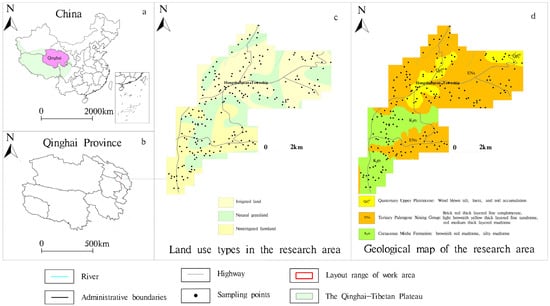
Figure 1.
Location of the study area, geological profile, and map of sampling points.
2.2. Soil Data Collection and Analysis
The soil sample points were arranged based on representativeness as the first principle. According to the Specification for Geochemical Evaluation of Land Quality (DZ/T0295-2016 []), the field point arrangement was based on a 1:50,000 topographic map, and the uniformity and representativeness of the points were considered. The sampling depth was 0–20 cm, and the point density was set according to 4 points/km2–6 points/km2, with the points encrypted in the agricultural area and appropriately thinned in mountainous areas with larger patches such as forests and grasslands. A total of 200 soil samples were collected in this study, and each soil sample corresponded to a plant sample. A total of 200 crop samples were collected, including 79 wheat (Triticum aestivum L.), 64 rapeseed (Brassica campestris Linn.), 31 potato (Solanum tuberosum L.), 23 pasture (Medicago sativa L.), and 3 chrysanthemum (Helianthus tuberosus L.) samples for cross-species crop research.
The soil samples were collected, decontaminated, and bagged. The collected samples were then dried in a cloth bag under sunlight and rubbed to prevent gumming. After drying, the samples were pounded using a mallet to a natural grain size, passed through a 20-mesh nylon sieve, mixed with the lower part of the sieve, and packed in sample bags. The weight of the analyzed sample was ≥200 g, and it was sent to the laboratory for testing and analysis (Text S1).
In this study, analytical testing of the soil samples was mainly performed by the Mineral Resources Supervision and Testing Center in Hefei, Anhui Province. Quality control was ensured by inserting national-level standards into each batch of samples and analyzing them simultaneously with the actual samples. The results demonstrated a one-time passing rate of 100% for all elements. The crop samples were tested using a multi-objective analytical method package, with relative errors calculated and found to be within the standardized range. Additionally, pH values were controlled using national-level soil effective state standards, resulting in a 100% one-time pass rate (Table S1).
2.3. Predictive Model Building
The bioconcentration factor (BCF) was originally used to quantify the degree of enrichment of organic compounds in organisms and is a key indicator for assessing trends in chemical accumulation in organisms [,,]. This can be applied to agroecosystems to determine how crops can take up heavy metals present in the soil, as follows:
where the quantified i-element content within the crop and the corresponding rhizosphere soil is denoted, with a higher BCF value signifying a greater capacity of the crop to take up and accumulate heavy metals.
BCF = Ci/Di
2.3.1. Random Forest Model
Random forest operates through a methodological process that utilizes binary trees for classification or regression to secure precise forecasts and assigns ranks to explanatory variables based on their significance [,]. Within this ensemble, individual trees were formulated from independently sampled random vector values to ensure uniformity across the forest. This architecture endows random forests with superior generalization capabilities; with the expansion of the tree count within the ensemble, there is a progressive reduction in the generalization error approaching a theoretical threshold [].
In this study, the Tree Bagger function in MATLABR2023b was used for random forest modeling. This function utilizes the functionality of a regression tree to construct decision trees, after which multiple grouping methods are used to integrate multiple decision trees and construct a robust random forest model [,]. In concrete terms, we stored the dataset in Excel 2021 firstly, read the file, and loaded the data into the program. Subsequently, we performed data processing, including handling missing values, outliers, and duplicates, and divided the dataset into 65% training data and 35% testing data []. The training data were used to train the model, and the testing data were used to evaluate its performance. We employed a random forest model to predict plant Se uptake, initially selecting 29 soil elements as inputs. After performing a correlation analysis to remove highly correlated variables, we used the feature importance scores from the random forest to identify the most influential variables. To assess the relationship between the selected indicators and Se uptake, we conducted a Pearson correlation significance test, which revealed the strength and direction of the correlations. Finally, based on the analysis results, we predicted new data and estimated their significance.
2.3.2. MLR Model
MLR is a statistical approach aimed at establishing a linear relationship between a dependent variable and multiple independent variables []. This technique is suitable for scenarios in which parameters interact linearly, given that it estimates outcomes based on the presupposition of linear input configurations []. The MLR model was developed and established by previous authors [,] and has been applied previously. In this study, based on existing research combined with the current situation in the study area, the MLR model was developed using the following formula:
where a, b, and n denote the regression coefficients, whereas A, B, and N denote the distinct soil attributes ascertained through their respective correlation coefficients linked to the Se BCF in crops.
lg (BCFSe) = a + b × g (A) + c × lg (B) +⋯+ n × lg (N)
3. Results and Discussion
3.1. Characterization of Surface Soil Se Content
According to the results of this study, the selenium content in the surface soil of the study area ranged from 0.093 to 2.028 mg kg−1, with a mean value of 0.315 mg kg−1. while the background value was 0.28 mg kg−1, which is beneath China’s average soil Se concentration of 0.29 mg kg−1. Furthermore, the variation coefficient for surface soil Se within the area was 0.72, classifying it within the category of significant fluctuation, signifying a nonuniform distribution of soil Se content in the region.
Figure 1 and Figure 2 depict the geological profiles and spatial patterns of Se within the study zone. The spatial distribution of soil Se is closely related to the geological background, topography, geomorphology, soil formation processes, and parent material []. As a decisive factor for Se-rich soils, the outcrop area of the Xining Group stratigraphy is generally consistent with the distribution of the high-Se zone. The sedimentary environment, paleogeography, and paleoclimate also influenced the enrichment and storage patterns of Se in the strata []. Differences in the soil-forming matrices lead to differences in the soil Se content, with soil Se developed on loess matrices generally having a low Se content, whereas the soil Se content developed on Tertiary red-bedded material depends on the Se content of the matrices. In addition, the water system also had an obvious influence on the distribution of soil Se, and the high-Se-value areas often extended along the water system, particularly on both sides of the river, with a strong alluvial transport capacity [].
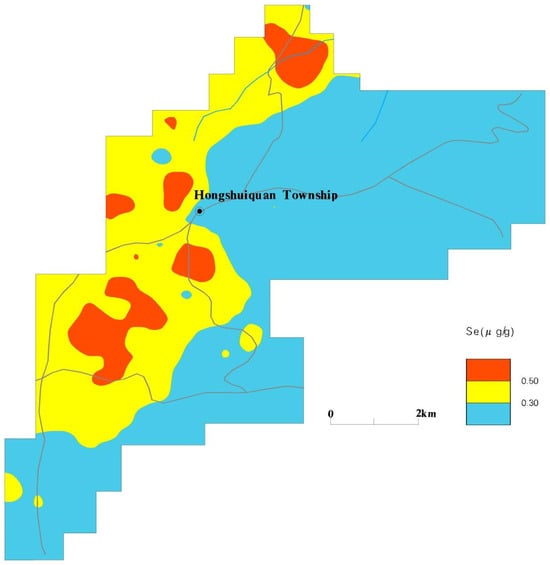
Figure 2.
Spatial distribution of Se.
3.2. Se Content in Soil–Plant Ecosystems
Table 1 shows the Se levels in the crop and rhizosphere soils of the study area. According to Chinese Se nutritional standards, crops containing > 0.07 mg kg−1 are designated as Se enriched. However, only 20% of the agricultural yield in the area met this criterion. A correlation coefficient of 0.63 for Se levels between crops and rhizosphere soil was noted, associated with a p-value < 0.001. As shown in Figure 3 and Figure 4, a pronounced correlation emerged between Se concentrations in crops and root soil, with 52% of the high-Se crops located in Se-abundant regions. This suggests that sources other than soil Se contribute to the Se content in crops.

Table 1.
Se content in soil–plant system and BCFSe.
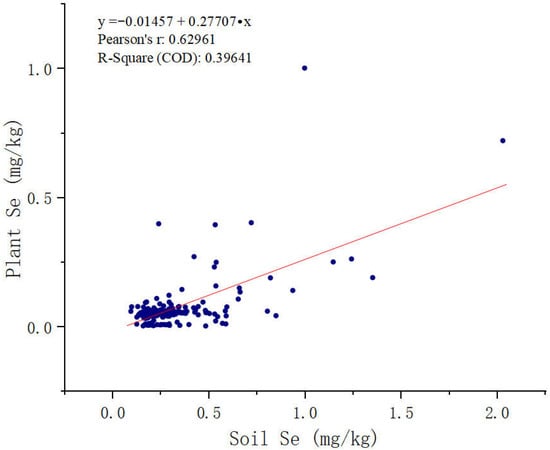
Figure 3.
Relationship between soil Se content and crops.
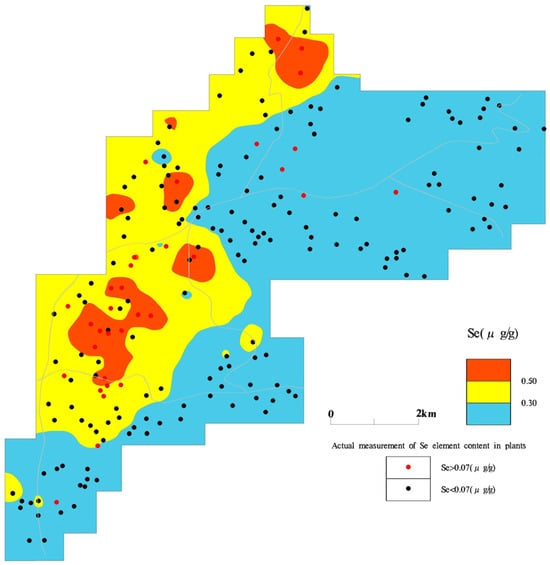
Figure 4.
Spatial distribution of soil Se content and crop Se content.
3.3. Modeling Predictions Using Random Forests
Using MATLABR2023b software, we screened all the indicators that were measured in the soil to determine the most suitable indicators affecting the uptake of Se by crops. However, we observed a considerable deviation between the predicted and true values; the p-value of the significance test was high, and the R2 value was relatively low (0.1291). This R2 value indicates that the model explains only 12.91% of the variance in the observed data, reflecting a relatively weak fit. Nevertheless, the correlation between the predicted and observed values was positive, suggesting that, as the observed values increase, the predicted values also tend to increase, despite the low accuracy. The current stochastic model, therefore, requires further optimization and improvement.
We selected four significant variables for the remodeling analysis (Table 2). The specific result analysis diagrams utilizing the random forest model for prediction can be found in the Supplementary Materials (Figures S1–S5). The significance test revealed a significant increase in R2 compared to the pre-screening period. The analysis results (Figure 5) showed that the four variables obtained from screening (Se, bioavailable P, Cd, and bioavailable Cu) were better fitted to crop Se, with larger R2 values and better random effects.

Table 2.
p and R2 corresponding to the number of different variables.
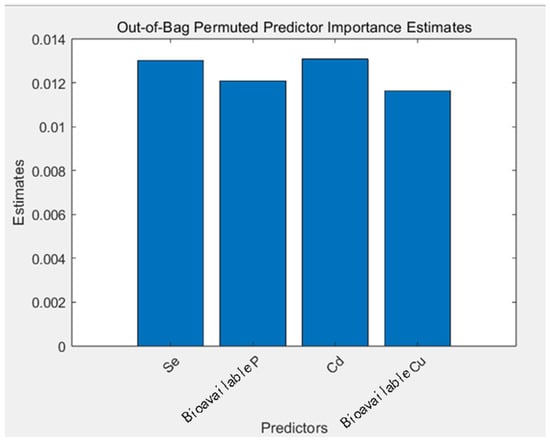
Figure 5.
Importance estimation of five selected elements after selection.
The results show that the accuracy of the results was not related to the number of elements but to the correlation between the elements. Through scientific screening and rational modeling, the intrinsic relationships between variables can be revealed more accurately, thereby enhancing the effectiveness of the prediction model.
3.4. Effect of Soil Elements on Se Uptake by Crops
Figure 6 illustrates that the Pearson’s correlation coefficient was employed to assess the association between BCFSe and soil characteristics, delving into the details of Se accumulation in crops. These findings indicated a negative correlation between crop BCFSe and soil Se, bioavailable P, Cd, and bioavailable Cu.
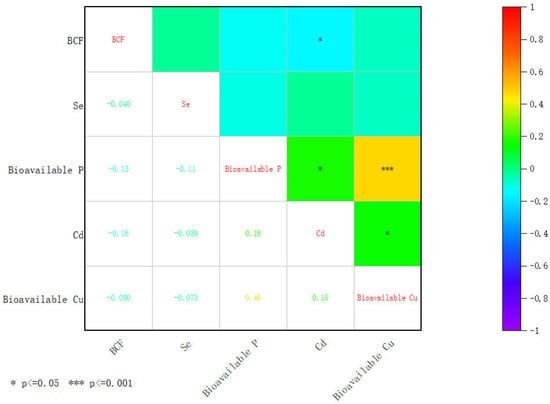
Figure 6.
Correlation matrix between Se content in crops and soil indicators in the study area.
Wang et al. [] showed that the overall effectiveness of soil Se is low in the Se-rich areas of Enshi. Further study found that the higher the effective Se content in the soil, the higher the Se content in potatoes. This suggests that the level of Se in crops depends on the bioavailable Se content in the soil rather than on the pseudototal content of Se. The soil pseudototal Se content represents the potential supply capacity of Se in the soil and has a direct constraint on the soil bioavailable Se content []. Therefore, although the total selenium content of the soil is high, if the effective selenium content is not high, then the uptake of selenium by the crops will be limited.
Phosphorus is an essential bulk element for crop growth []. Se interacts significantly with phosphorus during plant growth []. For example, Liu et al. [] showed that increasing the P supply decreased the Se content and Se accumulation in winter wheat stems and leaves. Zhao et al. [] found that a high-P treatment significantly reduced Se content in the lower part of cabbage compared to a low-P treatment. Therefore, the bioavailable P in the soil inhibits the uptake of Se by crops.
Cadmium is a highly toxic and biologically active heavy metal widely distributed in terrestrial ecosystems []. Tie et al. [] found that, in living organisms, Cd2+ is transported in a manner similar to Ca2+ and Mg2+ and can enter cells or block cellular channels through channels such as Ca2+ and Mg2+ ions. Se and Cd compete for ion channels. Therefore, the Cd content in the soil inhibits the uptake of Se by crops.
Cuprum is predominantly in organically bound and residual states []. There is an antagonistic effect between moderate amounts of Se and Cu, whereas high levels of Cu stress cause more Se to be retained in the roots of Brassica napus []. Therefore, the Cu content in the bioavailable state of the soil inhibits the uptake of Se by crops.
3.5. Construction of Prediction Model for Se Enrichment Coefficient of Crops
Following the preceding discussion, Se, bioavailable P, Cd, and bioavailable Cu were selected as predictive variables to develop a crop Se enrichment coefficient model. Of the 200 crop samples gathered within the study area, 80% were systematically selected for model construction, with the remaining 20% reserved for validation. A thorough examination of the evaluation matrices from the random forest and MLR models revealed the efficacy of each model in forecasting the Se enrichment coefficients in crops, thus laying a scientific foundation for agricultural production practices.
As shown in Table 3, the random forest model exhibited higher R2 and lower RMSE values. This is good evidence that the random forest model has high accuracy in predicting the bioenrichment factor of crop Se. As shown in Figure 7, the random forest model outperformed the MLR model with a more pronounced slope of fit. These findings indicated that the random forest model achieved superior predictive precision over the MLR model when elucidating the intricate nonlinear interdependencies between crop Se enrichment factors and soil Se, bioavailable P, Cd, and bioavailable Cu.

Table 3.
Evaluation matrices for multiple linear regression (MLR) and random forest (RF) models.
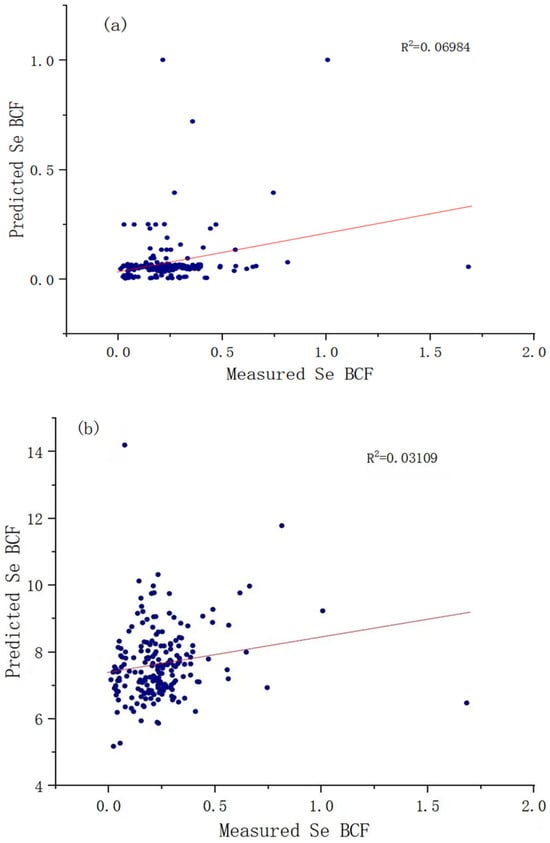
Figure 7.
Comparison of BCFSe measured values with random forest and MLR model predicted values: (a) random forest model; (b) MLR model.
3.6. Development and Utilization of the Random Forest Model in Se-Enriched Crops
In conclusion, the Se content in soil does not conclusively determine the Se levels in crops. Figure 8 shows the precise forecasting process of the random forest model, which corresponds more accurately to the actual conditions than the MLR model. This indicates that the random forest model has significant advantages in terms of its accuracy and precision. Previous studies have mainly focused on the relationship between single crops and soil elements [,]; however, when multiple crops exist in the same area, multiple repetitive evaluations are required, which increases the complexity and workload of the study.
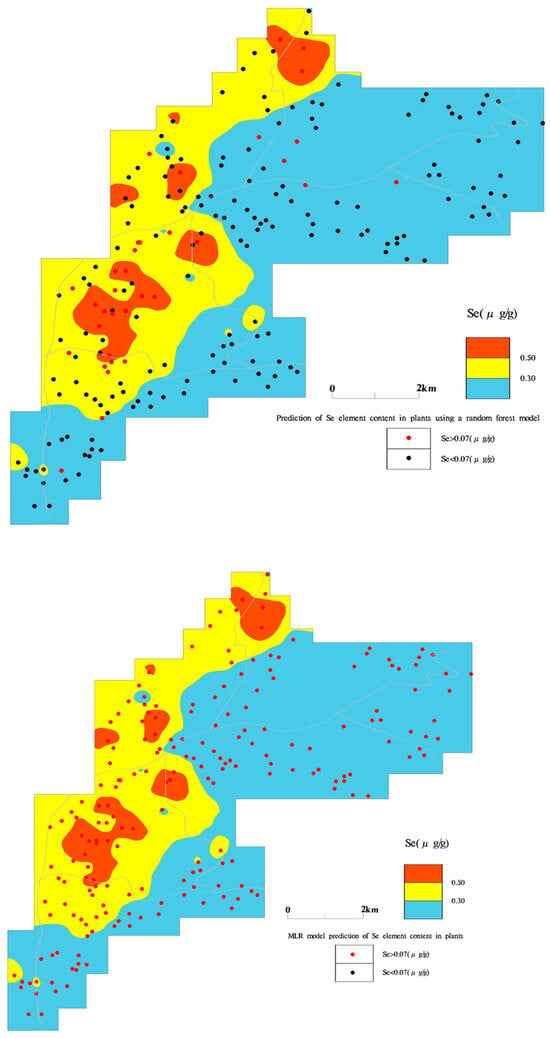
Figure 8.
Predictions of naturally Se-enriched crops in agricultural fields across the entire study area using random forest and MLR models ((top): random forest model, (bottom): MLR Model).
4. Conclusions
In this study, it was found that the Se content of crops was related to the Se content of the soil and was jointly influenced by various soil indicators. Using a random forest model, Se, bioavailable P, Cd, and bioavailable Cu were successfully selected as alternative indicators, which significantly simplified the planning process for Se-enriched crops and improved prediction accuracy. Compared to the MLR model, the random forest model showed better performance in predicting the Se content of crops. More importantly, this study achieved cross-species crop prediction using the random forest model for the first time, which overcomes the limitations of predicting a single crop and provides a more comprehensive and accurate tool for regional agricultural planning. Using this method, we can predict the Se content of different crops more accurately and provide a reliable decision-making basis for the scientific planning and management of Se-enriched farmlands. The methodology of this study demonstrates cross-regional applicability and aids in exploring other elements closely related to Se-rich crops, thus offering a valuable approach for optimizing the planning process. Although significant results were achieved in the study area, the applicability of the method to different crops and regions requires further exploration to provide more comprehensive and precise decision support for the sustainable development of Se-rich agriculture.
Supplementary Materials
The following supporting information can be downloaded at: https://www.mdpi.com/article/10.3390/su16198679/s1, Table S1. Analysis methods and detect limits for samples; Text S1. Preliminary processing of soil samples; Figure S1. Comparison of predicted values and actual values before selection; Figure S2. Significance test before selection; Figure S3. Importance estimation before selection; Figure S4. Comparison of predicted and actual values after selection; Figure S5. Significance test after selection.
Author Contributions
Conceptualization, G.M.; methodology, Q.Z.; software, Y.N. and Q.Z.; validation, S.W., L.H. and M.Z.; formal analysis, M.Z.; investigation, Y.N. and Q.M.; resources, Q.M.; data curation, G.M.; writing—original draft preparation, Y.Z.; writing—review and editing, K.X. and Q.Z.; visualization, S.W.; supervision, K.X.; project administration, L.H.; funding acquisition, Y.Z. All authors have read and agreed to the published version of the manuscript.
Funding
This work was supported by Provincial Geological Exploration Special Funds Project in Qinghai Province (No. [2010]96) provided by the Qinghai Provincial Department of Natural Resources.
Institutional Review Board Statement
Not applicable for studies not involving humans or animals.
Informed Consent Statement
Not applicable for studies not involving humans.
Data Availability Statement
The data presented in this study are available on request from the corresponding author.
Conflicts of Interest
The authors declare no conflict of interest.
References
- Mattioli, S.; Dal Bosco, A.; Duarte JM, M.; D’Amato, R.; Castellini, C.; Beone, G.M.; Fontanella, M.C.; Beghelli, D.; Regni, L.; Businelli, D.; et al. Use of Selenium-enriched olive leaves in the feed of growing rabbits: Effect on oxidative status, mineral profile and Selenium speciation of Longissimus dorsi meat. J. Trace Elem. Med. Biol. 2019, 51, 98–105. [Google Scholar] [CrossRef] [PubMed]
- Liu, L. The indispensable microelement of human bodies-selenium. Heilongjiang Sci. 2014, 5, 16–17. [Google Scholar]
- Proietti, P.; Trabalza Marinucci, M.; Del Pino, A.M.; D’Amato, R.; Regni, L.; Acuti, G.; Chiaradia, E.; Palmerini, C.A. Selenium maintains Ca2+ homeostasis in sheep lymphocytes challenged by oxidative stress. PLoS ONE 2018, 13, e0201523. [Google Scholar] [CrossRef]
- Huang, J.G.; Wang, H.W.; Peng, X.Q.; Yao HY, Y.; Nie, S.P. Research Progress on Interaction between Selenium and Cadmium in Selenium-Rich Agricultural Products. Food Res. Dev. 2024, 45, 194–199. Available online: https://link.cnki.net/urlid/12.1231.TS.20231026.1518.002 (accessed on 1 May 2024).
- D’Amato, R.; Regni, L.; Falcinelli, B.; Mattioli, S.; Benincasa, P.; Dal Bosco, A.; Pacheco, P.; Proietti, P.; Troni, E.; Santi, C.; et al. Current Knowledge on Selenium Biofortification to Improve the Nutraceutical Profile of Food: A Comprehensive Review. J. Agric. Food Chem. 2020, 68, 4075–4097. [Google Scholar] [CrossRef]
- Cai, L.M.; Wang, S.; Wen, H.H.; Luo, J.; Jiang, H.H.; He, M.H.; Mu, G.Z.; Wang, Q.S.; Wang, H.Z. Enrichment spatial distribution characteristics of soil selenium and its influencing factors. Trans. Chin. Soc. Agric. Eng. 2019, 35, 83–90. [Google Scholar] [CrossRef]
- Terry, N.; Zayed, A.M.; De Souza, M.P.; Tarun, A.S. Selenium in higher plants. Annu. Rev. Plant Physiol. Plant Mol. Biol. 2000, 51, 401–432. [Google Scholar] [CrossRef]
- Wang, R.Q.; Zhang, Z.M.; Chao, X.; Feng, H.Y.; Yang, Z.F. A study of the Selenium speciation in paddy soil and status of selenium enriched rice in western part of Ankang City, Shaanxi Province. Geol. China 2022, 49, 398–408. Available online: https://link.cnki.net/urlid/11.1167.P.20201019.1838.020 (accessed on 1 May 2024).
- Li, Y.C.; Liu, J.F.; Li, X.Z.; Zhang, D.; Chen, G.D.; Du YC, Z.; Zhou, W.H. Selenium Occurrence Characteristics and Bioavailability of Soil in the Hinterland of the Hetao Plain. Environ. Sci. 2024, 1–14. [Google Scholar] [CrossRef]
- Huang, X.B.; Pan, Z.P.; Shao, M.Y.; Chen, T. Geochemical characteristics and occurrence forms of soil selenium in sorghum base of Maoba Town, Renhuai City. Hubei Agric. Sci. 2024, 63, 50–54, 66. [Google Scholar] [CrossRef]
- Gitelson, A.; Merzlyak, M.N. Spectral reflectance changes associated with autumn senescence of Aesculus hippocastanum L. and Acer platanoides L. leaves. Spectral features and relation to chlorophyll estimation. J. Plant Physiol. 1994, 143, 286–292. [Google Scholar] [CrossRef]
- Yang, B.; Liu, X.X.; Huang, M.W. Present situation and countermeasures of selenium-rich agricultural product processing industry in Guigang City. S. China Agric. 2023, 17, 220–223, 229. [Google Scholar] [CrossRef]
- Xu, Z.Q.; Zhou, W.J.; Zhou, Y.Z.; Cui, H.J.; Liu, R.; Shang, G.D. Factors controlling accumulation and bioavailability of selenium in paddy soils: A case study in Luxi County, China. Environ. Pollut. 2023, 348, 123196. [Google Scholar] [CrossRef] [PubMed]
- Kong, W.L.; Huo, R.W.; Lu, Y.; Fan, Z.J.; Yue, R.Q.; Ren, A.X.; Li, L.H.; Ding, P.C.; Ren, Y.K.; Gao, Z.Q.; et al. Nitrogen Application Can Optimize Form of Selenium in Soil in Selenium-Rich Areas to Affect Selenium Absorption and Accumulation in Black Wheat. Plants 2023, 12, 4160. [Google Scholar] [CrossRef] [PubMed]
- Qian, L.; Wang, T.; Shi, Y.J.; Xu, Q.Y.; Zhou, X.; Ke, L.J.; Liang, R.Y.; Fu, C.C.; Zheng, X.Q.; Sun, G.X. Topsoil selenium (Se) under Se-rich farming in China: Current status, cropping impacts and ecological risk assessment. J. Environ. Manag. 2023, 345, 118918. [Google Scholar] [CrossRef]
- Guan, Z.H.; Li, X.G.; Wang, L. Heavy metal enrichment in roadside soils in the eastern Tibetan Plateau. Environ. Sci. Pollut. Res. Int. 2018, 25, 7625–7637. [Google Scholar] [CrossRef]
- Dai, L.C.; Cao, Y.F.; Ke, X.; Zhang, F.W.; Du, Y.G.; Guo, X.W.; Cao, G.M. Response of reference evapotranspiration to meteorological factors in alpine meadows on the Qinghai-Tibet Plateau. Pratacultural Sci. 2018, 35, 2137–2147. [Google Scholar] [CrossRef]
- Nan, W.G.; Dong, Z.B.; Xue, L.; Zhang, Z.; Ha, Y.Q.; Shao, T.J. Distribution Characteristics and Ecological Risk Assessment of Heavy Metals in Roadside Soil of Important Transportation Countries on the Qinghai-Tibet Plateau. Environ. Sci. 2023, 45, 4825–4836. [Google Scholar] [CrossRef]
- Li, W.M.; Sun, Z.; Chen, X.Y. Evaluation and Source of Heavy Metal Pollution in Surface Soils in Typical Alpine Agricultural Areas of Qinghai Province. Rock Miner. Anal. 2023, 42, 598–615. [Google Scholar] [CrossRef]
- Zhang, Y.F.; Yao, Z.; Ma, Q.; Shen, X.; Wang, S.; He, L.Z.; Dai, L.; Han, W.M. Selenium Accumulation of Natural Selenium-Rich Garlic in Alkaline Soil Area of Qinghai Province. J. Shanxi Agric. Sci. 2024, 52, 101–106. [Google Scholar] [CrossRef]
- Chen, Z.W.; Xu, J.; Yang, S.Y.; Hou, Z.L.; Yang, F.; Zhang, F.G.; Yu, L.S. Spatio-temporal distribution and influencing factors of selenium in soil-crop system from the plateau basin region, Northeastern Yunnan. China Environ. Sci. 2023, 43, 781–792. [Google Scholar] [CrossRef]
- Bi, W.D.; Ding, C.F.; Zhou, Z.G.; Wang, X.X. Prediction of cadmium bioconcentration factor for peanuts based on machine-learning methods. J. Agro-Environ. Sci. 2024, 43, 1230–1238. Available online: https://link.cnki.net/urlid/12.1347.S.20240319.1126.004 (accessed on 11 May 2024).
- Pan, Y.X.; Chen, M.; Wang, X.T.; Liu, N. Analysis of influencing factors and bioavailability prediction of soil heavy metals based on RF and MLR. J. Agro-Environ. Sci. 2024, 43, 845–857. Available online: https://kns.cnki.net/kcms2/detail/12.1347.s.20230726.1027.002.html (accessed on 1 May 2024).
- Bagrintseva, V.N.; Nosov, V.V. Potassium nutrition for small grains grown on chestnut soils. Better Crops Plant Food 2012, 96, 29–31. [Google Scholar]
- DZ/T0295-2016; Code for Evaluation of Land Quality Geochemistry. Ministry of Housing and Urban-Rural Development: Beijing, China, 2016.
- Hu, X.G.; Tan, J.Y.; Qin, X.T.; Ma, W.F.; Qin, X.; Luo, H.; Huang, Z.W.; Li, Z.C. Enrichment Characteristics and Influencing Factors of Heavy Metal Elements in Crops from the Primary Cultivated Areas of Tian’e County, Guangxi. Geoscience 2024, 38, 784–792. [Google Scholar] [CrossRef]
- Gou, T.Z.; Song, W.; Yan, H.G. Accumulation of heavy metal in 11 native plants growing in mercury(gold)-mining area of Danzhai County. J. Biol. 2021, 38, 72–76. [Google Scholar] [CrossRef]
- Li, Z.L.; Xie, Q.; Zeng, Z.; Zhang, J.B.; Feng, Y.M.; Lai, Y.P.; Lin, L.L. Enrichment and Migration of Heavy Metals in Mangrove Soil-Plant System from Sea Promenade in Zhanjiang. Trop. Geogr. 2021, 41, 398–409. [Google Scholar] [CrossRef]
- Vilchez-Mendoza, S.; Romero-Gurdián, A.; Avelino, J.; DeClerck, F.; Bommel, P.; Betbeder, J.; Cilas, C.; Bagny, B.L. Assessing the joint effects of landscape, farm features and crop management practices on berry damage in coffee plantations. Agric. Ecosyst. Environ. 2022, 330, 107903. [Google Scholar] [CrossRef]
- Muhammad, S.; Wuyts, K.; Samson, R. Atmospheric net particle accumulation on 96 plant species with contrasting morphological and anatomical leaf characteristics in a common garden experiment. Atmos. Environ. 2019, 202, 328–344. [Google Scholar] [CrossRef]
- Breiman, L. Random Forests. Mach. Learn. 2001, 45, 5–32. [Google Scholar] [CrossRef]
- Wang, Q.; Chen, H. Optimization of parallel random forest algorithm based on distance weight. J. Intell. Fuzzy Syst. 2020, 39, 1951–1963. [Google Scholar] [CrossRef]
- Cheng, J.L.; Liu, Y.D.; Qin, T.Y.; Wang, Y.H.; Fan, Y.F.; Yao, P.F.; Sun, C.; Bi, Z.Z.; Bai, J.P. Estimation of Chlorophyll Content in Potato Leaves Based on Machine Learning. Spectrosc. Spectr. Anal. 2024, 44, 1117–1127. [Google Scholar]
- Vrigazova, B. The Proportion for Splitting Data into Training and Test Set for the Bootstrap in Classification Problems. Bus. Syst. Res. J. 2021, 12, 228–242. [Google Scholar] [CrossRef]
- Ozsahin, D.U.; Duwa, B.B.; Ozsahin, I.; Uzun, B. Quantitative Forecasting of Malaria Parasite Using Machine Learning Models: MLR, ANN, ANFIS and Random Forest. Diagnostics 2024, 14, 385. [Google Scholar] [CrossRef] [PubMed]
- Liao, Q.L.; Liu, C.; Cai, Y.M.; Zhu, B.W.; Wang, C.; Hua, M.; Jin, Y. A preliminary study of element bioconcentration factors within milled rice and wheatmeal in some typical areas of Jiangsu Province. Geol. China 2013, 40, 331–338. Available online: http://geochina.cgs.gov.cn/cn/article/id/20130123 (accessed on 1 May 2024).
- Liang, S.; Zhu, J.X.; Dai, H.M.; Song, Y.H.; Liu, K.; Han, X.M.; Zhai, F.R. Migration and Enrichment of Selenium in Soil-Plant System in Baiquan Area, Heilongjiang Province. Geol. Resour. 2021, 30, 456–464, 478. [Google Scholar] [CrossRef]
- An, R.; Sun, W.G. Formation and Distribution of Selenium Rich Soil in Tailai Basin and Its Relationship to the Geologic Structure. J. Anhui Agric. Sci. 2011, 39, 6488–6490. [Google Scholar]
- Sheshnitsan, S.; Kapitalchuk, M.; Golubkina, N. Peculiarities of selenium bioaccumulation under contrasting landscape and geochemical conditions. Bull. Mosc. State Reg. Univ. Nat. Sci. 2016, 4, 67–77. [Google Scholar] [CrossRef][Green Version]
- Shao, Y. Distribution Characteristics, Controlling Factors and Ecological Effects of Se in the Geographical Environment of Small Watershed in Guilin Se-Enriched Longevity Area. Ph.D. Thesis, Huazhong Agricultural University, Wuhan, China, 2019. [Google Scholar] [CrossRef]
- Wang, D.; Wang, L.Y.; Yang, L.Z.; Zhang, Y.Y.; Wang, Y.; Zhou, W.; Wang, M.Y. Bioavailability of Se and Se-Cd coupling effects in soil-potato system: A case study of Se-rich regions in Enshi prefecture. S. China J. Agric. Sci. 2022, 35, 2836–2842. [Google Scholar] [CrossRef]
- Xu, H.Z. Evaluation of the Relationship and Bioavailability of Selenium and Cadmium in Soil-Rice System in High Geochemical Background Area in Guangxi. Master’s Thesis, Guangxi University, Nanning, China, 2021. [Google Scholar] [CrossRef]
- Zhao, W.L.; Hu, B.; Wang, J.W.; Xiao, R.; Liang, D. Combined effects of phosphate and selenite on the uptake and translocation of phosphorus and selenium in pakchoi. Acta Sci. Circumstantiae 2013, 33, 2020–2026. [Google Scholar] [CrossRef]
- Liu, Q.; Wang, D.J.; Jiang, X.J.; Cao, Z.H. Effects of the interactions between selenium and phosphorus on the growth and selenium accumulation in rice (Oryza sativa). Environ. Geochem. Health 2004, 26, 325–330. [Google Scholar] [CrossRef] [PubMed]
- Liu, H.G.; Shi, Z.W.; Li, J.F.; Zhao, P.; Qin, S.Y.; Nie, Z.J. The Impact of Phosphorus Supply on Selenium Uptake During Hydroponics Experiment of Winter Wheat (Triticum aestivum) in China. Front. Plant Sci. 2018, 9, 373. [Google Scholar] [CrossRef] [PubMed]
- Zhou, C. Effects of Biological Nano Selenium on Growth and Accumulation of Se and Cd in Pak Choi under Cd Stress. Master’s Thesis, East China Jiaotong University, Nanchang, China, 2023. [Google Scholar] [CrossRef]
- Tie, M.; Liu, Y.; Li, H.W.; Chen, Z.L.; Zhang, Y.; Li, B.R.; Han, J.; Xue, S. Uptake of Se and Cd in radish and their effects on growth. Chin. J. Ecol. 2014, 33, 1587–1593. [Google Scholar] [CrossRef]
- Cui, Y.; Ding, Y.S.; Gong, W.M.; Ding, D.W. Study on the correlation between the chemical forms of the heavy metals in soil and the metal uptake by plant. J. Dalian Marit. Univ. 2005, 31, 59–63. [Google Scholar] [CrossRef]
- Hu, B. Effects of Cu-Se Combined Pollution on Copper and Selenium Bioavailability and Releated Mechanism. Master’s Thesis, Northwest A&F University, Xianyang, China, 2013. Available online: https://kns.cnki.net/kcms2/article/abstract?v=Ma1nt2RbXaiyx16S7T0kbBeG9uoyk30T8QcNVxA3g7yBKAQ3iZuMQC45PxgiU26-U9fl_8PMYU_YVIDk8WDuzFtqZPcB3aNQYN1zPWj95r4LlF1OplBqElq9FB_EuEzS-DAwQhA0BuUkwEOM5BwIBw==&uniplatform=NZKPT&language=CHS (accessed on 11 May 2024).
- Yang, C.L.; Zhang, Q.H.; Lu, Q.H.; Cheng, J.Z.; Luo, G.F.; Li, D.S. Characteristics and dietary exposure risk of Cd, Cu, Zn, Se and F content in agricultural products from karst high geological background areas in Guizhou Province. J. Food Saf. Qual. 2022, 13, 5008–5016. [Google Scholar]
- Chai, G.Q.; Wang, L.; Liu, G.H.; Luomu, X.J.; Jiang, Y.; Liang, H.; Fan, C.W. Health risk assessment of heavy metals and differences in Cd uptake and accumulation of three types of pod peppers. J. Agric. Sci. Technol. 2023, 25, 169–177. [Google Scholar] [CrossRef]
Disclaimer/Publisher’s Note: The statements, opinions and data contained in all publications are solely those of the individual author(s) and contributor(s) and not of MDPI and/or the editor(s). MDPI and/or the editor(s) disclaim responsibility for any injury to people or property resulting from any ideas, methods, instructions or products referred to in the content. |
© 2024 by the authors. Licensee MDPI, Basel, Switzerland. This article is an open access article distributed under the terms and conditions of the Creative Commons Attribution (CC BY) license (https://creativecommons.org/licenses/by/4.0/).