1. Introduction
In recent years, the global economy has undergone significant changes. At the same time, the rise in greenhouse gas emissions has devastated our society and environment. Global climate change has become a considerable concern for the international community, posing a severe threat to human survival and health. However, reducing emissions should not be seen as a constraint on productivity, but rather as a chance to drive green innovation and transformation in economic growth.
Governments worldwide have been proactively striving to lower carbon emissions through various measures, implementing stricter environmental regulations, investing in renewable energy, and promoting energy efficiency. These include the Kyoto Protocol [
1], the EU Emissions Trading System [
2], the Zero Carbon Act [
3], the European Green Deal [
4]. Most recently, China created a national green exchange to promote sustainable development further [
5].
On the one hand, macro-level environmental policies drive companies toward low-carbon and energy-efficient production [
6]. As the pressure from climate change intensifies, governments have introduced numerous laws and regulations [
7]. For example, the carbon cap-and-trade system is a market-based mechanism designed to reduce greenhouse gas emissions. It works by setting a limit (cap) on the total amount of certain greenhouse gases that covered entities can emit. The primary purpose is to provide economic incentives for achieving reductions in the emissions of pollutants. By allowing the market to determine the price of carbon, it encourages innovation and cost-effective emissions reductions. As a result, companies that emit carbon are held financially accountable and face increased public scrutiny [
8].
On the other hand, at the micro level, customers’ desire for low-carbon products significantly impacts the strategic alliances and operational choices made by businesses across the supply chain [
9]. Historically speaking, companies in the supply chain primarily focus on maximizing profits, and sometimes neglect their corporate social responsibility (CSR). This oversight usually led to widespread quality issues and concerns related to environmental and labor rights. In recent years, a growing preference for low-carbon products and concern for CSR has driven them to prioritize sustainable operational models over short-term economic gains. The cooperation and strategic decisions made by upstream and downstream supply chain companies have been impacted by this shift [
10].
To achieve sustainable development, encouraging emission reduction and promoting CSR within the supply chain system has become a hot topic. Modak et al. used social work donation as a tool of corporate social responsibility in a closed-loop supply chain by considering carbon emissions tax and demand uncertainty [
11]. A supplier–retailer supply chain has been considered in a newsvendor, where the supplier may invest in CSR activities that could improve the popularity of products and, subsequently, market demand [
12]. For three-tier supply chains, the reader can refer to “supplier–manufacturer–retailer” [
13], “manufacturer/retailer/third-party recycler” [
14], “manufacturer–distributor–retailer” [
15,
16], “government–manufacturer–retailer” [
17]. To optimize the potential value of CSR products, manufacturers often increase their resource input during production. This incentivizes retailers to actively promote CSR products, and suppliers to improve their CSR management. This group effort improves the supply chain’s overall CSR performance. The majority of current research on CSR coordination adopts a static viewpoint. Yet, given its dynamic nature in supply chain systems and the unavoidable influence of various random disturbances on decision-making, examining CSR management within a dynamic framework is more representative.
For joint carbon emission reduction in supply chain systems, in [
18], it is noted that adopting clean energy increases production and operational costs, which reduces market competitiveness and subsequently discourages firms from saving energy and decreasing emissions. Qi et al. [
19] constructed a two-echelon make-to-order supply chain system composed of two retailers and one supplier using the carbon quota regulation and studied the pricing decision progress by the game theory. Xie et al. [
20] used a two-region dynamic computable general equilibrium model to investigate the potential effects of regionally varied carbon taxes on local industry competitiveness. Bai et al. [
21] examined whether a manufacturer should invest in sustainable technology, and investigated the impact of risk aversion on the coordination of a two-stage supply chain under a carbon tax policy. The supply chain constructed here comprises a single manufacturer and a single retailer. Yin et al. [
22] examined a low-carbon technology sharing stochastic differential game inside a collaborative innovation system comprising superior and inferior firms. Additionally, Wang et al. [
23] investigated a two-period supply chain with a manufacturer, who deals with an unknown emission permit price and participates in a cap-and-trade program, and a retailer, who sells the product to consumers and must contend with price-sensitive demand. In [
24], the authors proposed a pricing system for the chain of users, rival utility companies (UCs), and one generation company (GC) that make up the energy supply chain. Through a revenue-sharing contract (RSC), the UC takes part in the management of the electricity supply chain. Ye et al. [
25] proposed an aggregate game for modeling and analyzing smart grid energy consumption control.
Many previous works on emission reduction mainly concentrate on producing and selling low-carbon products, but overlook the analysis of consumers. They also neglect the impact of uncertain factors, which introduce uncertainty into the system and affect the evolution of game dynamics. Moreover, most current research on CSR coordination adopts a static view. Given its dynamic nature in supply chain systems, and the unavoidable influence of various random disturbances on decision-making, it is more representative to examine CSR management within a dynamic framework.
Based on the above discussion, we intend to explore the joint carbon emission reduction strategy in the “supplier–manufacturer–retailer–consumer” supply chain system, which considers corporate social responsibility goodwill and the consumer’s reference low-carbon level as endogenous variables via three stochastic differential game models. The purpose is to determine the optimal strategies and explore the critical elements and mechanisms that affect the sustainable development of the supply chain system.
The following work is arranged as follows: In
Section 2, we make some basic assumptions. In
Section 3, we provide some useful preliminaries.
Section 4,
Section 5 and
Section 6 propose the cooperative game model, Nash non-cooperative, and manufacturer/supplier-led Stackelberg game models to dissect the optimal strategies.
Section 7 provides a comparative analysis and numerical simulations.
Section 8 contains a summary.
The main novelties of this work are:
Previous research on supply chains predominantly focuses on either the micro perspective of enterprises or the macro perspective of policy [
26]. However, there needs to be more integration of these two perspectives. This work fills the gap by integrating macro factors, such as carbon quota and carbon trading mechanism, and micro factors, such as reference low-carbon level and CSR goodwill, into one sustainable system, thereby providing a holistic perspective on its construction.
Most of the previous works regarding emission reduction mainly focus on producing and selling low-carbon products, but overlook the analysis of consumer [
27]. Consumers play a crucial role in the supply chain as they represent the final link and drive demand for products and services. In this work, we introduce the consumer’s reference low-carbon level to depict the consumer’s memory of the low-carbon level for previous products which, in turn, influences the corresponding demand.
Most of the previous works regarding emission reduction mainly utilized differential games [
28,
29], overlooking the impact of uncertain factors. In stochastic differential game models, random factors can significantly impact decision-making processes [
30,
31]. These stochastic elements introduce uncertainty into the system, affecting the game dynamics’ evolution and the players’ optimal strategies. This paper uses the stochastic differential game to analyze the joint carbon emission reduction strategy.
All of these provide a theoretical basis for strategic decision-making in emission reduction that would contribute to sustainable development. Firstly, the focus on carbon reduction efforts, such as carbon cap-and-trade systems and corporate social responsibility, supports environmental sustainability by mitigating climate change and protecting ecosystems. Secondly, the current paper addresses economic sustainability by highlighting strategies like cost-sharing contracts that incentivize investment in green technologies, fostering long-term economic growth and resilience. Thirdly, it emphasizes social sustainability by promoting consumer engagement in low-carbon products, which improves public health by reducing pollution. Finally, this paper offers policy recommendations, such as carbon trading systems, which contribute to the Sustainable Development Goals.
2. Problem Description and Model Assumptions
2.1. Problem Description
This work explores a four-tier supply chain system composed of suppliers, manufacturers, retailers, and consumers. The suppliers deliver raw materials to the manufacturers, who process them into final products and then supply them to the retailers for sale. The consumers then purchase the low-carbon products. The dynamics involved in this system include the carbon cap-and-trade mechanism, CSR goodwill, and consumers’ low-carbon preferences. The manufacturers operate under the cap-and-trade mechanism, while the suppliers and manufacturers strive to lower carbon emissions as part of their corporate social responsibility. Retailers and consumers actively sell and purchase low-carbon products.
In this paper, we use the stochastic differential game to analyze the joint carbon emission reduction strategy. Three models are employed here: the cooperative game, the Nash non-cooperative game, and the Stackelberg master–slave game. Based on the above three models, we intend to investigate the following questions: (1) How do carbon emission reductions, CSR goodwill, and reference low-carbon levels evolve with time? (2) How do we cooperate in this four-tier system? (3) What is the optimal strategy? And (4) how does the low-carbon preference affect the system?
2.2. Model Assumption
- (1)
Assuming the players are perfectly rational, they have well-defined objectives, typically aiming to maximize their payoff or utility, and possess complete information about the game, including its rules, the strategies of other participants, and the possible outcomes [
22].
- (2)
A quota-based carbon trading market is a system designed to control greenhouse gas emissions by setting emission quotas. The key idea is that a government or regulatory body establishes a total allowable level of carbon emissions for a region or industry, distributing these emissions as “carbon allowances” to individual companies. We assume that both the carbon quotas and carbon prices are determined externally, and are not influenced by internal market dynamics [
32], where the manufacturer’s carbon emission is
, the government-allocated carbon quota is
, and the trading price of carbon is
.
- (3)
Assuming the supplier’s, manufacturer’s efforts for reducing carbon emission are
, retailer’s promotional effort for the low-carbon product is
, and consumer’s comprehensive effort for the low-carbon product is
. Consumer’s comprehensive effort refers to the various efforts consumers must make when purchasing and using low-carbon products [
33]. These efforts include navigating the complexity of buying decisions, adapting to new product functionalities, raising their environmental awareness through information search, managing social and psychological pressures related to sustainable consumption, and making trade-offs between product performance and environmental benefits. Additionally, consumers may face long-term maintenance and repeat purchase costs, all of which contribute to the overall effort required to engage with low-carbon products. Consumer’s cost may include price premium, limited choices, information search costs, quality or function trade-offs, and psychological costs [
34].
The costs incurred in the supply chain with the intensity of reduction, promotional, and comprehensive efforts follow a convex function, as suggested by the existing literature [
35,
36]. Therefore, the abatement costs of the supplier and manufacturer are
where
are the abatement efforts,
denote the cost coefficients. The publicity cost of the retailer is
where
is the promotional effort,
denotes the cost coefficient. The comprehensive cost of the consumer is
where
is the comprehensive effort,
denotes the cost coefficient.
- (4)
CSR goodwill refers to the intangible asset or positive reputation a company gains through its commitment to corporate social responsibility, that involves the abatement efforts of the supplier, manufacturer, and the promotional effort of the retailer, the comprehensive effort of the consumer, as well as random factors. In terms of the goodwill model of Nerlove-arrow [
37,
38], we assume the CSR goodwill (denoted as G) observes the following equation:
where
denote the marginal impact coefficient of the efforts.
is the natural decay rate,
is the standard Brownian motion.
- (5)
Emission reduction is a dynamic process, and the emission reduction per unit of output mainly depends on the efforts of manufacturers and suppliers. Similar to CSR goodwill, emission reduction is also affected by random disturbance. According to [
32], we presume the carbon emission reduction (denoted as
) observes the following equation:
where
denote the marginal impact coefficient of the efforts.
is the natural decay rate,
is the standard Brownian motion.
- (6)
A reference price is an internal benchmark consumer use to compare against the observed price. It is formed through their personal shopping experiences and exposure to price information. Most studies assume that the reference price is a weighted average of the historical price exposures of the consumer [
39]. Therefore, we define the consumer’s reference low-carbon level
R as the weighted average of the low-carbon level of the previous low-carbon products, i.e.,
where
is the memory parameter and
,
is the weight of the low-carbon level at the moment
s, which means the greater the memory parameter is, the shorter the consumer’s memory of the low-carbon level of the product at the time
s. Briefly speaking, the closer the product is to the decision-making time, the greater the weight of the low-carbon level. This problem can arise when a new low-carbon product is introduced or a retailer starts a new pricing policy at
. A straightforward computation indicates
where
is the initial reference low-carbon level.
Like the carbon emission reduction and CSR goodwill, the reference low-carbon level is also affected by random disturbance. Thus, it can be written as
where
is the standard Brownian motion.
- (7)
Firstly, when consumers purchase low-carbon products, they will compare the actual low-carbon level of the product with the reference low-carbon level. If the actual low-carbon level is higher than the reference low-carbon level, consumers will feel the benefit; otherwise, they will feel the loss. According to Kopalle [
40], assuming that the impact of
on the demand of low-carbon products is linear.
Secondly, in a stable long-term market where the prices of low-carbon products remain steady, consumers tend to be less sensitive to price changes when choosing low-carbon products. Instead, they focus more on promotional activities and corporate social responsibility goodwill.
Considering the long-term marketing strategy and the intrinsic mechanism of market demand [
41], the demand for low-carbon products is influenced by a combination of consumer preferences for environmentally friendly products, the retailer’s promotional effort, the consumer’s comprehensive effort and reference low-carbon level. Therefore, the market demand (denoted as Q) has the following form:
where
is the basic demand,
is the marginal impact coefficient of CSR goodwill,
are the marginal impact coefficients of retailer’s and consumer’s efforts,
is the reference low-carbon parameter, representing consumers’ sensitivity to the gap between the reference low-carbon level and the actual low-carbon level.
Based on the above discussions, the objective functions of players are
where
is the discount rate,
are the marginal profit coefficients of the supplier, manufacturer, retailer and consumer related to low-carbon products.
3. Preliminary
Let
be one-dimensional Brownian motion on (
). A one-dimensional Itô process is a stochastic process
on (
) of the form
where
and
u is
-adapted, such that
Thus, (
1) can be written as
Lemma 1 (One-dimensional Itô formula [
42])
. Let be an Itô process given by (2) and . Then, is an Itô process, satisfying 4. Centralized Decision-Making
In collaborative emission reduction, the supplier, manufacturer, retailer, and consumer are seen as a community of interest. Both parties collaboratively determine their efforts to maximize the benefits of the entire supply chain. For convenience, this model is denoted as “c”. Therefore, the optimal control equation can be written as
subject to
Theorem 1. The equilibrium results under this model are as follows.
(i) The optimal efforts are (ii) The optimal performance function of supply chain iswhere and is a polynomial that displayed in Appendix A. Proof. Denoting
as the value function of supply chain, one has
. Therefore, in terms of the optimal control theory [
43],
satisfies the following HJB equation:
Considering the first-order derivatives to the right side of (
5) in terms of
, one has
Assuming
observe the following ansatz:
where
are the constants to be determined. Substituting (
6) and (
7) into (
5), one has
Zeroing all the coefficients of
comes a set of algebraic equations. Solving these equations, we have
□
On the one hand, the optimal abatement efforts increase with the marginal coefficient , which suggests as the preference for low-carbon products increases, each party is more willing to engage in emission reduction activity. partially amplify with carbon price . Briefly speaking, the cap-and-trade system motivates the supplier and manufacturer to actively conduct energy-saving and emission-reduction practices as the market price of carbon rises. Moreover, demonstrate the same tendency to the reference low-carbon parameter . Since it represents the consumer’s sensitivity to the difference between the reference low-carbon level and the actual low-carbon level and is part of the market demand for low-carbon products, the supplier and manufacturer are more willing to engage in emission reduction for low-carbon-sensitive consumers. Therefore, the increase in the reference low-carbon parameter stimulates suppliers’ and manufacturers’ efforts.
On the other hand, the optimal abatement efforts all decrease with . This suggests that factors such as policy and environmental awareness change not only negatively influence CSR goodwill, but also reduce the willingness of retailers and consumers to sell and purchase low-carbon products. Similarly, exhibit a negative relation with , which means the equipment aging and other mechanical factors inhibit the effectiveness of carbon reduction. Last but not least, demonstrate a negative relation with the memory parameter . According to its definition, the less memory a consumer has of the previous low-carbon product, the less effort will be paid. In other words, if the consumers have profound memories of the low-carbon products, there are likely to be more carbon reduction activities.
The optimal performance value positively relates to CSR goodwill and carbon emission reduction but negatively to the reference low-carbon level. Suppose the reference low-carbon parameter is equal to zero. In that case, the consumer has no sensitivity, and they will not compare the actual low-carbon level of the product with the reference low-carbon level, which returns to the standard case. The existence of reference low-carbon level and reference low-carbon parameter increases the optimal abatement efforts but decreases the optimal performance values.
Proposition 1. (i) The expectation and variance of carbon emission reduction arewhere . (ii) The expectation and variance of CSR goodwill arewhere . (iii) The expectation and variance of reference low-carbon level arewhere . Proof. Substituting (
4) into (
3), the optimal carbon emission reduction
has the form
Let
. According to Lemma 1,
becomes
Integrating the above equation, we have
Since the expectation of Itô integral is zero, taking expectations on (
9) will result in
Let
. On the basis of (
8), we have
It follows from Lemma (1) that
Integrating the above formula, one has
Taking mathematical expectations on (
9) and (
11), they become
and
According to
, we have
Therefore, due to (
10) and (
12), we obtain
and
□
Proposition 1 indicates that the system’s predicted reduction in carbon emissions is more significant the more inputs it receives from the manufacturer and supplier. As the decay rate increases, so do the limits of expectation and variance of carbon emission reduction. Furthermore, the limit of variance increases with the rise of random disturbance. The expected and variance of CSR goodwill, as well as their limit, show the same trend with respect to the inputs from the four players and their decay rate, respectively.
Remark 1. The mathematical expectation of carbon emission reduction has the following property: Remark 2. The variance of carbon emission reduction has the following property: According to Remarks 1 and 2, the carbon emission reduction will decrease under significant fluctuation caused by the random error under the condition: and . Therefore, maintaining the long-term performance of carbon emission reduction in such conditions is becoming increasingly challenging.
5. Decentralized Decision-Making without Cost-Sharing Contract
In this model, the supplier, manufacturer, retailer, and consumer operate independently. Both parties aim to maximize their benefits and individually decide on the abatement efforts. Moreover, there are no subsidies either from the manufacturer or the retailer. For convenience, this model is denoted as “n”. Therefore, the optimal control equations can be written as
Theorem 2. The equilibrium results under decentralized decision-making without cost-sharing contract are as follows.
(i) The optimal efforts are (ii) The optimal performance function of the supplier is The optimal performance function of the manufacturer is The optimal performance function of the retailer is The optimal performance function of the consumer iswhere are polynomials that displayed in Appendix A. Proof. Denoting
as the value functions of the supplier, manufacturer, retailer, and consumer. One has
and
. Therefore, in terms of the optimal control theory [
43],
satisfies the following HJB equation:
Taking the first-order derivative to the right side of (
13) in terms of
, one has
Under the same manners,
and
satisfy the following equation:
and
have the forms
Assuming
, observe the following ansatz:
where
are constants to be determined. Substitution into (
13), (
15), (
16), and (
17), and zeroing all the coefficients of
, one has
□
Compared with centralized decision-making, in decentralized decision-making, the optimal efforts are determined by their marginal profits and are not affected by others. Specifically, the optimal efforts of the supplier, retailer, and consumer are independent of the carbon trading mechanism. The existence of reference low-carbon levels and reference low-carbon parameters increases the optimal efforts. The value functions of the supplier, retailer, and consumer positively relate to the CSR goodwill, and neither earns or bears an external fee from the carbon emission reduction activity. The manufacturer’s function positively correlates with carbon emission reduction and CSR goodwill. However, the four value functions negatively relate to the reference low-carbon level. In conclusion, in decentralized decision-making, the reference low-carbon level and reference low-carbon parameter increase the optimal efforts except for the consumers, decreasing both four value functions.
Proposition 2. (i) The expectation and variance of carbon emission reduction arewhere . (ii) The expectation and variance of CSR goodwill arewhere . (iii) The expectation and variance of reference low-carbon level arewhere . 6. Decentralized Decision-Making with Cost-Sharing Contract
In this part, we study a Stackelberg master–slave game model led by the manufacturer and retailer. On the one hand, the manufacturer decides first what its effort will be and at what level of subsidies (
) to give to the supplier and retailer. On the other hand, after the manufacturer decides on its subsidies, the retailer makes the call of the subsidy (
) given to the consumer. As in the last game model, the supplier, manufacturer, retailer, and consumer all strive to maximize their benefits and individually decide on the abatement efforts. For convenience, this model is denoted as “s”. Therefore, the optimal control equations can be written as
Theorem 3. The equilibrium results under decentralized decision-making with cost-sharing contract are as follows.
(i) The optimal efforts are (ii) The optimal cost sharing rates are (iii) The optimal performance function of the supplier is The optimal performance function of the manufacturer is The optimal performance function of the retailer is The optimal performance function of the consumer iswhere are polynomials that displayed in Appendix A. Proof. Denoting
as the value functions of the supplier, manufacturer, retailer, and consumer, one has
and
. Therefore, in terms of the optimal control theory [
43],
satisfies the following HJB equation:
Taking the first-order partial derivative to the right side of (
20) in terms of
, we have
Under the same manners,
satisfies the following equation:
and
has the form
Moreover, the retailer’s and manufacturer’s value functions read
and
Substituting (
21) into the right side of (
24), and considering the first-order partial derivatives with respect to
and
, one has
and
Substituting (
21), (
23), (
26), and (
27) into (
25), and taking the first-order partial derivatives in terms of
, a straightforward computation indicates
Assuming
, observe the following ansatz:
where
are constants to be determined. Substitution into (
20), (
22), (
24), and (
25), and zeroing all the coefficients of
, it becomes a set of algebraic equations. Solving these equations, we have
□
Similar to the last game, the optimal effort of the supplier not only increases with its marginal profit, but also with the trading pricing of carbon and manufacturer’s marginal profit, and decreases with natural decay rates of carbon emission reduction and CSR goodwill, as well as memory parameter of reference low carbon level. This is because as the trading pricing of carbon and the manufacturer’s marginal profit rise, the cost shared by the manufacturer also rises. The retailer’s optimal effort can be analyzed in the same manner. In this sense, the cost-sharing agreement encourages suppliers and retailers to implement energy-saving and emission-reduction strategies, thereby fulfilling their corporate social responsibilities. Moreover, the cost-sharing contract between the retailer and consumer enables the consumer’s optimal effort to include the retailer’s marginal profit. Therefore, the cost-sharing contracts bridge the gaps between each party and form a community of interest. Furthermore, the manufacturer’s effort remains the same compared to decentralized decision-making without a cost-sharing contract. Thus, the manufacturer/supplier-driven cost-sharing contract does not affect its effort.
Proposition 3. (i) The expectation and variance of carbon emission reduction arewhere . (ii) The expectation and variance of CSR goodwill arewhere . (iii) The expectation and variance of reference low-carbon level arewhere . The manufacturer’s willingness is the primary factor in the cooperation. Meanwhile, the retailer and the supplier, unaffected by risk shocks, are unlikely to abandon the Stackelberg model, which can lead to Pareto improvement, provided they are rational enough to recognize its benefits.
Since the manufacturer gives subsidies (
) to the supplier and retailer, and the retailer gives the subsidy (
) to the consumer afterwards, the subsidy rates should observe
that becomes
7. Comparative Analysis of Equilibrium Results
Above, we have discussed three carbon emission reduction strategies (the cooperative, Nash non-cooperative, and Stackelberg master–slave games), and derived their optimal efforts, optimal performance values, mathematical expectations, and variance of these values. Next, we will analyze and compare those equilibrium results. We only provide complete proof of the first result to save space, and omit the others.
Corollary 1. Comparing the optimal efforts, the following relations hold: Proof. Firstly, the optimal efforts for supplier are as follows:
It is obvious that
and
. Therefore, we only have to verify
. According to the constraint (
30), one has
Secondly, the optimal efforts for manufacturer are as follows:
It is evident that .
Thirdly, the optimal efforts for retailer are as follows:
It is evident that
and
. According to (
30), we have
.
Lastly, the optimal efforts for consumer are as follows:
It is clear that
and
. According to (
30), we have
. □
The cooperative model displays the highest optimal efforts among these three models. Comparing the manufacturer/supplier-led Stackelberg with the Nash non-cooperative model, although the manufacturer’s optimal effect remains unchanged by posing a cost-sharing contract to the other parties, the others’ optimal efforts significantly increase.
Corollary 2. When comparing the optimal performance values, the following relations hold: In contrast to the Nash non-cooperative model, the manufacturer/supplier-dominated Stackelberg master–slave model maximizes the rewards for every participant in the supply chain. In addition, the model allows for Pareto improvement for each number, and is self-executing. The value of the entire system is higher under the manufacturer/supplier-dominated Stackelberg master–slave game model than that of the Nash non-cooperative game model, as . This result suggests that in the Stackelberg game model, a fair cost-sharing rate is an incentive to raise the overall value.
Corollary 3. When comparing the expectation and variance of emergency resource availability, the following relations stand: The cooperative game model displays the highest expected CSR goodwill and carbon emission reduction among the above-mentioned models. However, it also has the highest risk level. Compared with the Nash non-cooperative model, the manufacturer/supplier-led Stackelberg model reaches higher expected carbon emission reduction and CSR goodwill, but with increased volatility. Therefore, enterprises must accept more significant risks to maintain higher returns. Thus, the manufacturer may select alternative game models, depending on how much risk they are willing to take. For example, an enterprise predisposed to high risk can choose the cooperative game. On the other hand, the Nash non-cooperative model may be preferred by individuals who shun risk, and the Stackelberg model by those who favor moderate risk.
8. Numerical Simulations
This section provides numerical simulations for the Stackelberg game (denoted as model s), Nash non-cooperative game (denoted as model n), and cooperative game (denoted as model c) discussed above, offering a straightforward comparison of the results.
The carbon trading price in China’s national ETS ranges from 40 to 60 RMB/ton, with an average of 50 RMB/ton [
44]. Large manufacturing enterprises, such as those in the steel and cement industries, typically emit between 10 and 50 million tons of carbon annually. In contrast, large power plants emit around 20 million tons [
45]. Carbon abatement costs range from 100 to 200 RMB/ton in high-emission sectors like steel and chemicals. In contrast, in the energy sector, they are lower, ranging from 50 to 100 RMB/ton [
46]. Advanced technologies like CCS can cost between 200 and 500 RMB/ton [
46]. Regarding supply chain dynamics, profit margins in manufacturing range from
to
, with carbon reduction measures consuming
to
of profits [
47]. Manufacturers usually bear
to
of total abatement costs [
47]. Chinese consumers are willing to pay a
to
premium for low-carbon products, with green consumption growing
to
annually [
48]. The government sets carbon quotas in the power sector at 500 g to 1000 g of
per kWh, and annual emission caps for large steel enterprises are set between 2 and 3 million tons [
49]. These data points provide a realistic foundation for calibrating simulation models.
Based on the parameter setting of [
31], the parameters are chosen as
,
,
,
,
,
,
,
,
,
,
,
,
,
,
,
,
,
,
. It is worth noting that all of the pictures in this section are plotted by the Euler method, a straightforward numerical technique for solving ordinary differential equations with a given initial value.
For all three models, the carbon emission reduction, CSR goodwill, and reference low-carbon level increase with
t, and eventually reach a stable state, as shown in
Figure 1. Moreover, the cooperative model produces the maximum level of the above three trajectories. The Nash non-cooperative model, on the other hand, makes the lowest level. The outcome of the Stackelberg master–slave model, which the manufacturer leads, lies between the cooperative and non-cooperative models.
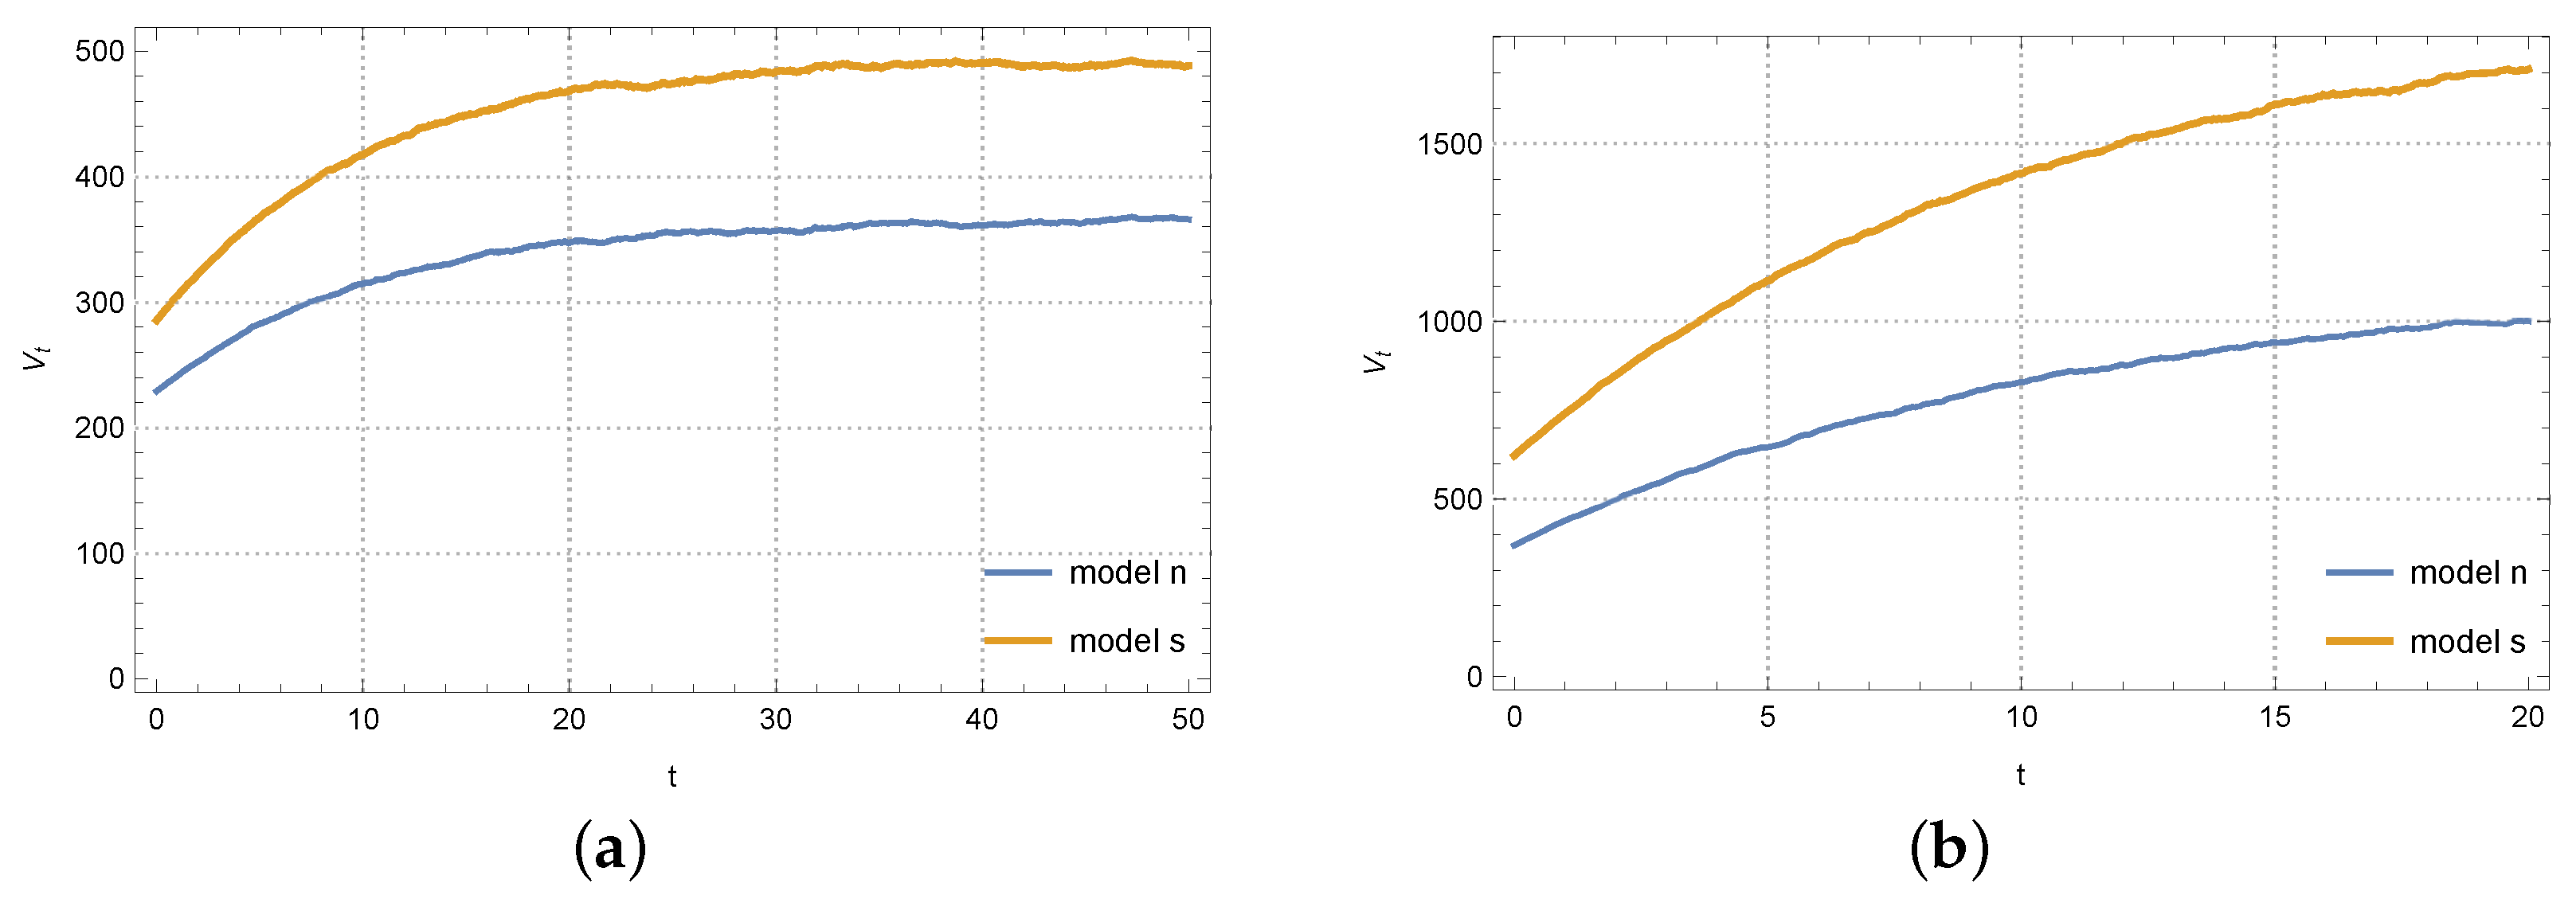
Figure 2 and
Figure 3 show the profits of supplier’s profit, manufacturer’s profit, retailer’s profit, and consumer’s profit under the Stackelberg master–slave and Nash non-cooperative models. Pareto improvement comes from the cost-sharing contracts.
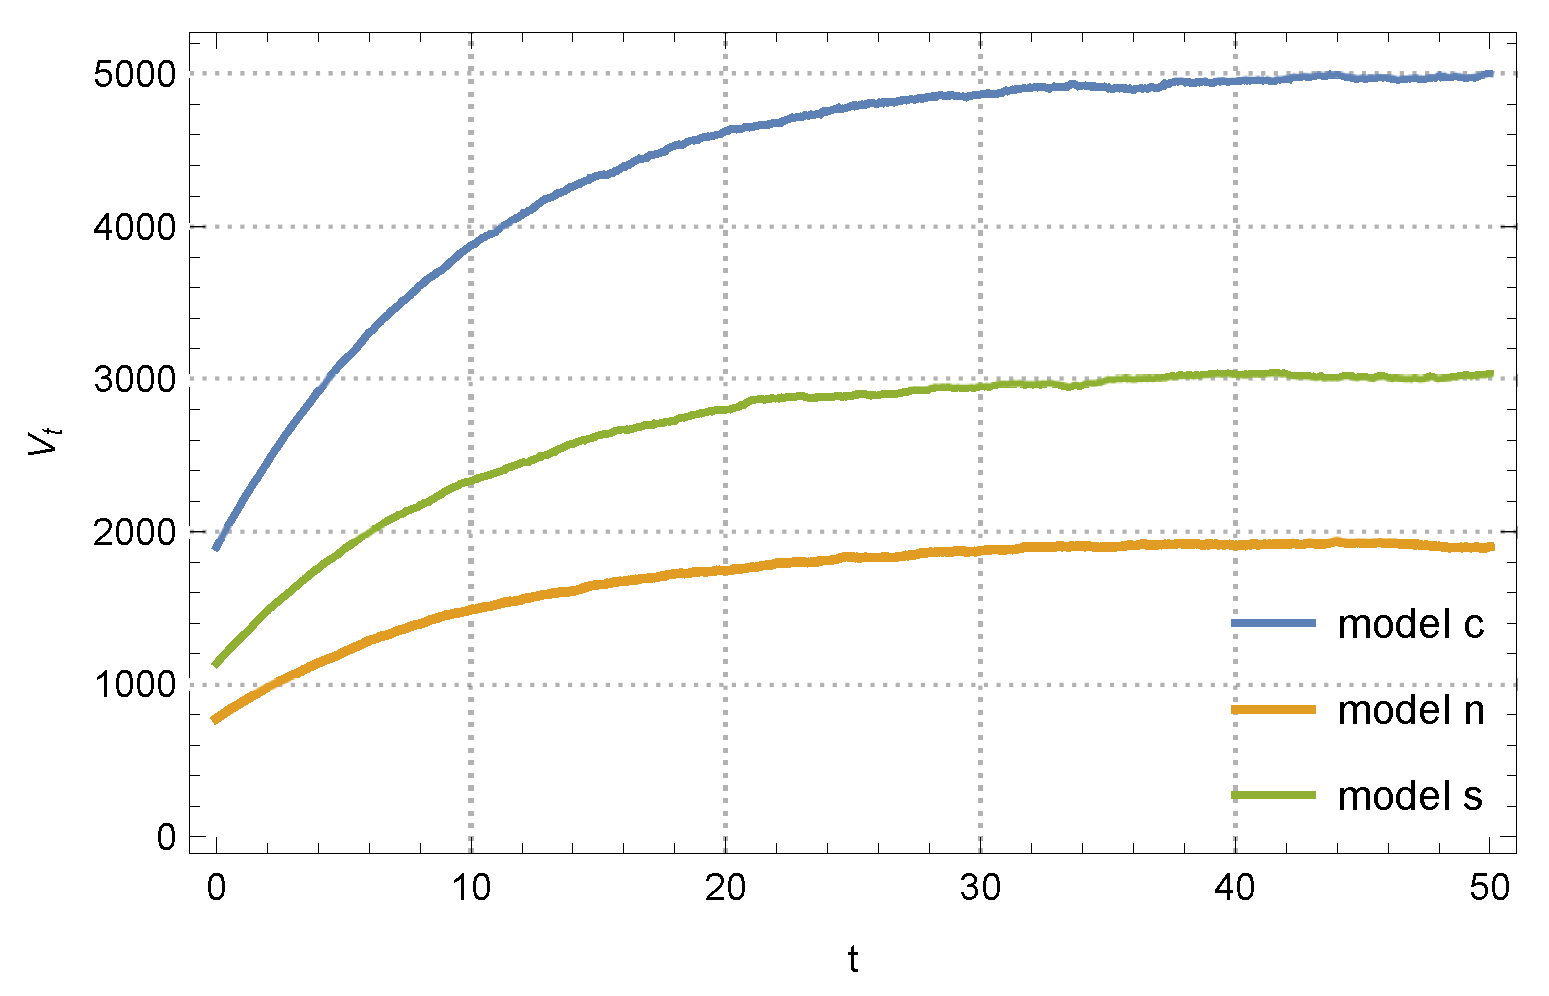
According to
Figure 4, the total profit in the cooperative game is well ahead of that in the Nash non-cooperative and Stackelberg master–slave games. In the cooperative game, the total value experiences rapid growth near the initial moment, whereas the other models’ total values increase slowly. It indicates that centralized decision-making is better than decentralized decision-making. However, there are many challenges in applying cooperative games to real life, due to the matter of benefit distribution and the non-rationality of players.
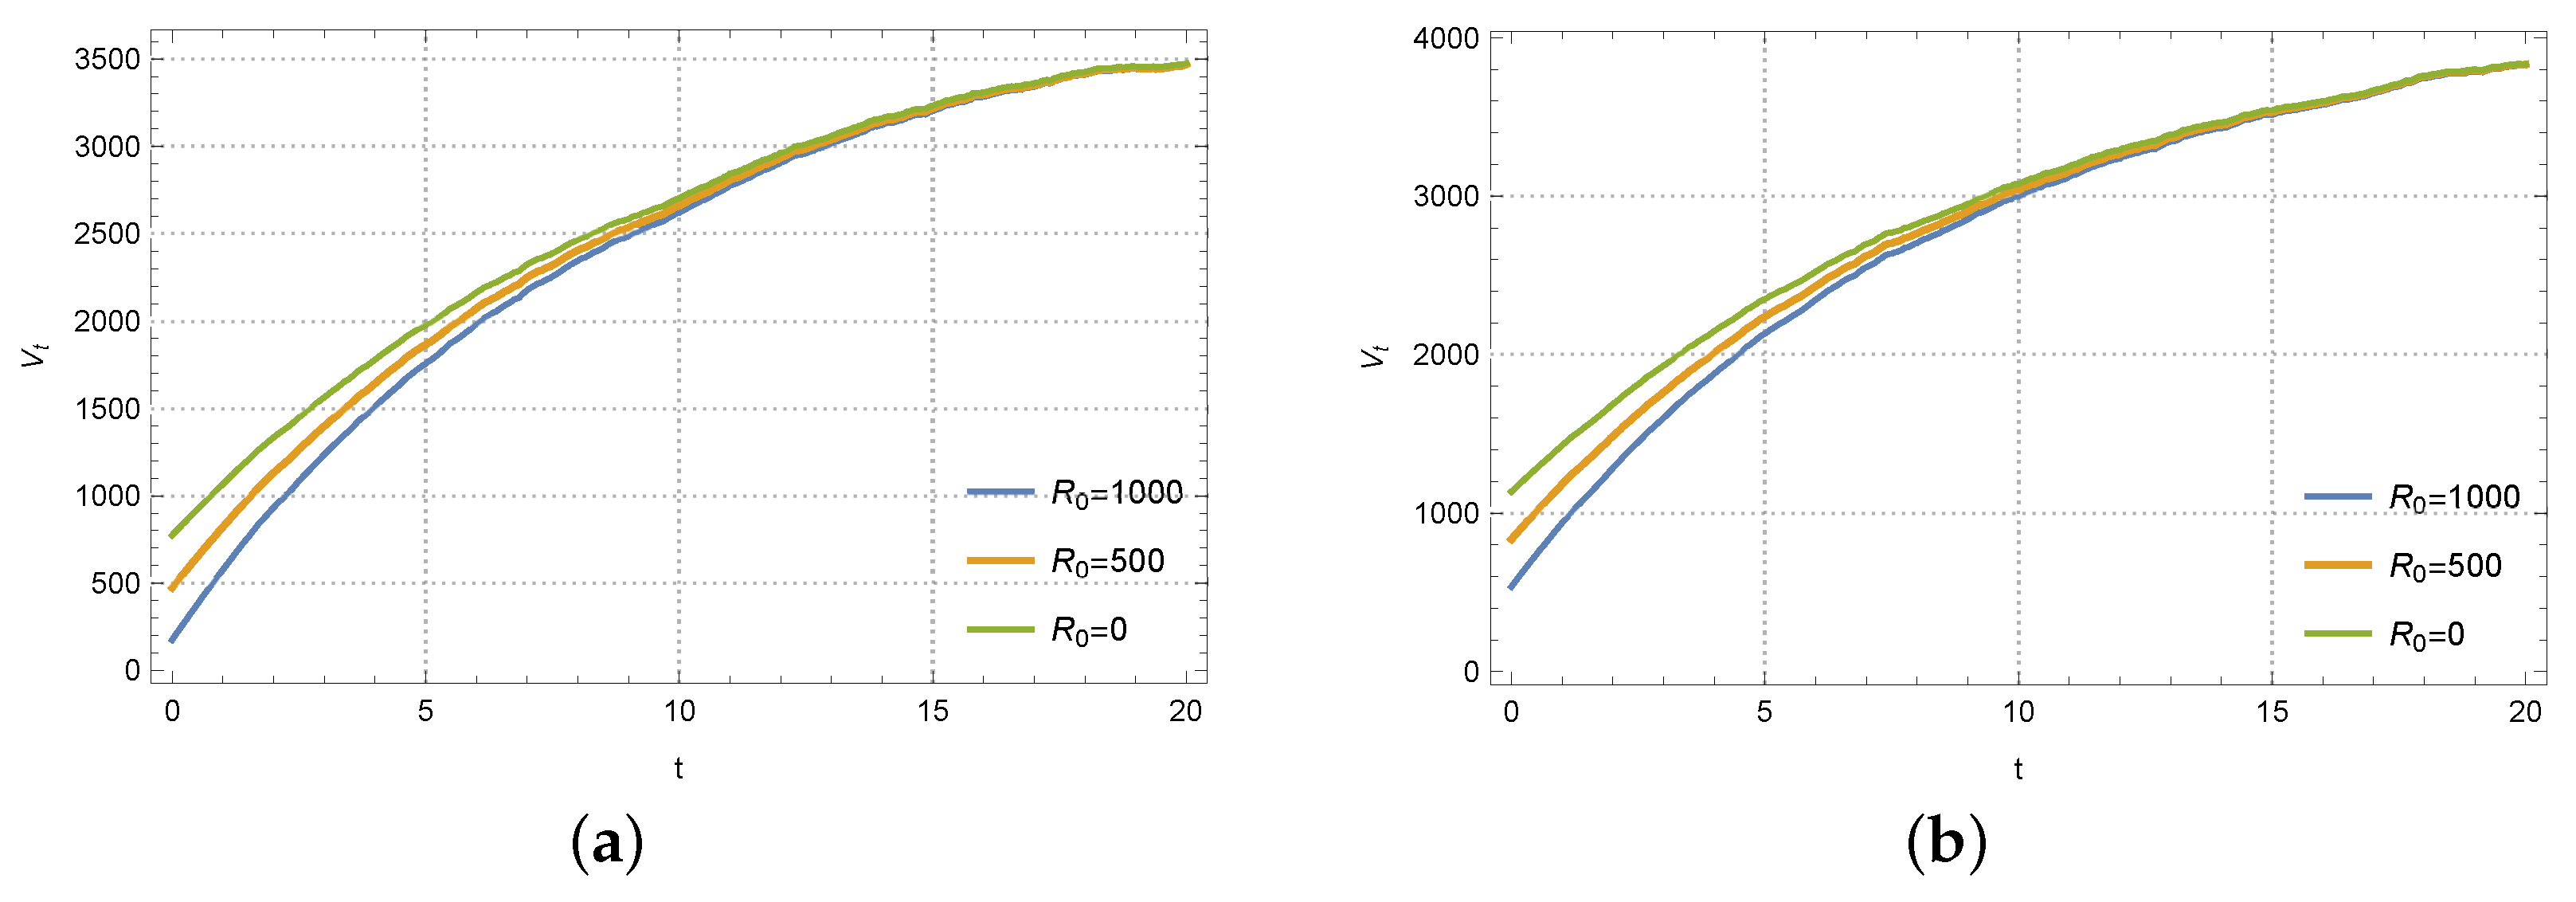
Figure 5 depicts the variation in the supply chain under three different initial values of reference low-carbon level. As we can see, for the initial input
, the supply chain has the maximum initial profit, and the evolutional trajectory is the highest compared to the others. On the contrary, the system has the minimum initial profit, and the evolutional trajectory is the lowest if the initial input is
. However, no matter what initial input, they eventually come to the same stable state. It indicates that, although profits remain stable in the long term, enterprises in their nascent stages should be supported.
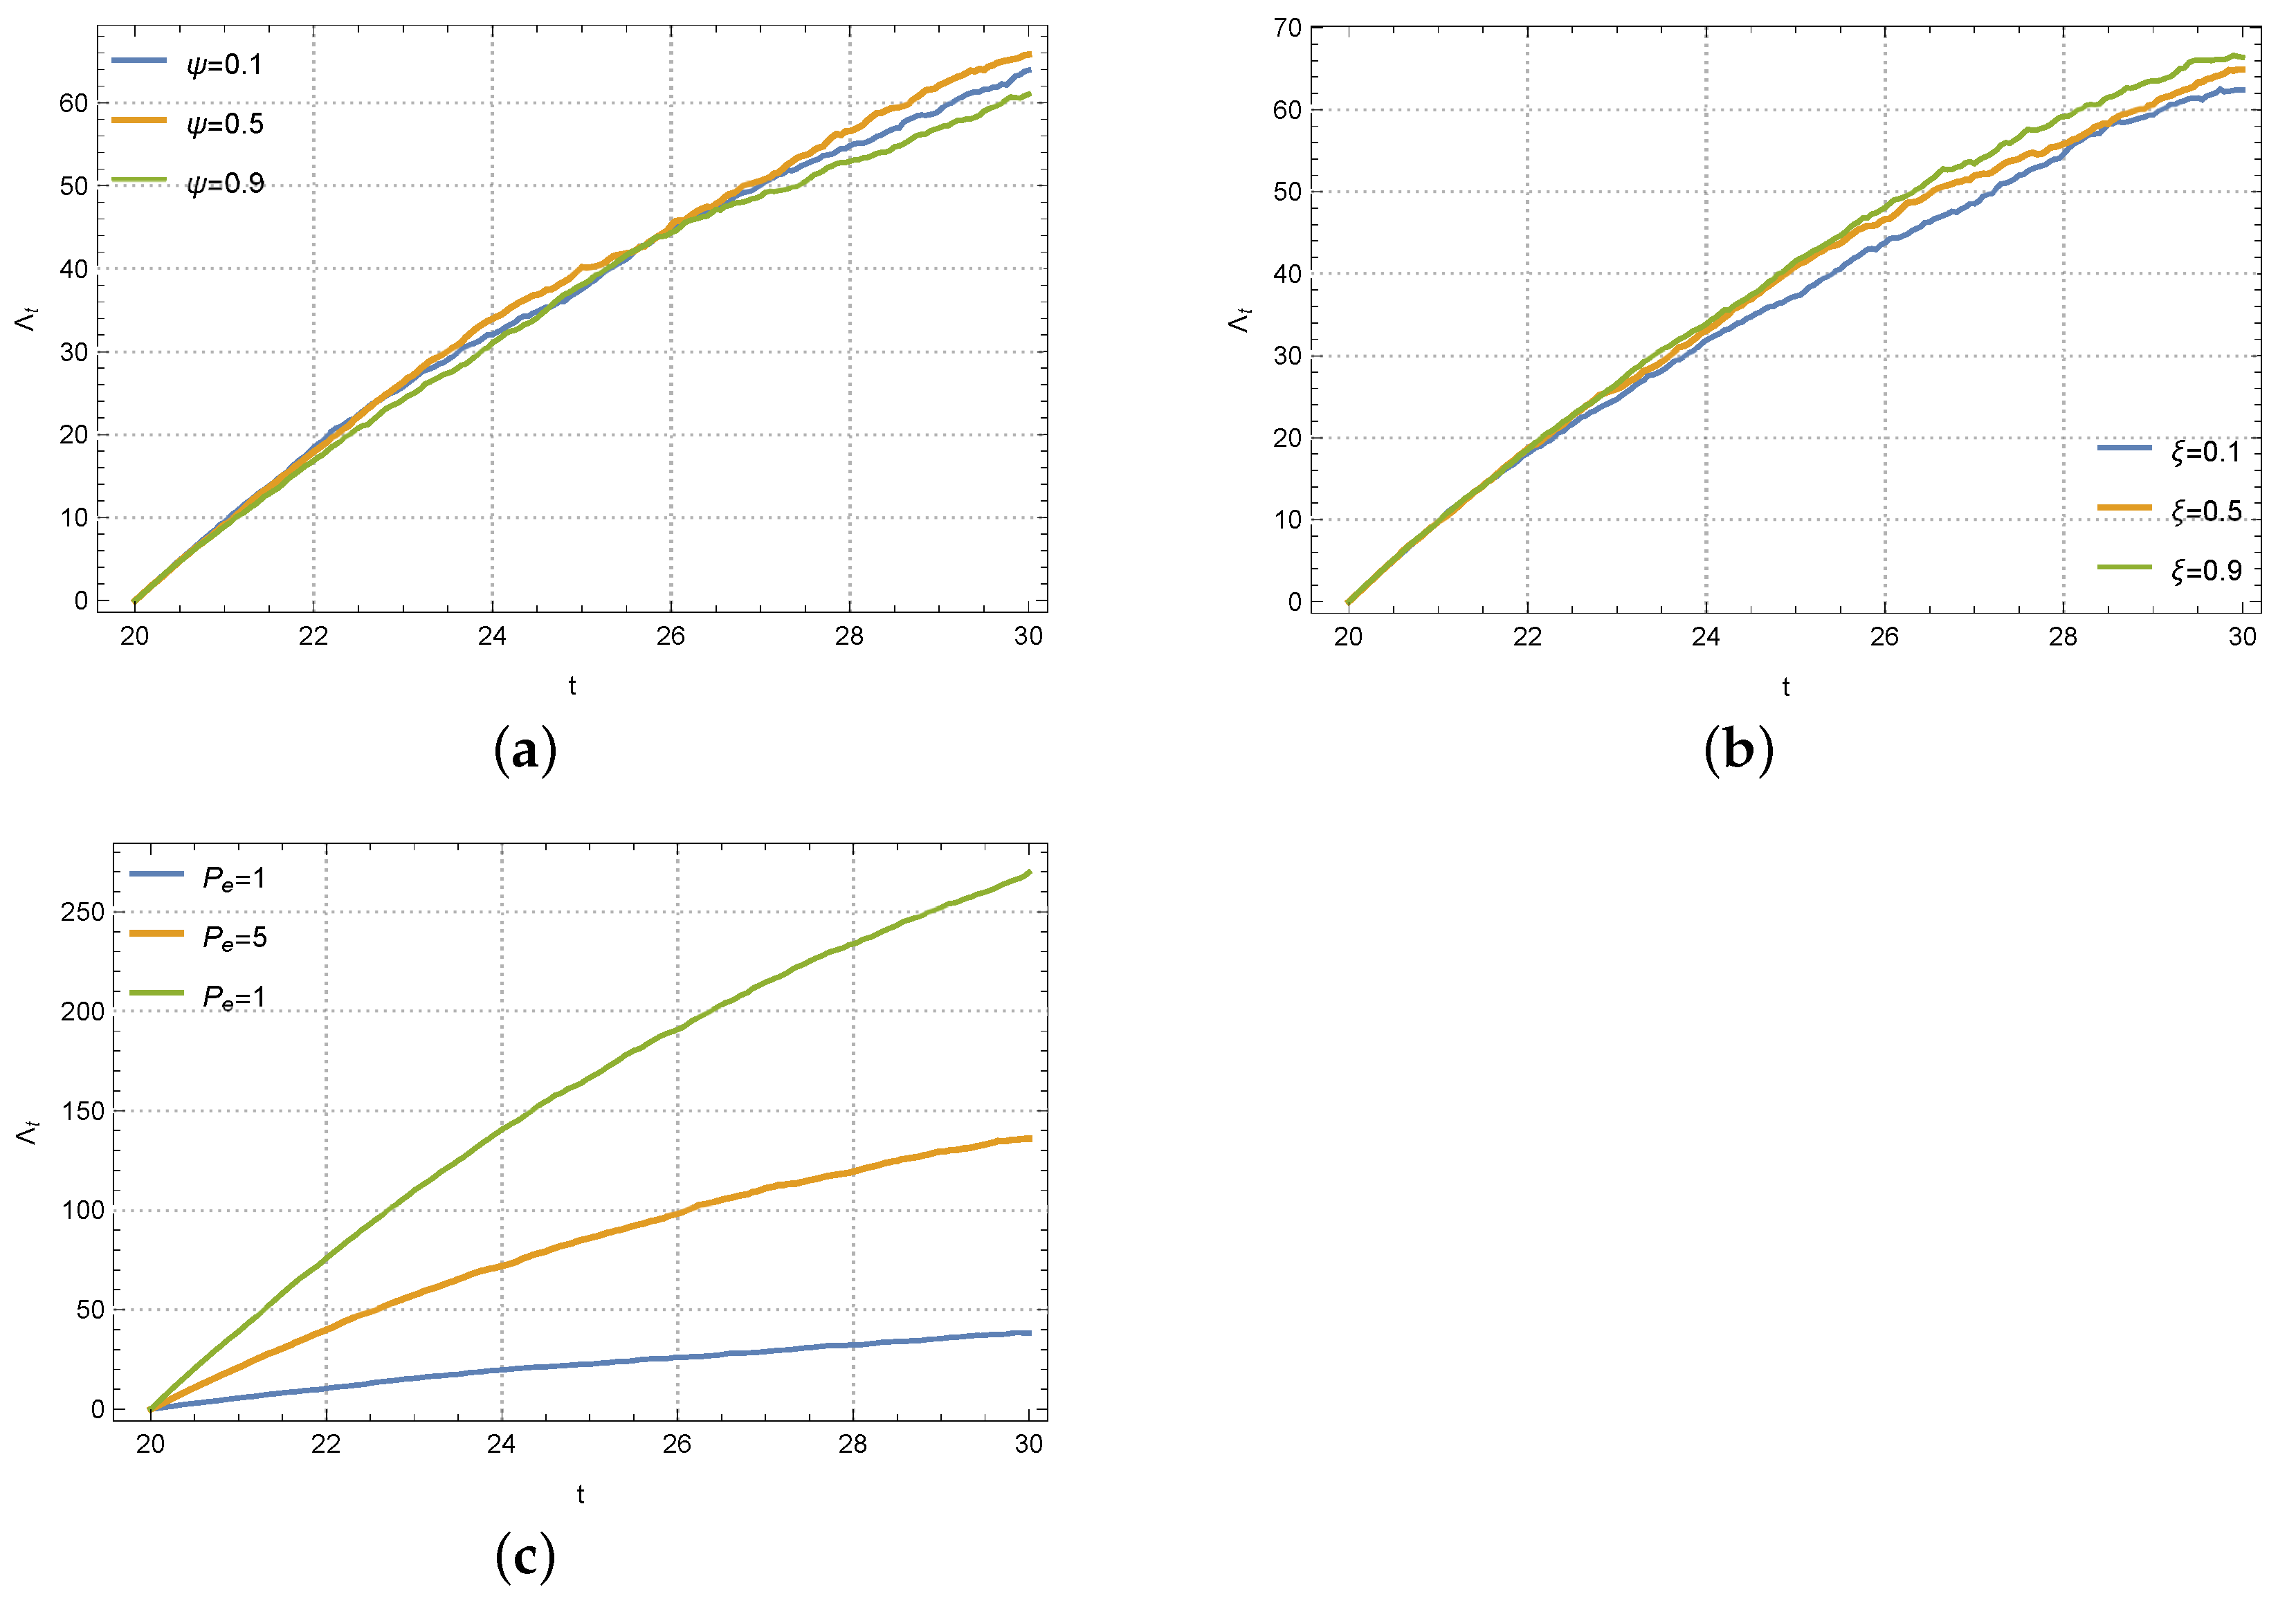
Figure 6 depicts the trajectories of carbon emission reduction in the Stackelberg master–slave model under different values of
, and
. For the memory parameter
, we can hardly derive its effect as the emission reduction level is not linear to
. It is clearly that
lies in the middle of
and
, while, for the reference low-carbon parameter
, the emission reduction level increases with it. For the last picture in
Figure 6, the carbon emission reduction level significantly increases with the trading price
.
In
Figure 7, the total value of the system decreases with the memory parameter
. The less memory of the previous low-carbon product that the consumer has, the more quickly the actual low-carbon level meets consumers’ needs, and the market demand gradually increases, thus increasing the overall benefits. Secondly, the reference low-carbon parameter
positively relates to the total value, and the total values eventually converge to an ideal level. For a low initial reference low-carbon level and the reference low-carbon level, the actual low-carbon level can quickly meet the needs of consumers. Thereby, the system would have a fast speed to increase (see the blue line in
Figure 7b). On the contrary, the system would have a low speed (see the green line in
Figure 7b). Like the last case, the whole value significantly increases with the trading price
.
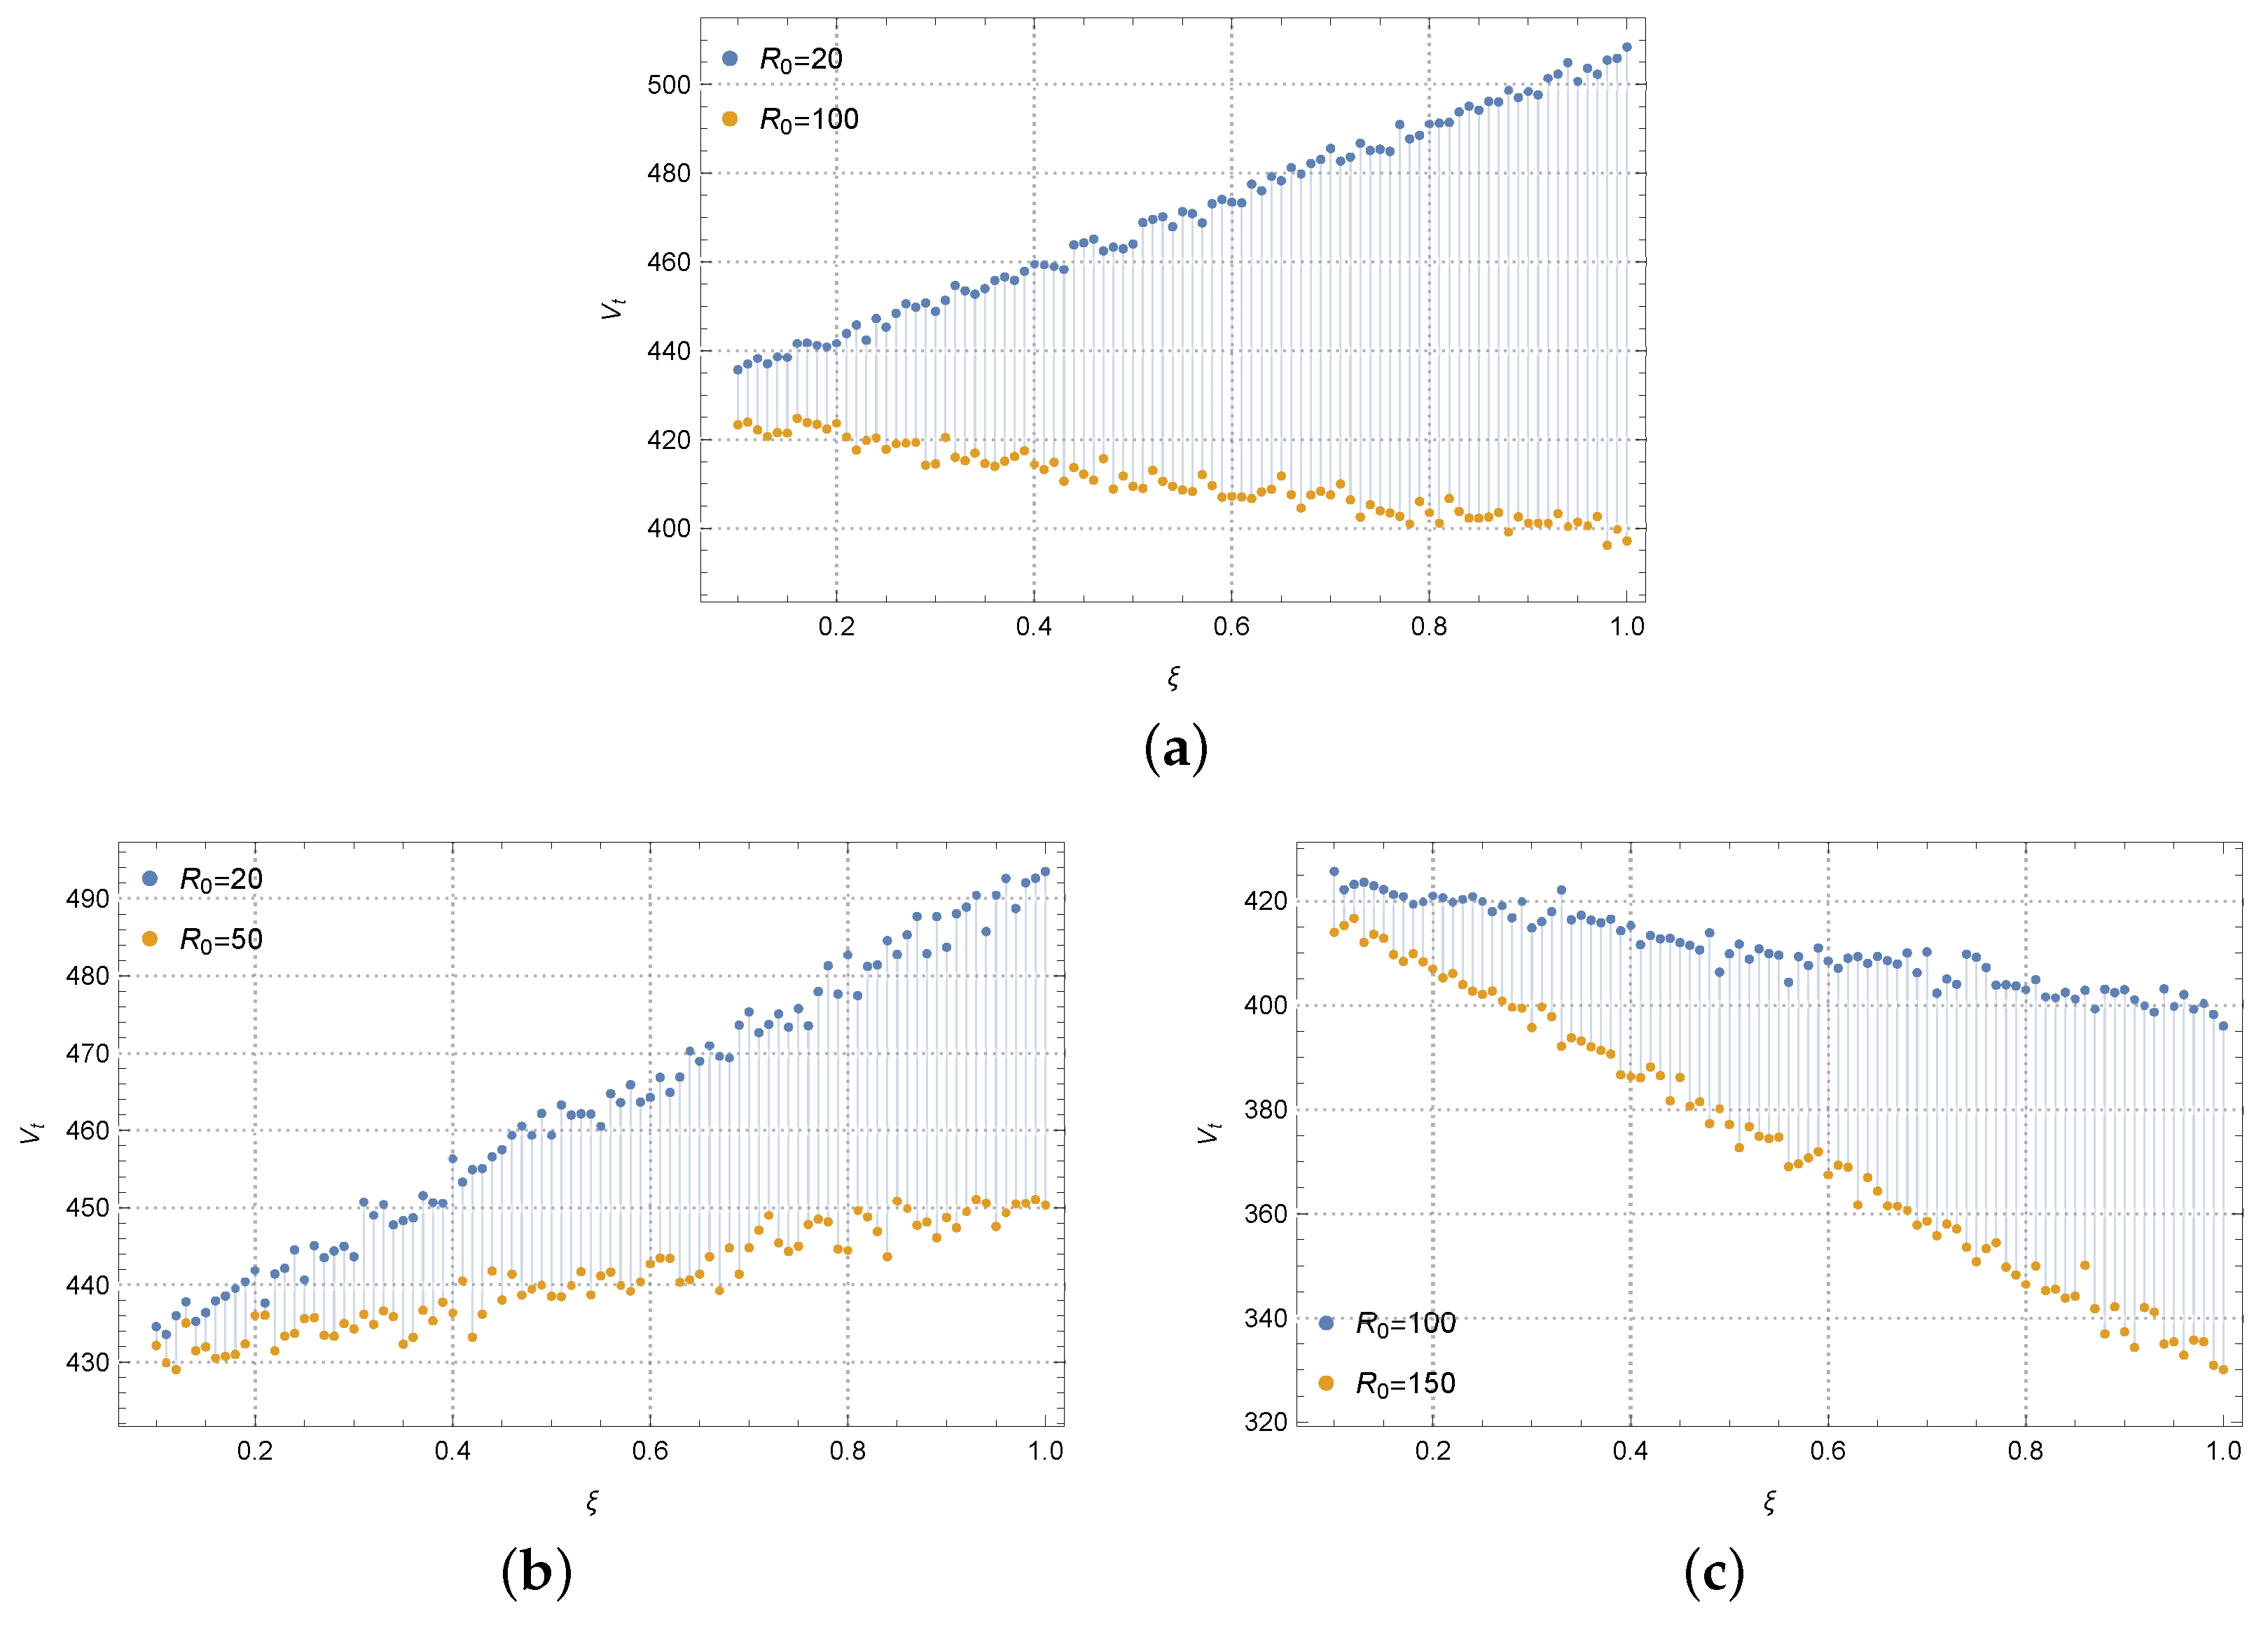
Figure 8 describes the evolution progress of the manufacturer’s profit, along with the reference low-carbon parameter
at a particular time
t. Since the manufacturer’s profit will eventually become stable, and the influence of initial reference low-carbon level decays with time, we need to set the time
t to be sufficiently small. Here,
t is selected as 2. If
, the manufacturer’s profit increases with the reference low-carbon parameter
. This is because the initial reference low-carbon level and the reference low-carbon level formed by the consumer are low at this time. The actual low-carbon level of the product easily meets the needs of consumers. As the parameter
increases, market demand gradually increases, thereby improving the present value of the enterprise’s profits. Regardless, if
, the manufacturer’s profit decreases with the reference low-carbon parameter
. This is because the higher initial reference low-carbon level leads to a higher reference low-carbon level, and the actual low-carbon level of the product cannot meet consumers’ needs. As the parameter
increases, market demand gradually decreases, leading to a downward trend in the present value of the enterprise’s profits.
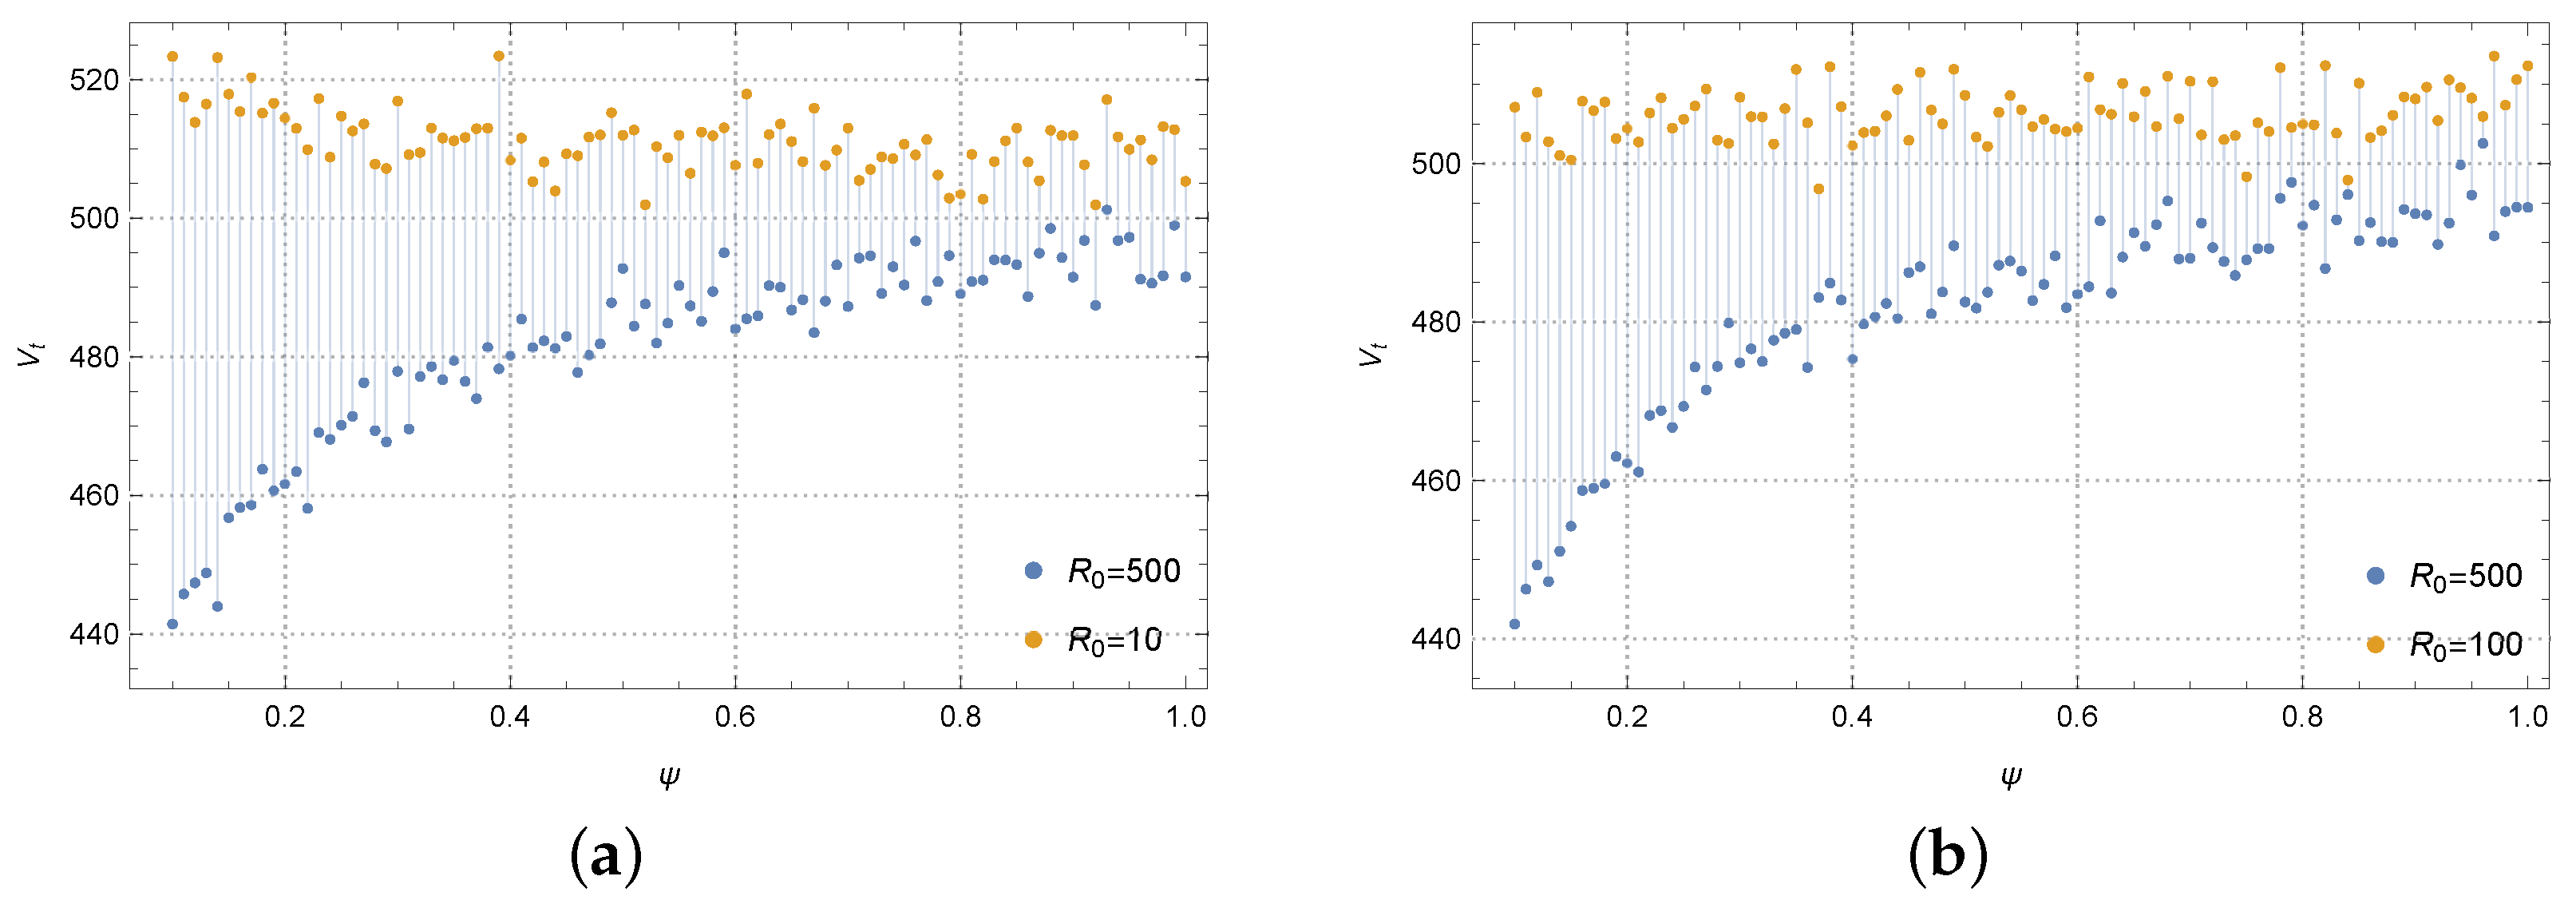
Figure 9 describes the evolution progress of the manufacturer’s profit, along with the memory parameter
at
. The manufacturer’s profit is insensitive to
when the initial reference low-carbon level is low. When
, the manufacturer’s profit gradually decreases with the memory parameter, while its value is nearly maintained at the same level as
. For a sufficiently excellent
, the manufacturer’s profit increases with the memory parameter, and tends to a stable state. We conclude its dynamics as follows: for a high initial reference low-carbon level, the greater the
, the less memory of the previous low-carbon product that the consumer has, the actual low-carbon level of the product gradually meets consumers’ needs, and the market demand gradually increases. However, for a low initial reference low-carbon level, the effect of the memory parameter is not evident, since the initial reference level is negligible. Unlike the role of the reference low-carbon parameter, the memory parameter will converge two different values into the same state. According to the definition of the memory parameter, the larger it is, the less the previously low-carbon product influences the consumer’s reference low-carbon level. Therefore, if the memory parameter tends to be infinity, there will be no reference low-carbon level or initial reference low-carbon level. In this instance, the players’ profits become identical, matching our graphs.
9. Conclusions
This paper studies the joint carbon emission reduction strategies in the “supplier–manufacturer–retailer–consumer” supply chain system. It takes corporate social responsibility, goodwill, and consumers’ reference low-carbon level as endogenous factors. The carbon emission reduction strategies are analyzed dynamically by considering random factors that affect the endogenous variables. Three stochastic differential games are proposed to investigate the mechanism between each player. Each model exhibits different properties, and provides alternative options for decision-making in emission reduction. It is found that:
- (1)
The efforts are highest in the cooperative game.
- (2)
When the manufacturer/retailer-driven cost-sharing contract is implemented, it can increase the other party’s initiative to positively participate in establishing a sustainable supply chain, and result in Pareto improvement. Additionally, the cost-sharing contract between retailer and consumer enables the consumer’s optimal effort to include the retailer’s marginal profit, which increases the consumers’ initiative to purchase low-carbon products.
- (3)
Although the trajectories of CSR goodwill, carbon emission reduction, and profits increase with time and reach a steady state, the dynamics before the steady state vary with the performance of the reference low-carbon level.
Our main difference lies in two points compared to the other’s work. Firstly, we have adopted the stochastic differential game to analyze the dynamic behavior of each player in the supply system (see Hypotheses (4) and (5) in
Section 2.2). According to our study, the reduction in carbon emissions and CSR goodwill will decrease under random disturbance and time evolution. Maintaining the long-term performance of carbon emission reduction is becoming increasingly difficult. Secondly, the demand for low-carbon products is not only affected by the CSR goodwill and retailers’ promotional efforts to sell low-carbon products, but also determined by consumers themselves. Hence, we have introduced the consumer’s reference low-carbon level to depict the consumer’s memory of the low-carbon level for previous products which, in turn, influences the demand for low-carbon products (see Hypotheses (6) and (7) in
Section 2.2). Take the manufacturer as an example. With a low initial reference low-carbon level, the actual low-carbon level of the product can quickly meet consumers’ needs. As the reference low-carbon parameter increases, market demand gradually increases, thereby improving the present value of the enterprise’s profit. On the contrary, for a high initial reference low-carbon level, the actual low-carbon level of the product cannot meet consumers’ needs. As the reference low-carbon parameter increases, market demand decreases, leading to a downward trend in the present value of the enterprise’s profit.
The following are some policy suggestions targeted at each supply chain member. Suppliers can benefit from participating in carbon trading markets to sell excess carbon credits, or purchase additional credits if needed, which will reduce operational costs in the long term by cutting energy consumption and emissions, improving their competitiveness in the global market. Manufacturers may adopt a carbon reduction cost-sharing contract with suppliers and retailers, to distribute the financial burden of investing in low-carbon technologies. Retailers can subsidize consumer purchases of low-carbon products by offering discounts or loyalty rewards for choosing environmentally friendly products. Government incentives for retailers participating in low-carbon promotions can further encourage these practices. For consumers, government-backed education campaigns should be launched to raise awareness about the benefits of low-carbon products. These campaigns can be paired with incentives such as tax deductions or rebates for purchasing low-carbon goods.
Here are some real-life examples supporting our conclusions:
- (1)
For the cooperative game, Unilever collaborates with suppliers, manufacturers, and retailers to reduce carbon emissions and promote sustainability across its supply chain. This aligns with the conclusion that cooperative efforts result in the highest reduction levels, as Unilever’s integrated approach has led to significant carbon reductions [
50]. Unilever’s cooperative actions show that joint efforts can achieve higher emission reduction levels, supporting the conclusion that the cooperative game model produces the most effective results.
- (2)
For cost-sharing contracts, Tesla has implemented cost-sharing contracts with its battery supplier, Panasonic, to reduce lithium-ion battery costs while promoting sustainability. This collaboration benefits both companies, and reduces emissions in the production process [
51]. Tesla’s cost-sharing approach validates the study’s conclusion that such contracts lead to Pareto improvement, incentivizing greater participation in emission reductions and sustainability.
- (3)
For low-carbon products, Patagonia has built a loyal consumer base by consistently promoting its environmental efforts. Consumers who “remember” Patagonia’s sustainability practices are more likely to purchase their products, demonstrating how brand reputation (CSR goodwill) influences consumer loyalty over time [
52]. Patagonia’s long-term focus on sustainability aligns with the study’s finding that the memory parameter
plays a crucial role in consumer behavior, with greater consumer memory enhancing the market demand.
This research can be extended in several directions in future work. Firstly, we only consider the manufacturer’s carbon emissions in production. Since carbon emissions occur throughout the life cycle of products, we can further discuss the carbon emissions of the supply chain, and where the carbon footprint should be involved. Secondly, this work briefly touches on policy factors like carbon trading systems. Still, it needs to deeply explore how global or regional policy shifts could affect long-term supply chain emission strategies. Future research could delve into the effects of policy uncertainty, international carbon market fluctuations, and how companies can adjust their emission reduction strategies in different regulatory environments. Thirdly, this work only focuses on specific industries, making the results less applicable to other sectors with different emission profiles and sustainability challenges. Future research could expand the research to include multiple industries, and comparing how different sectors handle carbon reduction would provide a broader perspective on the effectiveness of various strategies.

