

Analysis of the Spatio-Temporal Evolution of Urban Sports Service Facilities in the Yangtze River Delta


Abstract
1. Introduction
- (1)
- A spatial distribution evaluation method at the community life circle scale is proposed, incorporating three dimensions: spatial aggregation, spatial synergy, and spatial equalization;
- (2)
- Based on large-scale POI data, a comprehensive analysis of the spatio-temporal evolution of sports service facilities in community life circles of central cities in the Yangtze River Delta from 2013 to 2023 is conducted.
2. Related Works
- (1)
- The inequality of spatial distribution of sports service facilities: The spatial distribution of urban sports facilities is often characterized by inequality. Urban core areas tend to have a higher concentration of sports facilities, while peripheral or edge areas are relatively scarce in these facilities [14,15]. This phenomenon is commonly observed in major cities in both developed and developing countries. Researchers have analyzed the distribution of sports facilities in different cities using spatial autocorrelation methods such as the Global Moran’s I and Local Moran’s I, finding a strong spatial clustering of these facilities, particularly in economically developed and densely populated areas [16]. Liu et al. analyzed the spatial layout of sports facilities in major Chinese cities and found that central urban areas are rich in sports facility resources, while peripheral areas are relatively deficient, demonstrating a significant “core-periphery” structure [17].
- (2)
- Spatial characteristics of different types of sports service facilities: There are differences in the distribution of various types of sports facilities (e.g., gyms, stadiums, swimming pools, and park sports fields) within cities [18]. For instance, large sports venues are typically concentrated in urban core areas or specific zones (such as university districts or government-planned sports centers), while smaller sports facilities are more dispersed and usually serve specific communities [19,20,21]. Zhao et al. conducted an analysis of the types and spatial distribution of sports facilities in several European cities, finding that large sports facilities exhibit strong spatial clustering, while smaller community sports facilities show a relatively balanced distribution pattern [22].
- (3)
- The relationship between urban development and sports service facility distribution: As cities expand and develop, the spatial layout of sports facilities is often closely related to urban functional zoning and population density [23,24]. Early research has indicated that the planning of sports facilities has primarily focused on the economic benefits and urban functionality, often neglecting the actual fitness needs of residents [25]. With the promotion of sustainable development concepts, recent studies have increasingly focused on the equity and accessibility of sports facilities. Baran et al. found that in planning sports facilities, some North American cities tended to emphasize the overall design of the urban landscape while overlooking balanced layouts in residential areas, resulting in a scarcity of sports facility resources in impoverished communities [26].
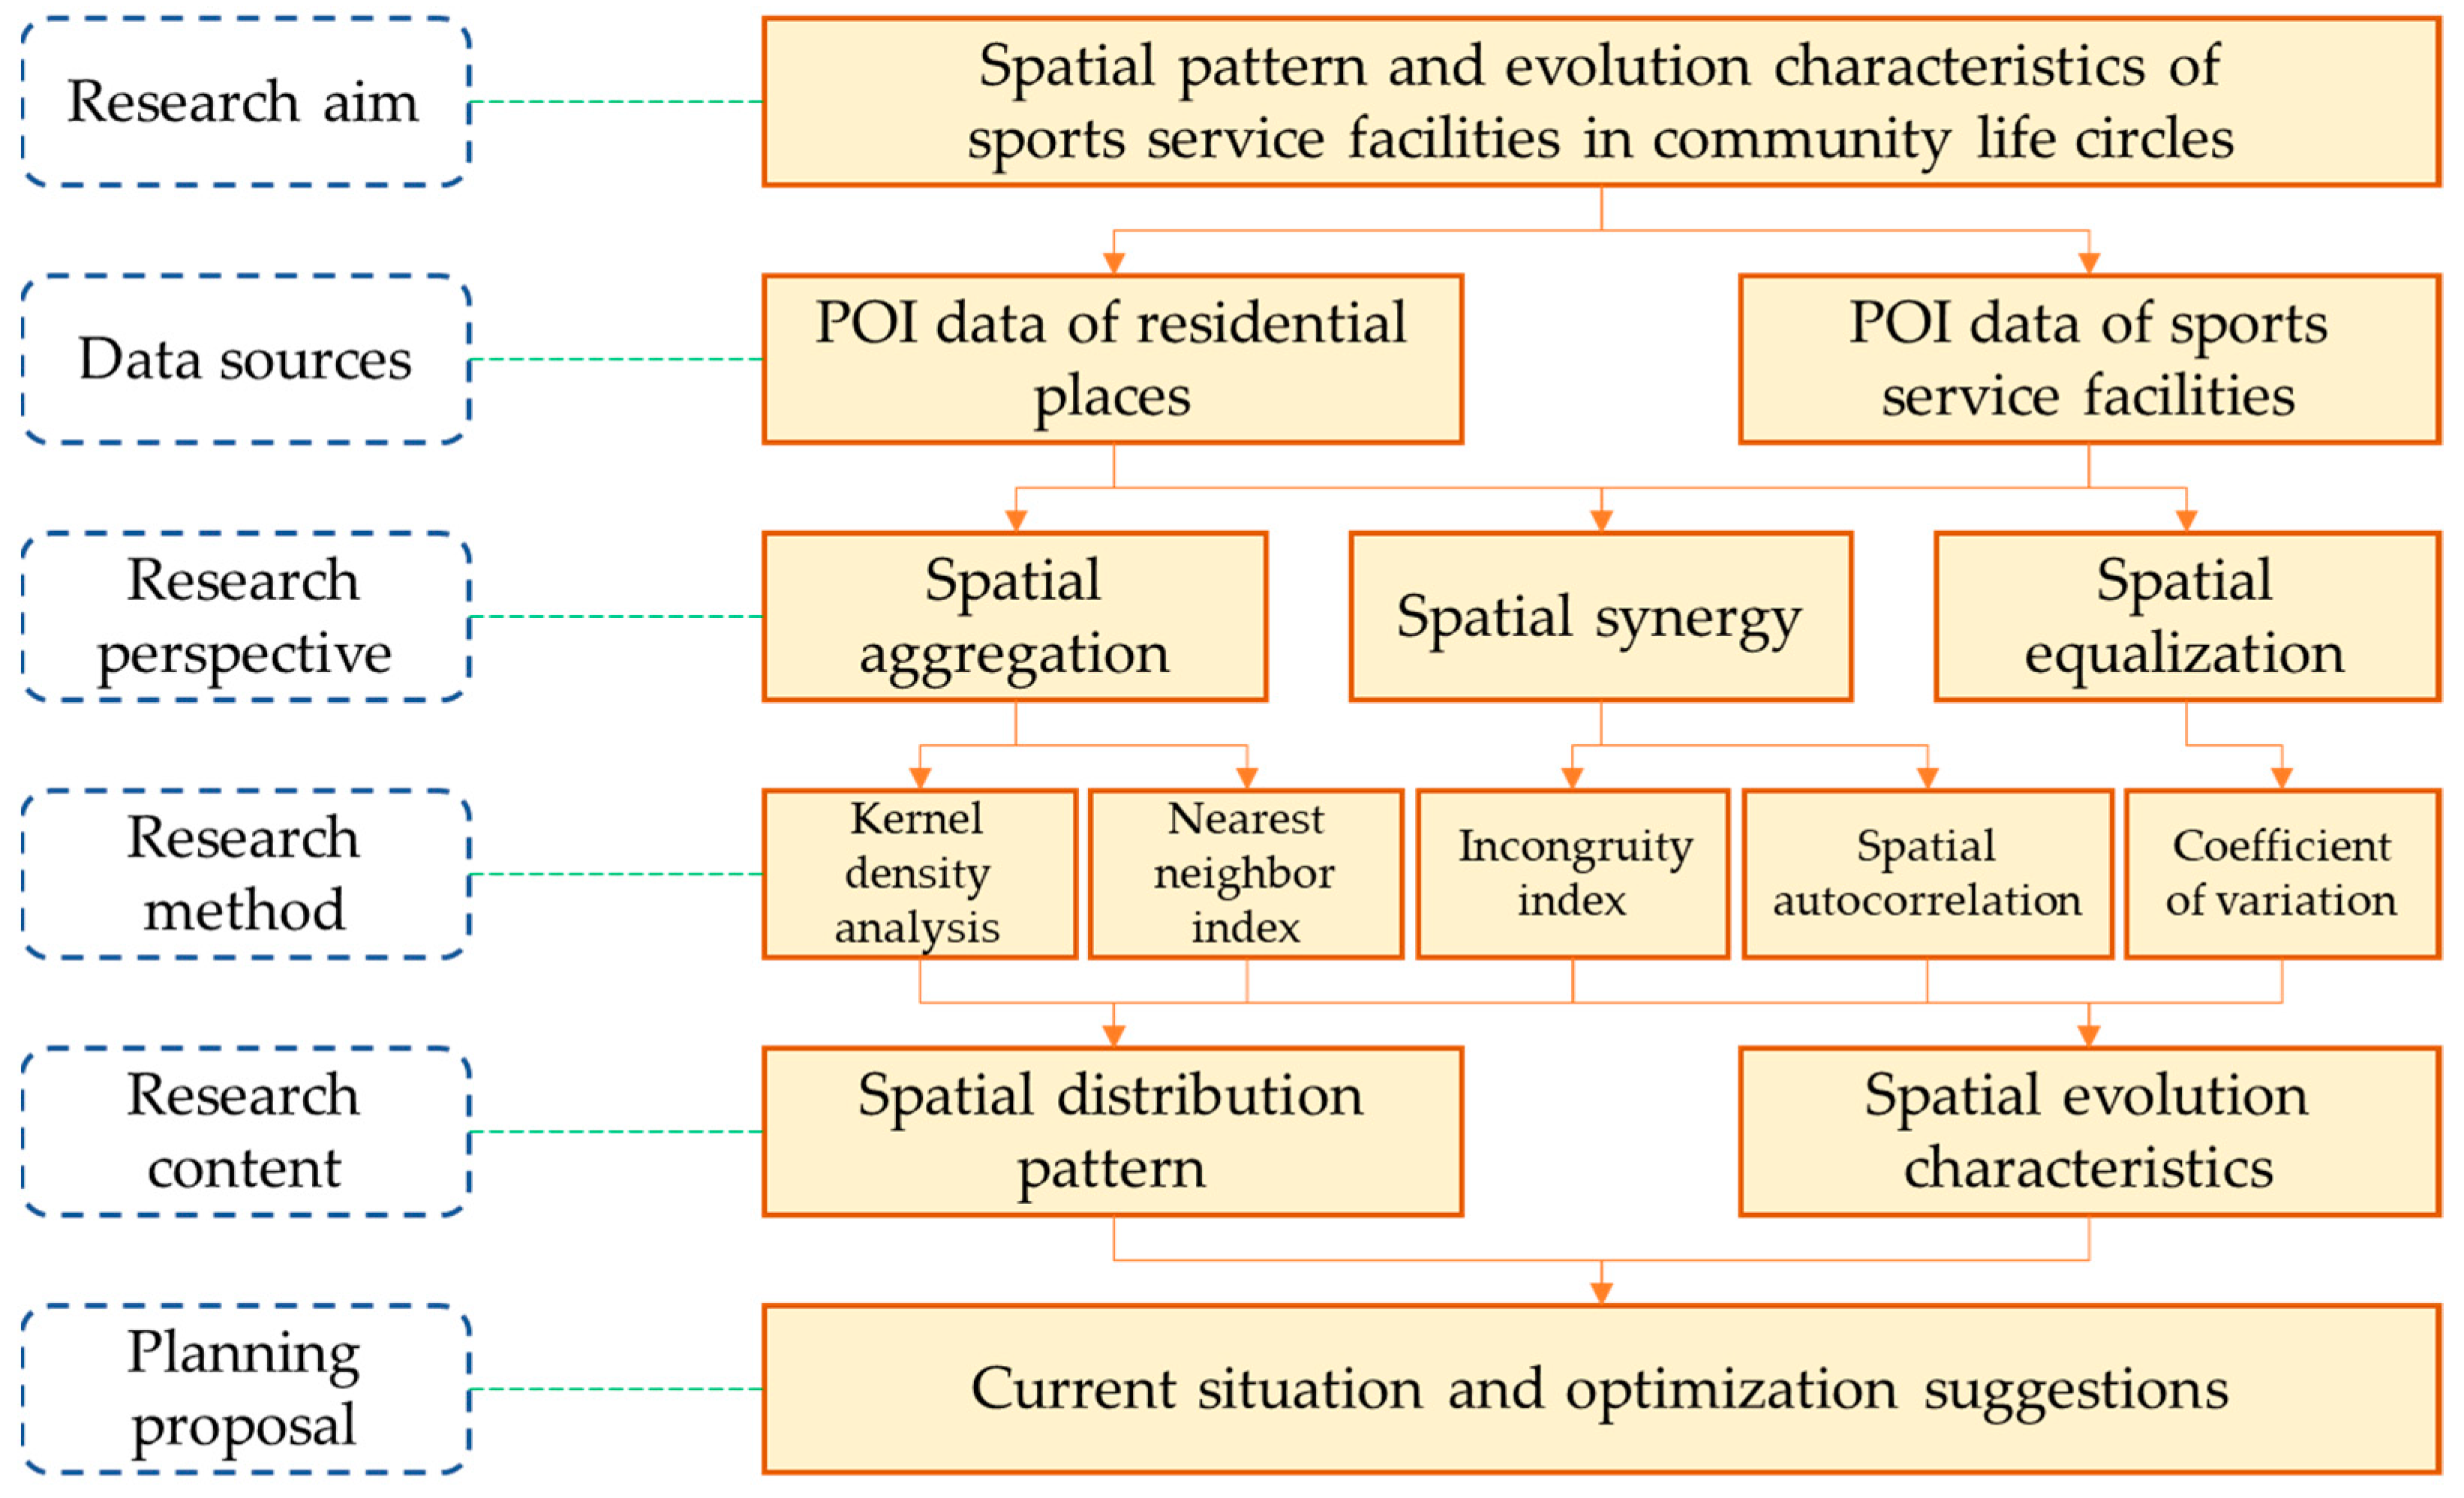
3. Research Data and Methods
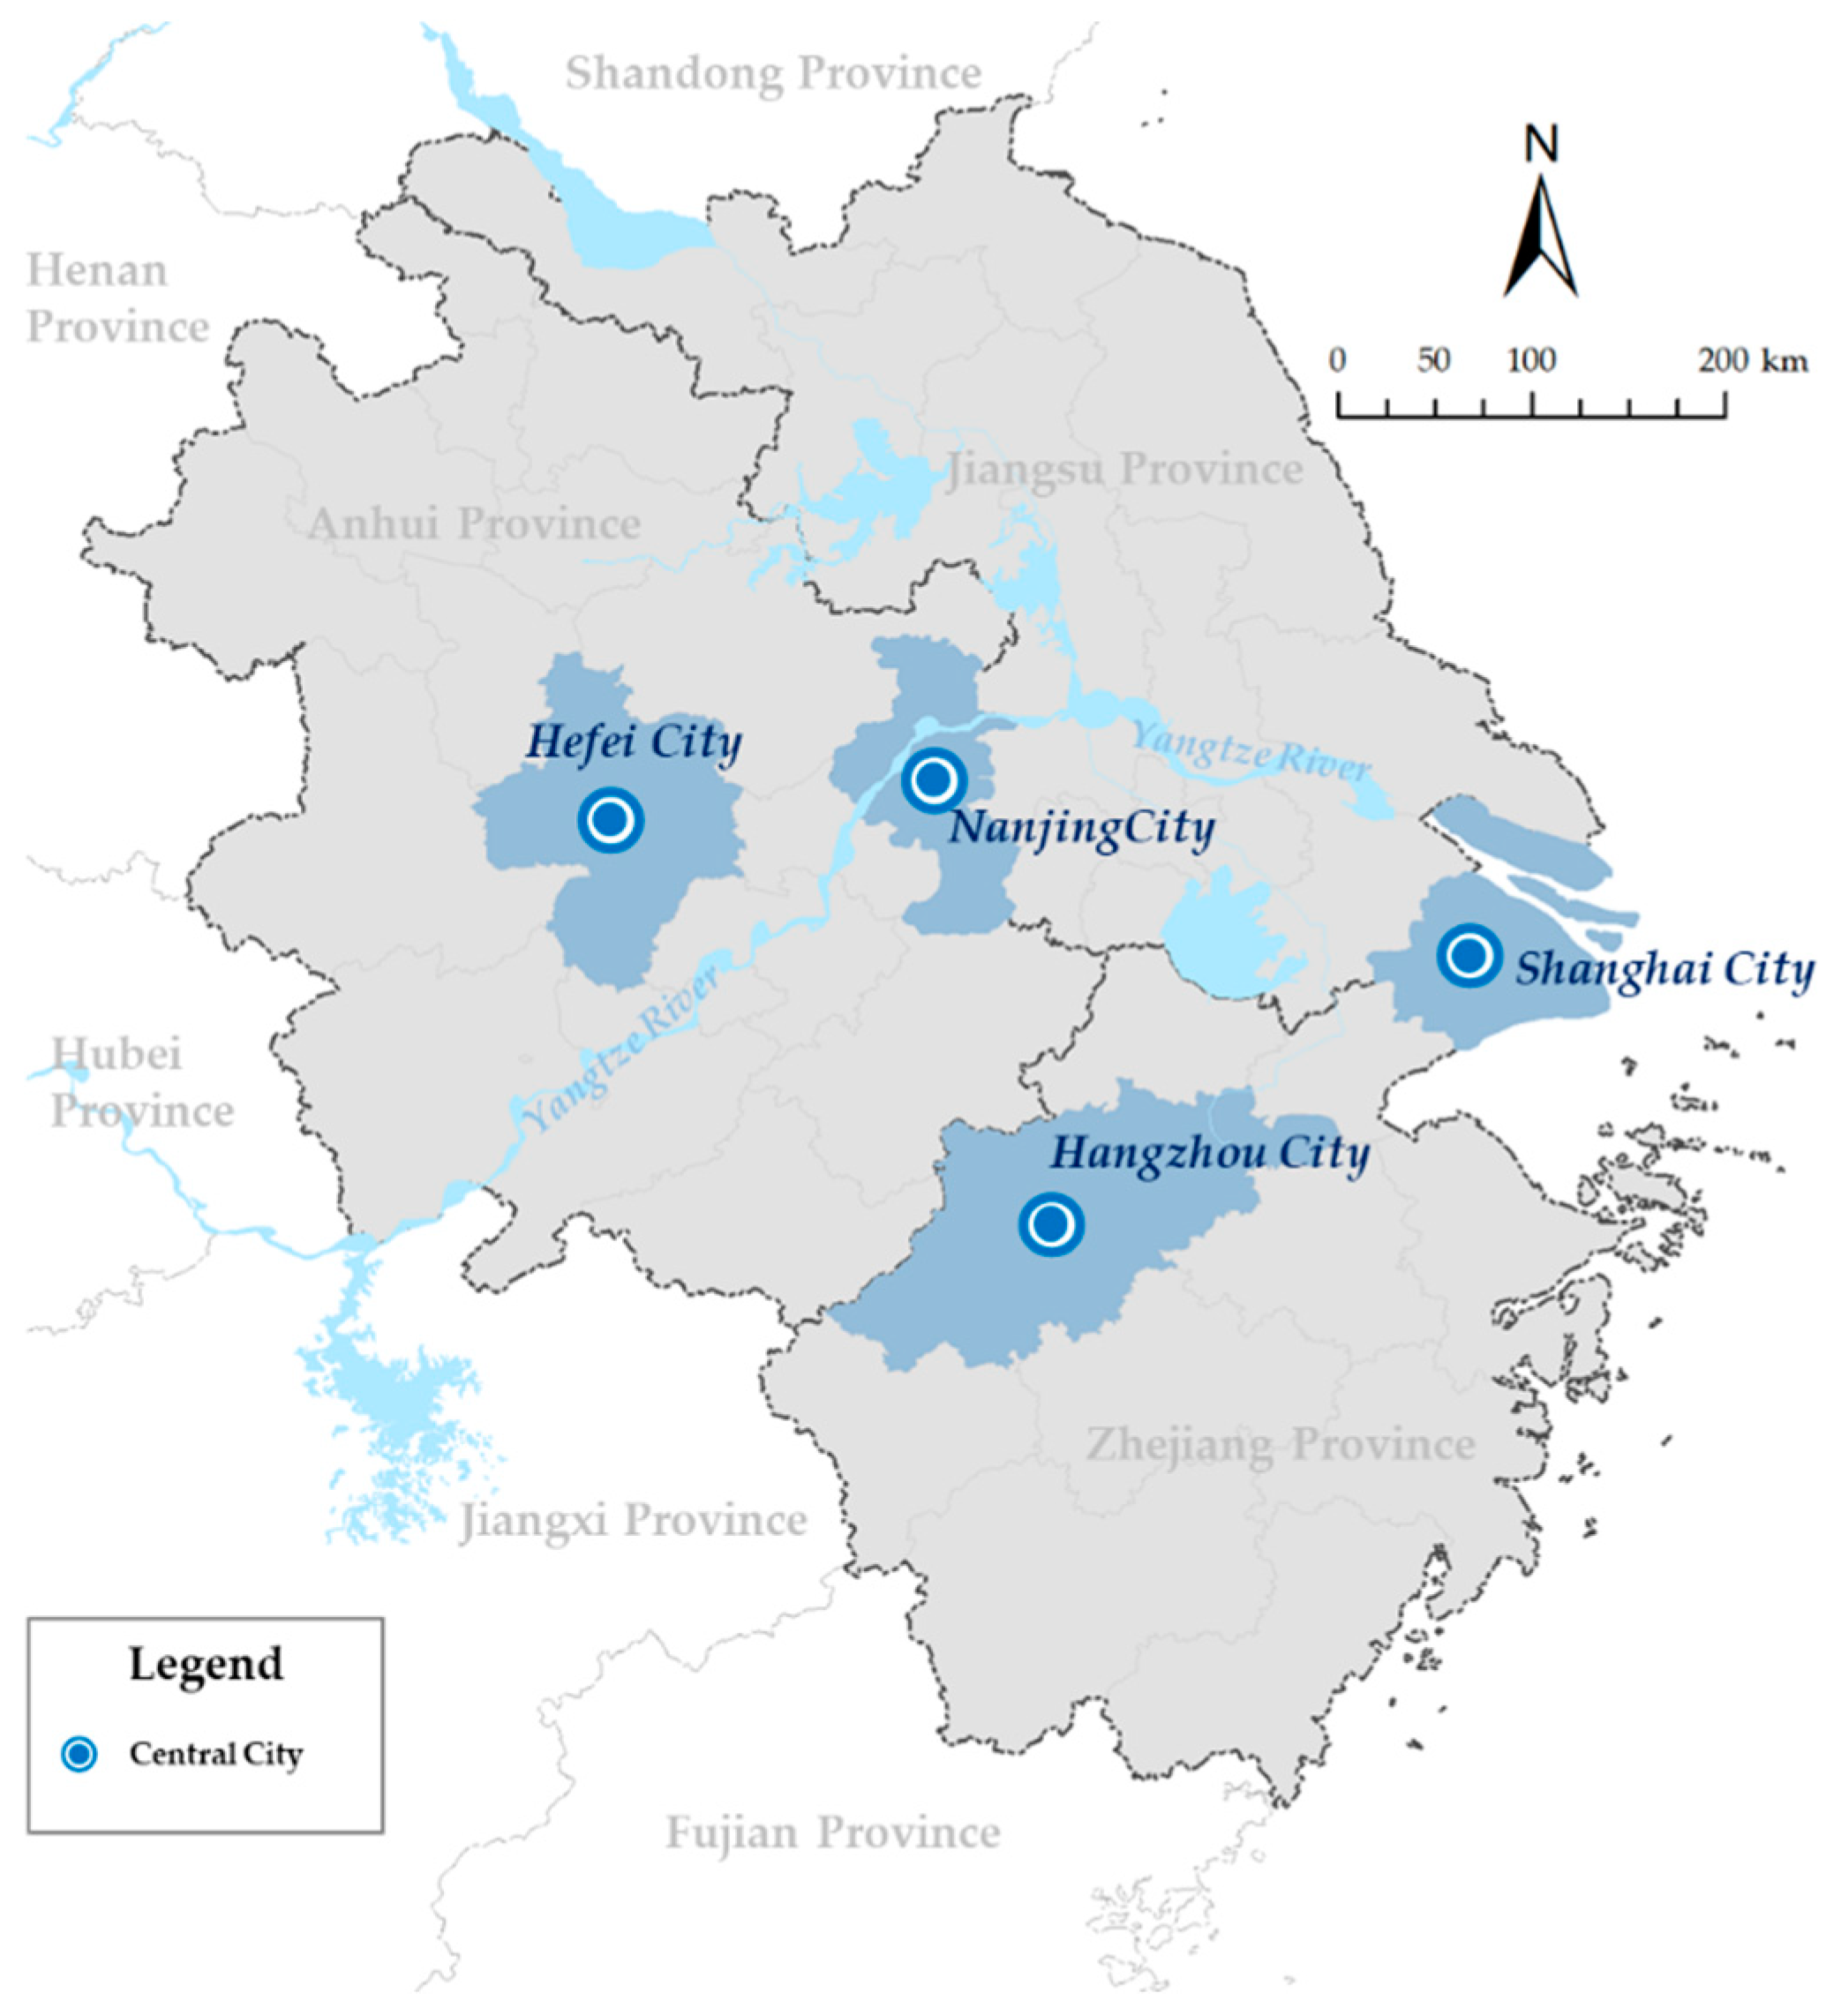
3.1. Research Area
3.2. Data Sources
3.3. Research Methods
3.3.1. Delimitation of Community Life Circles
3.3.2. Classification System for Sports Service Facilities
3.3.3. Spatial Allocation Evaluation Indicators
- (1)
- Aggregation Characteristics
- (2)
- Synergy Characteristics
- (3)
- Equalization Characteristics
4. Results and Analysis
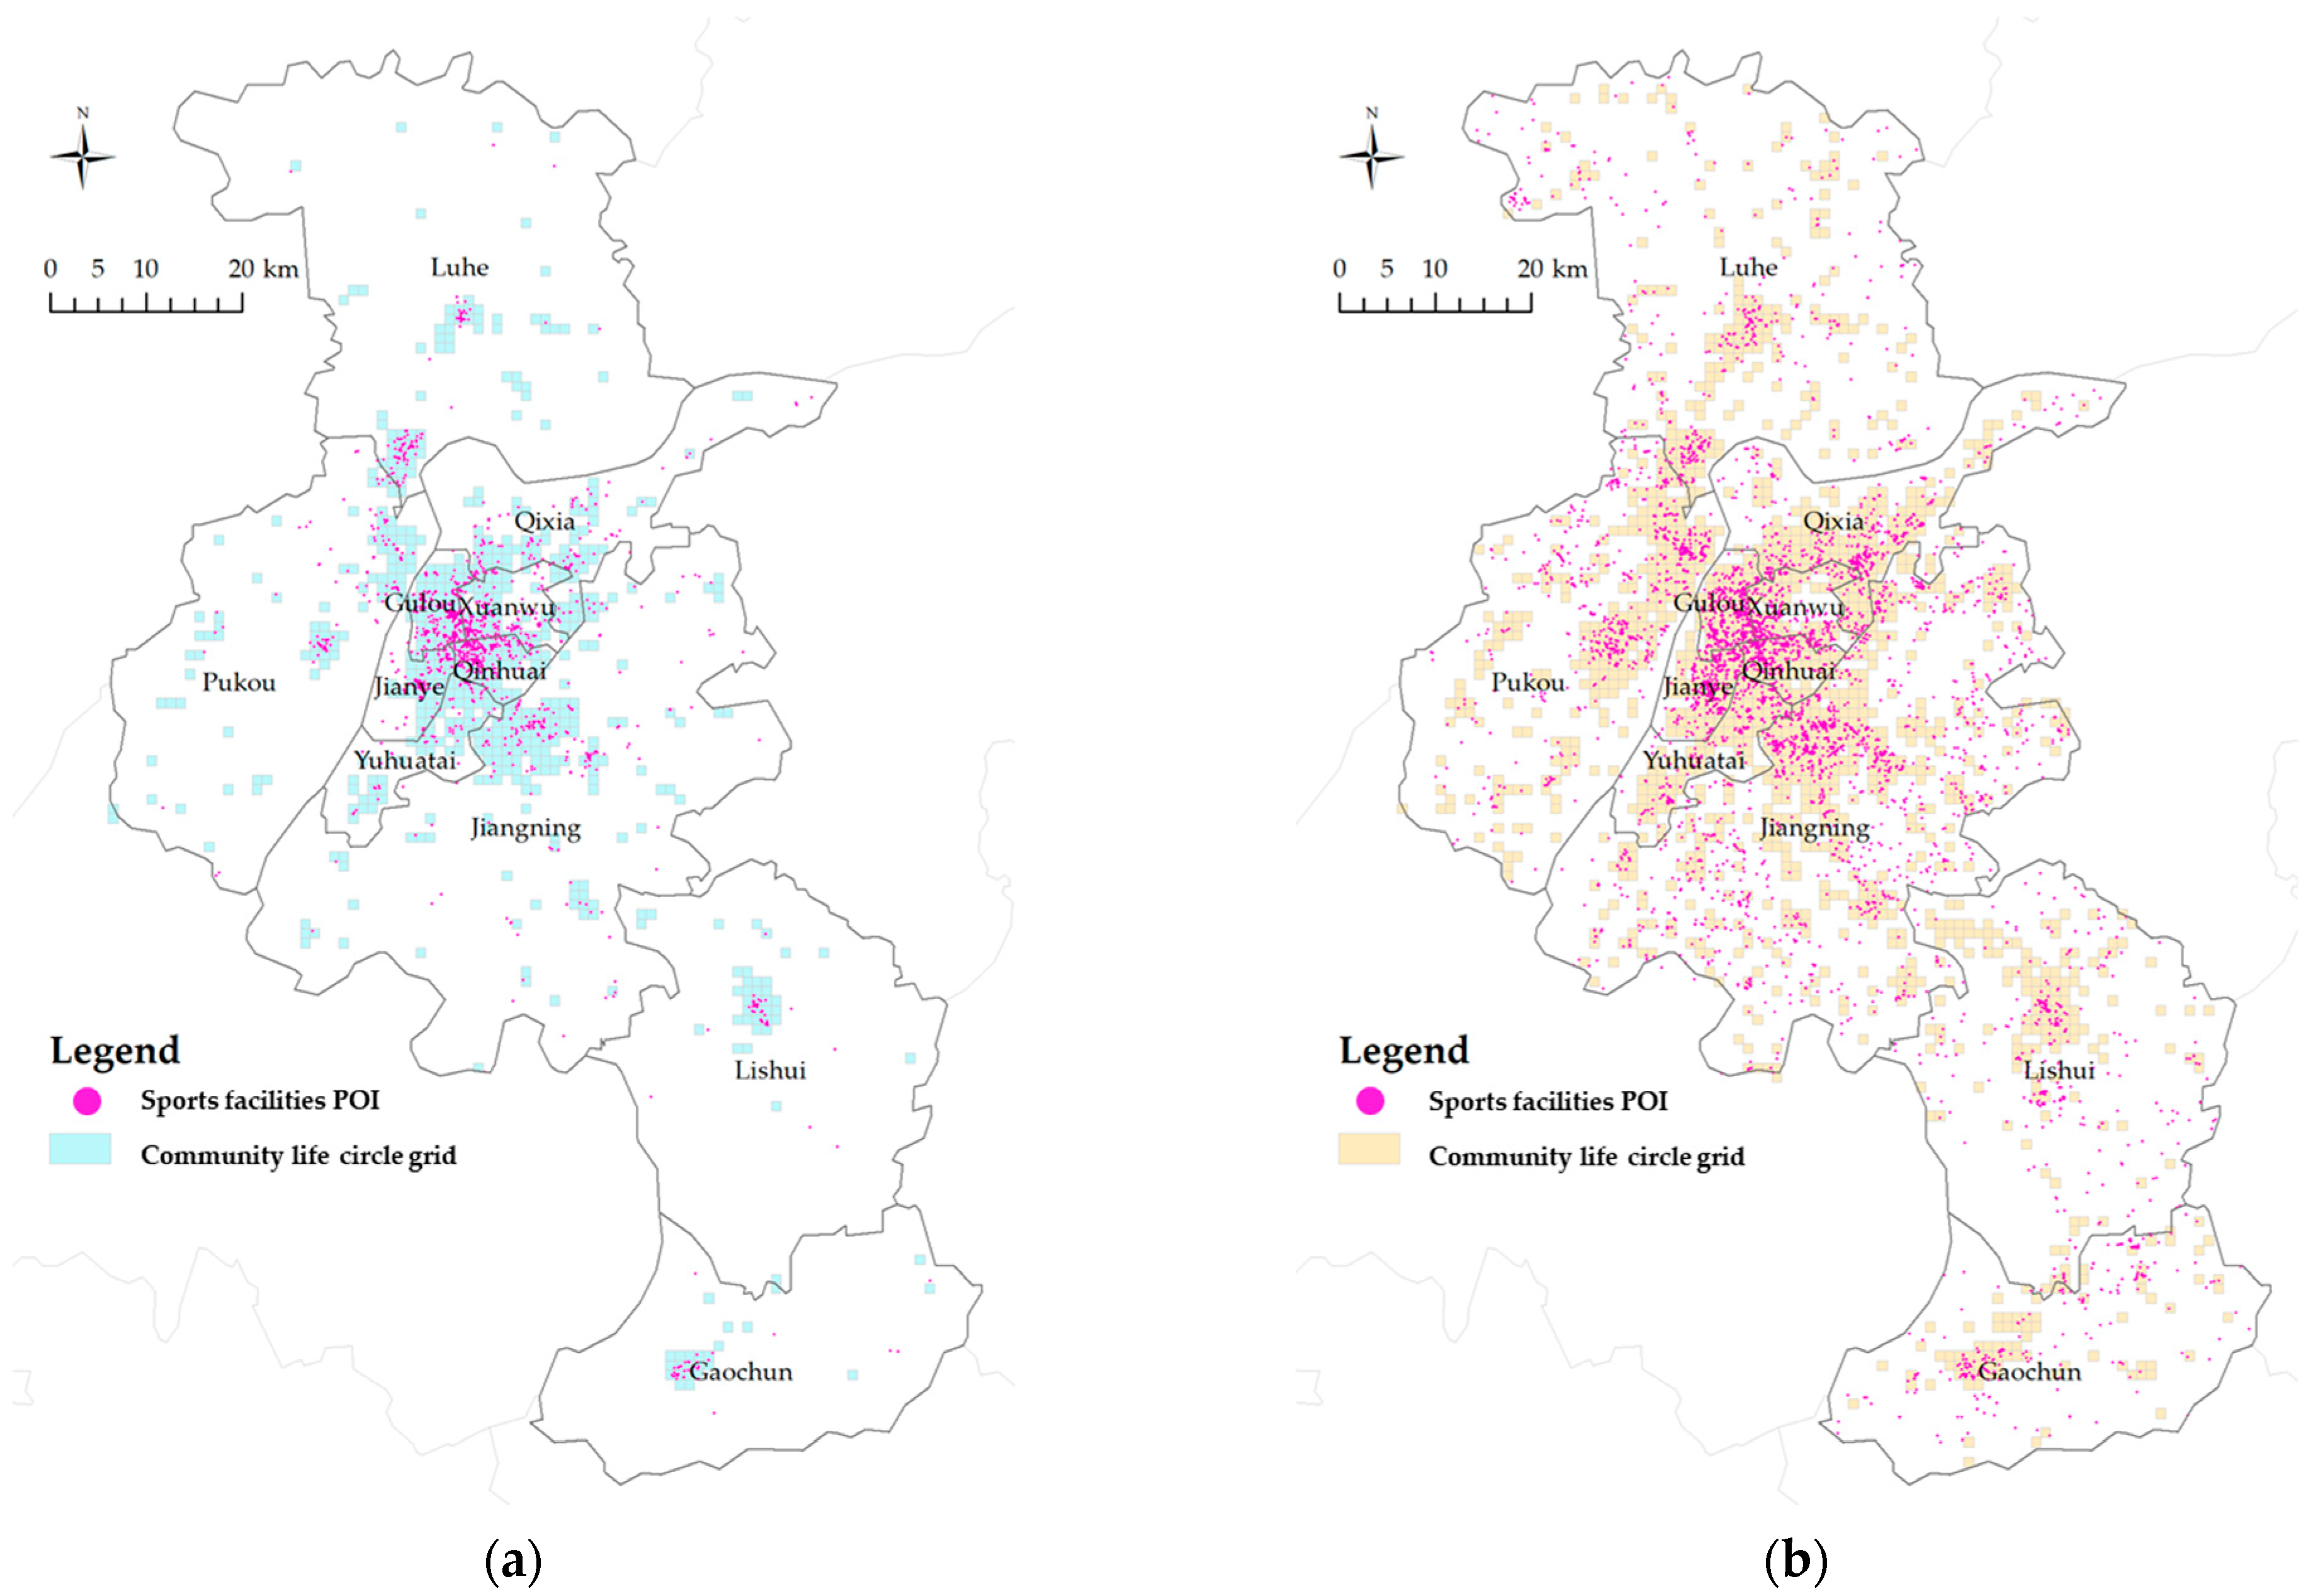
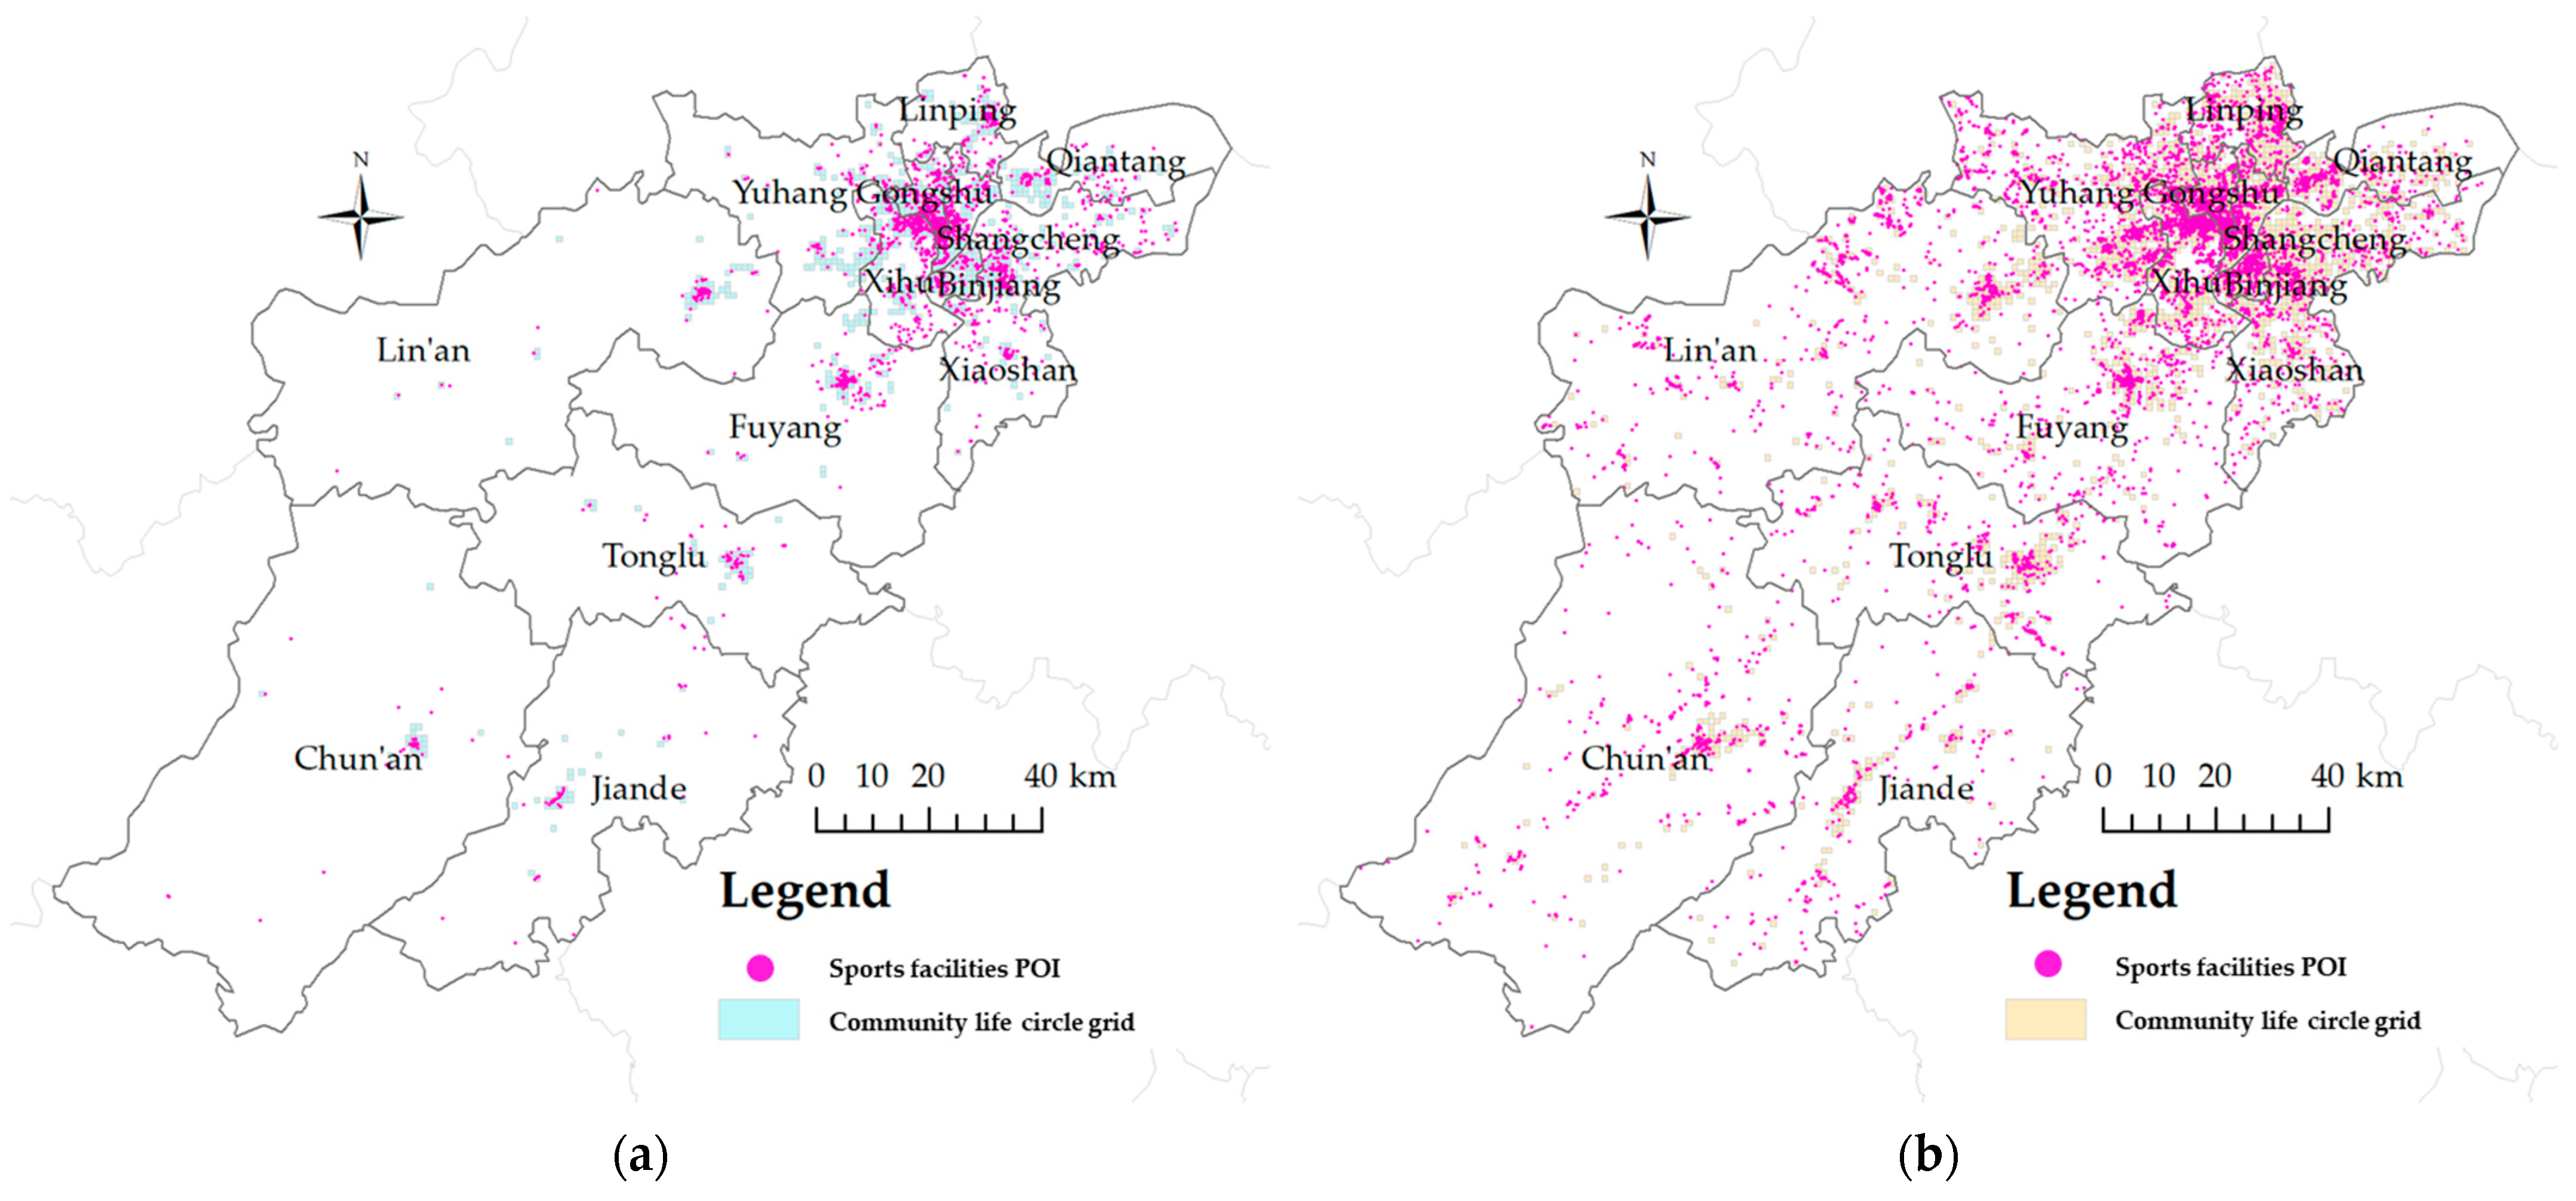
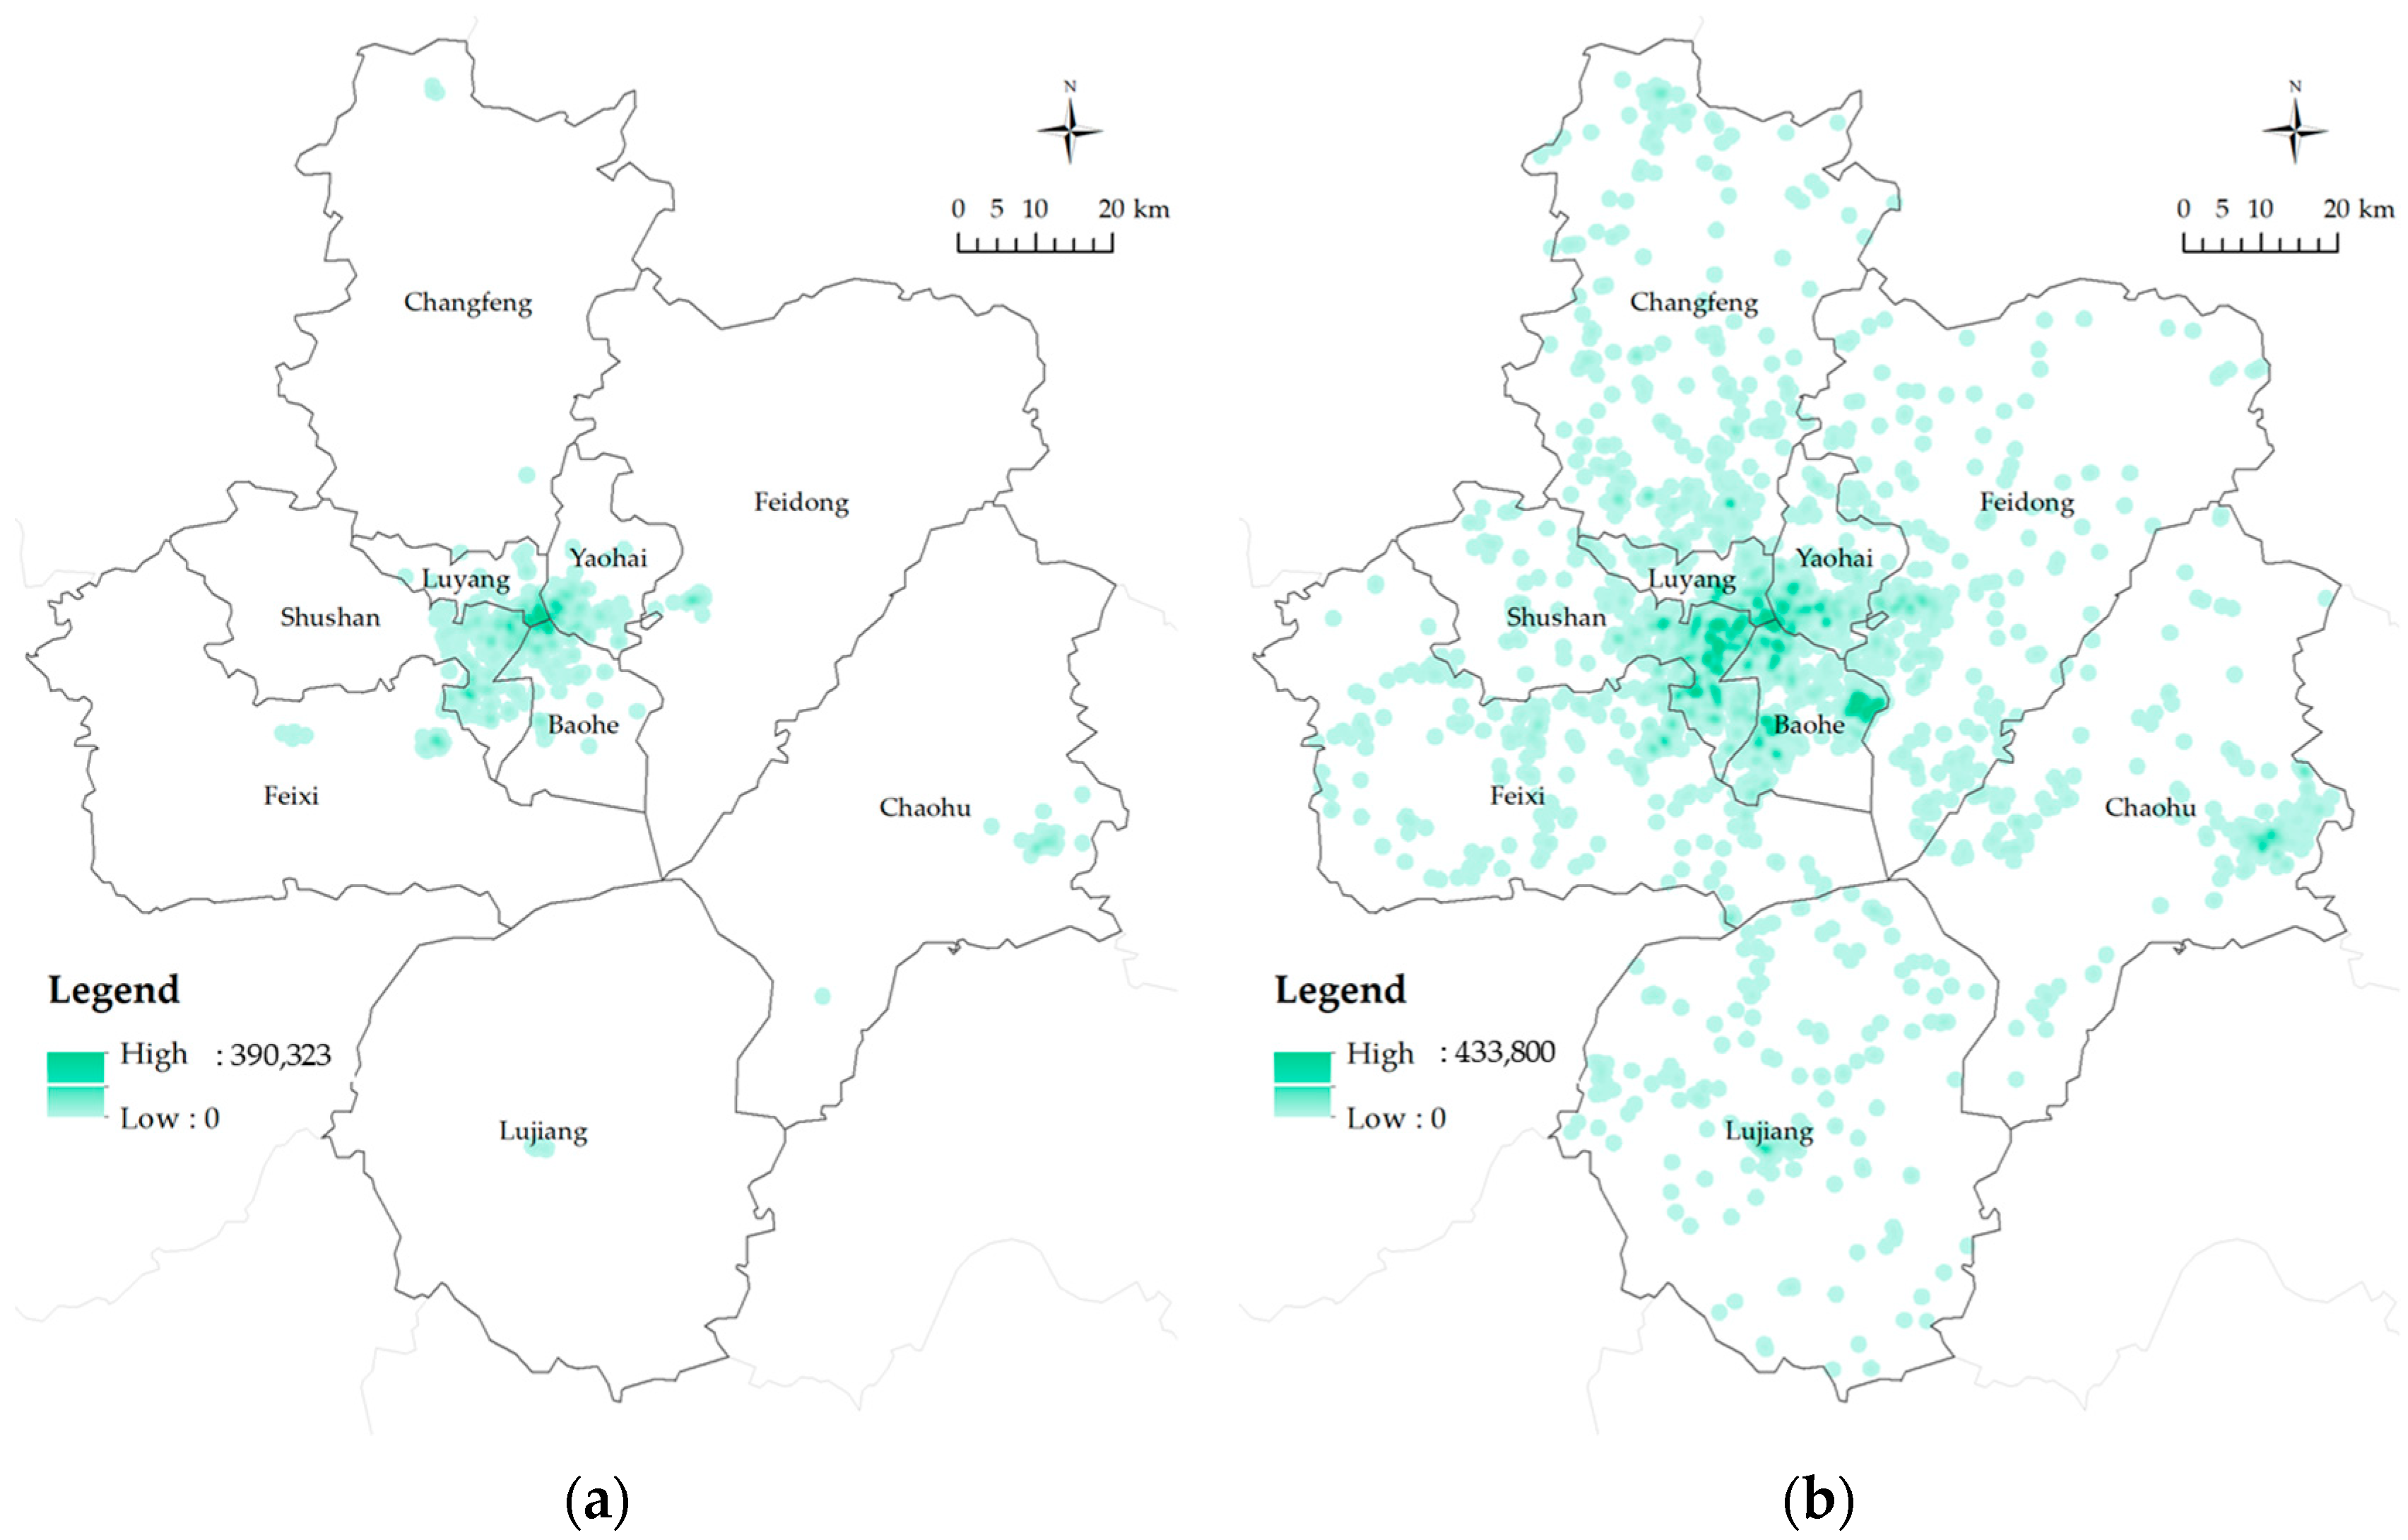
4.1. Aggregation Characteristics Analysis
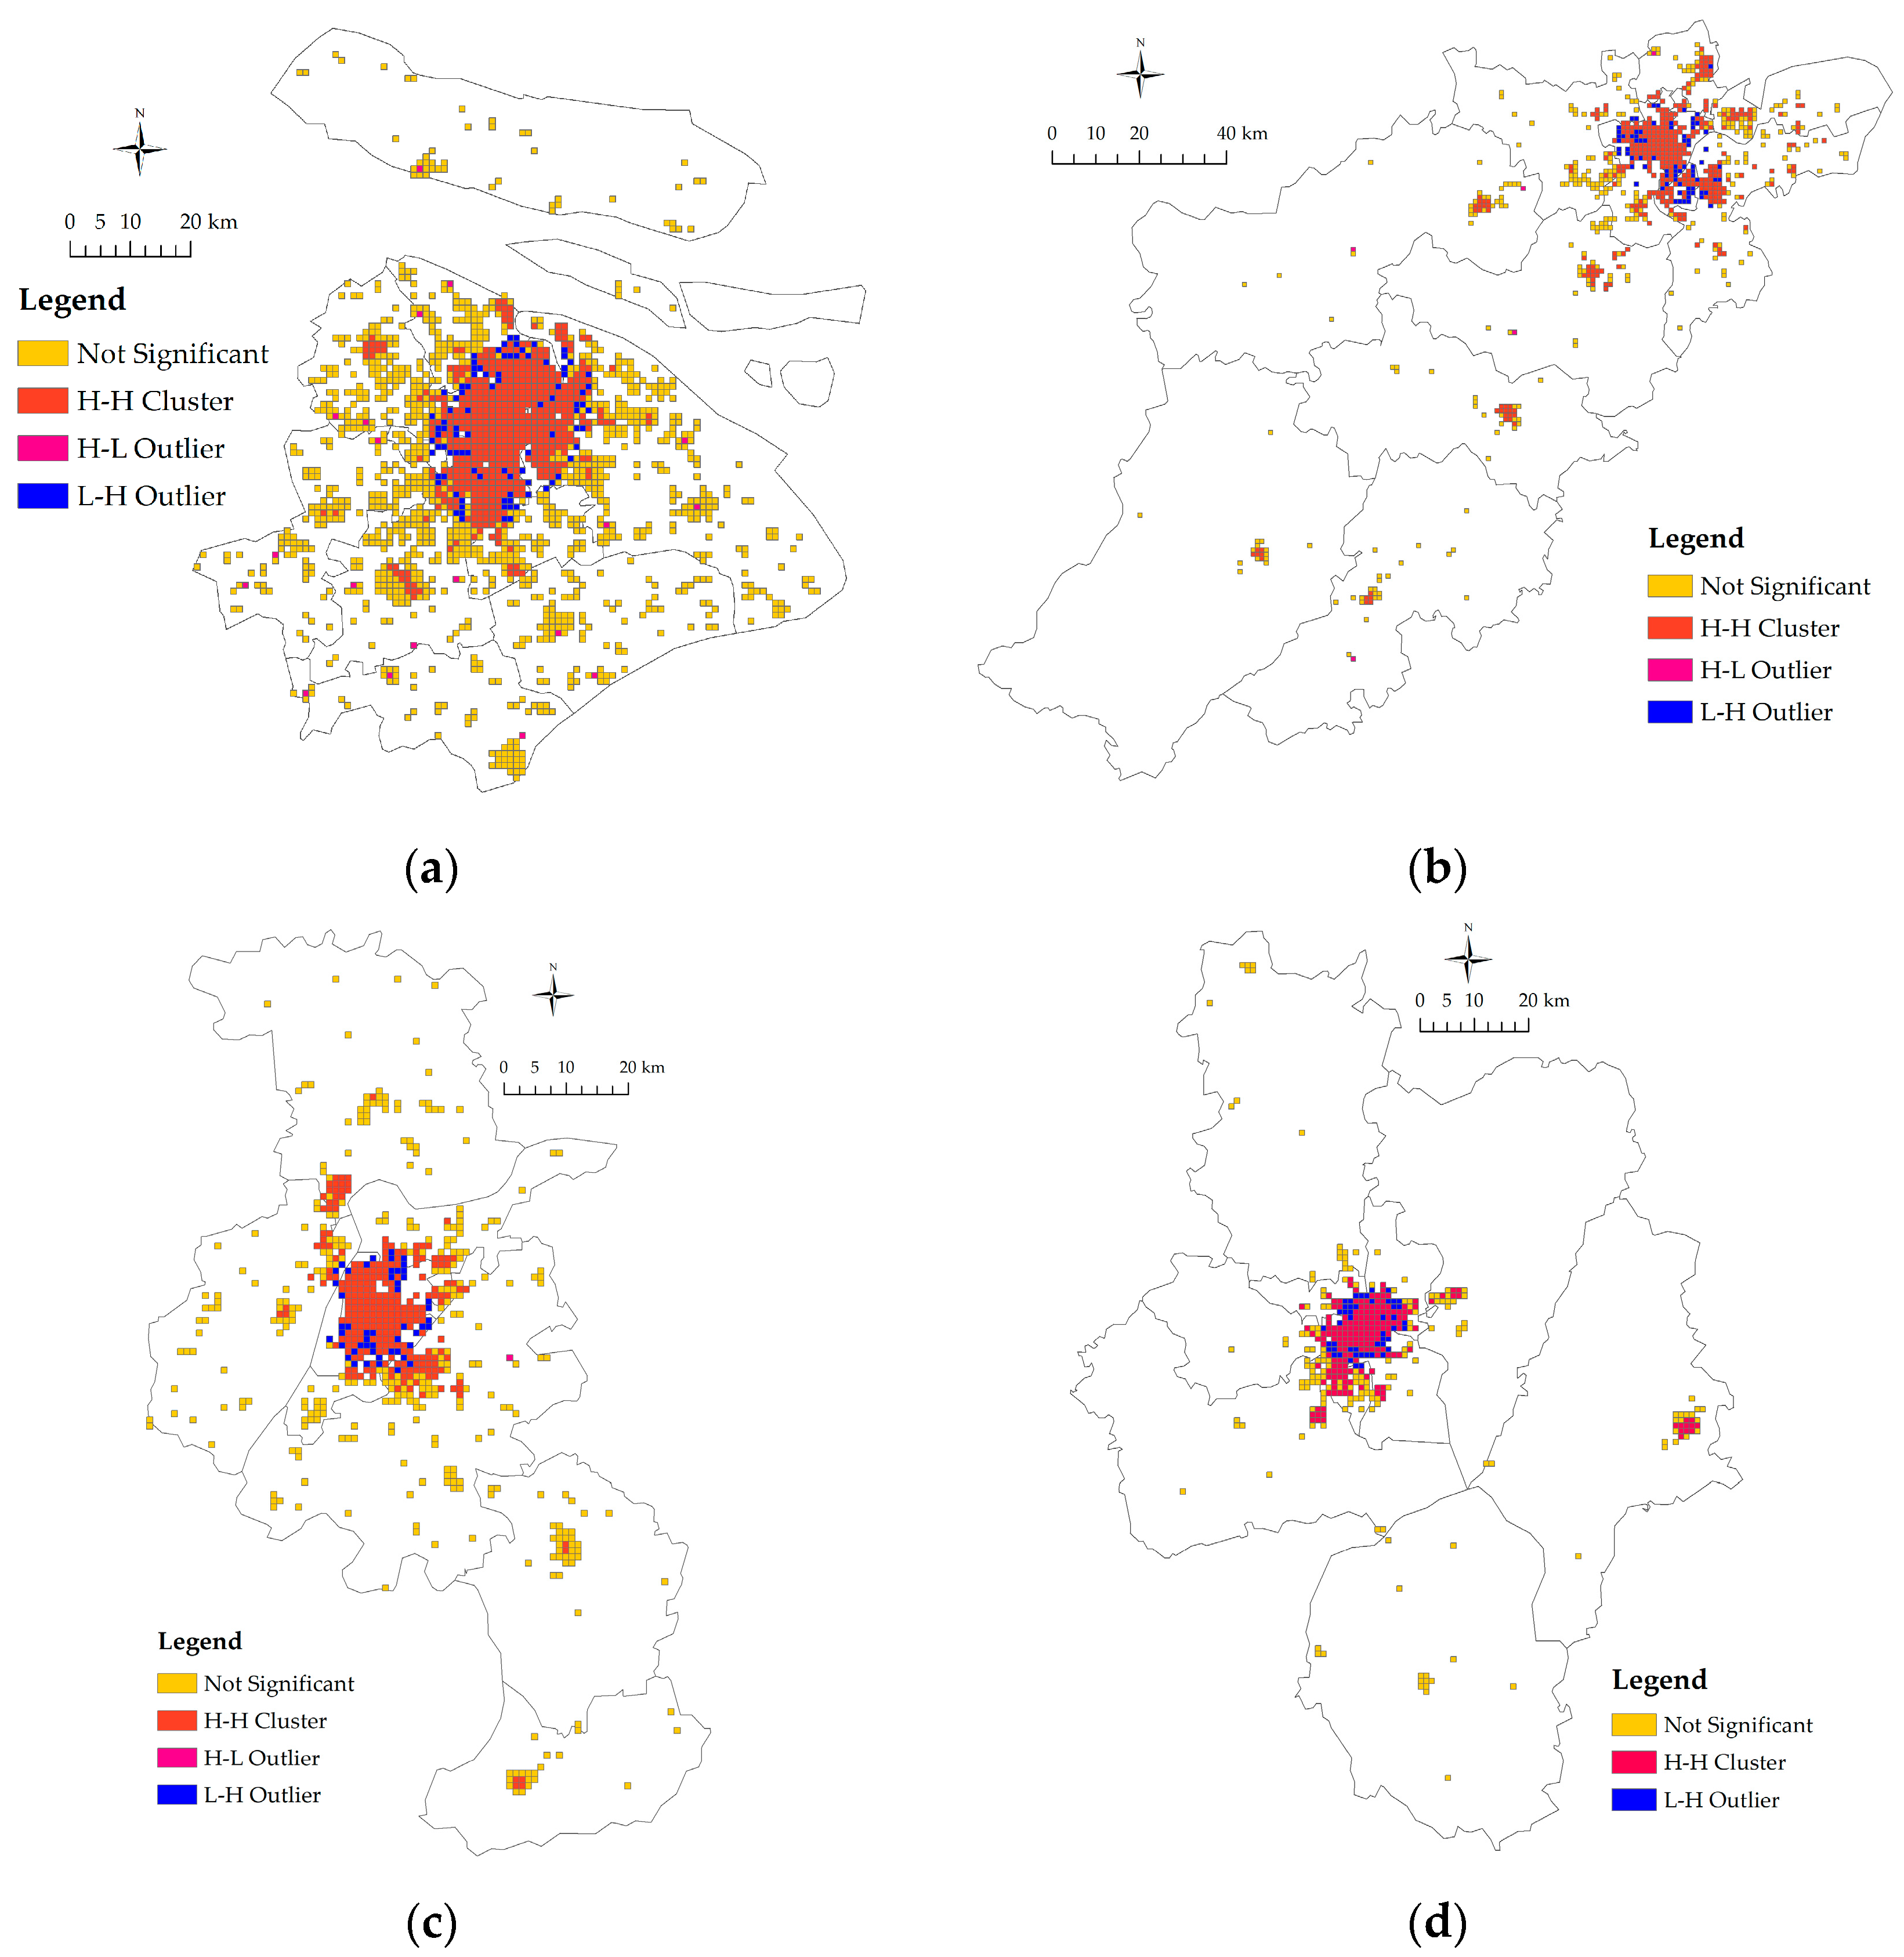
4.2. Synergy Characteristics Analysis
- (1)
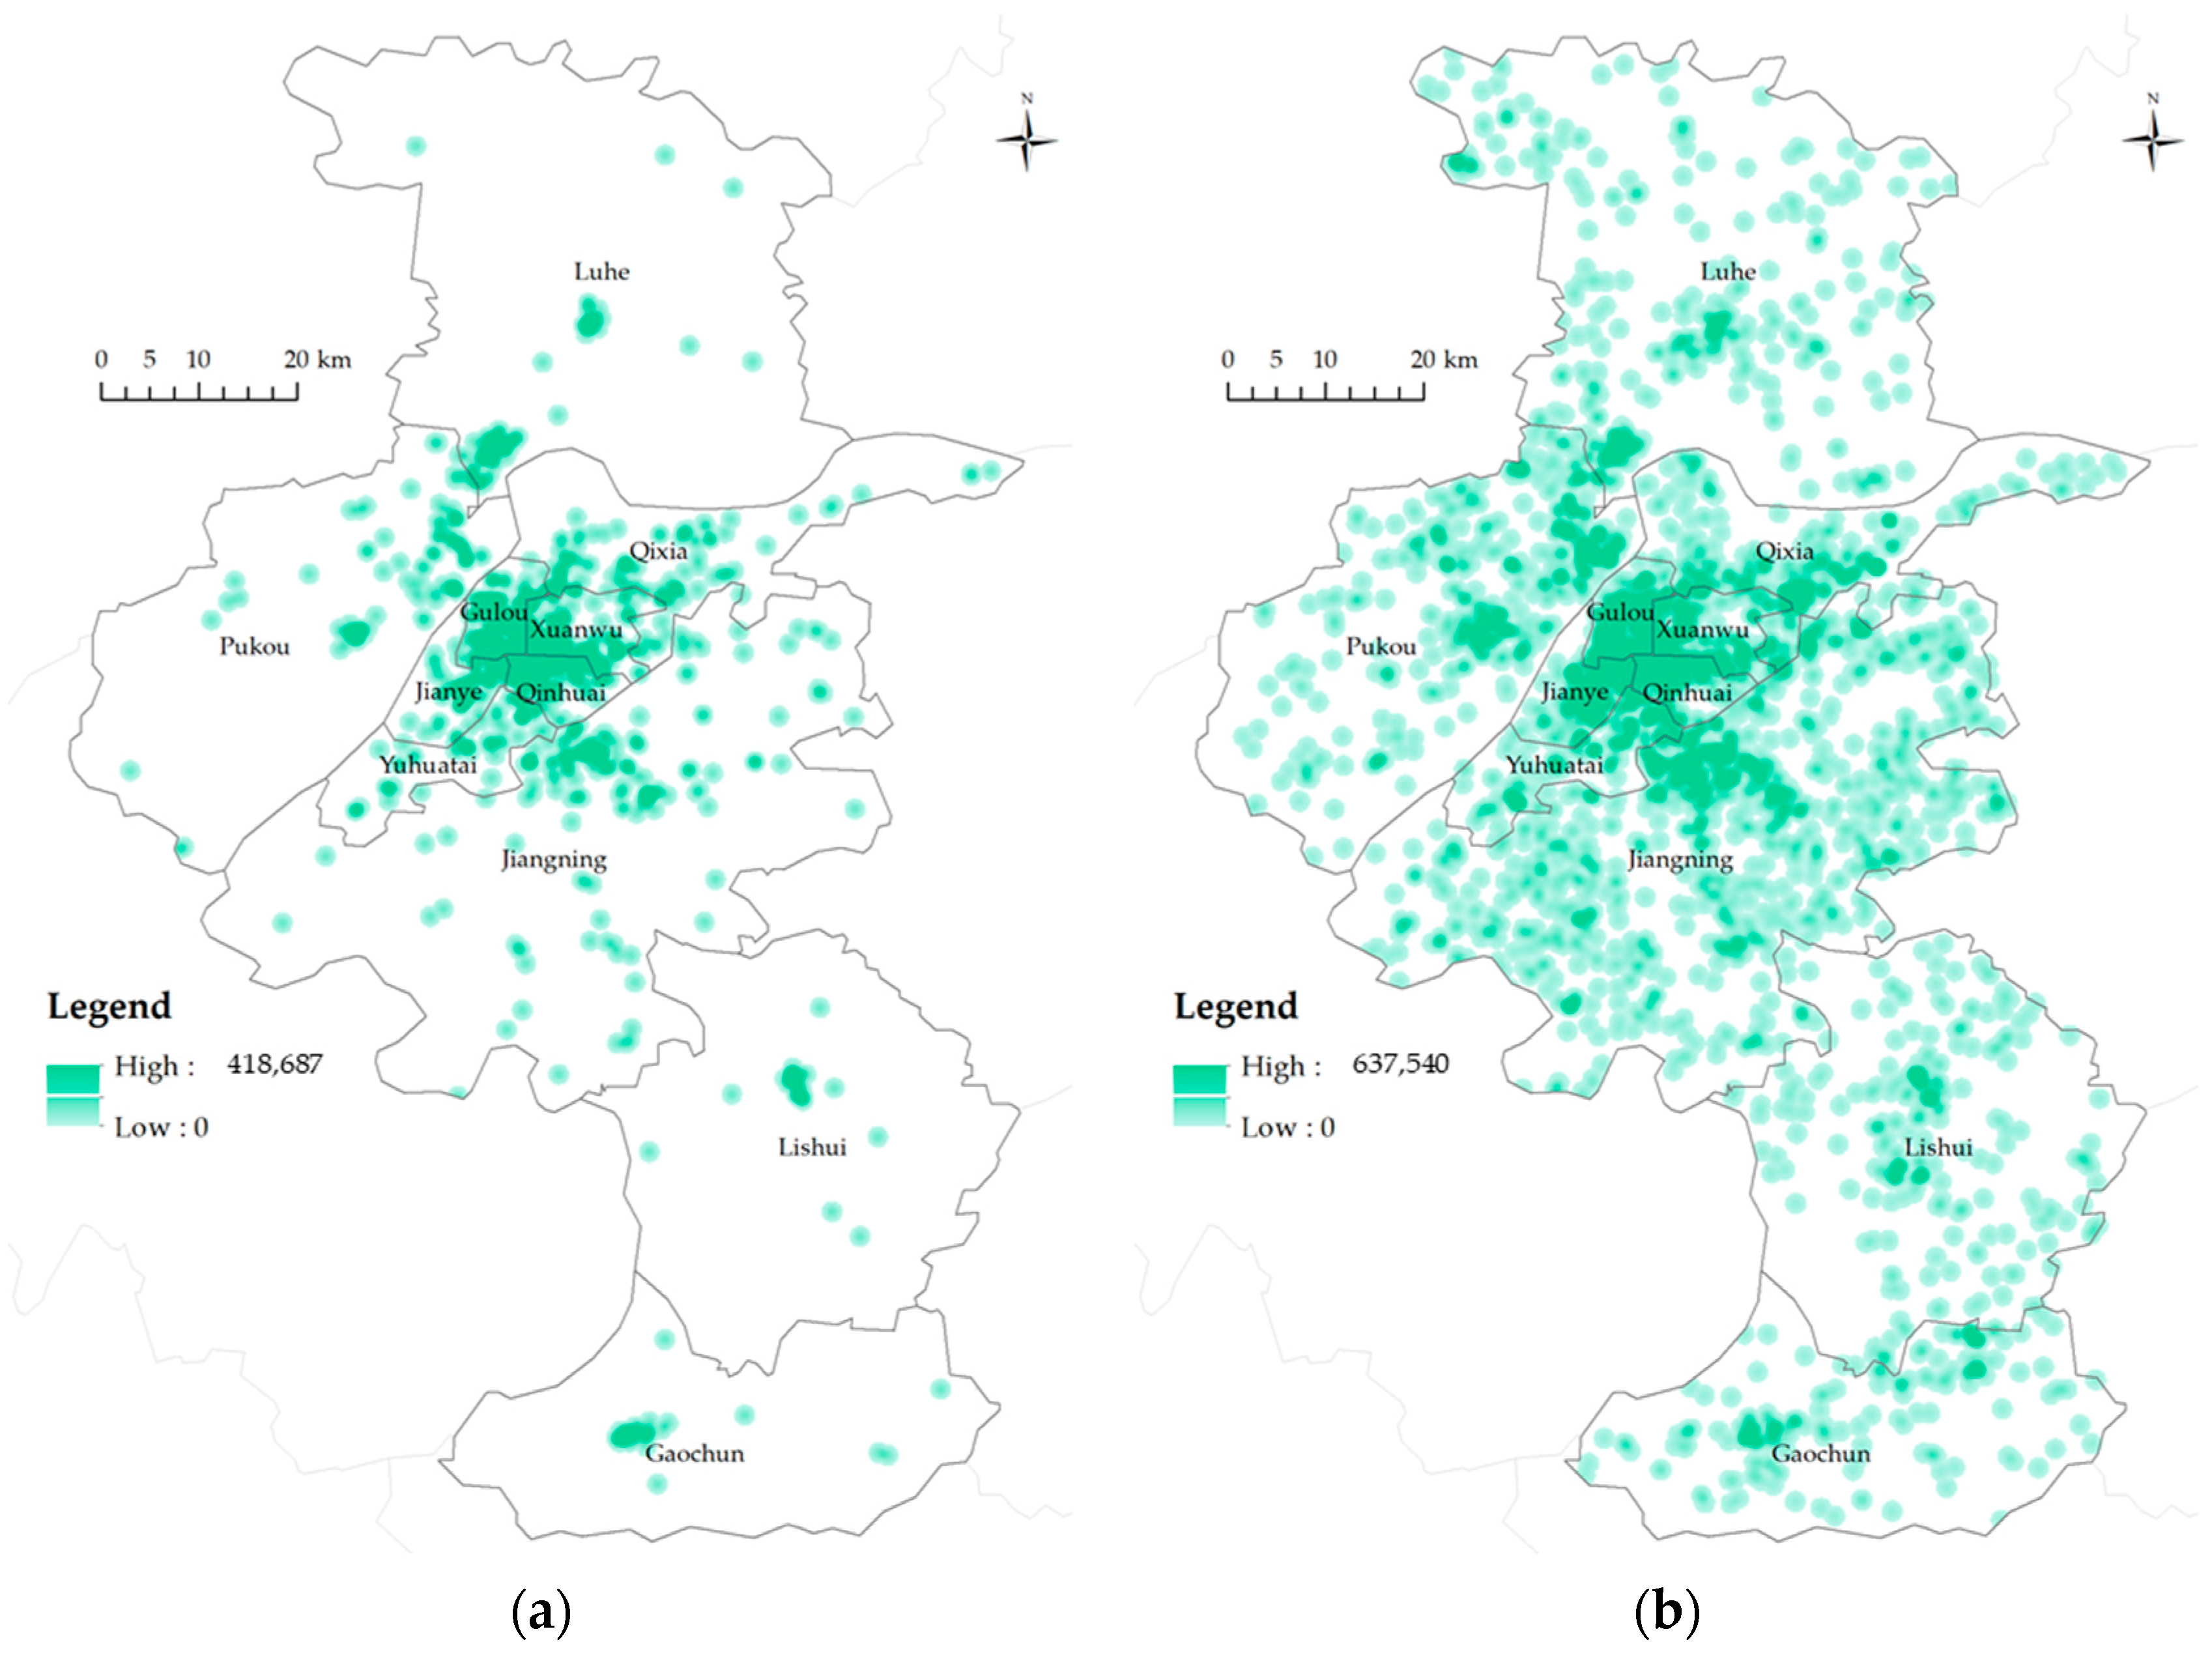
- In 2013: Only Shanghai City had a synergy index greater than 1, indicating a proactive matching synergy. The number of sports facilities in Shanghai City exceeded the combined total of Nanjing City, Hangzhou City, and Hefei City, suggesting that Shanghai’s overall provision of sports facilities surpassed the requirements of its community life circles. This indicates that Shanghai City’s allocation of sports service facilities more effectively supports and serves its community life circles. In contrast, Nanjing City, Hangzhou City, and Hefei City all had synergy indices less than 1, indicating a lagging synergy. Hefei City had the lowest synergy index at 0.81, reflecting inadequate matching.
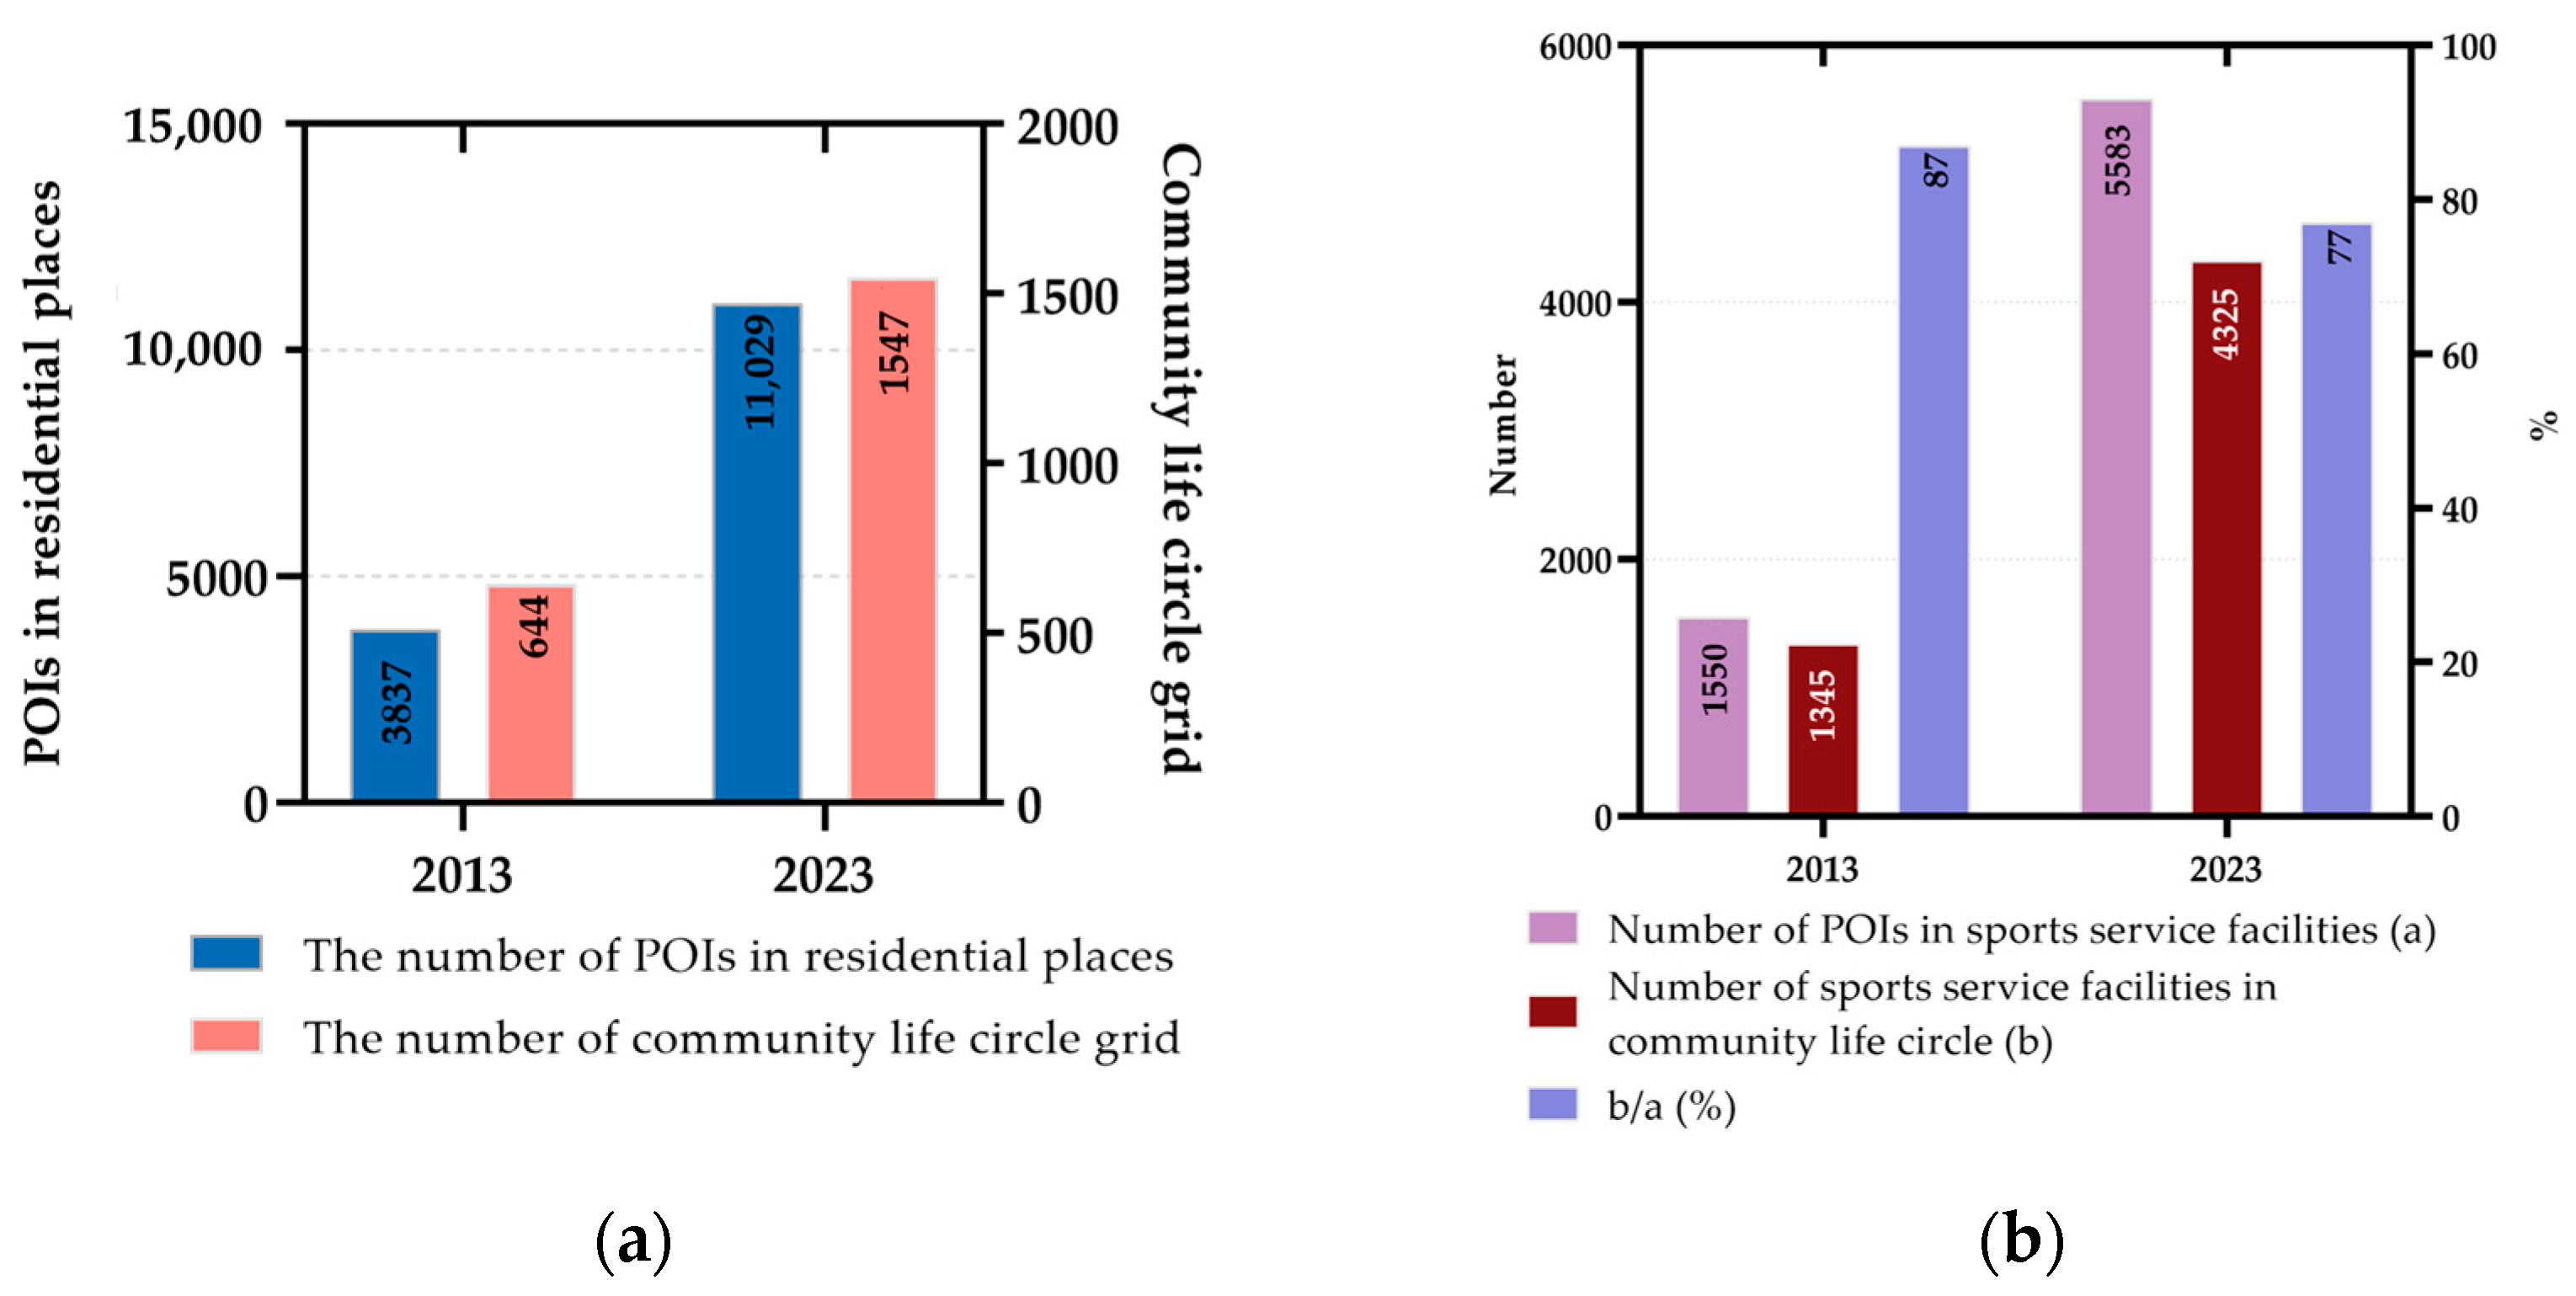
- (2)
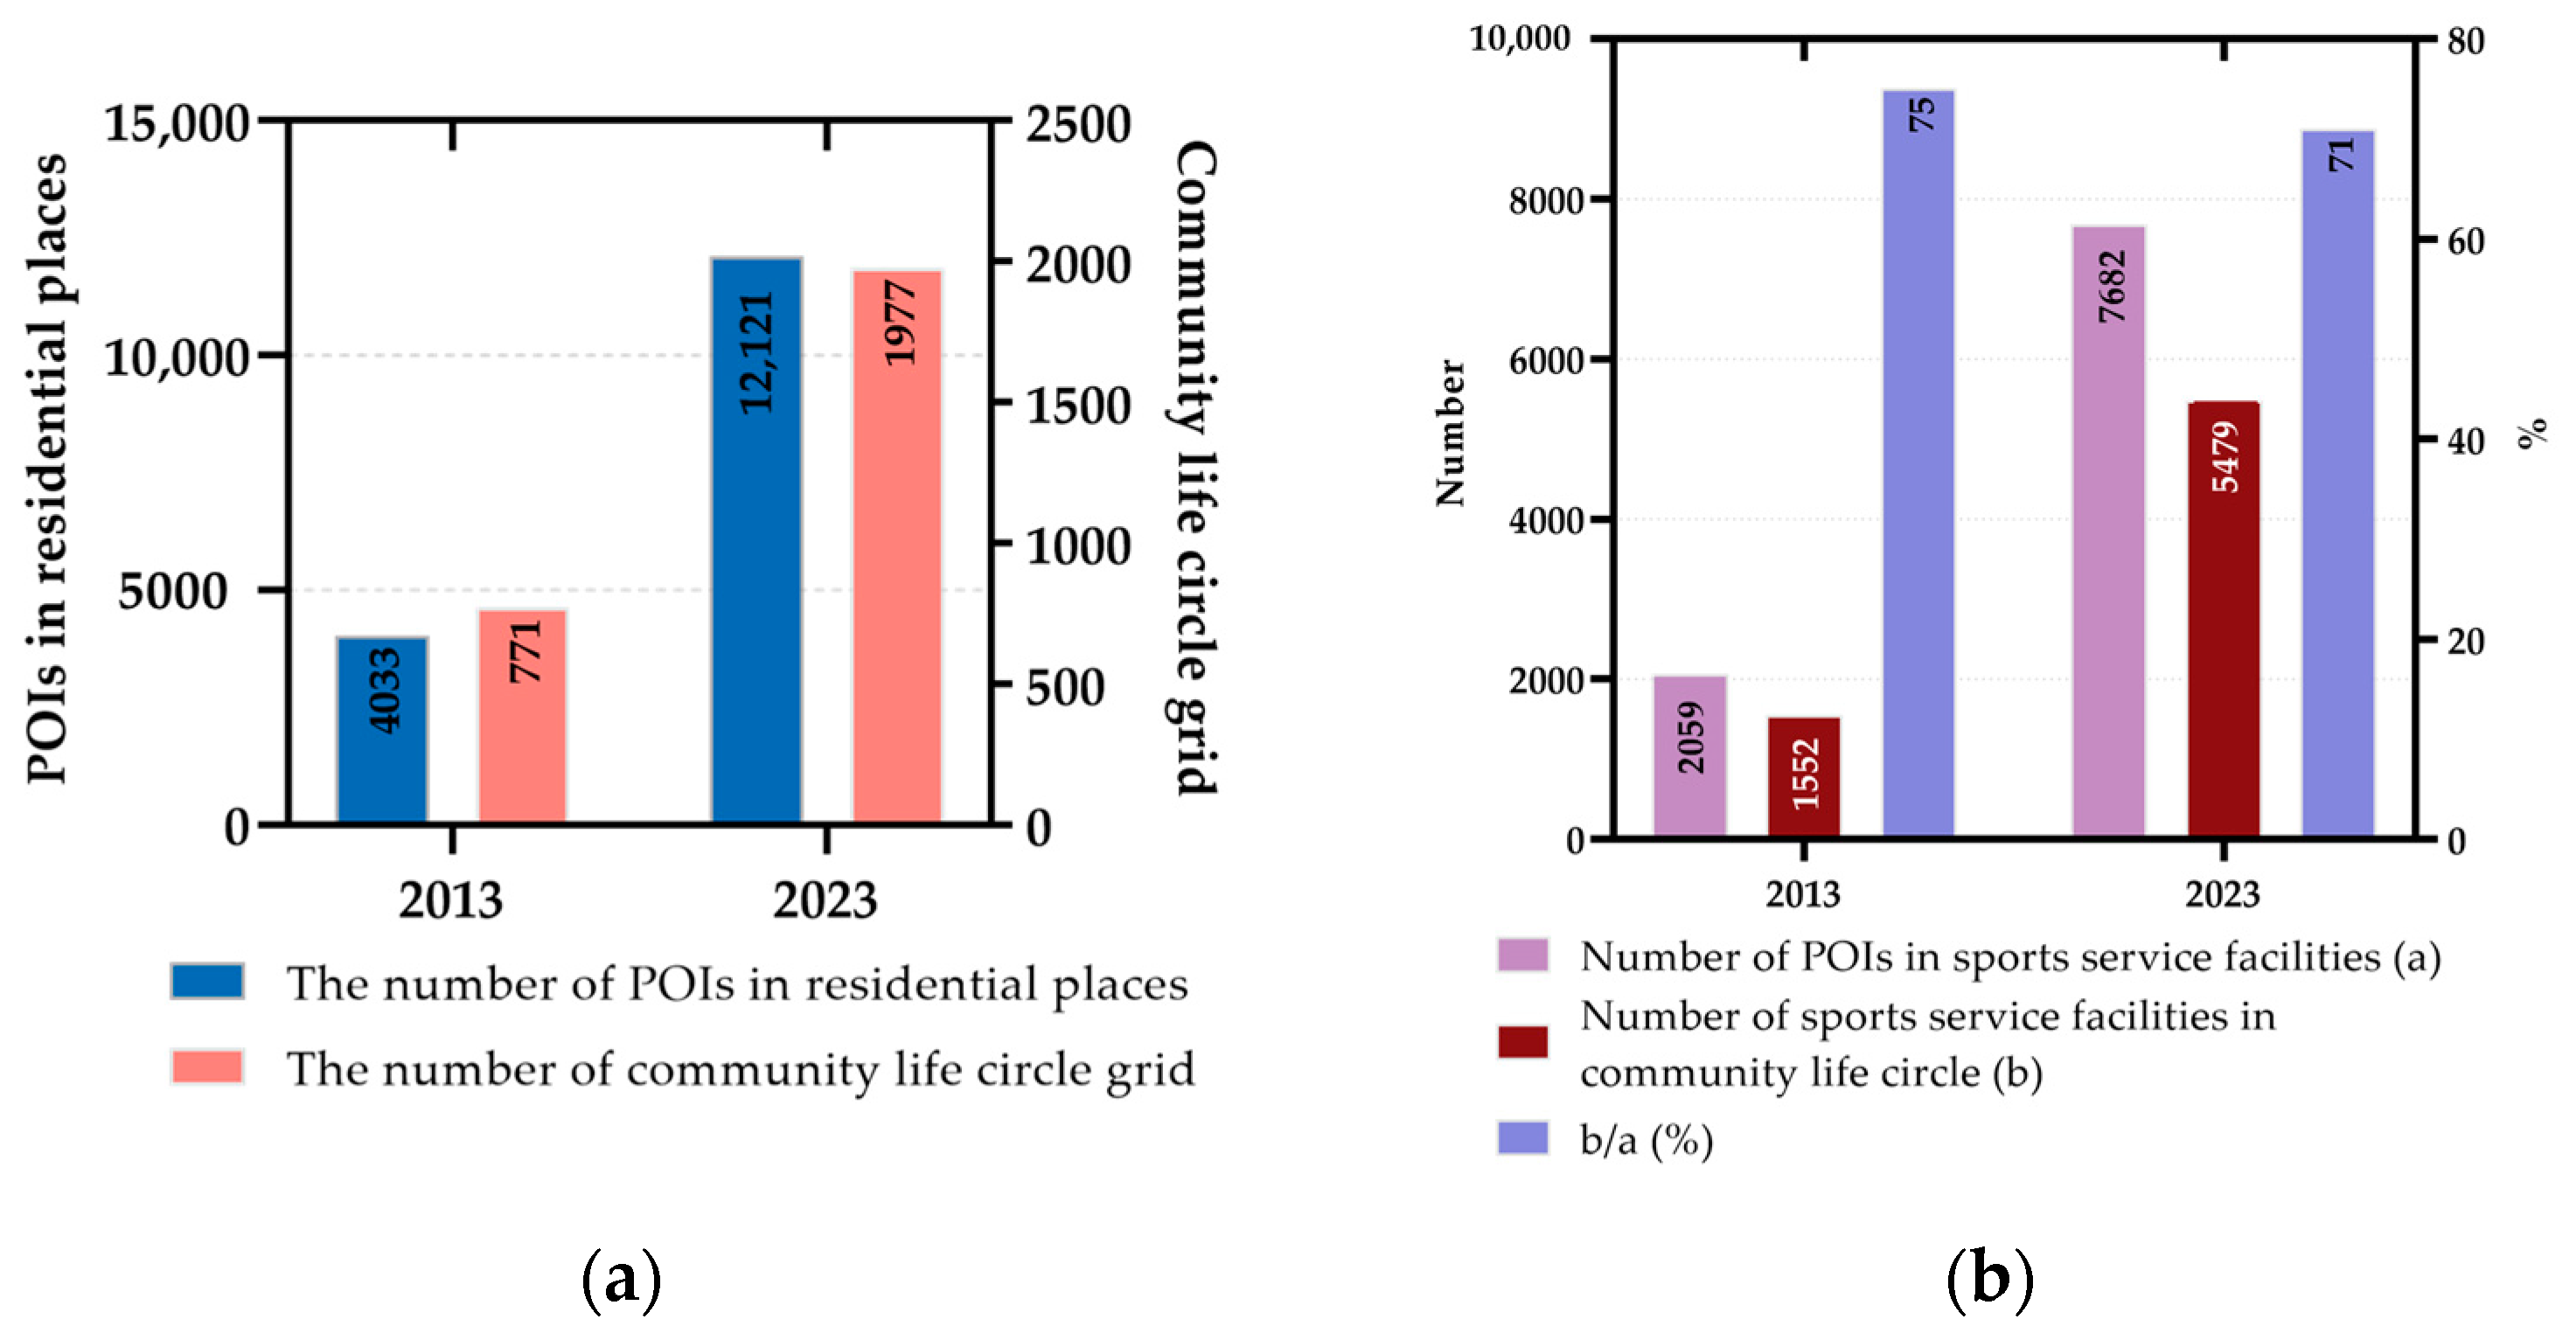
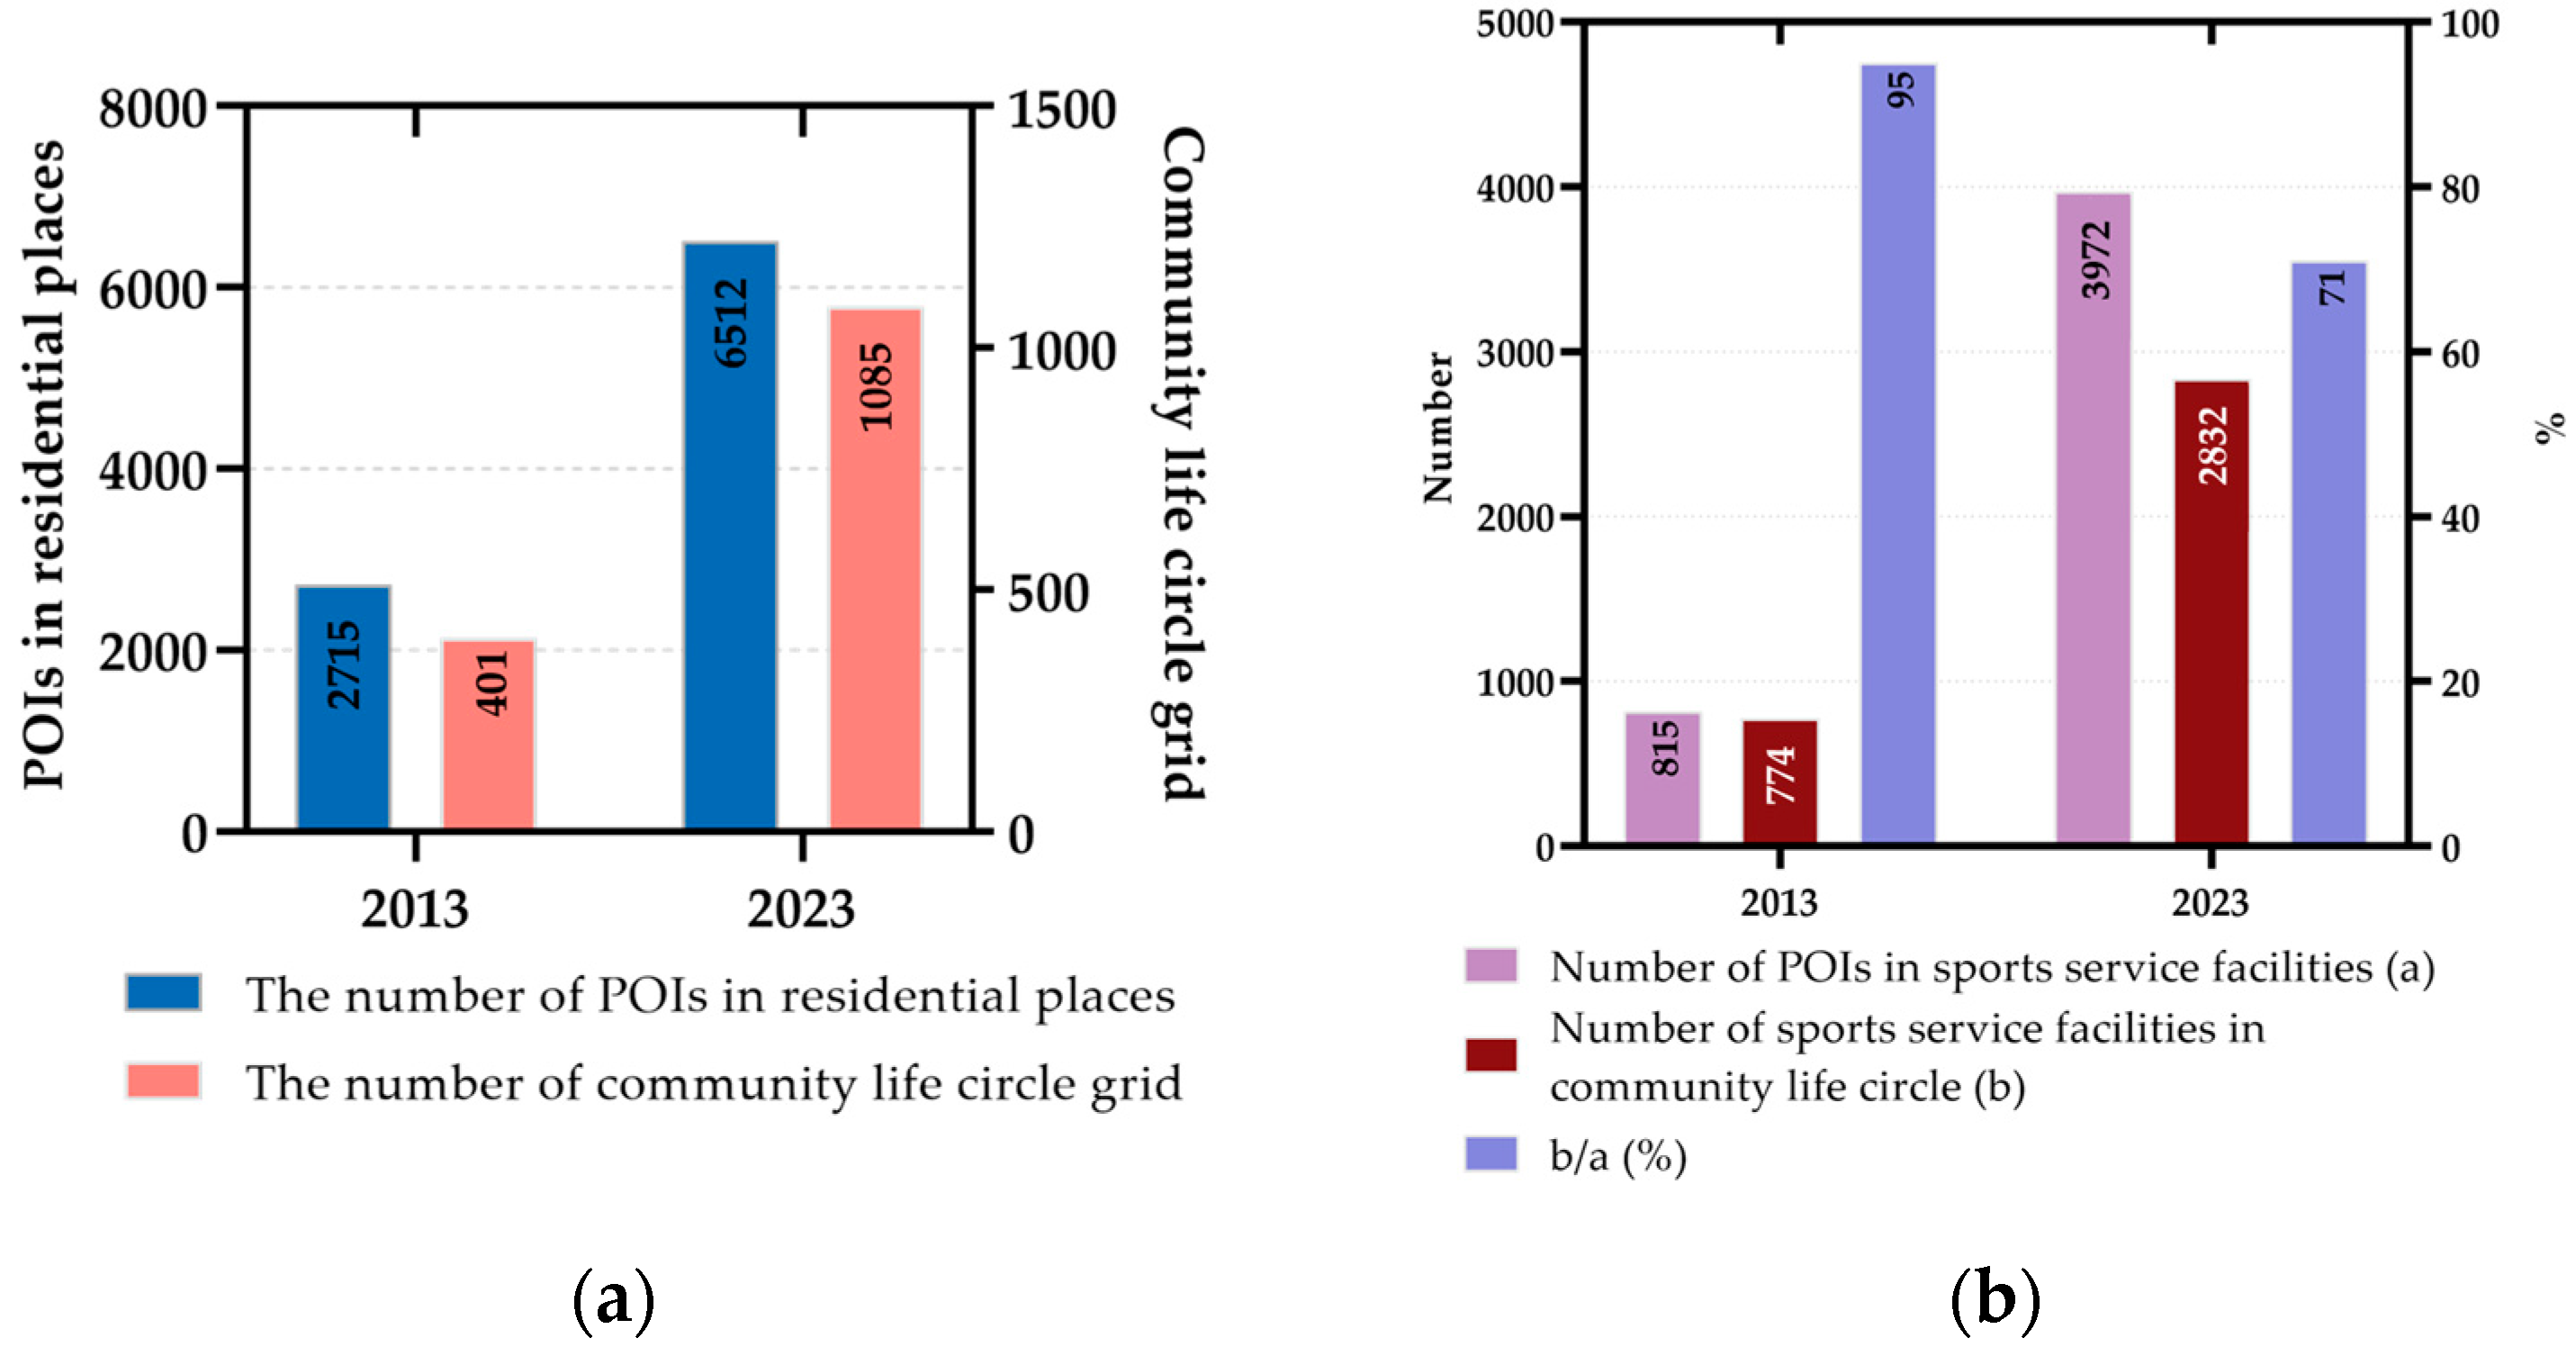
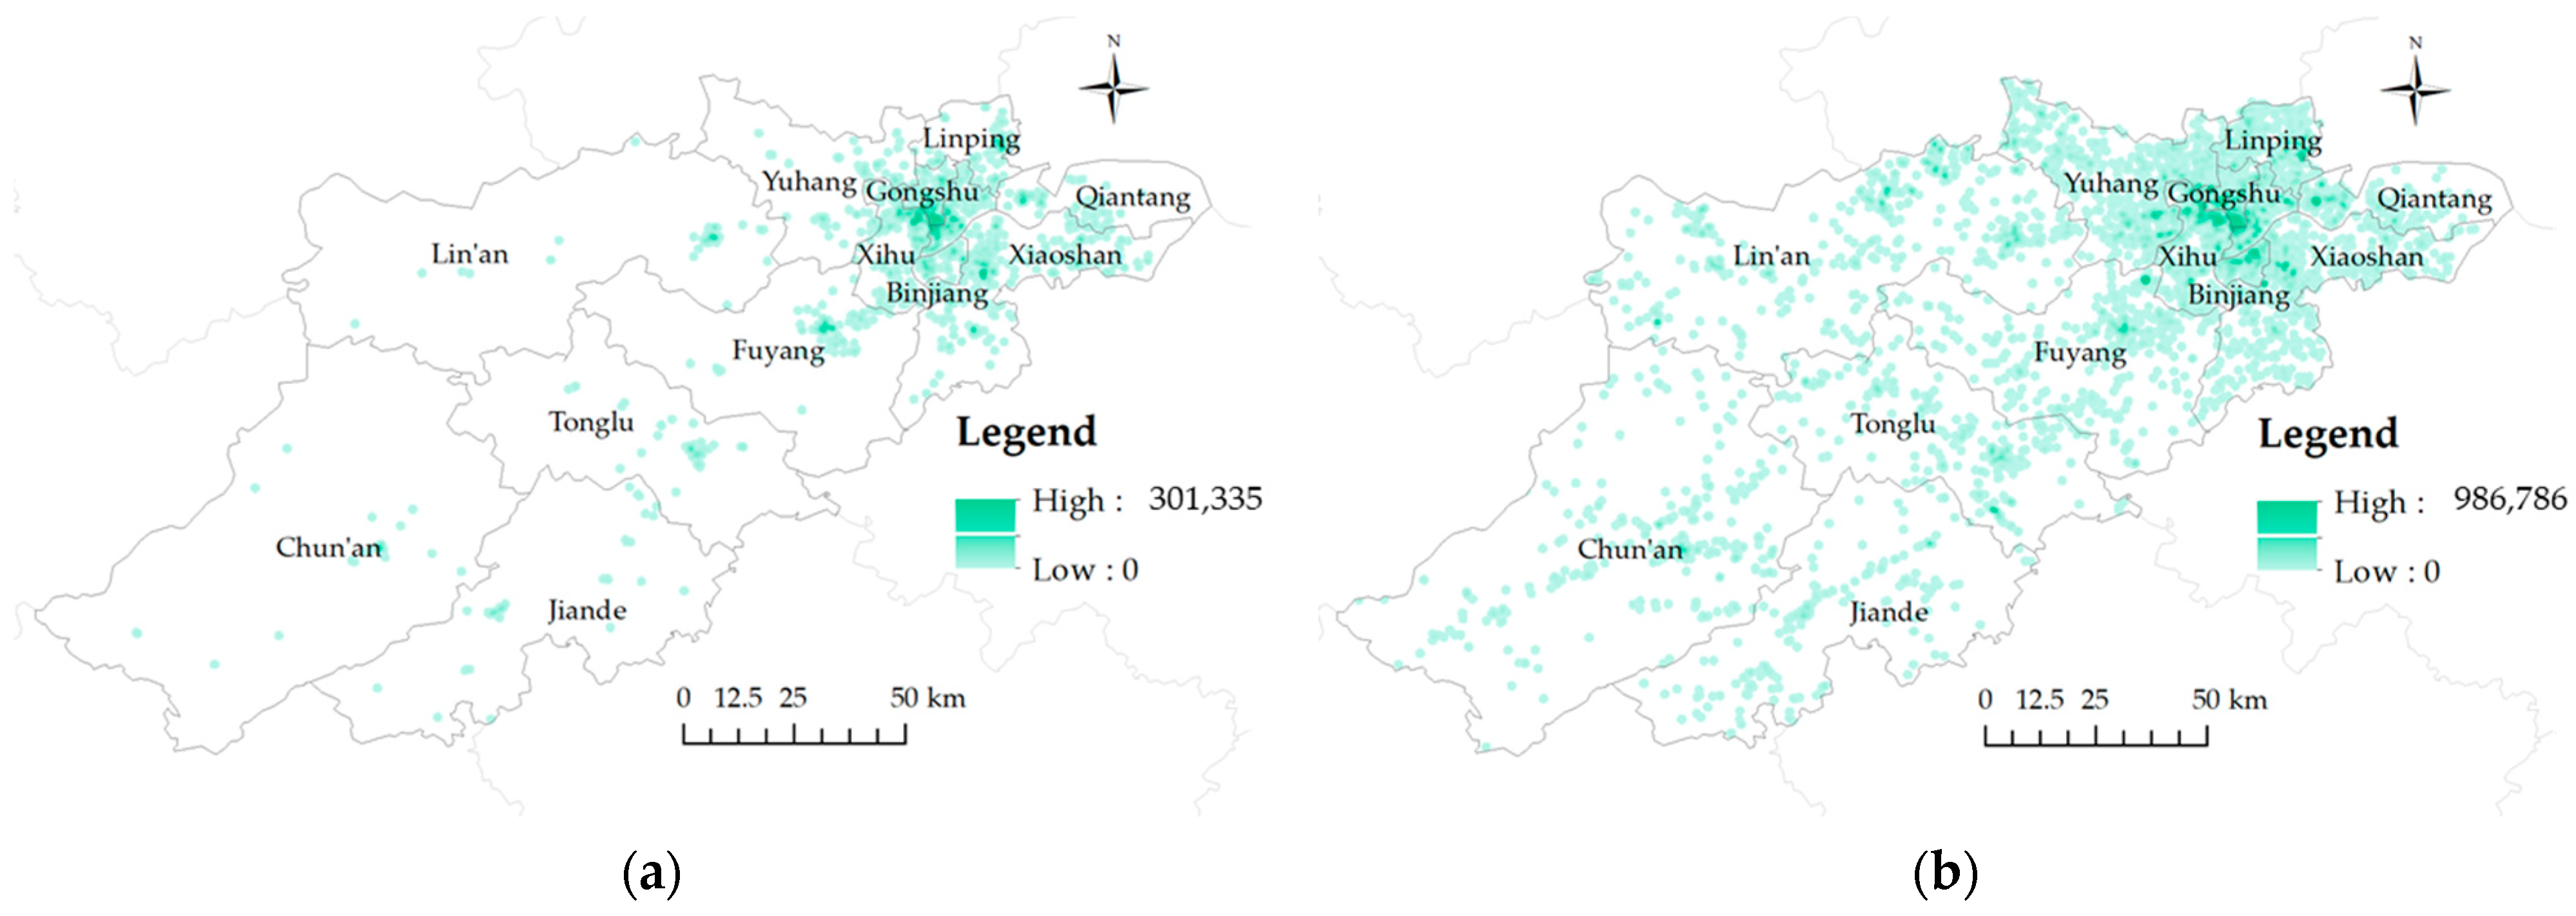
- In 2023: Shanghai City, Nanjing City, and Hangzhou City all had synergy indices greater than 1. Nanjing City and Hangzhou City experienced rapid increases in the number of sports service facilities, with Hangzhou City adding 2980 facilities—the largest increase among the study areas. This development improved the synergy indices for both Nanjing City and Hangzhou City from lagging to synergistic. Shanghai City’s rate of sports service facility development was slower compared to Nanjing City and Hangzhou City, resulting in a slight decrease in its synergy index from 2013 but still within the synergistic range. Hefei City saw a 2.65% growth in the number of sports facilities from 2013 to 2023, the highest growth rate among the study areas. However, due to its relatively weak initial infrastructure, Hefei City’s synergy index remained lagging, positioning it as weaker within the study area.
4.3. Equalization Characteristics Analysis
5. Discussion
5.1. Current Situation
- (1)
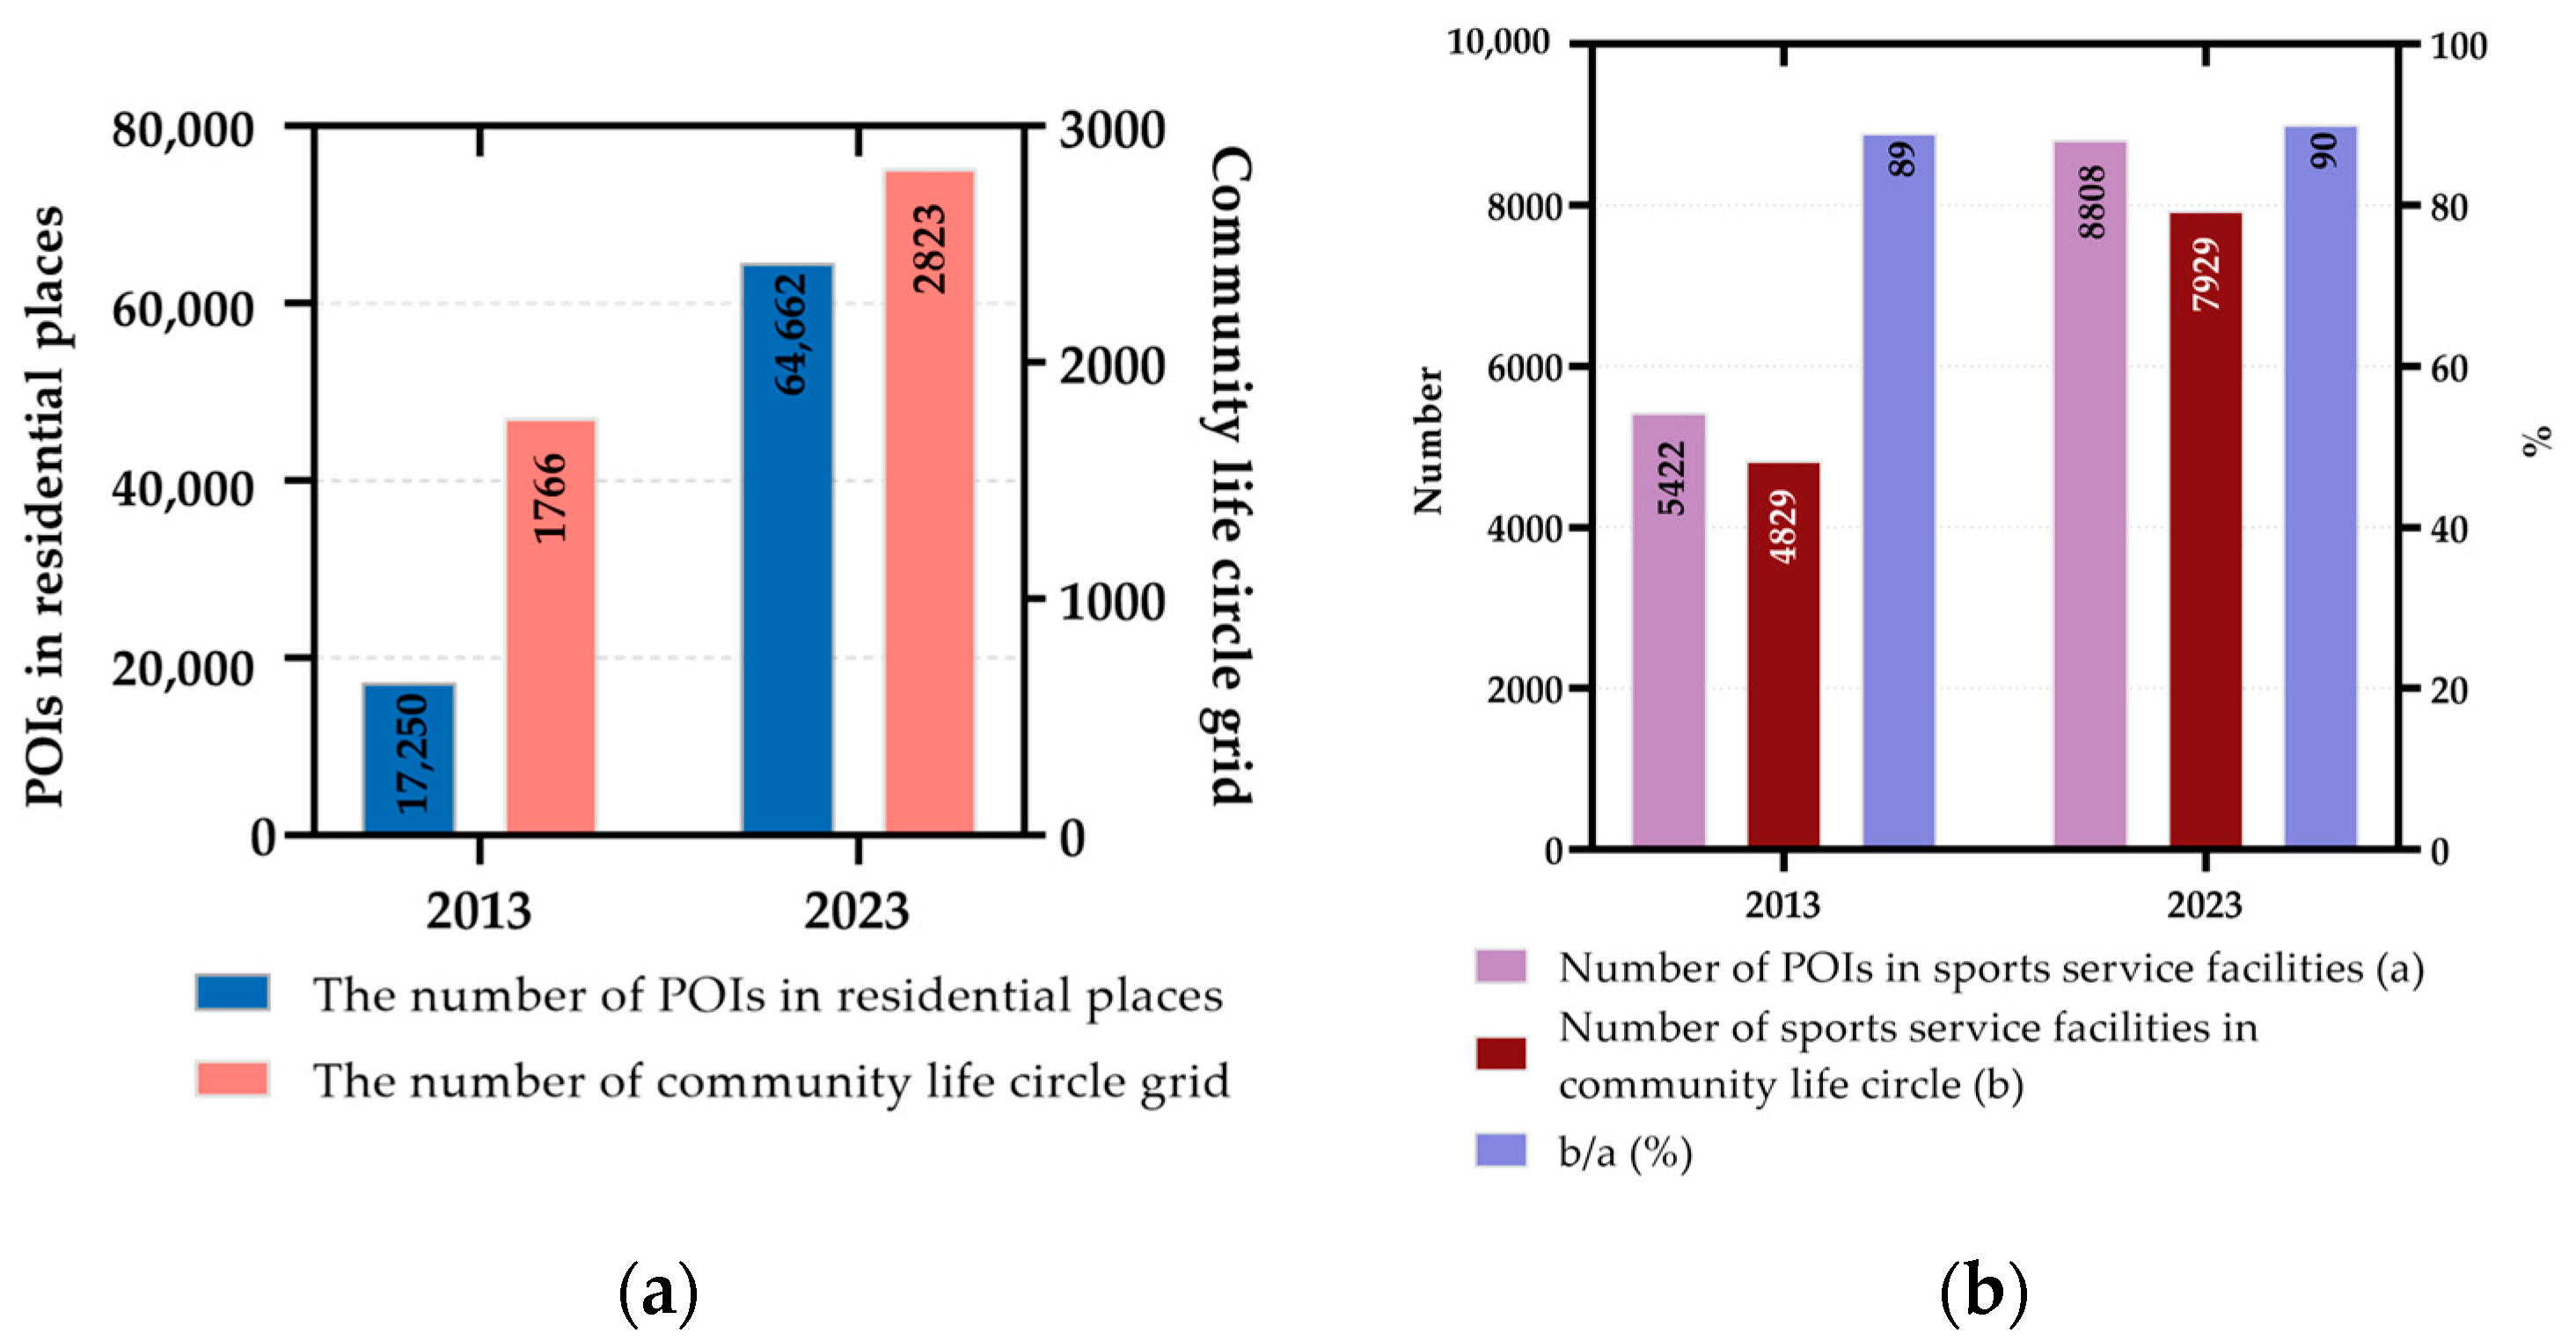
- “Quantity–Scale” imbalance. There is a notable imbalance in the development of urban sports spaces across different regions. In 2013, Shanghai City had 4055 more community life circle sports facilities than Hefei City. By 2023, this gap had widened to 5097 facilities, with Shanghai City having 2.8 times the number of facilities compared to Hefei City. Despite Shanghai City’s smaller total area (6300 square kilometers) compared to Hefei City (11,400 square kilometers) and its larger permanent population (24.87 million in Shanghai City versus 9.85 million in Hefei City), the disparity in sports facility construction remains pronounced.
- (2)
- “Core–Periphery” characteristics. The fragmentation of urban sports space layouts within the same regional scope is pronounced. Sports facilities in each city are typically arranged in a free layout, resulting in a fragmented distribution of urban sports spaces. This fragmentation leads to a concentration of most sports facilities in central urban areas, while peripheral urban zones experience an insufficient supply of sports spaces. This imbalance results in uneven coverage and a lack of resource integration. Empirical results indicate that cities within the study area have not yet achieved comprehensive coverage of the “15-min fitness circle” in their communities, revealing a gap between the current state and the goal of “fitness everywhere”.
- (3)
- “High value–Low value” disparity. As a core component of public services, urban sports spaces are intended to be accessible to all residents. However, the commodification of these spaces can undermine this principle, turning the equitable function of urban sports spaces into a privilege enjoyed by a few and infringing on the sports rights of disadvantaged groups. In some cities, a “fill-in-the-gaps” approach is used in constructing urban sports spaces, often locating facilities in remote areas. This approach leads to poor spatial accessibility and insufficient integration with the surrounding environment.
- (4)
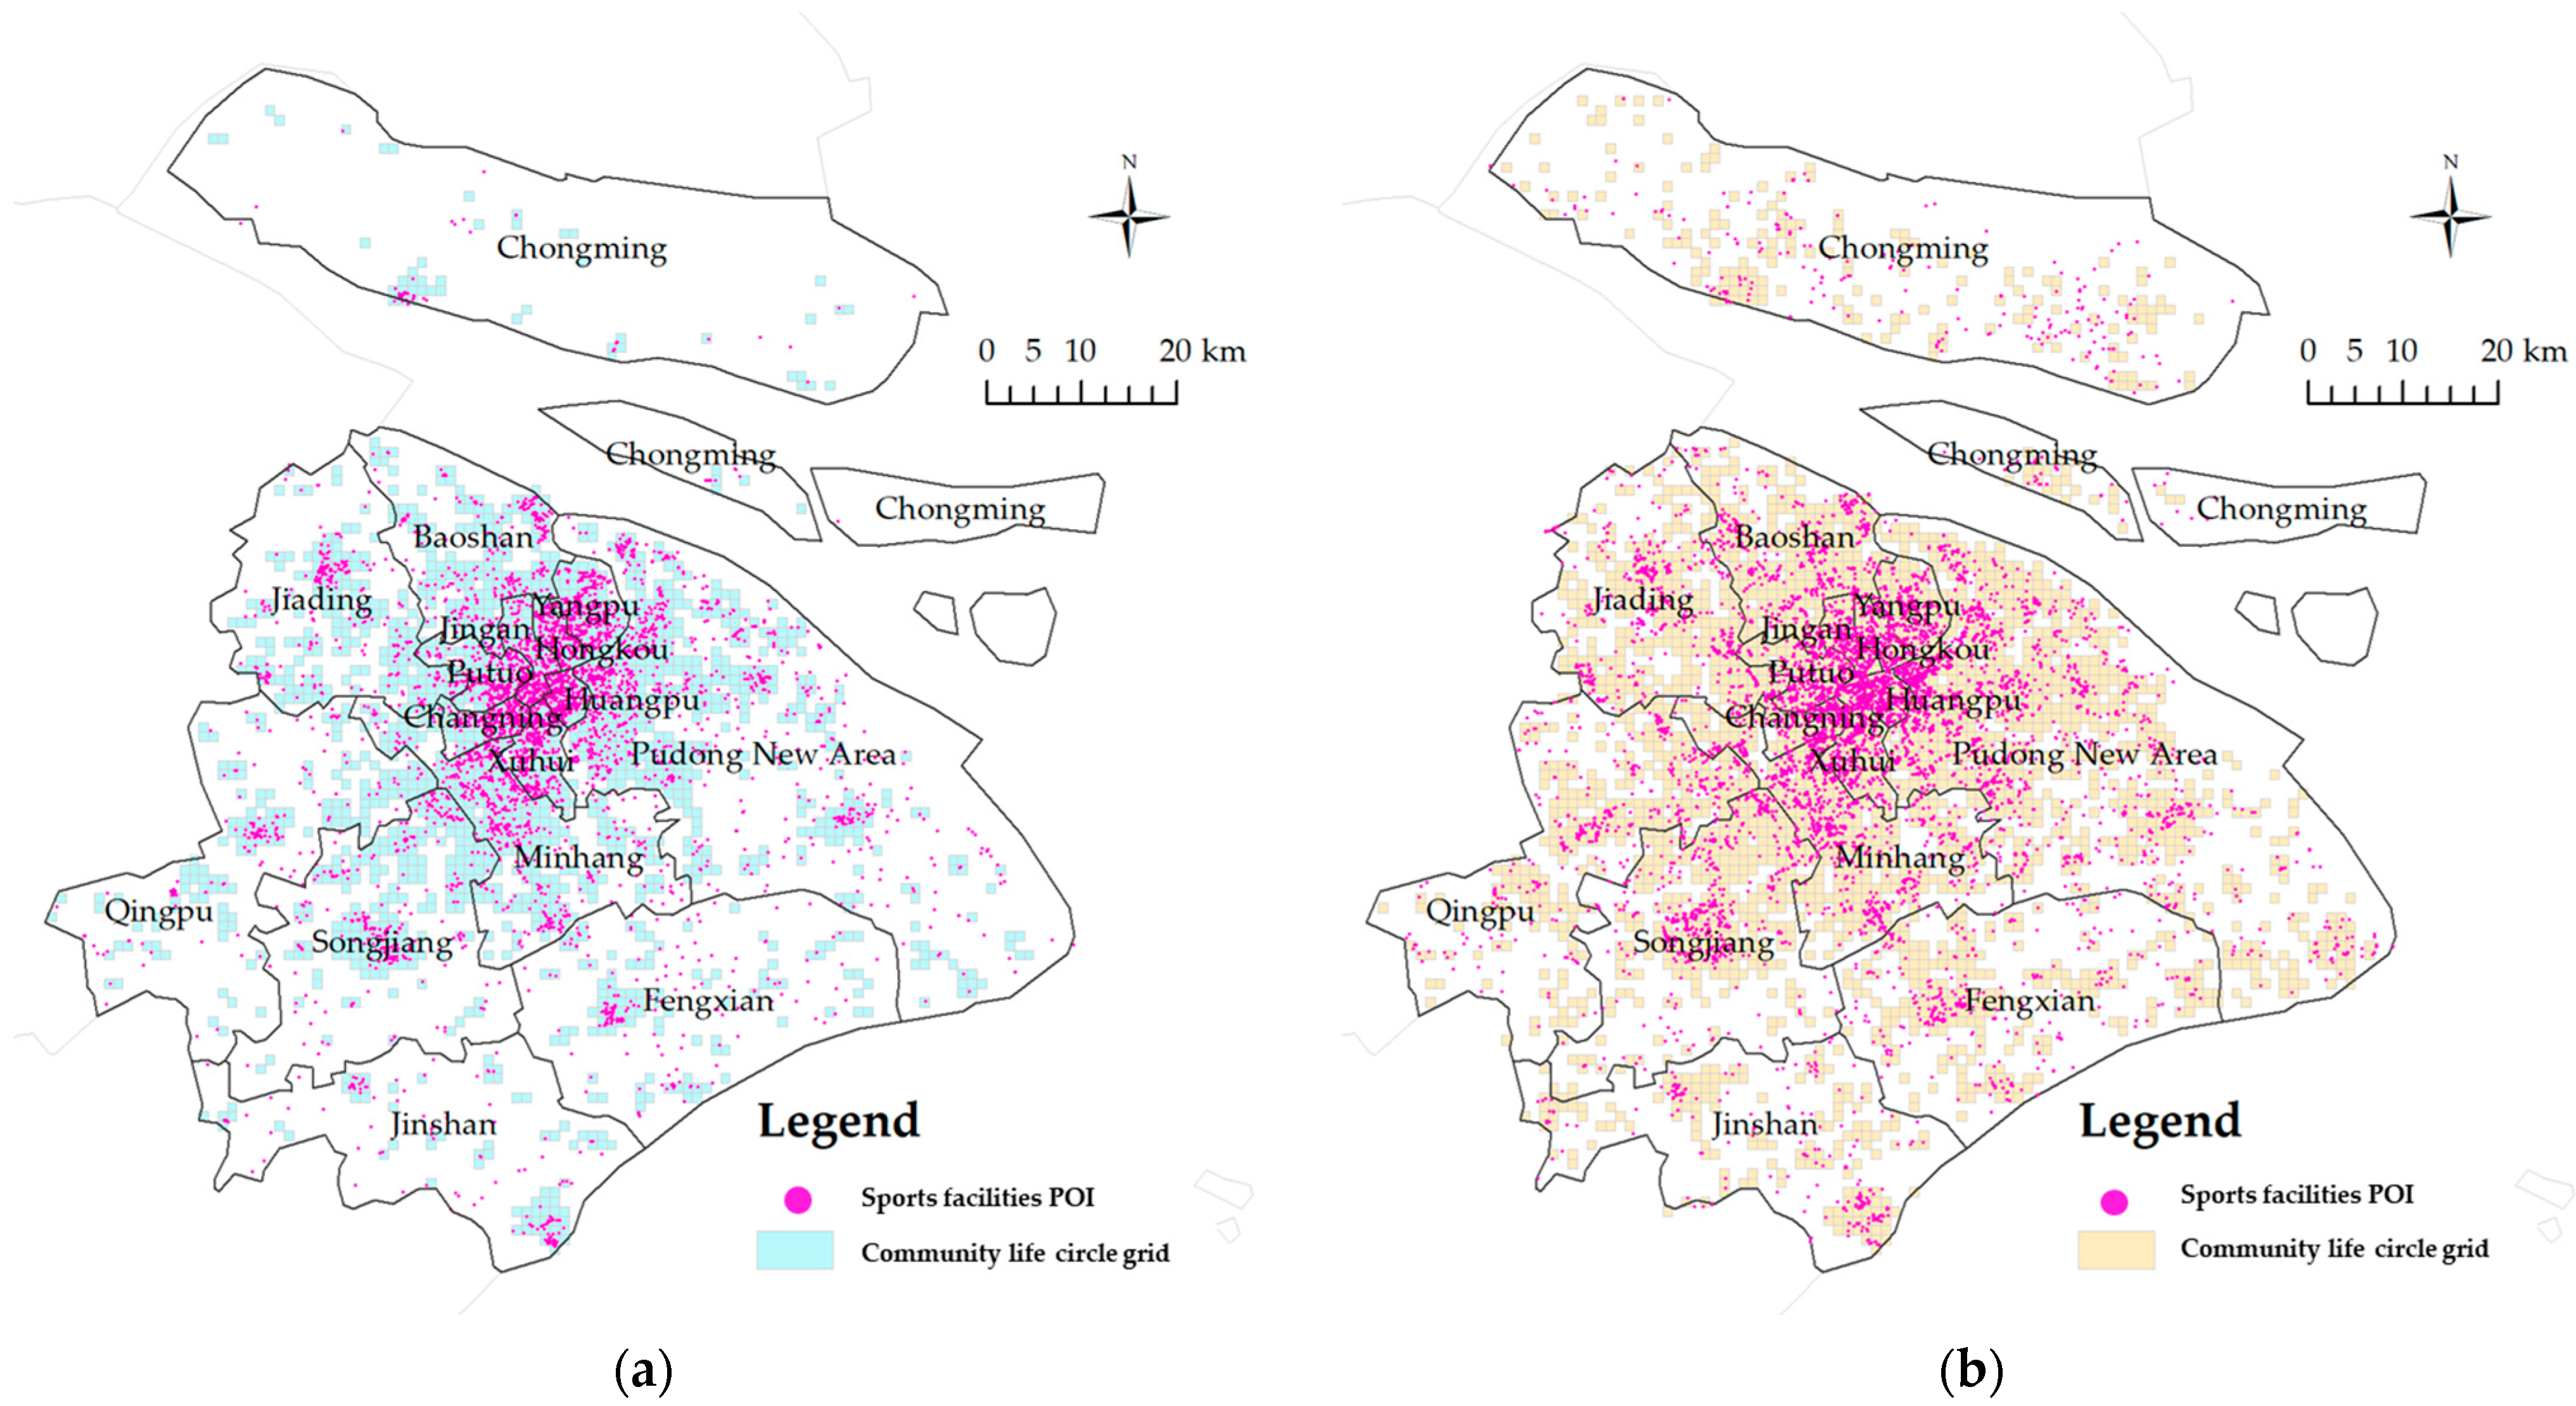
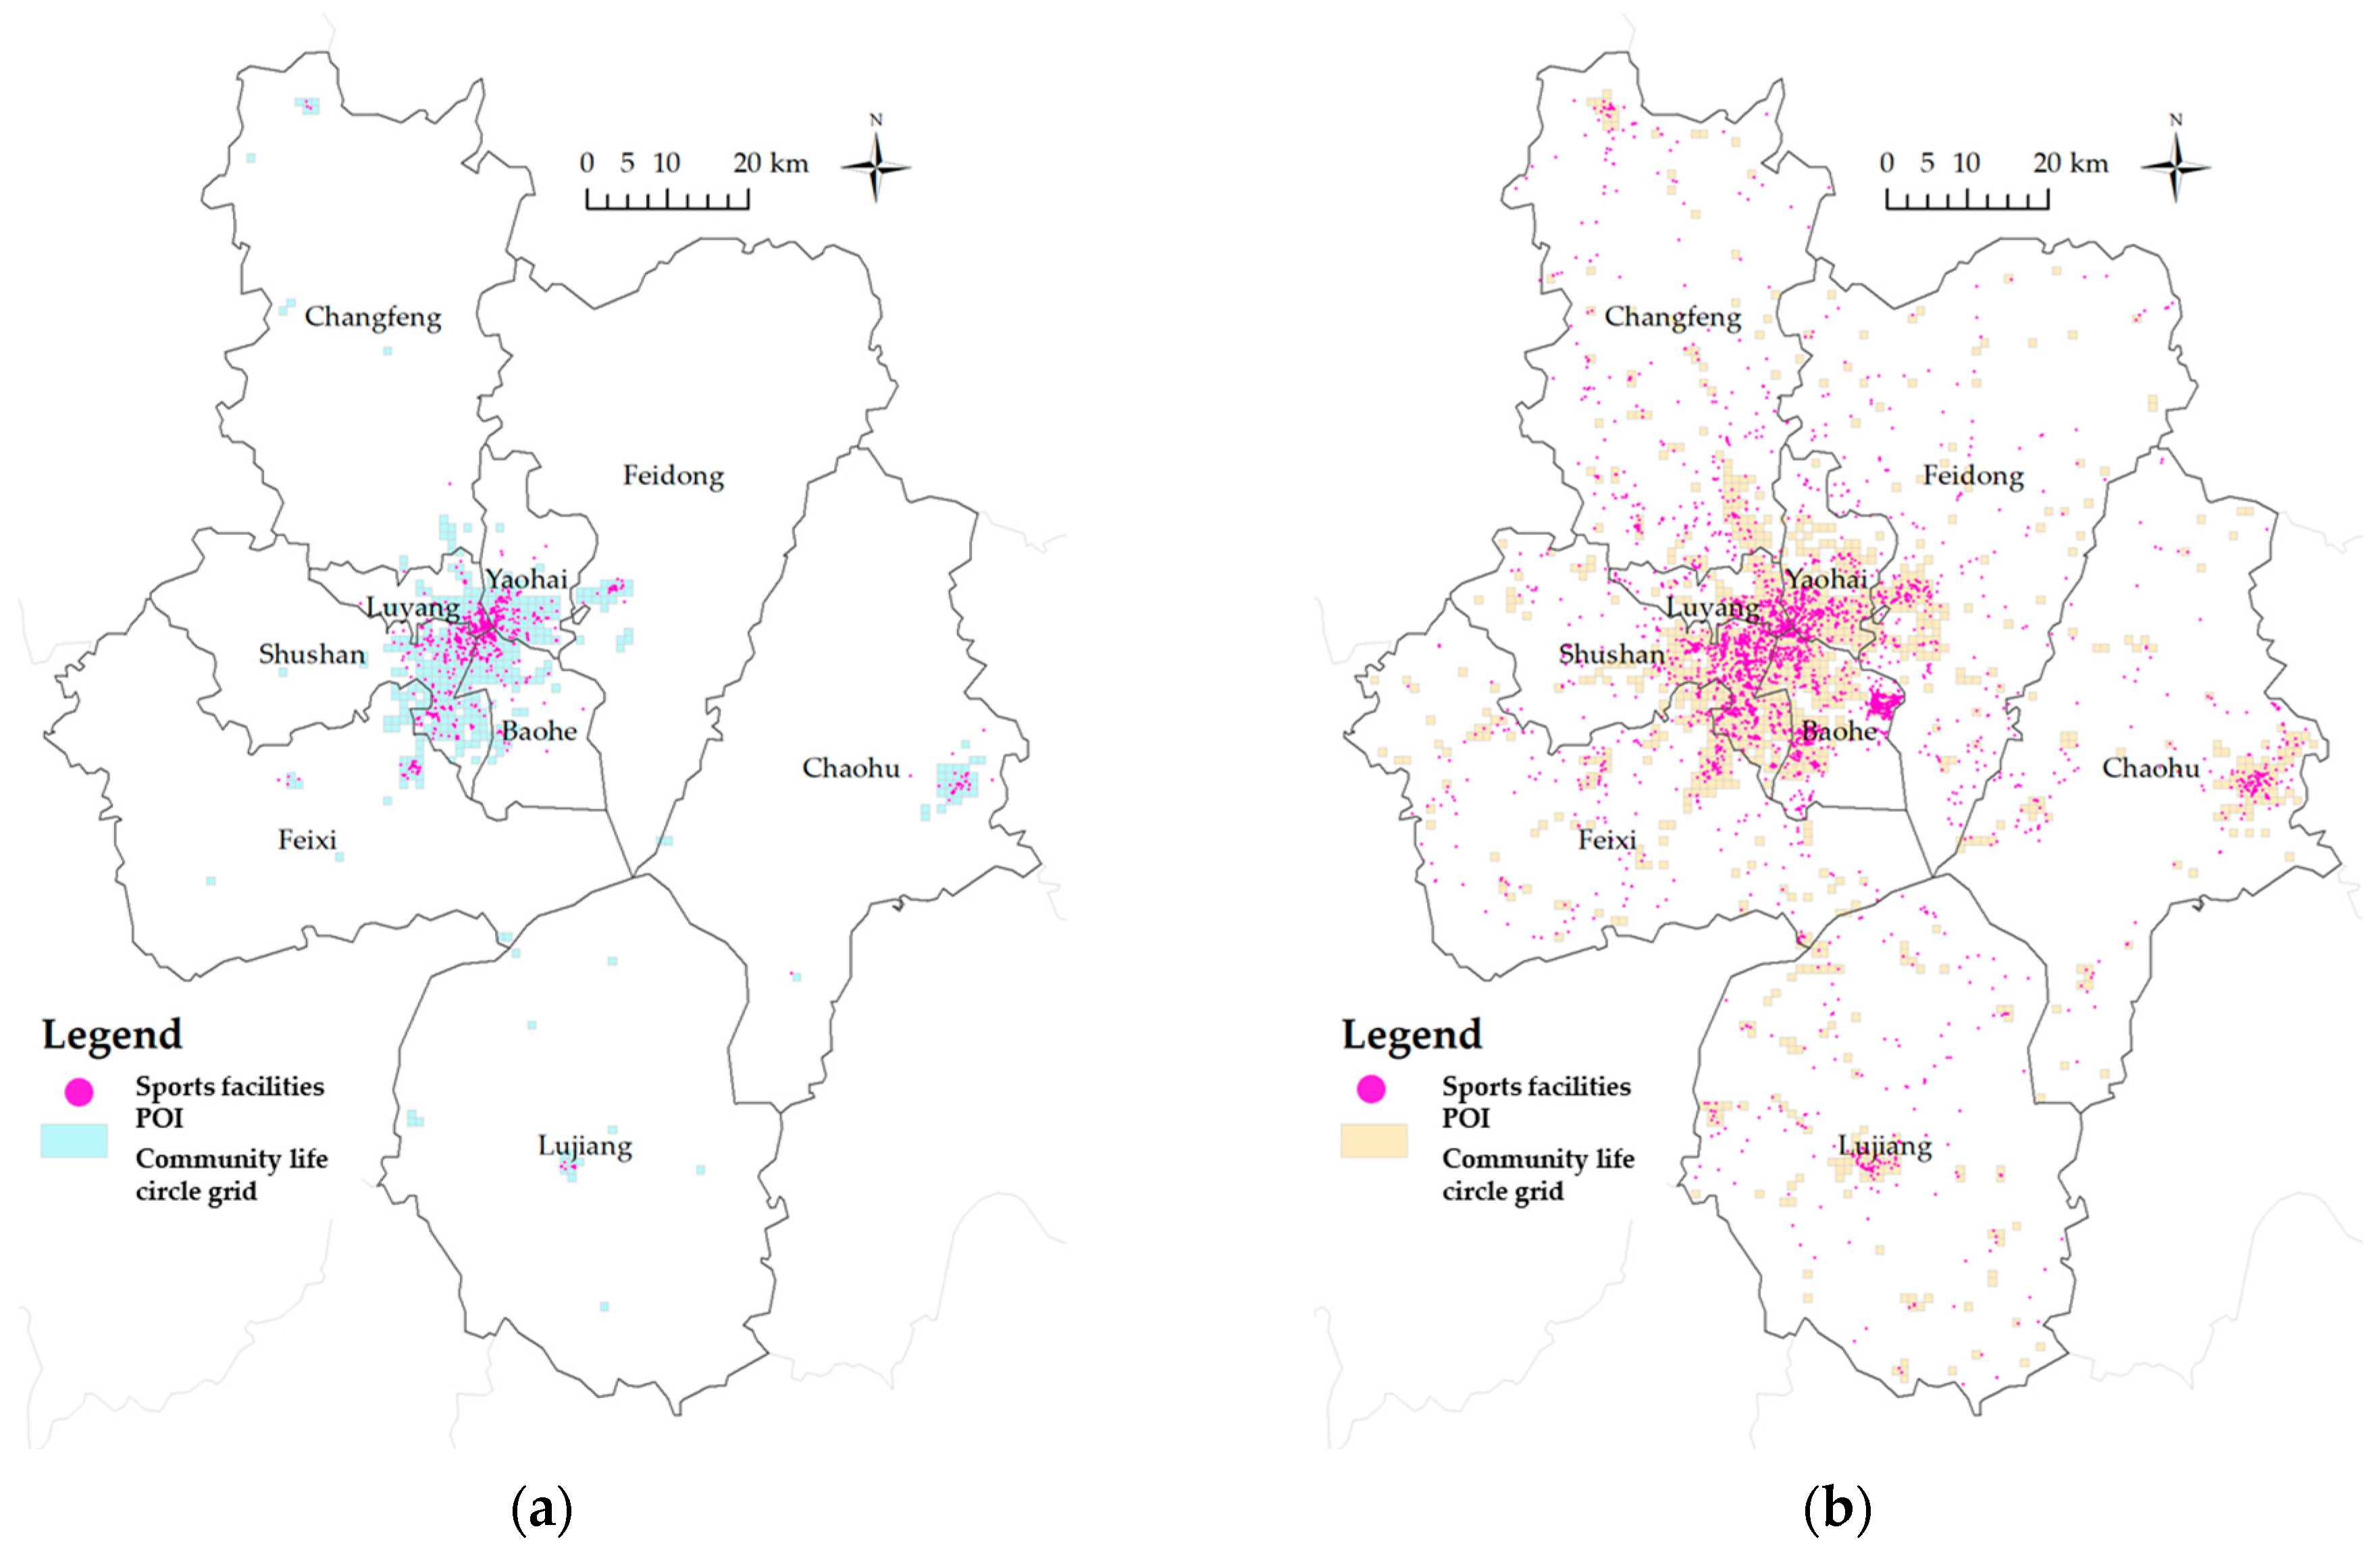
- “Venue–Residential” overlap. Analysis of POI data reveals that 70%−90% of sports service facilities in each city are situated within community life circles. The densely distributed sports facilities in central urban areas coincide with regions of high residential density. However, this concentration does not necessarily equate to an abundance of sports facility resources. Attention must be given to the service capacity of these facilities, as the high population density in these areas may result in challenges in meeting the needs of all residents.
5.2. Optimization Suggestions
- (1)
- The government should prioritize a people-centered approach by implementing a differentiated supply strategy to enhance the efficiency of sports space utilization. This involves respecting the organic nature and diversity of the population and addressing the varied sports needs across different age groups. By adopting innovative and differentiated strategies for the provision of sports spaces, the government can enhance the public fitness service system, focusing on the development of urban sports parks, fitness trails, and other public fitness facilities. Additionally, the layout of urban sports spaces should be strategically planned in alignment with the structure of residential areas. It is crucial to continually assess and maximize the potential of existing sports resources, expand the range of sports services, and particularly revitalize large sports venues and public institution facilities, thereby promoting comprehensive access to and utilization of sports spaces.
- (2)
- Establishing a multi-center, multi-level collaborative governance model is crucial for advancing spatial justice in sports space planning. It is imperative to effectively leverage the market’s role in this process. The government should not only directly provide sports services but also incentivize the involvement of social capital in sports space governance through mechanisms such as public service procurement. Furthermore, the government should offer strategic planning guidance for informal sports spaces, such as street sides, lakesides, and repurposed factories, where residents often engage in leisure and exercise. By optimizing the balance between formal and informal sports spaces, a more diversified supply mechanism can be developed, effectively addressing the challenge of insufficient public space within communities.
- (3)
- Developers and operators of urban sports spaces must adhere to established construction requirements and standards. They should acknowledge the dual role of capital in commercial development and emphasize its positive contribution to the creation of sports spaces. It is essential to comply with urban facility standards, including per capita green space, the number of fitness facilities, an urban green space area, and standards for squares and parks. Such compliance ensures that green spaces are preserved for residents’ fitness and leisure activities, safeguarding their spatial rights. Additionally, selectively opening community parks and green spaces can mitigate the effects of urban space privatization, fostering a harmonious and inclusive community sports culture.
- (4)
- Leverage technology to empower residents and enhance their engagement in social governance. Utilize digital innovations, such as Big Data, cloud computing, and the internet to improve sports service facilities, ensuring they cater to users of all ages. This approach will help broaden participation in sports, raise awareness, and promote a culture of universal and lifelong engagement in physical activities. Additionally, as residents become involved in the governance of urban sports spaces, they should clearly communicate their primary needs regarding physical space. Platforms such as WeChat and Weibo can be employed to facilitate this collective expression, providing technical empowerment. This ensures equitable communication and coordination among urban residents, the government, and the market, collectively advancing the development of urban sports spaces.
6. Conclusions
- (1)
- The spatial distribution patterns of sports service facilities within the community life circles in the study area consistently demonstrate an aggregated distribution, forming a concentric ring structure from the core to the periphery. However, there are notable differences in the degree of aggregation across different cities, and the core areas of sports service facilities exhibit some spatial heterogeneity. Between 2013 and 2023, the aggregation of sports service facility distribution in Shanghai’s life circles has intensified, whereas a decline in aggregation has been observed in the other cities.
- (2)
- The synergy of sports service facilities within the community life circles in the study area has seen substantial improvement. In 2013, only Shanghai exhibited a matching synergy between sports service facilities and community life circles. By 2023, Shanghai, Nanjing, and Hangzhou have all achieved this synergy, while Hefei remains in a lagging position. Regarding local spatial autocorrelation characteristics, each city predominantly exhibits high-value clustering, with multiple clusters showing high aggregation and low dispersion, with Hangzhou standing out as particularly notable.
- (3)
- The level of equalization of sports service facilities within the community life circles of the four cities in the study area is ranked as follows: Shanghai City > Nanjing City > Hangzhou City > Hefei City. Shanghai and Nanjing exhibit relatively small internal spatial differences, suggesting that while their allocation of sports service facilities is not significantly advantageous, weaknesses are not highly pronounced. This indicates a need to address specific shortcomings to strengthen weaker areas. In contrast, Hangzhou and Hefei show more substantial spatial differences, with facility allocation concentrated in areas of absolute advantage and pronounced weaknesses in other regions. This highlights the necessity for focused efforts to promote equity and to narrow the existing gaps.
Author Contributions
Funding
Institutional Review Board Statement
Informed Consent Statement
Data Availability Statement
Conflicts of Interest
References
- State Council. Healthy China 2030 Planning Outline. Available online: http://www.gov.cn/zhengce/2016-10/25/content_5124174.htm (accessed on 10 July 2024).
- State Council. The State Council Issued a Circular on the National Fitness Program (2021–2025). Available online: http://www.gov.cn/zhengce/content/2021-08/03/content_5629218.htm (accessed on 10 July 2024).
- General Administration of Sport of China. Notice of General Administration of Sport on Printing and Distributing the “14th Five-Year Plan” for Sports Development. Available online: https://www.sport.gov.cn/zfs/n4977/c23655706/content.html (accessed on 10 July 2024).
- Bilgi, S.; Gulnerman, A.G.; Arslanoglu, B.; Karaman, H.; Öztürk, Ö. Complexity measures of sports facilities allocation in urban area by metric entropy and public demand compatibility. Int. J. Eng. Geosci. 2019, 4, 141–148. [Google Scholar] [CrossRef]
- Berrett, T.; Slack, T.; Whitson, D. Economics and the pricing of sport and leisure. J. Sport Manag. 1993, 7, 199–215. [Google Scholar] [CrossRef]
- Crompton, J. Beyond economic impact: An alternative rationale for the public subsidy of major league sports facilities. J. Sport Manag. 2004, 18, 40–58. [Google Scholar] [CrossRef]
- Kung, S.P.; Taylor, P. The use of public sports facilities by the disabled in England. Sport Manag. Rev. 2014, 17, 8–22. [Google Scholar] [CrossRef]
- Halonen, J.I.; Stenholm, S.; Kivimäki, M.; Pentti, J.; Subramanian, S.V.; Kawachi, I.; Vahtera, J. Is change in availability of sports facilities associated with change in physical activity? A prospective cohort study. Prev. Med. 2015, 73, 10–14. [Google Scholar] [CrossRef]
- Billaudeau, N.; Oppert, J.M.; Simon, C.; Charreire, H.; Casey, R.; Salze, P.; Badariotti, D.; Banos, A.; Weber, C.; Chaix, B. Investigating disparities in spatial accessibility to and characteristics of sport facilities: Direction, strength, and spatial scale of associations with area income. Health Place 2011, 17, 114–121. [Google Scholar] [CrossRef]
- Higgs, G.; Langford, M.; Norman, P. Accessibility to sport facilities in Wales: A GIS-based analysis of socio-economic variations in provision. Geoforum 2015, 62, 105–120. [Google Scholar] [CrossRef]
- McCormack, G.R.; Shiell, A. In search of causality: A systematic review of the relationship between the built environment and physical activity among adults. Int. J. Behav. Nutr. Phys. Act. 2011, 8, 125. [Google Scholar] [CrossRef]
- Van Holle, V.; Deforche, B.; Van Cauwenberg, J.; Goubert, L.; Maes, L.; Van de Weghe, N.; De Bourdeaudhuij, I. Relationship between the physical environment and different domains of physical activity in European adults: A systematic review. BMC Public Health 2012, 12, S217. [Google Scholar] [CrossRef]
- Shirowzhan, S.; Sepasgozar, S.M.E. Spatial analysis using temporal point clouds in advanced GIS: Methods for ground elevation extraction in slant areas and building classifications. ISPRS Int. J. Geo-Inf. 2019, 8, 120. [Google Scholar] [CrossRef]
- Zhang, Y.; Yi Ming, Y.; Shi, B. Spatial distribution characteristics and causes of public sports venues in China. Sci. Rep. 2023, 13, 15056. [Google Scholar] [CrossRef] [PubMed]
- Hao, J.; Ma, H. Spatial Heterogeneity of public service facilities in the living circle and its influence on housing prices: A case study of central urban Dalian, China. Land 2022, 11, 1095. [Google Scholar] [CrossRef]
- Fallah Ghalhari, G.A.; Dadashi Roudbari, A.A.; Asadi, M. Identifying the spatial and temporal distribution characteristics of precipitation in Iran. Arab. J. Geosci. 2016, 9, 595. [Google Scholar] [CrossRef]
- Liu, X.; Wang, Y.; Zhang, Q.; Li, J.; Zhang, H. Spatial distribution of public sports facilities in large Chinese cities. J. Urban Plan. 2020, 45, 321–339. [Google Scholar]
- Zheng, M.R.; Wang, H.Y.; Shang, Y.Q.; Zheng, X.Q. Identification and prediction of mixed-use functional areas supported by POI data in Jinan City of China. Sci. Rep. 2023, 13, 2913. [Google Scholar] [CrossRef]
- Jiang, G.; Ma, W.; Qu, Y.; Zhang, R.; Zhou, D. How does sprawl differ across urban built-up land types in China? A spatial-temporal analysis of the Beijing metropolitan area using granted land parcel data. Cities 2016, 58, 1–9. [Google Scholar] [CrossRef]
- Yuan, Y.D.; Li, Z.; Liang, H.W. Selection and spatial layout of urban sports facilities guided by residents’ demand. Open House Int. 2019, 44, 9–12. [Google Scholar] [CrossRef]
- Zheng, L.H.; Abidin, N.E.Z.; Nor, M.N.M.; Xu, Y.Y.; Feng, X.W. Sustainable coupling coordination and influencing factors of sports facilities construction and social economy development in China. Sustainability 2023, 15, 2832. [Google Scholar] [CrossRef]
- Zhao, Y.; Zhang, L.; Wang, M.; Li, X. A comparative study of sports facility distribution in European cities. Urban Geogr. 2019, 40, 812–829. [Google Scholar]
- Kruszynska, E.; Poczta, J. Hierarchy of factors affecting the condition and development of sports and recreation infrastructure impact on the recreational activity and health of the residents of a city (Poznan Case Study). Int. J. Environ. Res. Public Health 2019, 16, 556. [Google Scholar] [CrossRef]
- Jiang, Y.; Liu, Y.; Liu, Z.; Wang, C.; Shi, Z.; Zhao, H.; Sun, D.; Sun, W.; Wang, X. Spatial distribution characteristics of public fitness venues: An urban accessibility perspective. Sustainability 2023, 15, 601. [Google Scholar] [CrossRef]
- Kim, S.H.; Kim, Y.J. Demand Characteristics and analysis of changes in spatial accessibility of public sports facilities. J. Korea Cont. Assoc. 2017, 17, 283–293. [Google Scholar]
- Baran, P.K.; Smith, W.R.; Moore, R.C.; Floyd, M.F.; Bocarro, J.N.; Cosco, N.G.; Danninger, T.M. Inequities in the distribution of urban sports facilities in North American cities. Environ. Plan. B Urban Anal. City Sci. 2014, 41, 241–259. [Google Scholar]
- Hansen, W.G. How accessibility shapes land use. J. Am. Inst. Plan. 1959, 25, 73–76. [Google Scholar] [CrossRef]
- Zhao, L.; Wang, L.; Yang, J. Study on a Two-Level Elderly Care System Based on Traffic Accessibility. Urban Dev. Res. 2019, 26, 7–13. [Google Scholar]
- Cai, Y.; Shao, B.; Dong, B. Study on GIS-based Accessibility of Community Public Sports Fields in Central Shanghai. Sport Sci. Res. 2015, 36, 68–75. [Google Scholar]
- Guo, S.; Fan, Z.; He, J. Accessibility of Parks in Xixiangtang District, Nanning Based on Network Analysis. Chinese Landsc. Archit. 2019, 35, 68–72. [Google Scholar]
- Zhao, S.; Zhang, W. Spatial Characteristics and Accessibility of Public Cultural Facilities in Beijing. Urban Dev. Res. 2020, 27, 7–12. [Google Scholar]
- Wang, J.; Sun, Y.; Lin, N. Temporal and Spatial Evolution Characteristics of Urban Innovation Activities Distribution Patterns and Countermeasures: A Case Study of Hangzhou. Urban Dev. Res. 2020, 27, 12–18. [Google Scholar]
- Wang, J.; Li, J.; Cheng, J. Spatial Disparity of Sports Infrastructure Development and Urbanization Determinants in China: Evidence from the Sixth National Sports Venues Census. Appl. Spatial Anal. 2024, 17, 573–598. [Google Scholar] [CrossRef]
- Chen, T.; Wei, Z.; Chen, Z. Equity and Optimization Countermeasures of Urban Fitness Facility Layout. Planners 2015, 31, 17–23. [Google Scholar]
- Deng, L.; Zhang, N.; Zheng, H. Research on the Problems and Optimization Countermeasures of Urban Community Public Service Facilities: A Case Study of Changsha. Urban Dev. Res. 2016, 23, 77–84. [Google Scholar]
- Jiang, H.; Zhou, C.; Gao, J. Research Progress on the Equity of Public Service Space Distribution in Western Cities. City Plan. Rev. 2011, 35, 72–77. [Google Scholar]
- Gu, M.; Yin, H. Overview of Research on the Accessibility and Equity of Public Facilities. Urban Probl. 2010, 5, 25–29. [Google Scholar]
- Tang, Z.; Gu, S. Social Performance Evaluation of Public Green Space Distribution in Central Shanghai: From Regional to Social Equity. Urban Plan. Forum 2015, 2, 48–56. [Google Scholar]
- Wang, L.; Zhou, K. Performance Evaluation of Community Sports Facility Distribution from the Perspective of Health Equity: A Case Study of Central Shanghai. J. Hum. Settl. West. China 2019, 34, 1–7. [Google Scholar]
- Xu, X.; Zhao, Y. Spatial Distribution Pattern and Accessibility Evaluation of Elderly Care Facilities in Nanjing Based on Time Cost: Two-Step Floating Catchment Area Method. Modern Urban Res. 2017, 2, 2–11. [Google Scholar]
- Zhao, L.; Gao, S. Optimization of Community Health Service Facility Layout Based on Population Density: A Case Study of Central Beijing. Urban Dev. Res. 2020, 27, 26–32. [Google Scholar]
- Li, X.Y.; Wang, D.M. Analysis on the Present Situation and Influencing Factors of Leisure Sports Participation of Jinniu District Residents in Chengdu. Tibet Sci. Technol. 2017, 10, 23–25. [Google Scholar]
- Xu, C.N.; Jia, Z.Q.; Shi, D.P.; Xu, Y.N.; Heng, X.C.; Du, C.L. Ecological Analysis on the Location of Facilities in Urban Community Fitness Circles. Sports Cult. Guide 2016, 6, 13–16. [Google Scholar]
- Zhang, P.G.; Xu, Y.; Hu, S.; Hu, J.J. Sports facility and its layout for residents’ needs. Planners 2017, 33, 132–137. [Google Scholar]
- Wu, C.; Ye, X.; Ren, F.; Du, Q. Check-in behaviour and spatio-temporal vibrancy: An exploratory analysis in Shenzhen, China. Cities 2018, 77, 104–116. [Google Scholar] [CrossRef]
- Wu, J.; Ta, N.; Song, Y.; Lin, J.; Chai, Y. Urban form breeds neighborhood vibrancy: A case study using a GPS-based activity survey in suburban Beijing. Cities 2018, 74, 100–108. [Google Scholar] [CrossRef]
- Zhu, J.; Lu, H.; Zheng, T.; Rong, Y.; Wang, C.; Zhang, W.; Yan, Y.; Tang, L. Vitality of Urban Parks and Its Influencing Factors from the Perspective of Recreational Service Supply, Demand, and Spatial Links. Int. J. Environ. Res. Public Health 2020, 17, 1615. [Google Scholar] [CrossRef]
- Ministry of Urban-Rural Development, State Physical Culture and Sports Commission. Explanatory notes on “Interim Provisions on Quota of Land Use for Urban Public Sports Facilities”. Available online: https://www.sport.gov.cn/n315/n331/n403/n1957/c573993/content.html (accessed on 20 August 2024).
- Amap Open Platform. Available online: https://lbs.amap.com/ (accessed on 20 August 2024).
- Tianditu Website. Available online: https://www.tianditu.gov.cn/ (accessed on 20 August 2024).
- Shanghai Statistical Yearbook. Available online: https://navi.cnki.net/knavi/yearbooks/YSHTJ/detail?uniplatform=NZKPT (accessed on 20 August 2024).
- Nanjing Statistical Yearbook. Available online: https://navi.cnki.net/knavi/yearbooks/YNJTJ/detail?uniplatform=NZKPT (accessed on 20 August 2024).
- Hangzhou Statistical Yearbook. Available online: https://navi.cnki.net/knavi/yearbooks/YHDHO/detail?uniplatform=NZKPT (accessed on 20 August 2024).
- Hefei Statistical Yearbook. Available online: https://navi.cnki.net/knavi/yearbooks/YHFTJ/detail?uniplatform=NZKPT (accessed on 20 August 2024).
- Shanghai Municipal Government Website. Available online: https://www.shanghai.gov.cn/ (accessed on 20 August 2024).
- Nanjing Municipal Government Website. Available online: https://www.nanjing.gov.cn/ (accessed on 20 August 2024).
- Hangzhou Municipal Government Website. Available online: https://www.hangzhou.gov.cn/ (accessed on 20 August 2024).
- Hefei Municipal Government Website. Available online: https://www.hefei.gov.cn/ (accessed on 20 August 2024).
- Silverman, B.W. Density Estimation for Statistics and Data Analysis; Chapman and Hall: London, UK, 1986. [Google Scholar]
- Getis, A.; Franklin, J. Second-order neighborhood analysis of mapped point patterns. Ecol. Model. 1987, 38, 67–82. [Google Scholar] [CrossRef]
- Yu, S.; Wu, J. Assessing the coordination of urban land-use and public transport systems: A case study of the Beijing metropolitan area. J. Transp. Geogr. 2020, 84, 102684. [Google Scholar]
- Moran, P.A.P. Notes on continuous stochastic phenomena. Biometrika 1950, 37, 17–23. [Google Scholar] [CrossRef]
- Anselin, L. Local indicators of spatial association—LISA. Geogr. Anal. 1995, 27, 93–115. [Google Scholar] [CrossRef]
- Getis, A.; Ord, J.K. The analysis of spatial association by use of distance statistics. Geogr. Anal. 1992, 24, 189–206. [Google Scholar] [CrossRef]
- Garcia, M.; Martinez, E. Coefficient of variation as a measure of variability in spatial data analysis: A case study in ecological research. Ecol. Indic. 2021, 121, 107186. [Google Scholar]


| City | City Area (km2) | GDP (CNY) | Per Capita GDP (CNY) | Permanent Resident Population | Urbanization Rate | ||||
|---|---|---|---|---|---|---|---|---|---|
| 2013 | 2023 | 2013 | 2023 | 2013 | 2023 | 2013 | 2023 | ||
| Shanghai City | 6340 | 2.16 trillion | 4.50 trillion | 125,000 | 212,000 | 24.27 million | 24.80 million | 89.3% | 90.0% |
| Nanjing City | 6587 | 801.5 billion | 1.68 trillion | 108,000 | 185,000 | 8.21 million | 9.50 million | 78.7% | 87.2% |
| Hangzhou City | 16,847 | 834.3 billion | 1.87 trillion | 113,000 | 204,000 | 8.96 million | 12.40 million | 76.5% | 84.2% |
| Hefei City | 11,445 | 421.6 billion | 1.30 trillion | 72,000 | 143,000 | 7.53 million | 9.50 million | 70.8% | 85.6% |
| Data Type | Data Name | Data Source | Description | |
|---|---|---|---|---|
| Standard specification | Interim Provisions on the Quota of Land for Urban Public Sports Facilities [48] | https://www.sport.gov.cn/n315/n331/n403/n1957/c573993/content.html (accessed on 20 August 2024) | Types of sports service facilities | |
| Geospatial data | Amap Open Platform [49] | https://lbs.amap.com/ (accessed on 20 August 2024) | POI data of Shanghai, Nanjing, Hangzhou and Hefei in 2013 and 2023 | |
| Tianditu website [50] | https://www.tianditu.gov.cn/ (accessed on 20 August 2024) | Administrative division data of Shanghai, Nanjing, Hangzhou and Hefei | ||
| Socio-economic data | Statistical yearbook | Shanghai City [51] | https://navi.cnki.net/knavi/yearbooks/YSHTJ/detail?uniplatform=NZKPT (accessed on 20 August 2024) | The economic and demographic data of Shanghai, Nanjing, Hangzhou and Hefei in 2013 and 2023 |
| Nanjing City [52] | https://navi.cnki.net/knavi/yearbooks/YNJTJ/detail?uniplatform=NZKPT (accessed on 20 August 2024) | |||
| Hangzhou City [53] | https://navi.cnki.net/knavi/yearbooks/YHDHO/detail?uniplatform=NZKPT (accessed on 20 August 2024) | |||
| Hefei City [54] | https://navi.cnki.net/knavi/yearbooks/YHFTJ/detail?uniplatform=NZKPT (accessed on 20 August 2024) | |||
| Government website | Shanghai City [55] | https://www.shanghai.gov.cn/ (accessed on 20 August 2024) | ||
| Nanjing City [56] | https://www.nanjing.gov.cn/ (accessed on 20 August 2024) | |||
| Hangzhou City [57] | https://www.hangzhou.gov.cn/ (accessed on 20 August 2024) | |||
| Hefei City [58] | https://www.hefei.gov.cn/ (accessed on 20 August 2024) | |||
| Technical Guidelines for Community Life Circle Planning | Classification of POI Data | ||||||
|---|---|---|---|---|---|---|---|
| Service Element | Element Name | 2013 | 2023 | ||||
| Primary Class | Secondary Class | Tertiary Class | Primary Class | Secondary Class | Tertiary Class | ||
| Sports fitness | Multifunctional sports venues | Sports leisure services | Leisure places; Sports venues | Playground; Bowling hall; Swimming pool; Badminton hall; Ice skating rink; Ski resort; Tennis court; Golf course | Sports leisure services | Sports venues | Bowling hall; Squash court; Ski resort; Basketball stadium; Ice skating rink; Table tennis hall; Billiards hall; Taekwondo hall; Tennis court; Swimming pool; Badminton court; Football field |
| Outdoor comprehensive fitness venues | Sports leisure services | Sports venues | Multipurpose sports stadium | Sports leisure services | Sports venues | Sports venues; Outdoor fitness venues; Aquatic activity center | |
| Gymnasium (Stadium) | Sports leisure services | Sports venues | Multipurpose sports stadium | Sports leisure services | Sports venues | Multipurpose sports stadium | |
| Fitness center | Sports leisure services | Sports venues | Fitness center | Sports leisure services | Sports venues | Outdoor fitness place; Fitness center | |
| Small Sports Park | Scenic spot | Park plaza | Park | Scenic spot | Park plaza | Park; Park internal facilities | |
| Fitness trail | - | - | - | Traffic facilities; Sports leisure services | Traffic facilities; Sports leisure service places | Traffic facilities; Sports leisure service places | |
| Sport center | Sports leisure services; Science and education cultural services | Sports venues; Palace of culture | Fitness center; Comprehensive gymnasium; Palace of culture | Sports leisure services | Sports venues | Fitness center; Comprehensive gymnasium | |
| Exercise plaza | Scenic spot | Park plaza | Square | Scenic spot | Park plaza | Urban square | |
| City | Observed Mean Distance (m) | Expected Mean Distance (m) | Nearest Neighbor Index | p-Value | ||||
|---|---|---|---|---|---|---|---|---|
| 2013 | 2023 | 2013 | 2023 | 2013 | 2023 | 2013 | 2023 | |
| Shanghai City | 289.12 | 222.40 | 789.52 | 633.84 | 0.3634 | 0.3589 | 0.00 | 0.00 |
| Nanjing City | 400.32 | 311.36 | 1367.76 | 767.28 | 0.2948 | 0.4048 | 0.00 | 0.00 |
| Hangzhou City | 489.28 | 355.84 | 1645.76 | 1011.92 | 0.2946 | 0.3514 | 0.00 | 0.00 |
| Hefei City | 333.60 | 422.56 | 1823.68 | 1078.64 | 0.1843 | 0.3859 | 0.00 | 0.00 |
| City | Number of Sports Service Facilities | Number of Community Life Circles | Matching Synergy Index | |||
|---|---|---|---|---|---|---|
| 2013 | 2023 | 2013 | 2023 | 2013 | 2023 | |
| Shanghai City | 4829 | 7929 | 1766 | 2823 | 1.15 | 1.02 |
| Nanjing City | 1345 | 4325 | 644 | 1547 | 0.88 | 1.01 |
| Hangzhou City | 1552 | 5479 | 771 | 1977 | 0.85 | 1.00 |
| Hefei City | 774 | 2832 | 401 | 1085 | 0.81 | 0.94 |
| City | IM | GE | GO | |||
|---|---|---|---|---|---|---|
| 2013 | 2023 | 2013 | 2023 | 2013 | 2023 | |
| Shanghai City | 0.5775 | 0.5008 | 0.0005 | 0.0003 | 0.0015 | 0.0010 |
| Nanjing City | 0.4679 | 0.5078 | 0.0014 | 0.0006 | 0.0047 | 0.0018 |
| Hangzhou City | 0.4700 | 0.4239 | 0.0012 | 0.0005 | 0.0032 | 0.0012 |
| Hefei City | 0.5182 | 0.4835 | 0.0024 | 0.0008 | 0.0081 | 0.0025 |
| City | Coefficient of Variation Value | Change Degree | |
|---|---|---|---|
| 2013 | 2023 | ||
| Shanghai City | 7.98 | 9.67 | +1.69 |
| Nanjing City | 9.15 | 9.45 | +0.30 |
| Hangzhou City | 5.98 | 9.25 | +3.27 |
| Hefei City | 8.32 | 9.50 | +1.18 |
| Mean value | 7.86 | 9.47 | +1.61 |
Disclaimer/Publisher’s Note: The statements, opinions and data contained in all publications are solely those of the individual author(s) and contributor(s) and not of MDPI and/or the editor(s). MDPI and/or the editor(s) disclaim responsibility for any injury to people or property resulting from any ideas, methods, instructions or products referred to in the content. |
© 2024 by the authors. Licensee MDPI, Basel, Switzerland. This article is an open access article distributed under the terms and conditions of the Creative Commons Attribution (CC BY) license (https://creativecommons.org/licenses/by/4.0/).
Share and Cite
Ye, P.; Wang, J. Analysis of the Spatio-Temporal Evolution of Urban Sports Service Facilities in the Yangtze River Delta. Sustainability 2024, 16, 8654. https://doi.org/10.3390/su16198654
Ye P, Wang J. Analysis of the Spatio-Temporal Evolution of Urban Sports Service Facilities in the Yangtze River Delta. Sustainability. 2024; 16(19):8654. https://doi.org/10.3390/su16198654
Chicago/Turabian StyleYe, Peng, and Jianing Wang. 2024. "Analysis of the Spatio-Temporal Evolution of Urban Sports Service Facilities in the Yangtze River Delta" Sustainability 16, no. 19: 8654. https://doi.org/10.3390/su16198654
APA StyleYe, P., & Wang, J. (2024). Analysis of the Spatio-Temporal Evolution of Urban Sports Service Facilities in the Yangtze River Delta. Sustainability, 16(19), 8654. https://doi.org/10.3390/su16198654