
Assessing Environmental Sustainability in the Transnational Basin of the Tumen River Based on Remote Sensing Data and a Geographical Detector

Abstract
1. Introduction
2. Study Area and Data
2.1. Study Area
2.2. Data
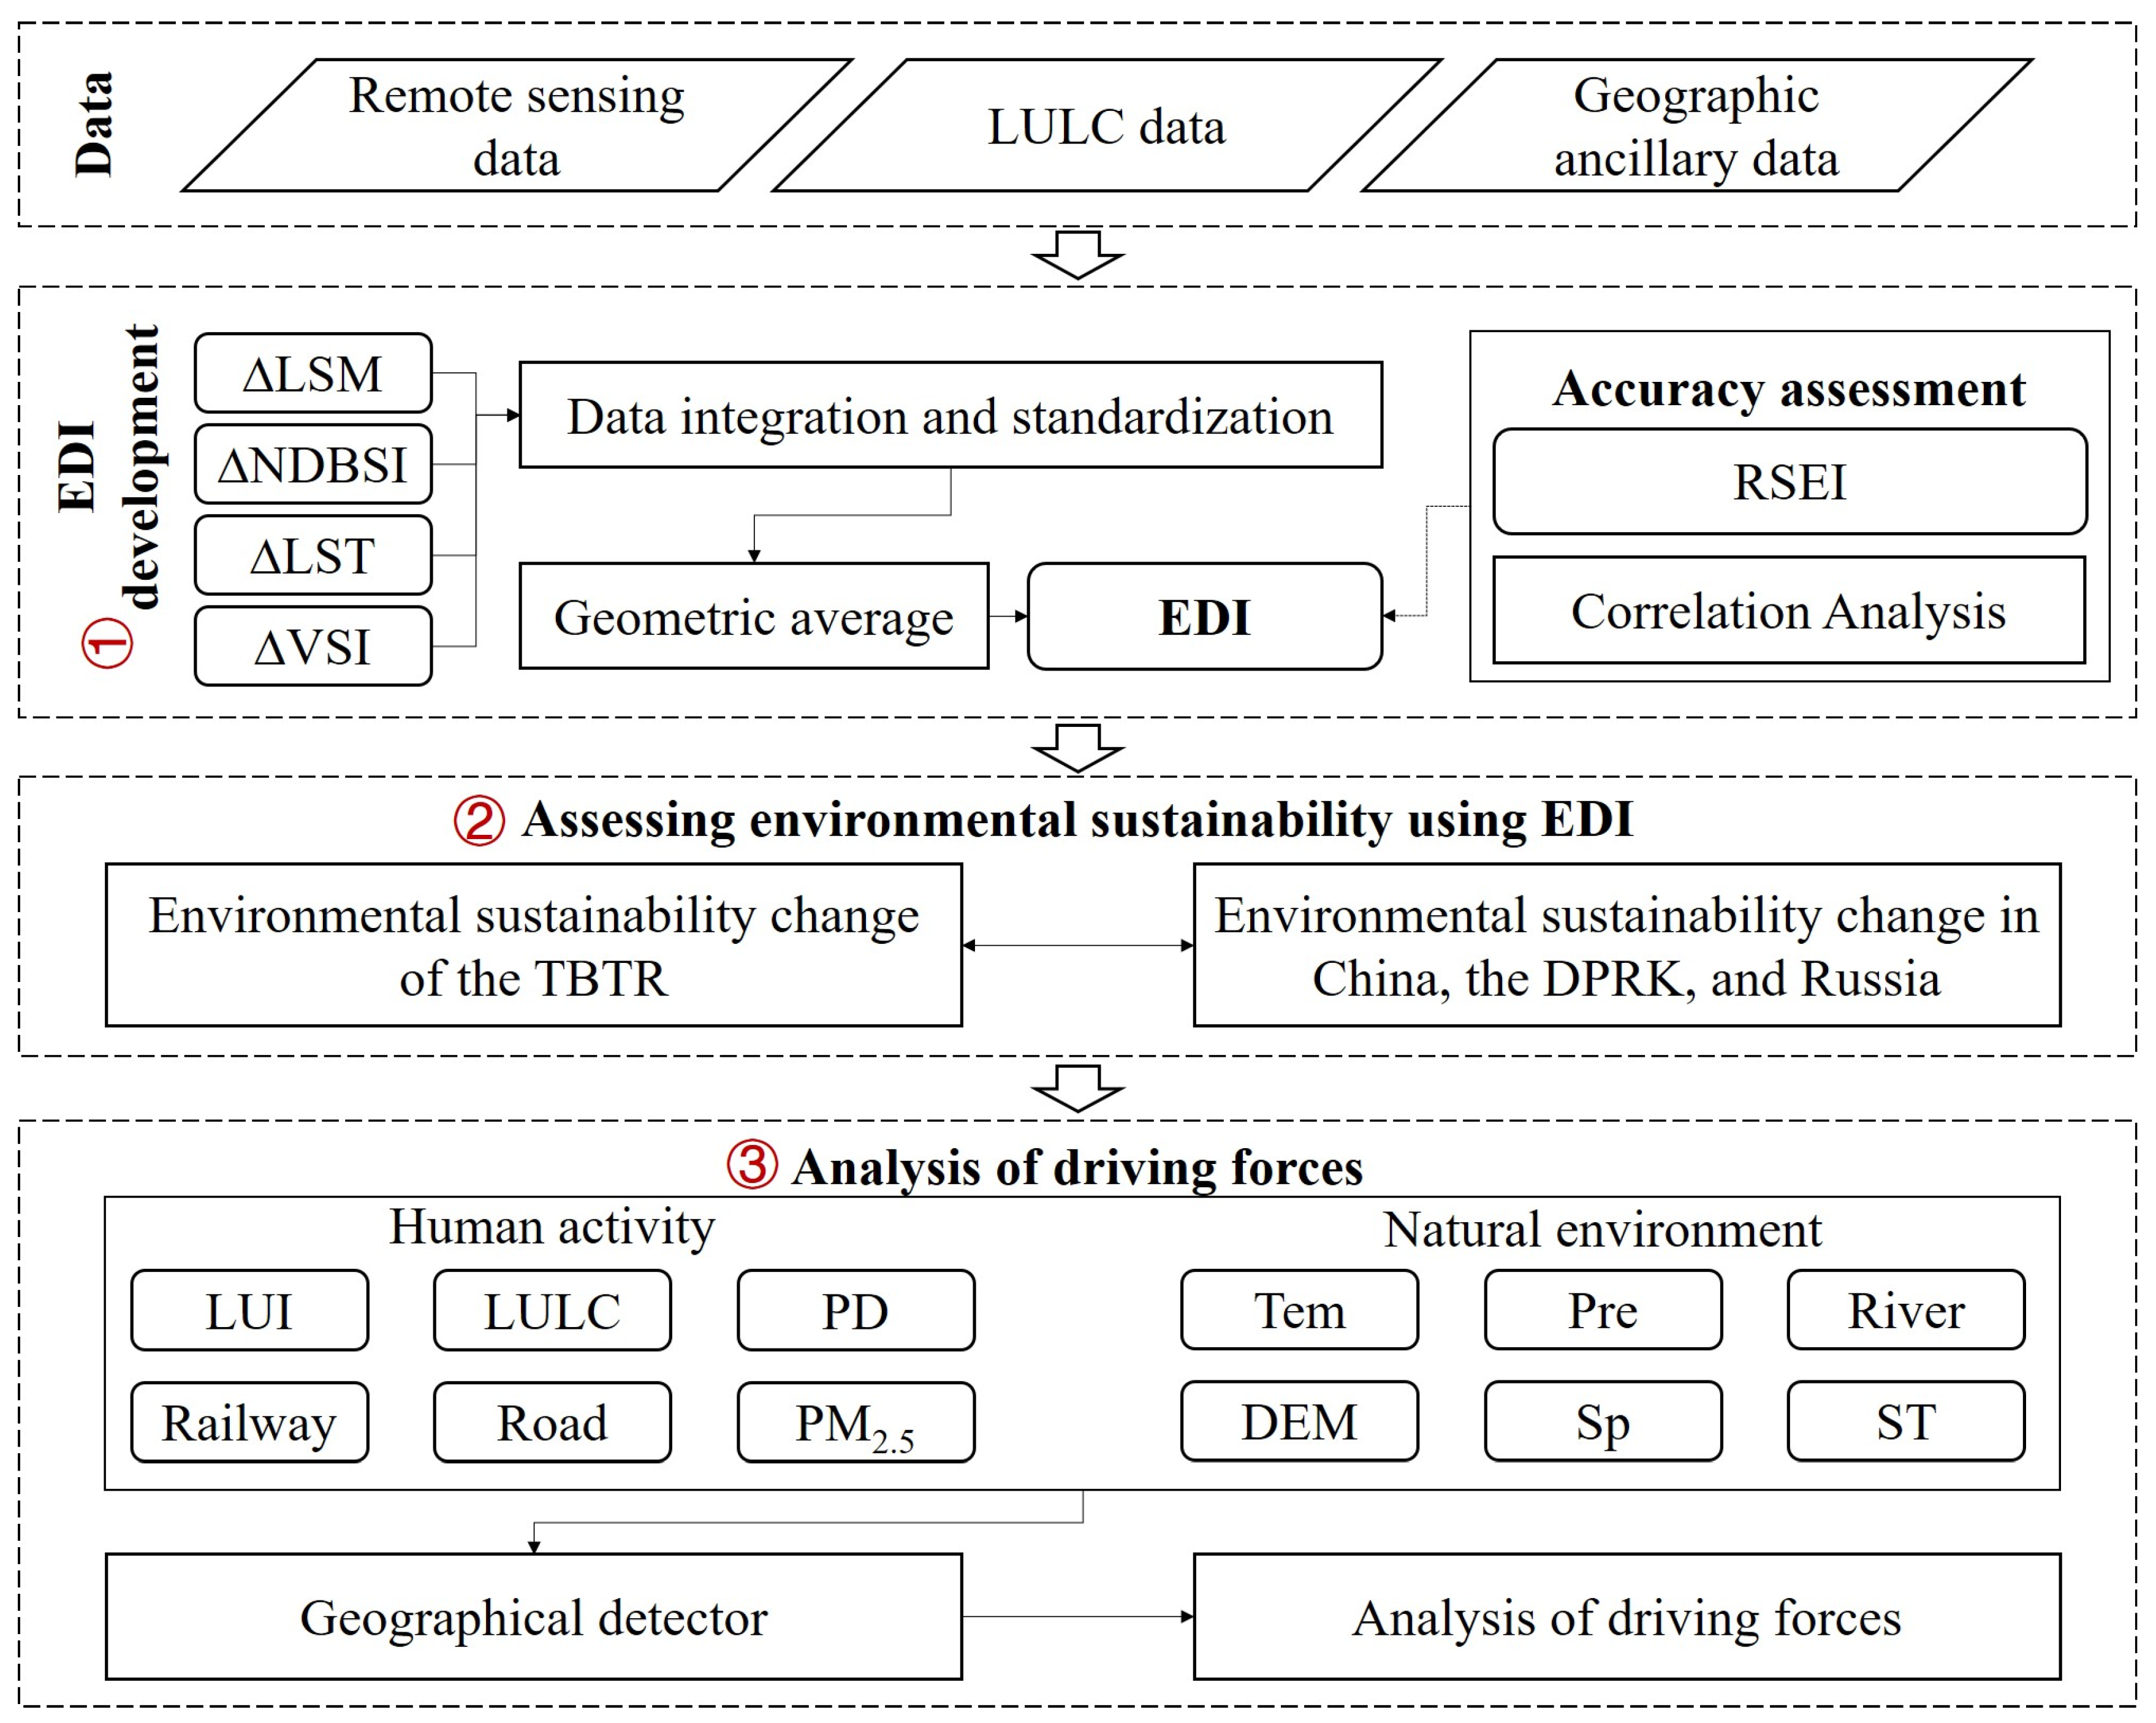
3. Methods
3.1. Developing the EDI
3.2. Assessing Environmental Sustainability in the TBTR from 2000 to 2021 Using EDI
3.3. Analyzing Driving Forces of Environmental Sustainability Using Geographical Detector
3.3.1. Factors Selection
3.3.2. Geographical Detector
4. Results
4.1. Performance of the EDI
4.2. Environmental Sustainability Dynamics in the TBTR from 2000 to 2021
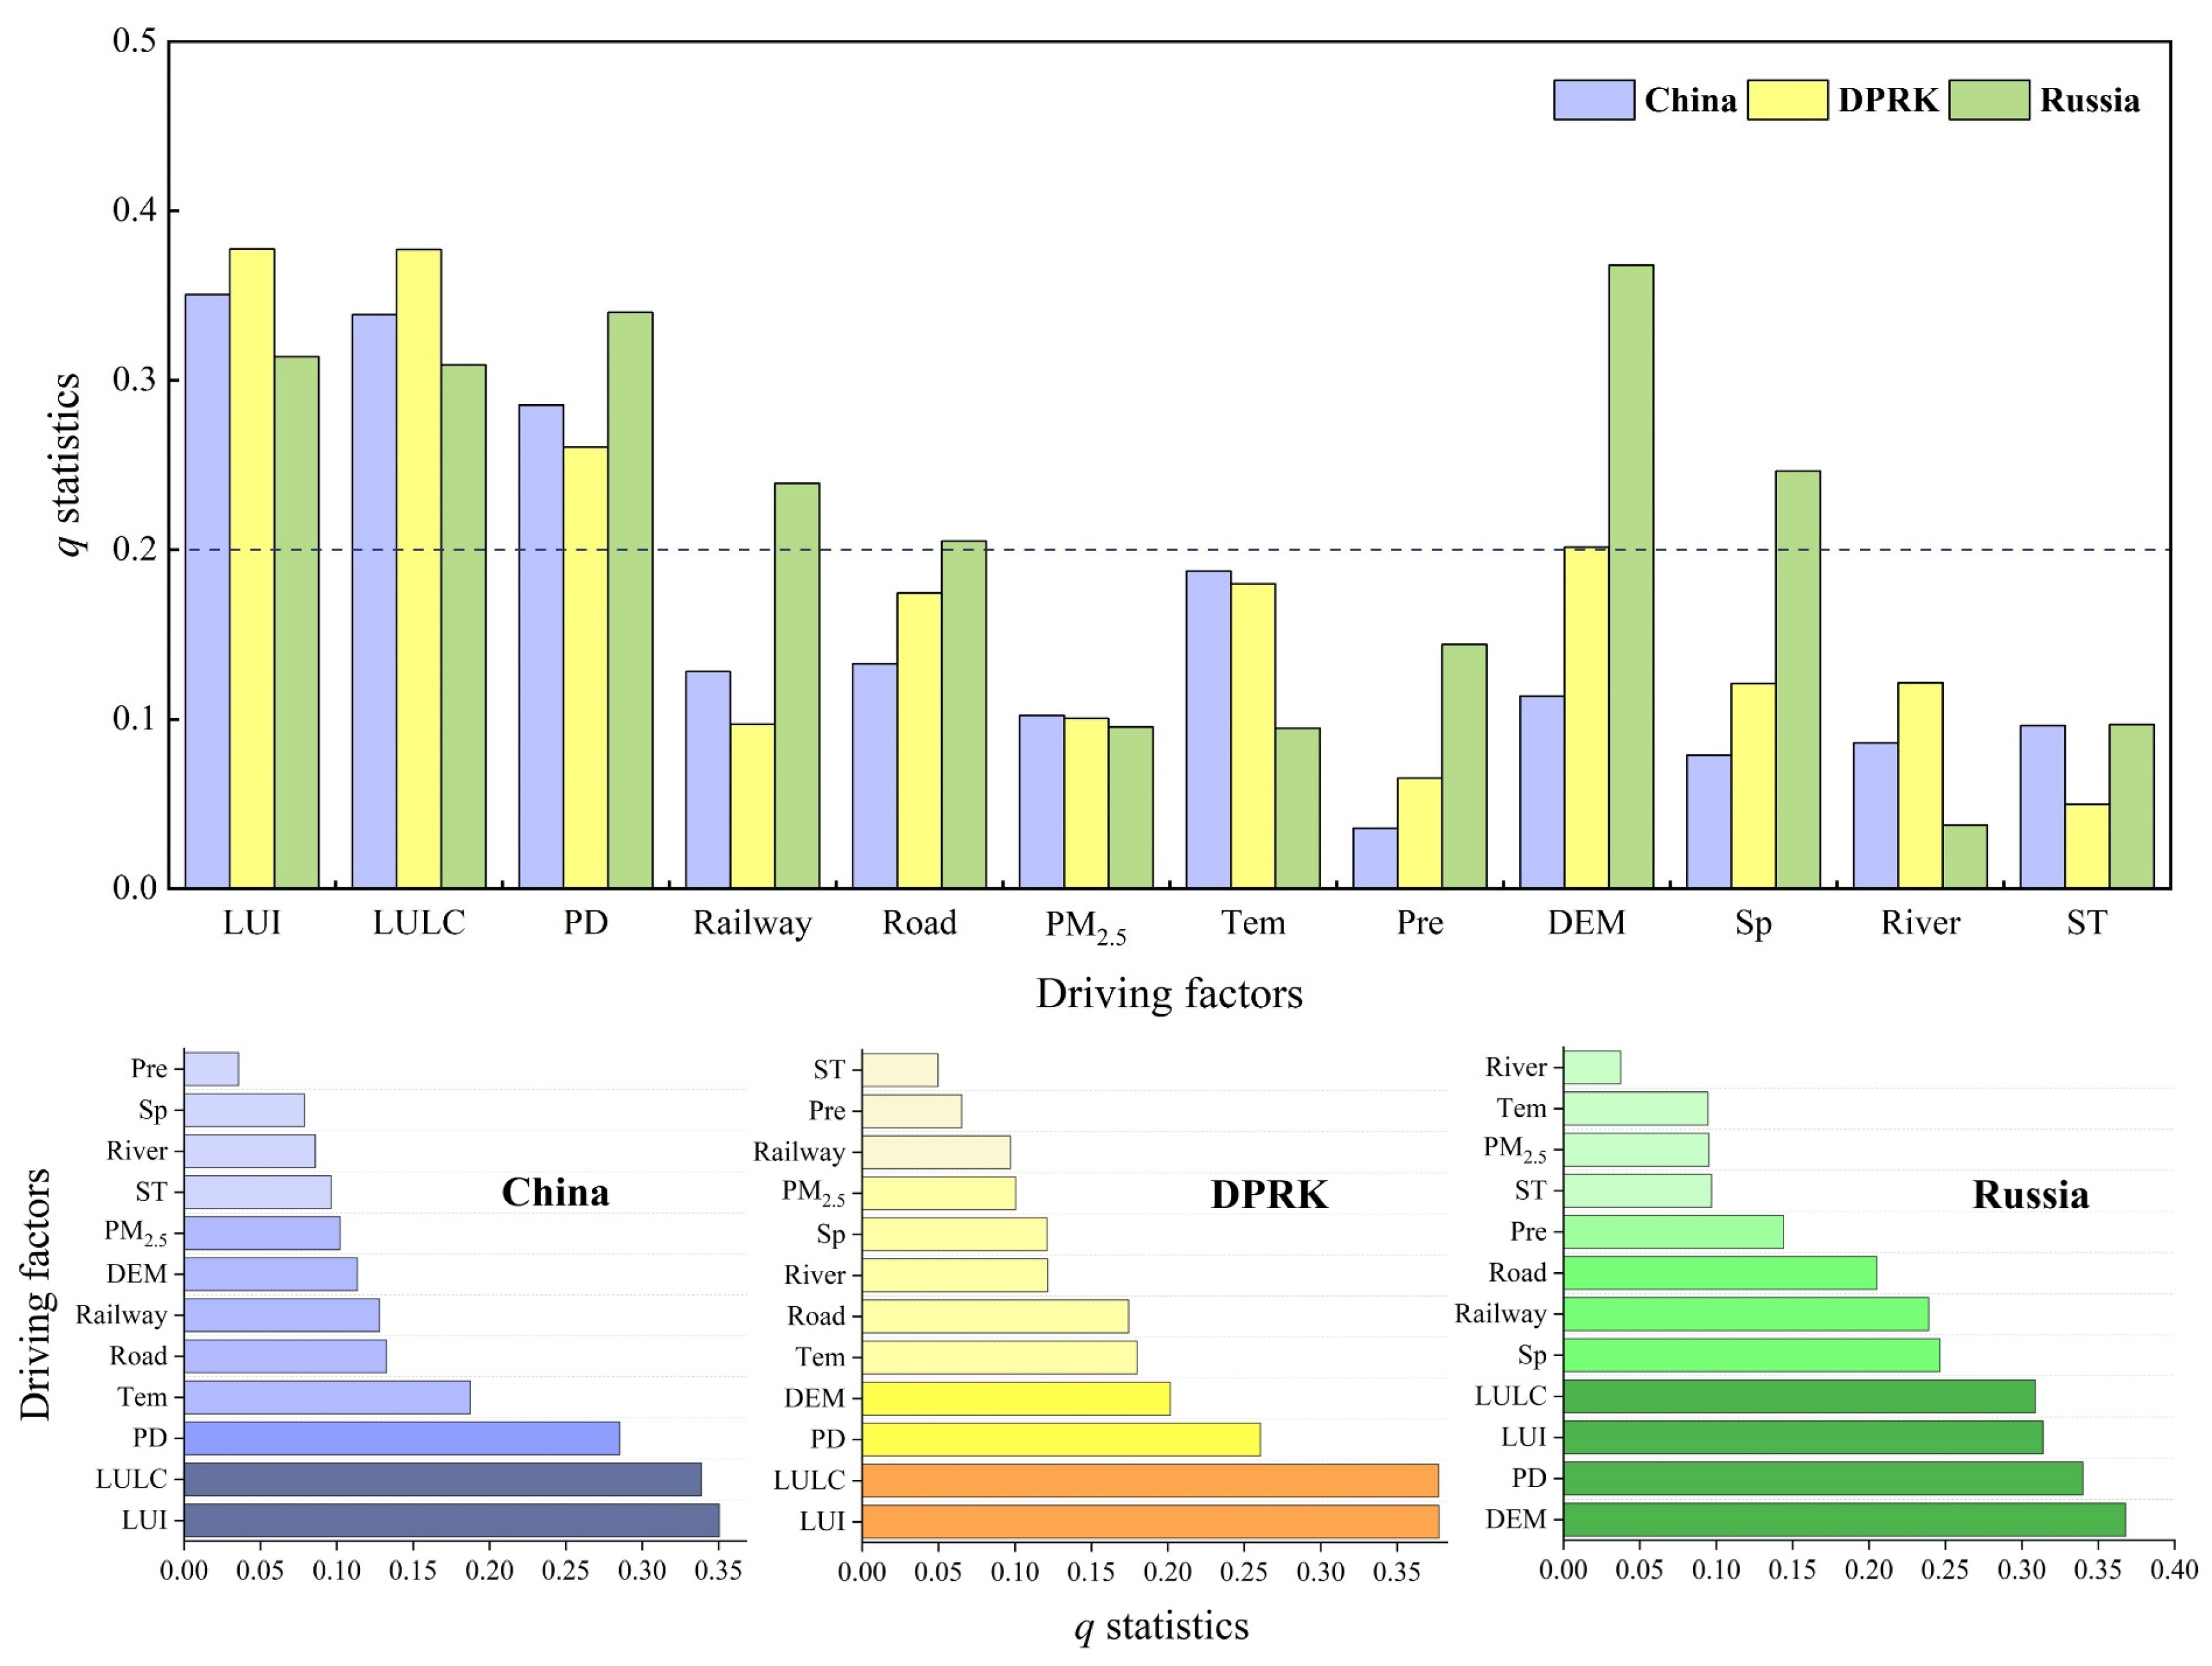
4.3. Driving Forces of Environmental Sustainability in the TBTR from 2000 to 2021
5. Discussion
5.1. Differences in Environmental Sustainability Dynamics among the Subregions of China, the DPRK, and Russia
5.2. Differences in Driving Forces of Environmental Sustainability among China, the DPRK, and Russia
5.3. Implications for Improving Environmental Sustainability for the Transnational Area of China, North Korea, and Russia
5.4. Future Perspectives
6. Conclusions
Supplementary Materials
Author Contributions
Funding
Data Availability Statement
Acknowledgments
Conflicts of Interest
References
- Daly, H.E. On Wilfred Beckerman’s critique of sustainable development. Environ. Values 1995, 4, 49–55. [Google Scholar] [CrossRef]
- Wu, J. Landscape sustainability science: Ecosystem services and human well-being in changing landscapes. Landsc. Ecol. 2013, 28, 999–1023. [Google Scholar] [CrossRef]
- Wu, J. Landscape sustainability science (II): Core questions and key approaches. Landsc. Ecol. 2021, 36, 2453–2485. [Google Scholar] [CrossRef]
- Fang, C. The strategy and pattern of international economic cooperation in Tumen River area of China under the background of “the Belt and Road”. Northeast Asia Econ. Res 2017, 1, 5–14. [Google Scholar]
- Nan, Y.; Wang, B.; Zhang, D.; Liu, Z.; Qi, D.; Zhou, H. Spatial Patterns of LULC and driving forces in the Transnational Area of Tumen River: A comparative analysis of the sub-regions of China, the DPRK, and Russia. Chin. Geogr. Sci. 2020, 30, 588–599. [Google Scholar] [CrossRef]
- Sun, Y.; Nan, Y.; Zhang, D.; Yang, Y.; Gan, X.; Piao, L. Environmental degradation in the transnational area of Changbai Mountain based on multiple remote sensing data. Land Degrad. Dev. 2022, 33, 2855–2869. [Google Scholar] [CrossRef]
- Yang, Y.; Zhang, D.; Nan, Y.; Liu, Z.; Zheng, W. Modeling urban expansion in the transnational area of Changbai Mountain: A scenario analysis based on the zoned Land Use Scenario Dynamics-urban model. Sustain. Cities Soc. 2019, 50, 101622. [Google Scholar] [CrossRef]
- Zhang, H.; Li, M. A process-based framework to examine China’s approach to transboundary water management. Int. J. Water Resour. Dev. 2018, 34, 705–731. [Google Scholar] [CrossRef]
- Li, B.; Liu, Z.; Nan, Y.; Li, S.; Yang, Y. Comparative analysis of urban heat island intensities in Chinese, Russian, and DPRK regions across the transnational urban agglomeration of the Tumen River in Northeast Asia. Sustainability 2018, 10, 2637. [Google Scholar] [CrossRef]
- Zhang, D.; Nan, Y.; Zhu, W.; He, C.; Liu, Z.; Yang, Y. Indirect impacts of future urban expansion on ecosystem services in the transnational area of China, North Korea, and Russia. Land Degrad. Dev. 2023, 34, 2334–2348. [Google Scholar] [CrossRef]
- Zhang, Q. Ecological Environment Status Bulletin of Jilin Province; Department of Ecology and Environment of Jilin Province: Changchun, China, 2023. [Google Scholar]
- Zhu, W.; Cao, G.; Li, Y.; Xu, W.; Shi, M.; Qin, L. Research on the health assessment of river ecosystem in the area of Tumen River Basin. Acta Ecol. Sin. 2014, 34, 3969–3977. [Google Scholar]
- Tao, H.; Nan, Y.; Liu, Z.-F. Spatiotemporal patterns of forest in the Transnational Area of Changbai Mountain from 1977 to 2015: A comparative analysis of the Chinese and DPRK sub-regions. Sustainability 2017, 9, 1054. [Google Scholar] [CrossRef]
- Liu, P.; Ren, C.; Yu, W.; Ren, H.; Xia, C. Exploring the ecological quality and its drivers based on annual remote sensing ecological index and multisource data in Northeast China. Ecol. Indic. 2023, 154, 110589. [Google Scholar] [CrossRef]
- Piao, Y.; Jeong, S.; Park, S.; Lee, D. Analysis of Land Use and Land Cover change using Time-Series Data and Random Forest in North Korea. Remote Sens. 2021, 13, 3501. [Google Scholar] [CrossRef]
- Yao, Y.; Zhang, D.; Nan, Y.; Jin, S.; Sun, Y. Environmental degradation in the Korean Peninsula: Evidence from the environmental degradation index. Ecol. Indic. 2024, 158, 111503. [Google Scholar] [CrossRef]
- Lim, C.-H.; Choi, Y.; Kim, M.; Jeon, S.W.; Lee, W.-K. Impact of deforestation on agro-environmental variables in cropland, North Korea. Sustainability 2017, 9, 1354. [Google Scholar] [CrossRef]
- Wang, Z.; Zhang, B.; Yu, H. Resources and Environment of NorthEast Asia; Jilin University Publishing: Changchun, China, 2019. [Google Scholar]
- Xiang, H.; Jia, M.; Wang, Z.; Li, L.; Mao, D.; Zhang, D.; Cui, G.; Zhu, W. Impacts of Land Cover Changes on Ecosystem Carbon Stocks Over the Transboundary Tumen River Basin in Northeast Asia. Chin. Geogr. Sci. 2018, 28, 973–985. [Google Scholar] [CrossRef]
- Zheng, X.J.; Sun, P.; Zhu, W.H.; Xu, Z.; Fu, J.; Man, W.D.; Li, H.L.; Zhang, J.; Qin, L. Landscape dynamics and driving forces of wetlands in the Tumen River Basin of China over the past 50 years. Landsc. Ecol. Eng. 2017, 13, 237–250. [Google Scholar] [CrossRef]
- Schiavina, M.; Freire, S.; Carioli, A.; MacManus, K. GHS-POP R2023A–GHS Population Grid Multitemporal (1975–2030). In European Commission; Joint Research Centre (JRC): Brussels, Belgium, 2023. [Google Scholar]
- Zhang, D.; Huang, Q.; He, C.; Wu, J. Impacts of urban expansion on ecosystem services in the Beijing-Tianjin-Hebei urban agglomeration, China: A scenario analysis based on the Shared Socioeconomic Pathways. Resour. Conserv. Recycl. 2017, 125, 115–130. [Google Scholar] [CrossRef]
- He, C.; Gao, B.; Huang, Q.; Ma, Q.; Dou, Y. Environmental degradation in the urban areas of China: Evidence from multi-source remote sensing data. Remote Sens. Environ. 2017, 193, 65–75. [Google Scholar] [CrossRef]
- Lobser, S.E.; Cohen, W.B. MODIS tasselled cap: Land cover characteristics expressed through transformed MODIS data. Int. J. Remote Sens. 2007, 28, 5079–5101. [Google Scholar] [CrossRef]
- Ren, H.; Zhao, Y. Ecological vulnerability assessment in rapid urbanization areas of karst mountainous areas: Take Guiyang as a case. Ecol. Sci. 2020, 39, 252–258. [Google Scholar]
- Xu, H.; Wang, M.; Shi, T.; Guan, H.; Fang, C.; Lin, Z. Prediction of ecological effects of potential population and impervious surface increases using a remote sensing based ecological index (RSEI). Ecol. Indic. 2018, 93, 730–740. [Google Scholar] [CrossRef]
- Seddon, A.W.; Macias-Fauria, M.; Long, P.R.; Benz, D.; Willis, K.J. Sensitivity of global terrestrial ecosystems to climate variability. Nature 2016, 531, 229–232. [Google Scholar] [CrossRef]
- Yang, C.; Zhang, C.; Li, Q.; Liu, H.; Gao, W.; Shi, T.; Liu, X.; Wu, G. Rapid urbanization and policy variation greatly drive ecological quality evolution in Guangdong-Hong Kong-Macau Greater Bay Area of China: A remote sensing perspective. Ecol. Indic. 2020, 115, 106373. [Google Scholar] [CrossRef]
- Hu, X.; Xu, H. A new remote sensing index for assessing the spatial heterogeneity in urban ecological quality: A case from Fuzhou City, China. Ecol. Indic. 2018, 89, 11–21. [Google Scholar] [CrossRef]
- Wang, R.; Sun, Y.; Zhang, D.; Nan, Y.; Jin, S.; Peng, L. Assessing the environmental sustainability of the transnational area of China, North Korea, and Russia using an improved environmental degradation index. Ecol. Indic. 2024, 158, 111501. [Google Scholar] [CrossRef]
- Lim, C.-H.; Yoo, S.; Choi, Y.; Jeon, S.W.; Son, Y.; Lee, W.-K. Assessing climate change impact on forest habitat suitability and diversity in the Korean Peninsula. Forests 2018, 9, 259. [Google Scholar] [CrossRef]
- van Vliet, J. Direct and indirect loss of natural area from urban expansion. Nat. Sustain. 2019, 2, 755–763. [Google Scholar] [CrossRef]
- Willis, K.S. Remote sensing change detection for ecological monitoring in United States protected areas. Biol. Conserv. 2015, 182, 233–242. [Google Scholar] [CrossRef]
- Lu, Z.; Lei, G.; Guo, Y.; Ma, Q. Changes of land use intensity in the Songnen Plain of different spatial scales and their effects on climatic factors. Acta Ecol. Sin. 2021, 41, 1–13. [Google Scholar]
- Zhu, L.; Meng, J.; Zhu, L. Applying Geodetector to disentangle the contributions of natural and anthropogenic factors to NDVI variations in the middle reaches of the Heihe River Basin. Ecol. Indic. 2020, 117, 106545. [Google Scholar] [CrossRef]
- Liu, Y.; Li, J. Geographic detection and optimizing decision of the differentiation mechanism of rural poverty in China. Acta Geogr. Sin. 2017, 72, 161–173. [Google Scholar]
- Gu, Z.; Duan, X.; Shi, Y.; Li, Y.; Pan, X. Spatiotemporal variation in vegetation coverage and its response to climatic factors in the Red River Basin, China. Ecol. Indic. 2018, 93, 54–64. [Google Scholar] [CrossRef]
- Peng, W.; Kuang, T.; Tao, S. Quantifying influences of natural factors on vegetation NDVI changes based on geographical detector in Sichuan, western China. J. Clean. Prod. 2019, 233, 353–367. [Google Scholar] [CrossRef]
- Yuan, L.; Chen, X.; Wang, X.; Xiong, Z.; Song, C. Spatial associations between NDVI and environmental factors in the Heihe River Basin. J. Geogr. Sci. 2019, 29, 1548–1564. [Google Scholar] [CrossRef]
- Wang, J.; Xu, C. Geodetector: Principle and prospective. Acta Geogr. Sin. 2017, 72, 116–134. [Google Scholar]
- Song, Y.; Wang, J.; Ge, Y.; Xu, C. An optimal parameters-based geographical detector model enhances geographic characteristics of explanatory variables for spatial heterogeneity analysis: Cases with different types of spatial data. GIScience Remote Sens. 2020, 57, 593–610. [Google Scholar] [CrossRef]
- Xu, H. A remote sensing index for assessment of regional ecological changes. China Environ. Sci. 2013, 33, 889–897. [Google Scholar]
- Gao, X.; Yang, L.; Li, C.; Song, Z.; Wang, J. Land use change and ecosystem service value measurement in Baiyangdian Basin under the simulated multiple scenarios. Acta Ecol. Sin. 2021, 41, 7974–7988. [Google Scholar]
- Bryan, B.A.; Gao, L.; Ye, Y.; Sun, X.; Connor, J.D.; Crossman, N.D.; Stafford-Smith, M.; Wu, J.; He, C.; Yu, D.; et al. China’s response to a national land-system sustainability emergency. Nature 2018, 559, 193–204. [Google Scholar] [CrossRef] [PubMed]
- Yang, J.; Huang, X. The 30 m annual land cover dataset and its dynamics in China from 1990 to 2019. Earth Syst. Sci. Data 2021, 13, 3907–3925. [Google Scholar] [CrossRef]
- Xiao, Z.; Liu, R.; Gao, Y.; Yang, Q.; Chen, J. Spatiotemporal variation characteristics of ecosystem health and its driving mechanism in the mountains of southwest China. J. Clean. Prod. 2022, 345, 131138. [Google Scholar] [CrossRef]
- Wang, C.; Jiang Qo Engel, B.; Mercado, J.A.V.; Zhang, Z. Analysis on net primary productivity change of forests and its multi–level driving mechanism—A case study in Changbai Mountains in Northeast China. Technol. Forecast. Soc. Chang. 2020, 153, 119939. [Google Scholar] [CrossRef]
- Quan, D.; Quan, H.; Zhu, W.; Lin, Z.; Jin, R. A Comparative Study on the Drivers of Forest Fires in Different Countries in the Cross-Border Area between China, North Korea and Russia. Forests 2022, 13, 1939. [Google Scholar] [CrossRef]
- Chu, H.; Venevsky, S.; Wu, C.; Wang, M. NDVI-based vegetation dynamics and its response to climate changes at Amur-Heilongjiang River Basin from 1982 to 2015. Sci. Total Environ. 2019, 650, 2051–2062. [Google Scholar] [CrossRef]
- Jin, R.; Lee, K.-S. Investigation of forest fire characteristics in North Korea using remote sensing data and GIS. Remote Sens. 2022, 14, 5836. [Google Scholar] [CrossRef]
- Choi, H.-A. Challenges of forest management for achieving the sustainable forest management in DPRK. J. East Asian Aff. 2021, 34, 159–179. [Google Scholar]
- Weng, Q.; Lu, D.; Schubring, J. Estimation of land surface temperature–vegetation abundance relationship for urban heat island studies. Remote Sens. Environ. 2004, 89, 467–483. [Google Scholar] [CrossRef]


| Respects | Data Name (Abbreviation) | Unit | |
|---|---|---|---|
| Human activity | Land use intensity (LUI) | - | |
| Land use and Land cover (LULC) | categorical | ||
| Population Density (PD) | Persons/km2 | ||
| Distance to the railway (Railway) | km | ||
| Distance to the road (Road) | km | ||
| PM2.5 | μg/m3 | ||
| Natural environment | Climate | Temperature (Tem) | °C |
| Precipitation (Pre) | mm | ||
| Topography | Elevation (DEM) | m | |
| Slope (Sp) | ° | ||
| River | Distance to the rivers (River) | km | |
| Soil | Soil type (ST) | categorical | |
| Factors | LSM | NDBSI | LST | VSI | EDI |
|---|---|---|---|---|---|
| LSM | 1 | 0.533 ** | 0.247 ** | −0.034 ** | 0.522 ** |
| NDBSI | 1 | 0.170 ** | 0.665 ** | 0.903 ** | |
| LST | 1 | −0.071 ** | 0.452 ** | ||
| VSI | 1 | 0.713 ** | |||
| Mean correlation | 0.249 | 0.456 | 0.115 | 0.187 | 0.648 |
| Seriously Degraded | Generally Degraded | Unchanged | Generally Improved | Significantly Improved | ||||||
|---|---|---|---|---|---|---|---|---|---|---|
| Area (km2) | Percentage * | Area (km2) | Percentage * | Area (km2) | Percentage * | Area (km2) | Percentage * | Area (km2) | Percentage * | |
| China | 1185.50 | 5.26 | 5831.50 | 25.90 | 9125.50 | 40.52 | 4706.75 | 20.90 | 1670.25 | 7.42 |
| DPRK | 831.50 | 6.30 | 3226.00 | 24.42 | 5177.75 | 39.20 | 3086.00 | 23.36 | 887.50 | 6.72 |
| Russia | 447.50 | 6.62 | 1652.75 | 24.44 | 2612.50 | 38.63 | 1616.75 | 23.91 | 432.75 | 6.40 |
| TBTR | 2464.50 | 5.80 | 10,710.25 | 25.21 | 16,915.75 | 39.81 | 9409.50 | 22.14 | 2990.50 | 7.04 |
| LUI | LULC | PD | Railway | Road | PM2.5 | Tem | Pre | DEM | Sp | River | ST | ||
|---|---|---|---|---|---|---|---|---|---|---|---|---|---|
| China | q | 0.3505 | 0.3387 | 0.2853 | 0.1279 | 0.1326 | 0.1022 | 0.1874 | 0.0357 | 0.1135 | 0.0788 | 0.0860 | 0.0963 |
| DPRK | q | 0.3774 | 0.3771 | 0.2606 | 0.0970 | 0.1744 | 0.1004 | 0.1798 | 0.0652 | 0.2016 | 0.1210 | 0.1215 | 0.0497 |
| Russia | q | 0.3139 | 0.3089 | 0.3400 | 0.2391 | 0.2051 | 0.0952 | 0.0946 | 0.1441 | 0.3680 | 0.2464 | 0.0375 | 0.0969 |
Disclaimer/Publisher’s Note: The statements, opinions and data contained in all publications are solely those of the individual author(s) and contributor(s) and not of MDPI and/or the editor(s). MDPI and/or the editor(s) disclaim responsibility for any injury to people or property resulting from any ideas, methods, instructions or products referred to in the content. |
© 2024 by the authors. Licensee MDPI, Basel, Switzerland. This article is an open access article distributed under the terms and conditions of the Creative Commons Attribution (CC BY) license (https://creativecommons.org/licenses/by/4.0/).
Share and Cite
Jin, L.; Zhang, Z. Assessing Environmental Sustainability in the Transnational Basin of the Tumen River Based on Remote Sensing Data and a Geographical Detector. Sustainability 2024, 16, 8121. https://doi.org/10.3390/su16188121
Jin L, Zhang Z. Assessing Environmental Sustainability in the Transnational Basin of the Tumen River Based on Remote Sensing Data and a Geographical Detector. Sustainability. 2024; 16(18):8121. https://doi.org/10.3390/su16188121
Chicago/Turabian StyleJin, Lin, and Zhijie Zhang. 2024. "Assessing Environmental Sustainability in the Transnational Basin of the Tumen River Based on Remote Sensing Data and a Geographical Detector" Sustainability 16, no. 18: 8121. https://doi.org/10.3390/su16188121
APA StyleJin, L., & Zhang, Z. (2024). Assessing Environmental Sustainability in the Transnational Basin of the Tumen River Based on Remote Sensing Data and a Geographical Detector. Sustainability, 16(18), 8121. https://doi.org/10.3390/su16188121