1. Introduction
Eutrophication is a natural, slow process defined as an increase in trophic state, i.e., water fertility, due to increased concentrations of P, N, and C compounds [
1,
2]. Human activities such as the transformation of lakes into recipients of different types of sewage, which are a significant source of nutrients and organic substances, along with industrialization, forest cutting, intensification of agriculture, and the related use of artificial fertilizers or plant protection products, breeding and rearing of animals and fish, tourism, and recreation, as well as improper drainage of swampy areas, accelerate eutrophication process [
3,
4].
In degraded lakes, disruptions of the natural circulation of mineral and organic matter are observed, mainly manifesting themselves as mass blooms of algae and toxic cyanobacteria, disruption of oxygen and carbonate systems, and also deterioration of the taste and smell of water, which leads to the elimination of the water body as a facility used for recreational activities [
5,
6].
In highly degraded lakes, it is necessary to use restoration (technical, chemical, or biological), the aim of which is to restore the natural circulation of elements in the water, primarily by limiting the availability of nutrients (P and N) [
7,
8]. During restoration activities, it is very important to research changes in the circulation of various compounds, not only nitrogen and phosphorus or oxygen systems but also those that are important for aquatic organisms. Researchers pay little attention to observations of changes in buffer and carbonate systems, water hardness, or calcium and magnesium content that occur as a result of restoration. This is important because the mentioned parameters play important functions in aquatic ecosystems. The dissolution of calcite is a source of calcium and bicarbonate ions, which protect the water from acidification [
9,
10]. The presence of HCO
3−, CO
32−, and OH
−, as well as silicates, borates, ammonia, phosphates, and organic bases, in water, gives water the ability to neutralize strong acids. Carbon dioxide takes part in biological transformations; it is produced in respiration processes and taken up in biosynthetic processes by autotrophic and photosynthetic organisms. Individual forms of carbonates also participate in the reactions of photosynthesis, respiration, dissolution, and precipitation of solids, as well as in the biochemical decomposition of organic compounds [
11,
12]. Bicarbonates, carbonate ions, and calcium contained in water also reduce the bioavailability of toxic metals such as Ag, Cd, Cu, Ni, Pb, and Zn by forming inorganic complexes with metals [
13]. One more and equally important parameter is water hardness, which indicates primarily the total content of Ca
2+ and Mg
2+ ions in the water but also other divalent ions Fe
2+, Mn
2+, Ba
2+, and Sr
2+ [
14]. The hardness of natural waters varies from 1 to 20 mval/L and increases with the degree of water pollution. Aquatic organisms usually prefer moderately hard water, which does not directly interfere with life processes—osmoregulation, growth, and reproduction [
15]. A unique and valuable indicator of hard and calcium-rich waters is macroalgae from the Characeae family [
16]. However, an appropriate, optimum level of water hardness and calcium content is necessary for crustaceans and other groups of invertebrates with a calcified exoskeleton. While the demand for Ca is easily met in the marine environment and hard-water lakes and rivers, calcium deficiency may be the main limiting factor for many species, including planktonic crustaceans inhabiting soft water [
15]. Water hardness and calcium can, therefore, regulate the species composition of flora and fauna and then determine the formation of inter-species relationships, energy, and biomass circulation, i.e., the functioning of the food web in the aquatic ecosystem [
17]. Zooplankton, constituting the first level of the consumer chain and the most important link in the microbial carbon cycle, supports key ecosystem processes [
18]. Additionally, the usefulness of zooplankton for assessing environmental disturbances results from its versatile bioindicative properties, including sensitive response to environmental gradients such as trophic level [
19], pollution [
20], water flow and level [
21], thermal conditions [
22], salinity [
23] and others. Previous research has shown that fluctuations in water hardness and calcium concentration significantly determine and rebuild the species and size structure of zooplankton communities [
15]. High levels of these parameters promote crustacean richness and developmental success of cladocerans of the genus Daphnia [
15,
24], and a decline in calcium resources leads to the dominance of small rotifers [
25]. Moreover, the geographically diverse geological structure of the lake catchment, which is the general natural source of calcium in the water, may locally differentiate the sizes of individuals of individual cohorts and cause their scattered distribution [
24].
Due to its taxonomic and functional diversity, various ecological strategies, phylogenetic features, and passive and spatial distribution in the environment, zooplankton is very useful in monitoring, modeling, and forecasting the state of ecosystems subject to human pressure [
22], including reclamation treatments [
26].
This paper aimed to present changes in buffering parameters, such as reaction, alkalinity, total hardness, and calcium and magnesium content, that occurred in morphometrically diverse lakes: Mielenko (LM), Klasztorne Małe (LKM), and Klasztorne Duże (LKD) as a result of their restoration using the sequential application of coagulants as an innovative approach of phosphorus inactivation method. Additionally, we aimed to check how the buffering properties of water in restored ecosystems affect zooplankton communities. We assumed that the buffering parameters of water in the studied lakes (1) do not directly determine the features of zooplankton structure; (2) determine the size of primary production and then (indirectly) the number and biomass of Rotifera; and (3) are of lesser importance for crustaceans, under conditions of strong ichthyofauna pressure.
2. Methodology
2.1. Study Area
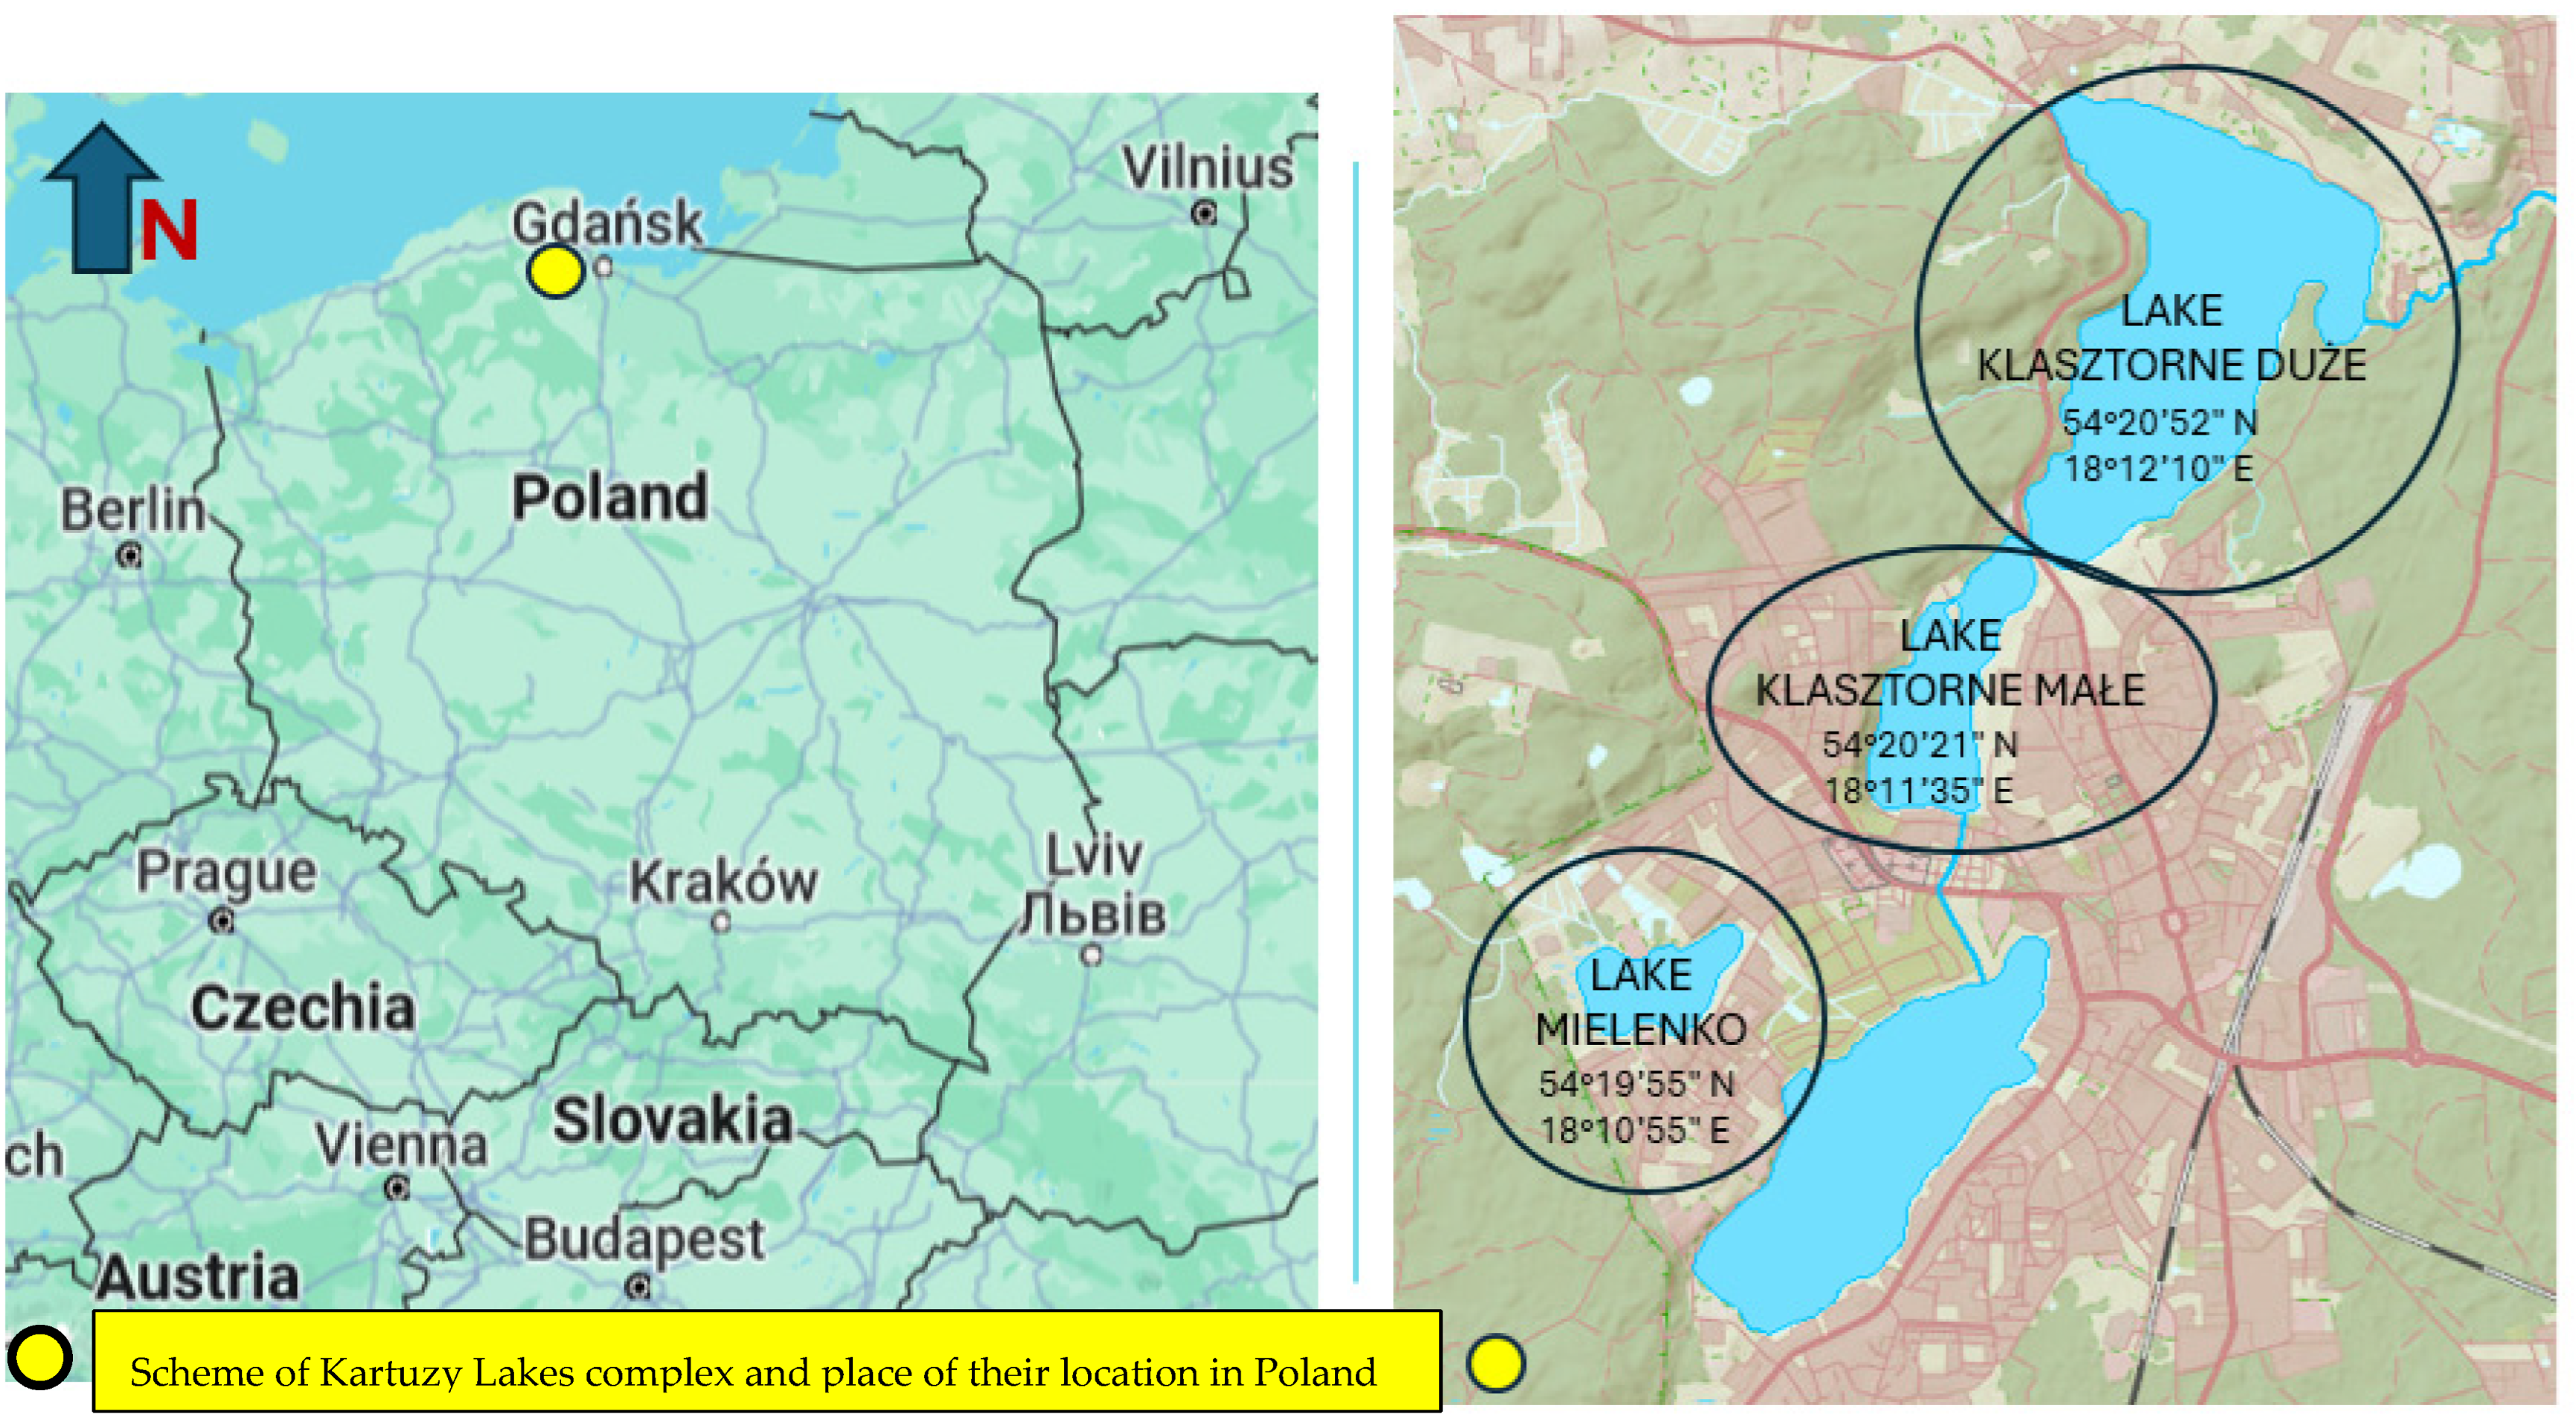
The studied lakes, LM, LKM, and LKD, are located in northern Poland, within the administrative boundaries of the city of Kartuzy in the Kashubian Lake District (
Figure 1) [
27]. Restored lakes are diverse morphometrically and in terms of water mixing dynamics [
28]. Lake Mielenko (7.8 ha; 1.9 m) is a shallow polymictic reservoir. Lake Klasztorne Małe (13.7 ha; 20.0 m) is a meromictic reservoir, and Klasztorne Duże (57.7 ha; 8.5 m) is a holomictic, dimictic reservoir with two periods of full water circulation—spring and autumn.
Detailed morphometric data of the lakes are given in
Table 1.
Because the analyzed lakes are located in the city center of Kartuzy, they were transformed into municipal and industrial sewage receivers in the mid-1950s. Municipal sewage was pre-treated in four-chamber settling tanks, which were poorly operated and, therefore, malfunctioned. The sewage contained large amounts of suspended solids and solid waste and was rich in organic matter, ammonium nitrogen, phosphates, and chlorides. In addition, industrial sewage contained, among others, petroleum substances, disinfectants, and heavy metals. Studies of the lake catchments (with an area of 12.25 km
2) carried out in 2013 showed that analyzed water bodies received excess nutrient loading, many times exceeding critical load [
29].
The degradation of the lakes was associated with the loss of landscape and recreational and economic values. It was necessary to take radical protective measures in the catchment area to limit the emission of pollutants into the lake complex. The sewage treatment plant was established in 1982, but until 2013, the lakes still received storm sewage through 23 shore outlets, of which nine discharged water without pre-treatment. The stormwater sewage network was in poor technical condition due to advanced exploitation and too low capacity. The connection of the storm sewage system with the sanitary sewage system resulted in pollutants entering the lakes via domestic sewage. The lack of retention and regulatory reservoirs caused by heavy rains and high pollutant concentrations continued to enter the lakes with the first wave of water runoff.
The protection of the Kartuzy lakes included several comprehensive activities consisting of the construction and reconstruction of the stormwater and combined sewerage networks in the city of Kartuzy, the construction of retention reservoirs for rainwater, and pre-treatment devices at existing stormwater outlets. In addition, the main pumping station for excess rainwater was modernized.
Monitoring studies conducted in the Kartuzy lakes catchment in the years 2020–2023 showed that the external nutrients load to the water bodies, especially phosphorus, as the main element responsible for the progressive eutrophication process, has significantly decreased. Next, there was a need to restore the degraded lakes. In 2018, the Department of Water Protection Engineering and Environmental Microbiology prepared a restoration project for the Kartuzy lakes along with water and legal documentation [
30].
The phosphorus inactivation method was planned to be used in all lakes, which involves reducing the availability of this element for primary producers (mainly planktonic algae and cyanobacteria) using coagulants. This happens as a result of the phosphorus compounds precipitation from the water column (immediately after the treatment) but primarily as a result of stopping the release of this element from bottom sediments in a longer time horizon and increasing their sorption capacity. The coagulant introduced into the lake settles at the bottom in the form of flocs, creating a barrier preventing the release of phosphorus from the sediments into the water. The effectiveness of the method depends on keeping the surface layer of lake sediments relatively intact. Two types of coagulants were used for the restoration of the Kartuzy lakes—iron PIX 111 and aluminum PAX 18, which were applied sequentially. The iron coagulant was applied in the coastal parts of the lakes, where good oxygen conditions prevailed all year round, while the aluminum coagulant, insensitive to low redox potential, was used in the central parts of the lakes so that it settled on the profundal lake sediments after the sedimentation process. The amounts of coagulants determined individually for each lake were divided into four equal doses to maintain ecological safety and, per the cycle of the lake year, the requirements for the protection of ichthyofauna and fisheries management (
Table 2). The doses of coagulants were selected for each lake based on laboratory experiments, taking into account the concentration of phosphorus in the lake water and the mobile fractions of phosphorus in the bottom sediment (labile phosphorus and phosphorus sensitive to redox potential changes). In the experiments, the doses of coagulants were selected in such a way as to obtain the maximum reduction of phosphorus from the water column while maintaining the pH in the range of 6–8 and the alkalinity value of water above 1.5 mval/L.
In each of the four stages, the amount of preparation used per water volume for individual lakes ranged from 15 to 39 mL/m3 of water.
The doses of preparations given above were introduced into the waters of the studied lakes on the following dates: Lake Mielenko—March and November 2020 and 2021—Lake Klasztorne Małe—March and November 2021 and 2022—Lake Klasztorne Duże—March and November 2021 and 2022.
To maintain the effects of chemical restoration, biomanipulation was carried out in parallel, consisting of appropriate control of the ichthyofauna population—cyprinids were caught, and the lakes were stocked with predatory fish (pike, zander, and asp).
During the stocking works, the fish were kept in oxygen bags, and their condition was assessed to be very good. Stocking was carried out using the “boat” method, distributing the fish in small portions of several or a dozen evenly along the littoral zone of the entire lake. During the biomanipulation, 40,000 pike fry were introduced into the water of Lake Mielenko. A total of 16,800 pike fry, 1950 asp fry, and 35,800 pike-perch fry were introduced into the water of Lake Klasztorne Małe. A total of 43,360 pike fry, 7800 asp fry, and 215,600 pike-perch fry were introduced into the water of Lake Klasztorne Duże.
2.2. Water Sample Collection and Analysis
The research of LM, LKM, and LKD was carried out monthly from January to December 2013 and from January to December 2020, 2021, 2022, and 2023. According to the guidelines used in lake monitoring research, water samples for laboratory tests were collected at the deepest point of every lake, which, according to bathymetric maps and GPS, was located as follows: LM—1.9 m, LKM—20.0 m, LKD—8.5 m. At the measuring station, water samples were collected using a 3.5 L Ruttner sampler (KC Denmark; Geomor Technik, Szczecin, Poland) into 2 L plastic bottles from 0.5 m below the surface and 0.5 m above the bottom in the case of LM (maximum depth only 1.9 m) and 1 m below the surface and 1 m above the bottom in the case of lakes Klasztorne Małe and Klasztorne Duże. At the measuring station, water pH was measured using a YSI 6600V2 multiparameter sensor (Yellow Springs, OH, USA). During this research, 480 water samples were taken for analysis.
The scope of the water analysis included alkalinity (titration method with HCl solution and methyl orange as the indicator), total hardness (titration method with EDTA—ethylenediaminetetraacetic acid C10H16N2O8 and Eriochrome Black T C20H12N3O7SNa as the indicator), Ca2+ (titration method with EDTA solution—ethylenediaminetetraacetic acid C10H16N2O8, with murexide C8H8N6O6 as the indicator), and Mg2+ (it was determined as the difference between total hardness and calcium).
Chemical analyses of water were performed under Standard Methods [
31].
The obtained results (alkalinity, total hardness, and Ca and Mg contents) were statistically analyzed (one-way ANOVA,
p = 0.05, Tukey’s HSD) using the Statistica 13.3 software package [
32]. The alternative tested hypothesis presumed the presence of significant differences in the content of selected parameters of water between the control year (2013, before restoration) and experimental years (2020, 2021, 2022, 2023—restoration treatments).
Results of total phosphorus, total nitrogen, chlorophyll a, and Secchi disc visibility are presented in the table containing annual means, standard deviation, and minimum and maximum values.
Zooplankton were sampled every four weeks from April to September in 2020, 2021, 2022, and 2023. A single sampling site was located in the deepest part of each lake. Samples of 20 L volume were collected with a 3 L sampler and were passed through a plankton net with a 30 µm mesh size, preserved in Lugol’s solution, and fixed in a 4% formalin solution. During the experiment, a total of 69 zooplankton samples were collected.
Zooplankton was identified under a Zeiss AXIO Imager microscope to the lowest possible taxonomic level (except for Copepoda juvenile stages) using the methods described by von Flössner [
33], Koste [
34], Ejsmont-Karabin et al. [
35], Rybak and Błędzki [
36], and Błędzki and Rybak [
37]. Quantitative analyses involved the determination of zooplankton abundance (ind/L) with a Sedgewick-Rafter counting chamber. Zooplankton biomass (mg/L) was determined according to the methods proposed by Bottrell et al. [
38] and Ejsmont-Karabin [
39].
Regarding zooplankton abundance and biomass, analysis of variance one-way ANOVA (p ≤ 0.05) followed by a post hoc Tukey HSD test was performed to evaluate general differences among the three lakes. The correlation between zooplankton parameters and environmental variables was calculated with Spearman’s rank-order correlation (p ≤ 0.05).
3. Results
The statistical interpretation of the obtained test results did not show any significant changes in the pH of the surface layers of water in the restored lakes (
Table 3). In all research years (before restoration, during the sequential application of coagulants), the pH of the surface water layers in LM varied from 7.11 to 8.78 pH; in LKM, it varied from 7.10 to 9.78 pH; and in LKD, it varied from 7.15 to 9.44 pH (
Figures S1–S3). Maximum values were observed in the period from May to September. Although the statistical analysis did not show significant differences in pH, it should be noted that after restoration, its maximum values were lower and did not exceed 9.50 pH, i.e., the range for eutrophic waters. In bottom waters, statistically significant differences in water pH caused by recultivation activities were recorded only in the deepest LKM. The average pH of the bottom waters of this reservoir changed from 7.35 pH to 6.89 pH (
Figure 2).
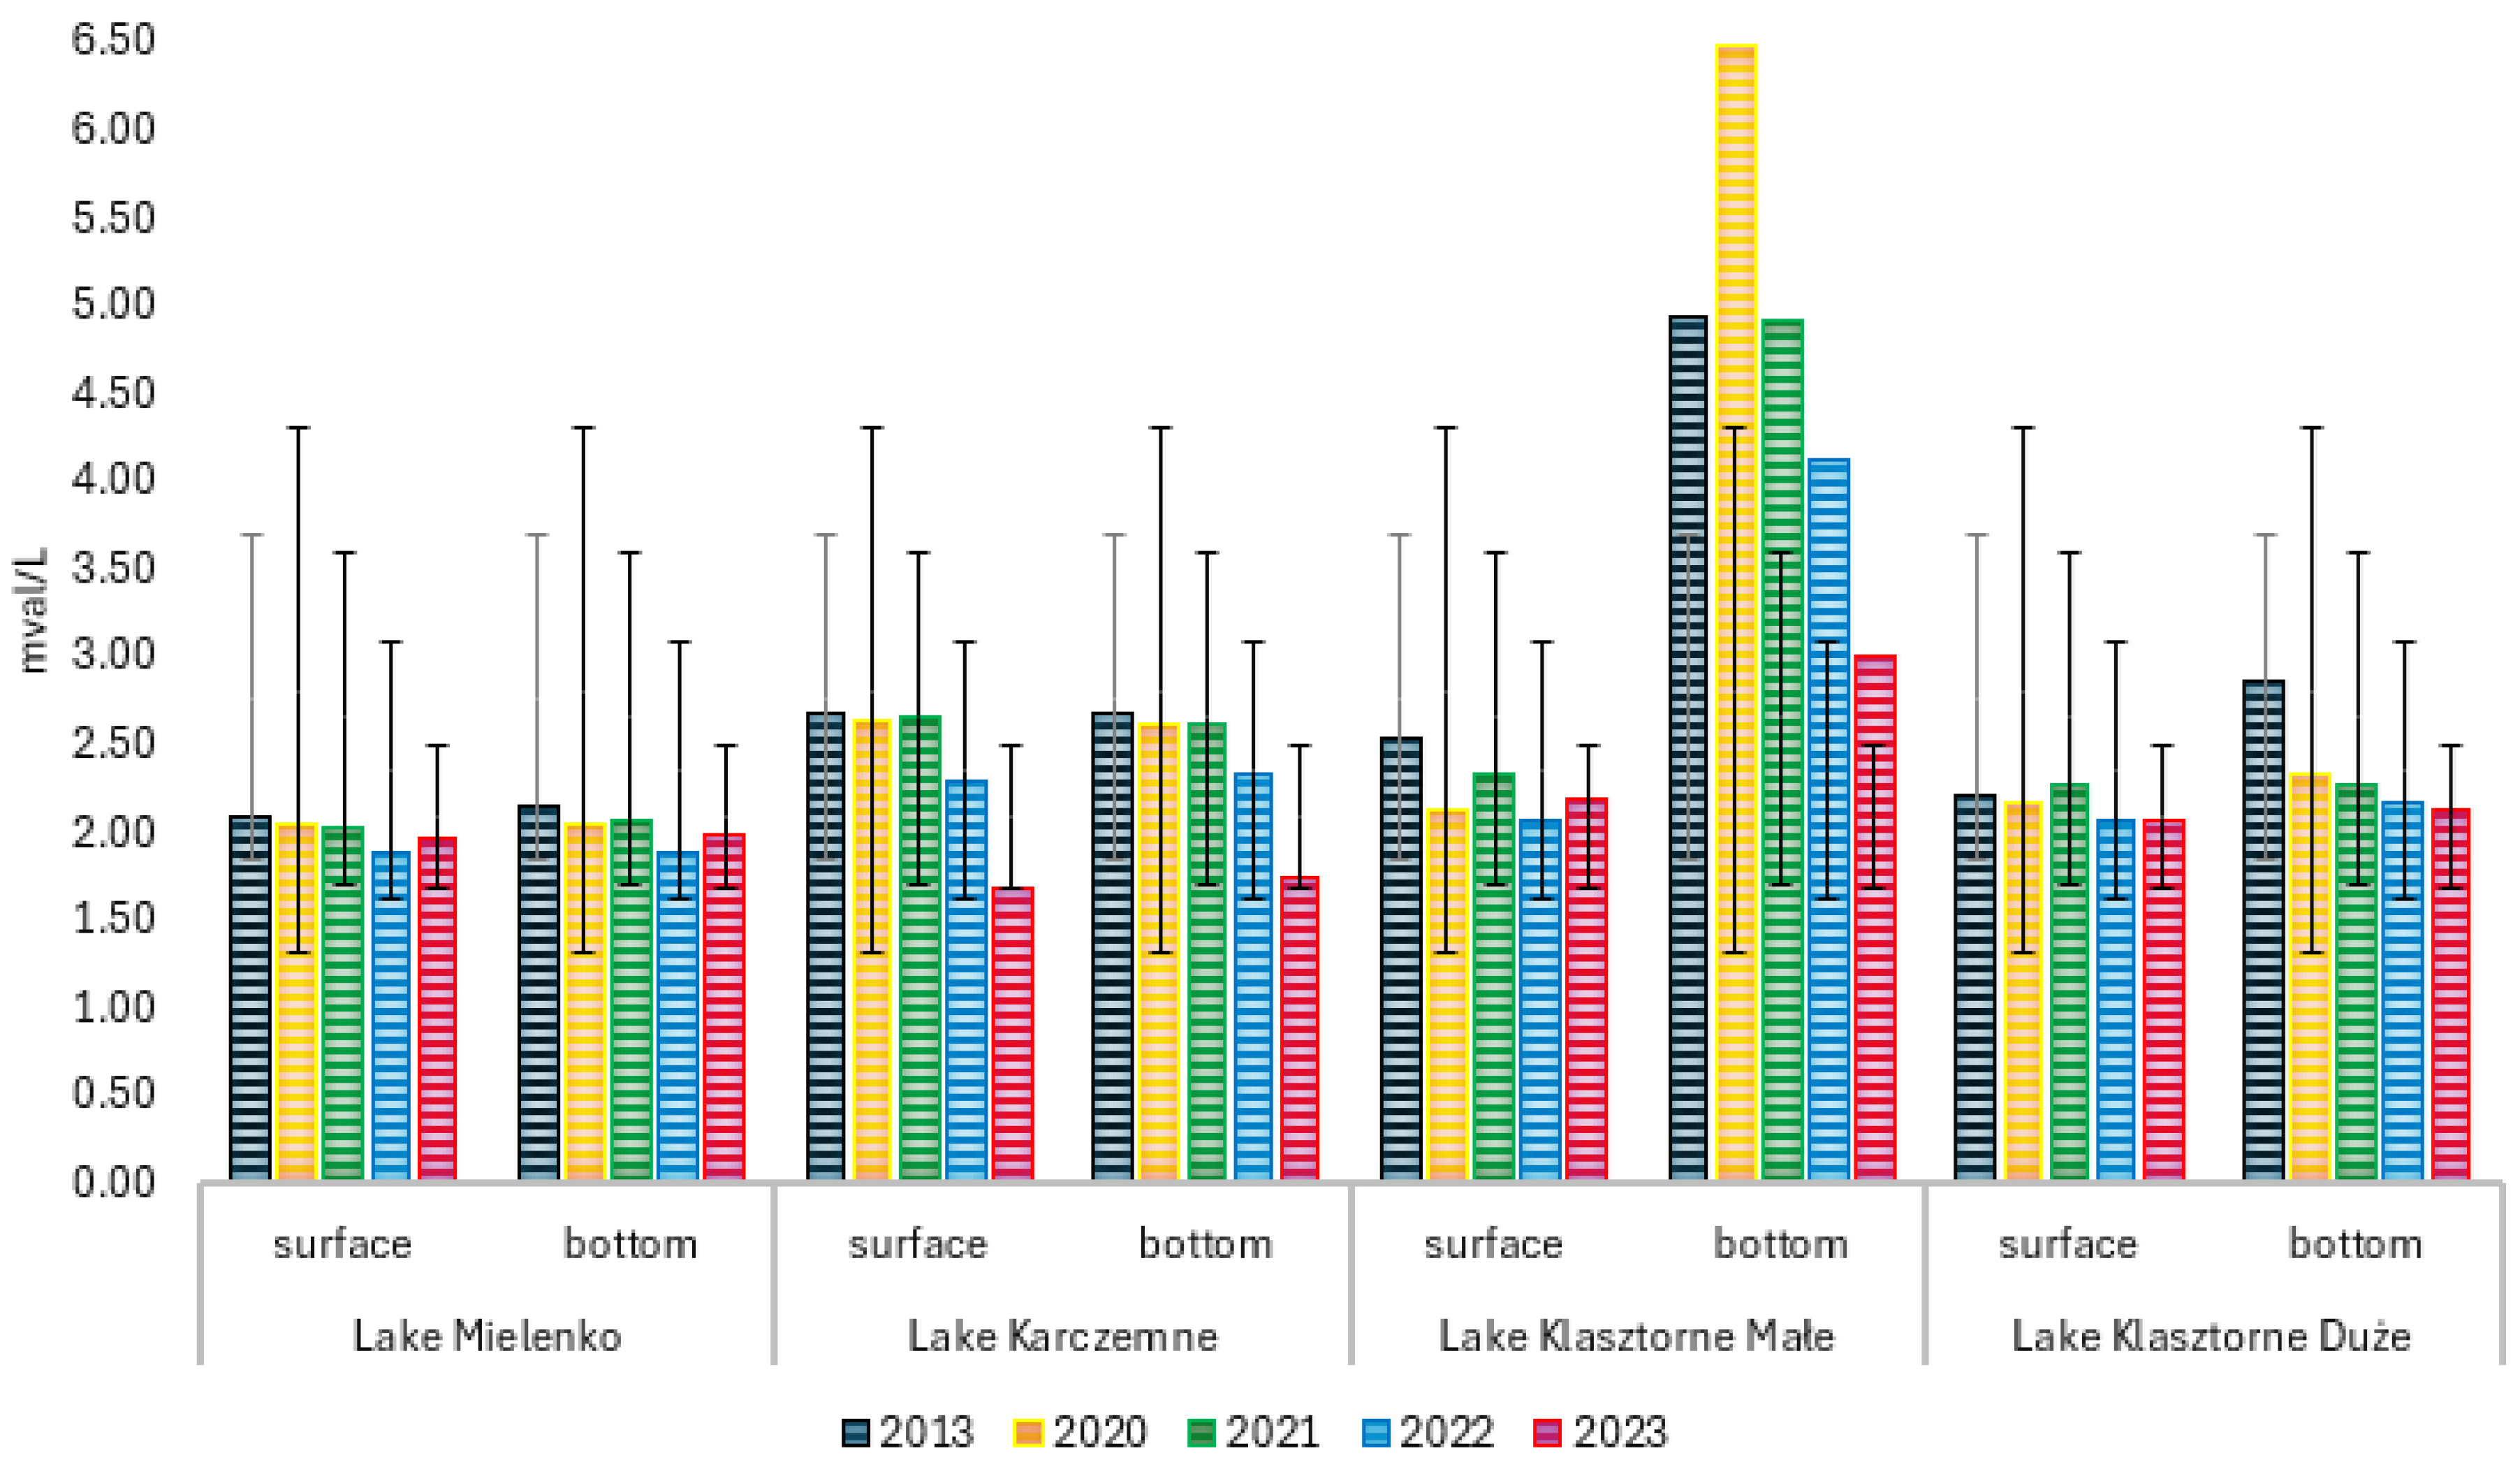
Statistical analysis of the obtained research results did not show significant differences in alkalinity values in the waters of LM (
Table 3). Before restoration (2013), the alkalinity of the water in the analyzed lake varied in the range from 2.0 to 2.3 mval/L, and its average value fluctuated around 2.10 mval/L, and after restoration activities, the alkalinity ranged from 1.3 to 2.4 mval/L, and the average value was 1.97 mval/L (
Figures S4–S6).
Statistically significant differences in water alkalinity were found in LKM. In the water of LKM, a vertical stratification of alkalinity was noted before restoration, with an increase in the value toward the bottom (
Figure S5). The average alkalinity value in the surface water layers was 2.53 mval/L, and in the bottom water layers, it was 4.92 mval/L (
Figure S5). The sequential application of PIX 111 and PAX 18 coagulants alleviated the differences in average alkalinity values between the surface and bottom water of the lake. The average alkalinity of surface water in 2023 was 2.18 mval/L, and in bottom waters, it was 2.99 mval/L (
Figure 3). In the last LKD, data analysis showed statistically significant differences in alkalinity only in the bottom water layers (
Table 3). Before restoration, the alkalinity of water in this water body increased with depth (
Figure S6). Under the influence of the applied restoration, the average alkalinity of surface waters changed from 2.21 to 2.07 mval/L, and in bottom water, from 2.86 to 2.12 mval/L (
Figure 3).
In the case of total hardness, statistical analysis of the data showed that restoration activities caused statistically significant differences in the values of this parameter only in the surface layers of the water of LKM and in the entire volume of water of LKD (
Table 3).
In the polymictic LM, no clear differences were observed in the total hardness values between the surface and the bottom (
Figure S7). The average total hardness of the water in LM before restoration was 2.58 mval/L, and after restoration, it was 2.65 mval/L (
Figure 4). In the stratified LKM and LKD, the values of total hardness increased toward the bottom (
Figures S8 and S9). Restoration of these lakes by sequential application of various types of coagulants resulted in a decrease in the average annual values of total hardness, and this also reduced the differences between surface and bottom water (
Figure 4).
Statistical analysis of the data showed highly significant statistical differences in calcium content in the studied lakes resulting from restoration activities (
Table 3).
In the period before restoration, calcium concentrations ranging from 35.7 to 47.8 mg Ca/L were recorded in the water of LM (
Figure S10). In the lakes LKM and LKD, a clear vertical stratification was found in the calcium content, with the value increasing toward the bottom. In the surface water layers of LKM in 2013, calcium ranged from 25.0 to 47.0 mg Ca/L and, at the bottom, from 42.8 to 50.0 mg Ca/L (
Figure S11). In the same period, calcium occurred at the surface of LKD in concentrations ranging from 28.6 to 41.4 mg Ca/L and, at the bottom, between 42.8 and 55.0 mg Ca/L (
Figure S12). After the implementation of restoration activities in the LM, LKM, and LKD, an increase in average calcium concentrations was observed, as well as a reduction in the differences in its content between the surface and the bottom (
Figure 5).
The analysis of data regarding changes in magnesium content in the water of the studied lakes showed statistically significant differences only in the bottom water of the deepest lake, Lake Klasztorne Małe (
Table 3).
Both before restoration and after the completion of the restoration process, magnesium concentrations in the LM and LKD generally did not exceed 15 mg Mg/L, and the average annual contents ranged from 4.4 to 7.3 mg Mg/L (
Figures S13, S15 and S16). Before restoration, in LKM, a clear vertical stratification was observed in magnesium concentrations, with an increase in values toward the bottom (
Figure S14). After the lake renewal process, the average magnesium concentrations in the bottom waters of this reservoir decreased significantly, and very large differences between the surface and the bottom were no longer recorded. Before restoration, the average amount of magnesium in the bottom waters of this lake was 15.3 mg Mg/L, and in the control year, after recultivation (2023), it was 8.0 mg Mg/L (
Figure 6).
Before restoration, in 2013, the average TP concentration throughout the entire volume of LM water was 0.20 mg P/L (±0.09), in LKM, it was 6.36 mg P/L (±3.12), and in LKD, it was 0.61 mg P/L (±0.46) (
Table 4). After restoration treatments, the average total phosphorus concentration in LM decreased to 0.09 mg P/L (±0.05), in LKM to 0.08 mg P/L (±0.05), and in LKD to 0.05 mg P/L (±0.01).
Before restoration treatments, the mean TN concentration throughout the entire volume of LM water was 2.05 mg N/L (±0.70), in LKM, it was 10.99 mg N/L (±31.48), and in LKD, it was 2.58 mg N/L (±1.22) (
Table 4). In 2023, after restoration treatments, the average total nitrogen concentration in LM decreased to 1.28 mg N/L (±0.39), in LKM to 4.17 mg N/L (±1.46), and in LKD to 1.22 mg N/L (±0.21) (
Table 4).
In 2013, the average value of Secchi disc visibility in LM was 0.55 m (±0.19), and in chlorophyll a, it was 32.8 µg/L (±16.47). In LKM, the mean SDV was 0.60 m (±0.36), and chlorophyll a was 45.02 µg/L (±16.79). In 2013, in LKD, the average value of Secchi disc visibility was 0.85 m (±0.64), and chlorophyll a was 43.14 µg/L (±25.56).
After restoration treatments, in 2023, the average value of SDV in LM was 1.62 m (±0.48), and chlorophyll a was 12.99 µg/L (±8.36). In LKM, the mean SDV was 1.32 m (±0.35), and chlorophyll a was 19.36 µg/L (±10.15). In 2023, in LKD, the average value of Secchi disc visibility was 2.28 m (±0.37), and chlorophyll a was 9.42 µg/L (±3.34).
A total of 61 zooplankton taxa were found in the examined material, including 43 Rotifera, 10 Cladocera, and eight Copepoda, as well as juvenile forms of nauplii and copepodites. The highest total number of taxa was found in LM (
n = 51), with 43 and 40 species in LKM and LKD, respectively, but the difference in mean values (
n = 16, 19, and 19, respectively) for the research season between the compared communities was not statistically significant. Importantly, the highest average abundance of Rotifera and the total average abundance of zooplankton were found in LM (3423 ind/L and 3796 ind/L, respectively), and the lowest and significantly different were observed in LKD (1055 ind/L and 1407 ind/L, respectively) (
Table 5). The studied lakes did not differ significantly in terms of total zooplankton biomass, while the average Rotifera biomass was the highest in LKM (2.27 mg/L) and significantly different from LKD (0.812 mg/L) (
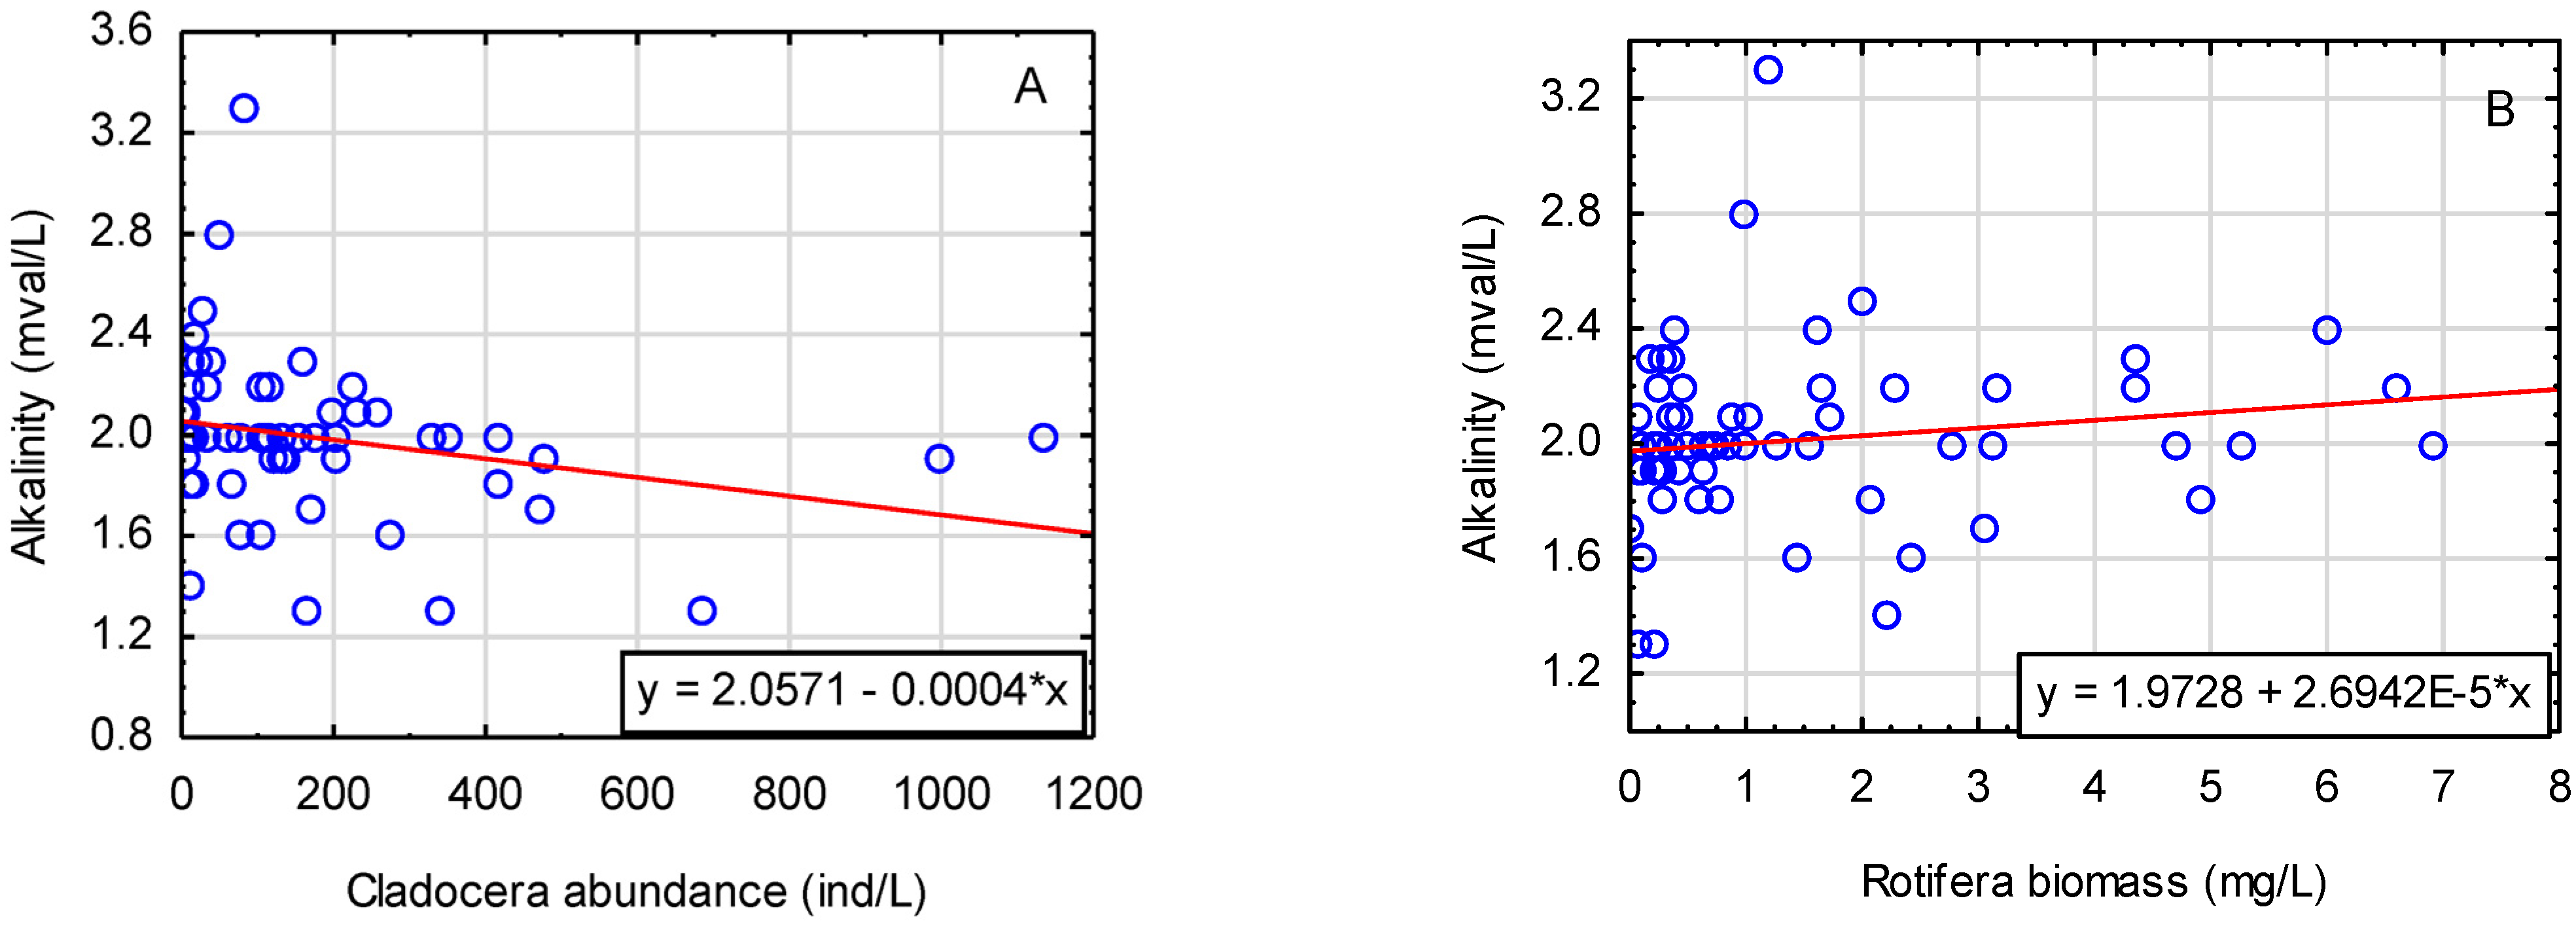
Table 5). The level of alkalinity in the surface water layer significantly differentiated LM (1.8 mval/L) from other lakes (2.12 mval/L) and correlated positively with the amount of primary production (Chl a; r = 0.494;
p < 0.05). The increase in alkalinity had a significant effect on the decrease in the number of cladocerans (r = −0.303;
p < 0.05) and on the increase in rotifer biomass (r = 0.258;
p < 0.05) (
Figure 7A,B). The increase in the concentration of calcium ions significantly influenced the decrease in the number and biomass of Cladocera (r = −0.473 and r = −0.352;
p < 0.05) and Copepoda (r = −0.393 and r = −0.288;
p < 0.05) and correlated positively with the increase in the density of Rotifera (r = 0.289;
p < 0.05) (
Figure 7C–G). Water hardness reduced the number of zooplankton species (r = −0.249;
p < 0.05) (
Figure 7H).
4. Discussion
The ongoing eutrophication and degradation of lake waters is a very serious economic and social problem on a global scale [
40,
41]. This phenomenon most often affects lakes located in industrialized and urbanized areas when they are transformed into sewage receivers [
42]. LM, LKM, and LKD, as water bodies located in the city of Kartuzy, have been degraded as a result of municipal sewage being discharged into them. The poor condition of the waters of these lakes in 2013 (before restoration) was reflected in high content of nutrients, reaching 0.49 mg P/L and 3.01 mg N/L in the shallow, polymictic LM, 20.60 mg P/L and 22.38 mg N/L in the meromictic LKM, and 1.93 mg P/L and 6.34 mg N/L in the dimictic LKD (
Table 4). Due to increased nutrient concentrations, massive development of plant plankton was recorded in the analyzed lakes, manifested by high chlorophyll value (43.78 μg/L—LM; 64.47 μg/L—LKM; 70.09 μg/L—LKD) and low water transparency (0.4 m—LM; 0.30—LKM; 0.40 m—LKD), with a simultaneous poor species composition. In LM water, the phytoplankton was dominated by cyanobacteria (
Microcystis wesenbergii,
Microcystis aeruginosa,
Aphanocapsa incerta,
Pseudoanabaena musicola,
Dolichospermum flosaque), and the largest biomass was made up of green algae (
Kirchneriella irregularis,
Chrysococcus skujae), while in LKM and LKD filamentous cyanobacteria (
Limnothrix edekei,
Planktothrix agardhii,
Planktolyngbya limnetica,
Pseudoanabaena limnetica) [
43]. Phytoplankton blooms were accompanied by high pH, reaching 9.20 pH—LM, 9.78 pH—LKM, and 9.44 pH—LKD. Similar symptoms of water degradation were noted by Dondajewska et al. [
44] in Lake Bielsko in Biały Bór. Another important indicator of the high trophy of lakes, especially LKM and LKD, was the sharp vertical stratification of buffer parameters during the growing season. Even in the shallow, polymictic LM, there was little difference in the values of buffer parameters in the water column. The values of these chemical indicators were quite high (in LM, average alkalinity—2.11 mval/L, average total hardness—2.43 mval/L, and average calcium content—39.3 mg Ca/L; in LKM, average alkalinity—3.72 mval/L, average hardness total—3.05 mval/L, and average calcium content—43.6 mg Ca/L; in LKD, average alkalinity—2.53 mval/L, average total hardness—2.52 mval/L, and average calcium content—41.4 mg Ca/L). As reported by Koschel et al. [
45] and Bodzek et al. [
46], Ca is absorbed by algae because it is an important building block of cell walls, is a component of enzymes, and participates in the processes of the taking and accumulation of other components from water. In addition, CO
2 is extracted from calcium carbonates during intensive production processes. The chemical balance between the forms of calcium carbonates present in water is shifting. Bicarbonate decomposes, and the neutral carbon sinks toward the bottom and settles on the surface of the leaves of aquatic plants, forming shells of CaCO
3. The part of calcite falls into the water of hypolimnion, where it dissolves in the presence of CO
2, changing into calcium bicarbonate, and part of CaCO
3 settles at the bottom. This process is called biological water decalcification. Alkalinity values also have a close relationship with the biological water decalcification process. The alkalinity of water is associated with the presence of calcium and magnesium carbonates and bicarbonates. Where intensive photosynthesis occurs, and CO
2 is taken from bicarbonate, the alkalinity values are reduced.
Taking into account the classification by Olszewski and Paschalski [
47] and the alkalinity values of the waters of the studied lakes in the period preceding restoration activities, the waters of these reservoirs can be classified as group II, i.e., moderately buffered. In turn, the general hardness of the water in the analyzed reservoirs, which was approximately 2.66 mval/L (133 mg CaCO
3/L) at that time, allows them to be classified as not very hard in the Dojlido division [
48].
The vertical stratification of water buffer parameters occurring during the growing season can be explained by Kusakabe et al. [
49] and Håkanson et al. [
50], who state that during photosynthesis, free carbon dioxide is depleted and the chemical balance between the forms of calcium carbonates occurring in water shifts.
The analysis of the research results obtained over the years, after protection and especially after restoration treatments, showed that these activities caused significant changes in the buffer properties of their waters, above all in the stratified LKM and LKD. Restoration of lakes using the sustainable phosphorus inactivation method consisted of removing this element from the water column by the sorption of phosphate ions on the surface of amorphous metal hydroxide flocs (depending on the coagulant used—iron or aluminum), the co-precipitation of seston containing undissolved mineral and organic phosphorus, and chemical precipitation in the form of salt (e.g., FePO
4 or AlPO
4). The phosphorus thus precipitated found its way to the bottom sediments, where it was permanently blocked [
51]. Sustainable phosphorus inactivation carried out on the LM, LKM, and LKD made it possible to achieve nutrient concentrations in the range of values typical for low-trophic lakes (
Table 4). A radical decrease in P content in the water of the analyzed lakes resulted in a limitation of production processes, although the pH in the surface water layers still exceeded 8.3 pH. Moreover, after restoration, it was noticed that the water parameters determining its buffering properties did not show a clear vertical stratification, with increasing values toward the bottom. The difference in calcium content between the period of its winter maximum and summer minimum was 5.7 in LM, 2.8 in LKM, and 3.0 in LKD, thus confirming the radical decrease in the volume of primary production caused by properly planned reclamation. The values of parameters determining the buffering properties of lake water in 2023 (total hardness ranging from 132.6 to 157.6 mg CaCO
3/L) allow their water to be classified as slightly or medium hard in the Dojlido classification [
48].
The changes obtained can be considered beneficial because water that is too hard does not support the development of aquatic organisms, and the values obtained in the LM, LKM, and LKD after restoration are optimal for the construction of plant walls, shells, and fish bones. This was confirmed by the increase in the biodiversity of littoral macrophytes noted by Grzybowski [
52]. However, in the context of zooplankton, researchers pay attention primarily to the direct, limiting impact of soft waters and low calcium concentrations [
15,
19]. It is indicated that the concentration of calcium ions > 2 mg Ca
2+/L determines the optimal water hardness for zooplankton in the range of 1.5–4 mval/L [
17]. Water hardness in the studied lakes was, on average, 2.5 mval/L, not exceeding the upper level throughout the entire study period, while the concentration of calcium cations was more than 20 times higher than the critical minimum. Therefore, these factors could not directly interfere with the processes of osmoregulation, growth, and reproduction of the most sensitive group of planktonic crustaceans—large Cladocera [
53,
54]. However, the obtained results of improving the buffering properties of water (alkalinity, Ca, TH) resulted in a decrease in the number and biomass of planktonic Crustacea, including cladocerans, which suggests a probable limiting influence of biotic factors. This is all the more so because the particularly low share of Cladocera in the density of LM zooplankton was not adequate to the high share of this group in the total biomass, which indicates appropriate habitat conditions for the development of large cladoceran species. There was no indirect, negative impact of water hardness and calcium on zooplankton, resulting in limitations in the primary production of phytoplankton [
16,
17]. Therefore, it seems to be correct to assume that an artifact in these considerations was the omission of the role of fish, which were stocked with fish in the studied ecosystems as part of biomanipulation methods. Predatory pressure on fish, which choose the largest prey based on their eyesight, can radically change the size and taxonomic structure of zooplankton [
24,
55,
56]. Therefore, the presumably indirect effect of the influence of the buffer parameters of lake water was primarily the positive response from Rotifera. This group dominated the ecosystem due to their too-small body size, as potential victims of fish predation, and also due to the lack of food and interference competition from Cladocera [
22,
57,
58,
59].
5. Conclusions
The studied lakes represent ecosystems that have been degraded as a result of municipal sewage being discharged into their waters. Such degraded lakes have developed specific conditions for the functioning of their ecosystems. Studies have shown that the long-term inflow of municipal sewage increased the values of water buffer parameters because carbonates and bicarbonates (mainly calcium and magnesium) flowed into the water along with the sewage. Lake pollution disrupted the natural circulation of carbonates, bicarbonates, and calcium in the lakes, which resulted in the formation of specific systems during the period of increased photosynthesis. In these lakes, during the growing season, a decrease in Ca and Mg concentrations was recorded in the surface layers and an increase in concentrations at the bottom. Only in LM, despite intensive photosynthesis, did the calcium content, general hardness, and alkalinity have similar values throughout the water column due to the polymictic nature of this reservoir (constant water circulation resulting from its small depth). The analysis of research results obtained over the years, after protection and especially after restoration treatments, showed that these activities caused significant changes in the buffer properties of their waters, above all in the stratified LKM and LKD. The research results also indicate the need to study changes in the buffer properties of water during sustainable restoration treatments because they play a very important role in the creation of new environmental conditions in the restored ecosystems. Positive changes in these parameters are also confirmation of the effectiveness of the selected restoration method for a given water body.
Buffer conditions of reclaimed lake waters are optimal for meeting the needs of plankton communities. When analyzing the variability of dominance and importance of the main taxonomic groups of zooplankton in relation to calcium concentration and alkalinity—controversial in relation to previous studies—the influence of biotic factors (phytoplankton and fish) should be taken into account, which will be discussed in subsequent publications.
Improving environmental conditions in the lake after sustainable restoration promotes an increase in biodiversity. If good water quality is maintained, the positive effects should be permanent. Biological indicators always react with a certain delay to changes caused by reclamation, which is why it is necessary to monitor changes over a longer period of time.


