Article

Optimizing Nitrogen Fertilization for Enhanced Rice Straw Degradation and Oilseed Rape Yield in Challenging Winter Conditions: Insights from Southwest China

1
College of Life Science and Engineering, Southwest University of Science and Technology, Mianyang 621010, China
2
College of Natural Resources and Environment, South China Agricultural University, Guangzhou 510642, China
3
Shenzhen Institute of Guangdong Ocean University, Binhai 2nd Road, Shenzhen 518120, China
*
Author to whom correspondence should be addressed.
These authors contributed equally to this work and should be considered co-first authors.
Sustainability 2024, 16(13), 5580; https://doi.org/10.3390/su16135580
Submission received: 3 June 2024 / Revised: 22 June 2024 / Accepted: 26 June 2024 / Published: 29 June 2024

Abstract

:
The crop straw returning to the field is a widely accepted method to utilize and remediate huge agricultural waste in a short period. However, the low temperatures and dry conditions of the winter season in Southwest China can be challenging for the biodegradation of crop straw in the field. With a similar aim, we designed a short-term study where rice straw was applied to the field with different concentrations of nitrogen (N) fertilizer while keeping phosphorus (P) constant; CK, (N0P0); T1, (N0P90); T2, (N60P90); T3, (N120P90); and T4, (N180P90) were added to evaluate its impact on straw degradation during cold weather. We found that high fertilization (T4) significantly improved crop yield, organic matter, and lignocellulose degradation under cold temperatures (21.5–3.2 °C). It also significantly improved soil nitrogen agronomic efficiency, nitrogen use efficiency, and nitrogen physiological efficiency. The yield was highest in T4 (1690 and 1399 kg/ha), while T3 acted positively on soil lignocellulolytic enzyme activity, which in turn resulted in higher degradation of OM and lignocellulosic material. Pearson’s correlation analysis revealed that total nitrogen, total phosphorus, available nitrogen, and available phosphorus were important variables that had a significant impact on soil EC, bulk density, water holding capacity, and soil enzymes. We found that nitrogen application significantly changed the soil bacterial community by increasing the richness and evenness of lignocellulolytic bacteria, which aided the degradation of straw in a short duration. This study’s finding indicates that the decomposition of crop straw in the field under cold weather stress was dependent on nutrient input, and N, in an appropriate amount (N120-180), was suitable to achieve higher yield and higher decomposition of straw in such an environment.

1. Introduction

As the global population continues to grow, the demand for food is also increasing, which is causing unprecedented pressure on agricultural systems worldwide [1]. Amidst this growing demand, the sustainable management of agricultural residues emerges as a critical concern with far-reaching implications for both environmental and human well-being [2]. China is a major agricultural country that produces different types of crop straw, amounting to approximately 797 million tons in 2020 and 802 million tons in 2021 (National Bureau of Statistics data, http://www.stats.gov.cn/, accessed on 2 June 2024) [3]. It has been highly advocated for straw resource utilization in China due to the prohibition on the burning of straw [4]. Therefore, crop straw should be seriously considered as a resource to make full use of agricultural residues and protect the environment. In this scenario, a huge effort has been made to return crop straw to the field, and about 32% of the straw was estimated to have been returned to the soil in 2010. This percentage has progressively increased in the following years [5]. Among various cereal crops, rice produces a significant amount of straw and contains a highly reluctant lignocellulose structure [6]. The reluctant rice straw has many uses, such as the cultivation of mushrooms [7], production of bioethanol [8], biogas [9], biofertilizer [10], and returning to the field as a conditioner [11]. Rice straw returning to the field is regarded as a very effective option to avoid straw burning during harvest seasons and has been widely implemented in China [12]. It not only utilizes agricultural waste but also improves soil quality [13]. The Southwest of China mostly adopted the rice-oilseed rape rotation system, where oilseed rape straw has many uses, while rice straw being huge in amount, has low usage, and its presence is causing more serious environmental problems. In such a rotation system, the rice straw is returned to the oilseed rape field, while a small proportion of oilseed rape straw is returned to the rice paddy field. The oilseed rape is a winter crop and is mostly grown from October to May, which is the peak dry season (42–2 mm rainfall per month) (Figure S1). The average winter temperature ranges from (27.3–3.2 °C) season in most of Southwest China (Figure S2). On the other hand, there are many successful reports regarding the degradation of crop straw in moist and warm temperatures, which are most suitable for microbial activity. However, returning rice straw during the winter season is challenging because cold weather and a dry environment can result in decreased microbial activity [14] and low degradation of straw in that season [15]. The cold environmental stress can result in a severe impact on plant health and overall yield as well [16]. In such situations, many agronomists rely on nutrient input, which can elevate many environmental stresses in field crops [17,18,19]. Among various nutrients, nitrogen (N) plays an important role in plants [20] and plant-associated microbes [21]. The previous studies reported that N application significantly improved plant tolerance to drought, temperature, salinity, and heavy metals stress [22,23,24,25]. Liu et al.’s study also showed that the highest (54%) straw degradation was reported in moderately N (130 kg hm−2) fertilized treatments in cool zone rice crop systems [26]. Similarly, previous studies also reported that N application significantly improved soil microbial diversity and composition [27], which means N application rates can also have a significant impact on soil straw lignocellulose degradation. However, no study until now comprehensively explained rice straw degradation in cold environments and the impact of nitrogen application in such events.
That is why we hypothesized that nitrogen fertilization significantly enhances straw decomposition and alters microbial community function in cold environments. Specifically, we believe that enhanced microbial enzyme activity, along with quicker organic matter breakdown caused by the increased availability of nitrogen, might improve soil health and crop efficiency. For the assessment of our hypothesis, we designed a short-term straw-returning study, in which 3 t/ha rice straw was returned to the oilseed rape field, and different N fertilizer concentrations (N0-N180) were added in the field to evaluate their impact on straw degradation, oilseed rape yield, and microbial diversity and composition during the cold season.

2. Materials and Methods

2.1. Experimental Design and Location

The field experiment was conducted under real agricultural conditions at the experimental area of Southwest University of Science and Technology (SWUST) located in Mianyang, Sichuan Province, China (31.55 °N, 104.68 °E). This region experiences a subtropical monsoon climate characterized by an annual temperature range of 16–19.2 °C, a frost-free period lasting 253–301 days, annual precipitation ranging from 750–1500 mm, and an annual sunlight duration of 1300–1328 h. The soil type in this area is classified as clay, and the predominant cropping system involves a long-term annual rotation of oilseed rape and rice, typical for the region. Initial soil total nitrogen, total phosphorus, and total potassium levels ranged from 0.11–0.31 g/kg, 0.16–0.22 g/kg, and 0.98–1.16 g/kg, respectively.
The experiment was a split-plot design of a randomized integral field, with rice straw returning at a rate of 3 t/ha. The field experiment included 2 cultivars (Mianyou 305 and Mianyou 15) × 5 different fertilizer doses (CK-T4) × 3 replications = 30 plots. Each plot was separated by a cement ridge measuring 5 cm in height and 30 cm in thickness to prevent fertilizer runoff. The details of the experimental plots were as follows: CK: Control plot with straw returning but no fertilizer input, T1: Plot with nitrogen (N) fertilization at a rate of 0 kg/ha and constant phosphorus (P) fertilization at a rate of 90 kg/ha, T2: Plot with N fertilization at a rate of 60 kg/ha and constant P fertilization at a rate of 90 kg/ha, T3: Plot with N fertilization at a rate of 120 kg/ha and constant P fertilization at a rate of 90 kg/ha, T4: Plot with N fertilization at a rate of 180 kg/ha and constant P fertilization at a rate of 90 kg/ha.

2.2. Soil Sampling and Measurements

The experimental field was prepared by deep plowing to remove stones and plant debris. Rice straw, cut into 1 cm pieces, was evenly distributed across the field. Soil fertilization was applied according to the designated treatments, and oilseed rape varieties were sown in late August to mid-September 2022, which were further harvested from March to April 2023. After the oilseed rape harvest, soil samples were collected from each treatment at a depth of 0–30 cm, and five random sites within each field were chosen for sampling (Figure S3). Stones and debris larger than 1 cm were removed from the collected samples, and the samples from all five sites were mixed to create composite samples. The collected soil samples were divided into two portions: One portion was dried at 60 °C until a constant weight was achieved (typically for 2 days). This portion was used for the determination of physicochemical parameters, enzyme activity, and lignocellulosic material. The other portion was cape-sealed and stored at −20 °C for subsequent bacterial diversity and composition analysis.

2.3. Nitrogen Using Efficiency

Nitrogen use efficiency parameters were calculated based on grain yield and N accumulation in plots treated at different N rates. The following parameters were calculated using the formulas provided by Yang et al. [28]:
Nitrogen   Agronomic   Efficiency   ( NAE )   ( kg   Nkg 1 ) = G Y N   a p p l i e d G Y N 0 F A  
Nitrogen - Use   Efficiency   ( NUE )   ( % ) = T N + N   a p p l i e d T N N 0 F A
Nitrogen   Physiological   Use   Efficiency   ( NPE )   ( kg   Nkg 1 ) = G Y N   a p p l i e d G Y N 0 T N N   a p p l i e d T N N 0
where GYN applied is the grain yield of the plots that received N and P fertilizer, GYN0 is the grain yield in the N0, FA is the amount of N fertilizer applied in different plots, TNN applied is the total N accumulation in the plots that received N, and TNN0 is the total N in the N0 plot at maturity.

2.4. Determination of Physiochemical Properties

The soil pH and electrical conductivity (EC) were determined using a soil and deionized water mixture at a ratio of 1:10 (m/v) at 25 °C. The mixture was shaken at 200 rpm for 40 min, and the supernatant was collected for pH and EC measurement using a digital pH and EC meter [29]. Soil bulk density (BD) and porosity (SP) were estimated according to Vereecken et al. [30], and soil water holding capacity (WHC) was determined following Mahe et al. [31]. Total nitrogen was determined by the Kjeldahl method [32]; nitrate nitrogen (NO3-N) was determined according to the method described by Norman and Stucki [33]; ammonium (NH3-N) was measured according to Robertson et al. [34], total phosphorus was determined by the acid-soluble molybdenum antimony anticolorimetric method [35], and available phosphorus was determined following Olsen’s sodium bicarbonate method [36].

2.5. Soil Enzyme Activity

This study primarily focused on rice straw degradation in the cold season, which is why we tested lignocellulolytic enzymes (carboxymethyl cellulase (CMCase), amylase, and xylanase activity). The enzyme activity was determined using 2% carboxymethyl cellulose salt, 2% Birchwood xylan, and 2% starch, respectively. The reaction mixture was incubated at 50 °C for 30 min, and the yield of glucose, xylose, and amylose product was quantified at the wavelength of 540 nm using the dinitrosalicylic acid (DNS) assay. One unit of enzyme activity equals the quantity of enzyme required to produce one μmol of reducing sugars from the corresponding substrate per minute under the tested conditions. The laccase activity was estimated using guaiacol oxidation following Kumar et al. [37], while alkaline phosphatase activity was estimated using p-nitrophenyl phosphate as substrate at 400 nm wavelength. The alkaline phosphatase activity was presented as µM p-nitrophenol released per gram of soil per hour [38].

2.6. Soil Organic Matter and Lignocellulose Content

The organic matter (%) was quantified through the loss-on-ignition method by following Wu et al. [39]. This method involves preparing the sample, extracting organic matter, and quantifying it through techniques such as gravimetric analysis or spectroscopy. The content of lignocellulose in each treatment was estimated. For that, hemicellulose in soil was determined by separate determination of neutral detergent fibers (NDF) and acid detergent fibers (ADF) [40]. Lignin was determined as Klason lignin using 72% (v/v) sulfuric acid [41], while cellulose content was measured at 620 nm using anthrone reagent [42].

2.7. Bacterial Diversity and Composition Analysis

Bacterial diversity and community changes in all microcosms were analyzed by extracting total DNA using E.Z.N.A.® soil DNA Kit (Omega Bio-tek, Norcross, GA, USA). The DNA was extracted according to the manufacturer’s guide, and all samples were quantified by NanoDrop 2000 spectrophotometers (Thermo Fisher Scientific, Wilmington, DE, USA). Bacterial 16S rRNA gene fragments (V3-V4) were amplified from the extracted DNA using primers 338F (5′-ACTCCTACGGGAGGCAGCAG-3′) and 806R (5′-GGACTACHVGGGTWTCTAAT-3′) [43]. PCRs were performed (total reaction volume, 20 μL) using 4 μL 5 × TransStart FastPfu buffer, 2 μL 2.5 mM (dNTPs), 0.8 μL (5 μM) of each primer, 0.4 μL TransStart FastPfu DNA Polymerase, 10 ng of extracted DNA, and finally 2.8 μL ddH2O was added to make volume 20 μL. Amplification of genomic DNA was done in triplicate using a thermocycling following [44]. Agarose gel electrophoresis was performed to verify the size of the amplicons. Amplicons were subjected to paired-end sequencing on the Illumina MiSeq sequencing platform using PE300 chemical at Majorbio Bio-Pharm Technology Co., Ltd. (Shanghai, China). Raw data were reassembled and processed as described in a previous study by Hu et al. [45].

2.8. Statistical Analysis

One-way ANOVA, followed by Tukey HSD tests, was performed to evaluate significance at p < 0.05 using SPSS (Version 20, Chicago, IL, USA). Origin 19.0 and Excel 2019 were used for data visualization through graphs. Each treatment value is expressed as the mean ± standard deviation (SD) of 3 biological replicates. Principal Components Analyses (PCA) (based on Euclidean distance of the range-normalized values) were used to assess potential differences between treatments, and they were plotted with the “FactoMineR” R package in R version 4.0.3 [46]. Pearson‘s correlation coefficients were calculated using the Corstars function and Hmisc R package, with significant correlations (p < 0.05).

3. Results

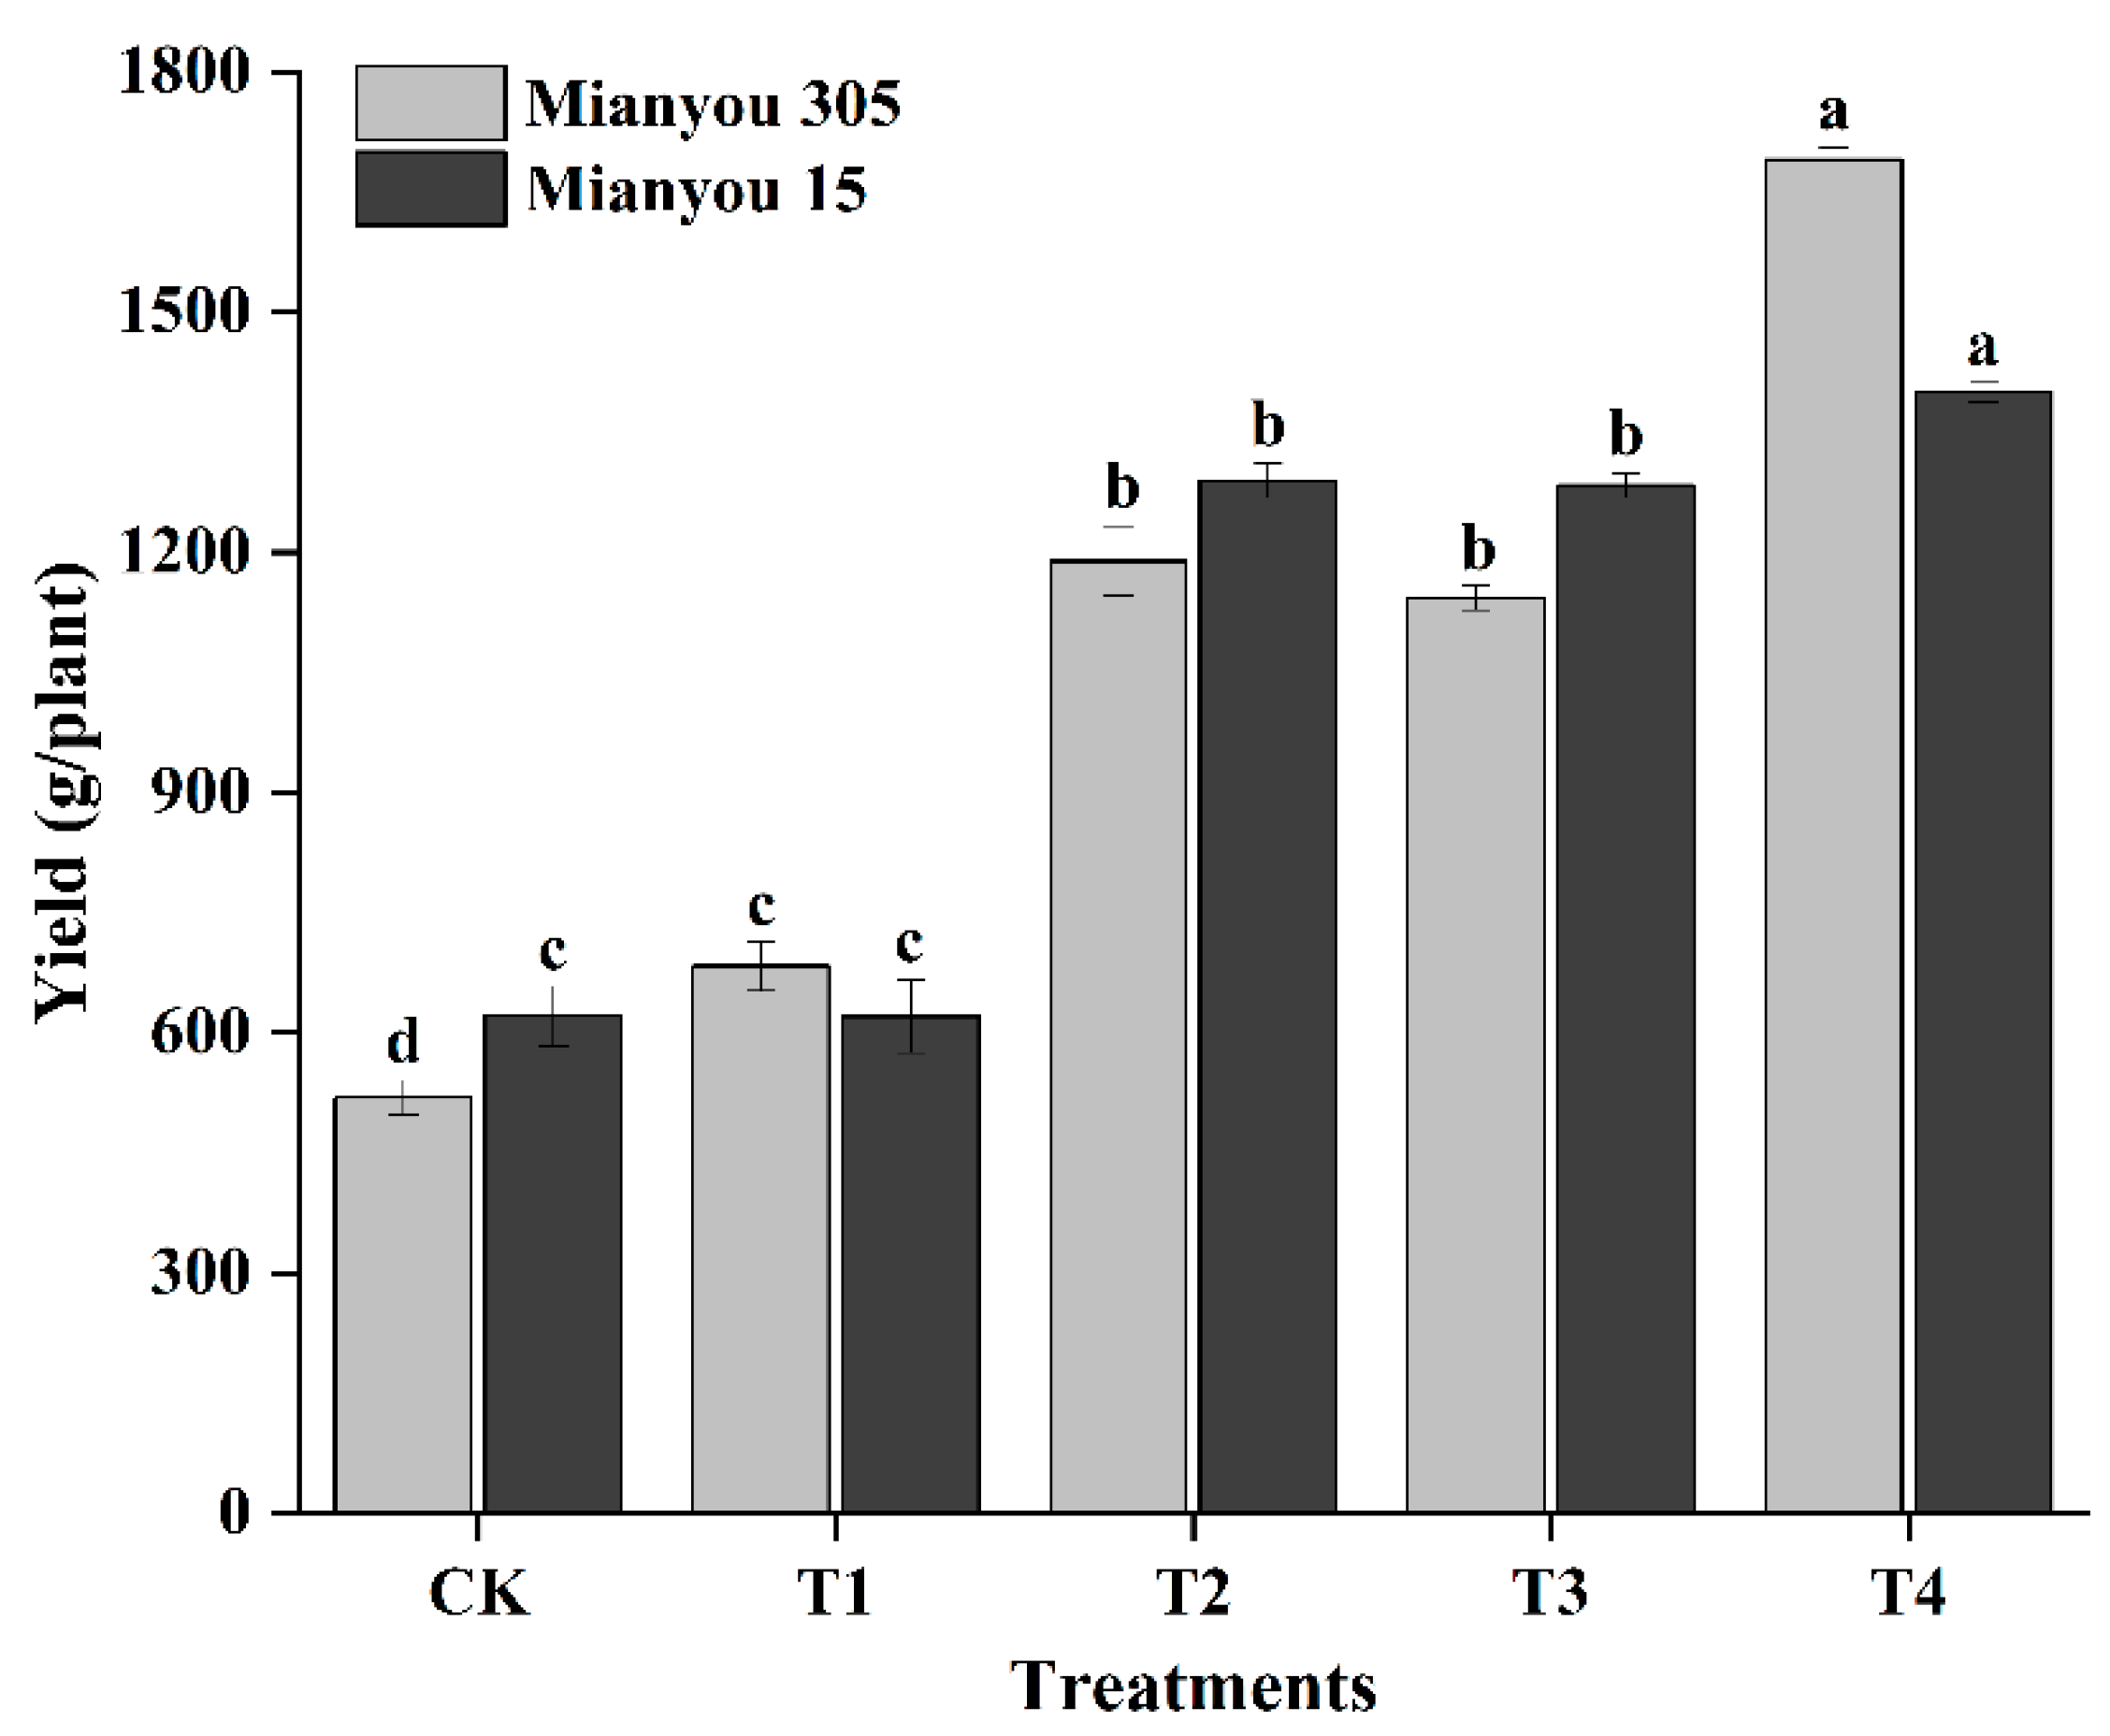
3.1. Yield and Yield Parameters

In this study, two widely used oilseed rape cultivars in Sichuan Province (Mianyou 305 and Mianyou 15) were grown in an experimental field in order to check the impact of chemical fertilization alongside the practice of returning straw on yield and soil properties. The oilseed rape cultivar Mianyou 305 showed significantly (p < 0.05) the highest yield in T4 (1690 kg/ha), followed by T2 (1189 kg/ha) and T3 (1143 kg/ha), respectively. Apart from this, a significantly low yield was found in T1 (683 kg/ha) and CK (519 kg/ha), respectively. The yield of the Mianyou 305 cultivar in moderately fertilized treatment (T4) was 32% higher than the highly fertilized T3 treatment, respectively (Figure 1). Similar results were found in Mianyou 15, which showed a significantly high yield in T4 (1399 kg/ha) followed by T2 (1289 kg/ha) and T3 (1283 kg/ha), respectively. In this study, a significantly low yield of Mianyou 15 was found in CK (620 kg/ha) and T1 (619 kg/ha), respectively (Figure 1).
The other yield parameters were divided into two parts first part was the main branch, and the second part was the primary and secondary branches. In the case of Mianyou 305, the number of grains in T4 (2502 and 7047) was significantly (p < 0.05) higher than the number of grains in both CK (1567 and 2299) and T1 (1647 and 2349), respectively. Furthermore, the number of Mianyou 305 pods exhibited the same pattern, with the highest count recorded at T4 (91 and 384) followed by T3 (78 and 185), T2 (78 and 168), and T1 (68 and 109), respectively. In this study, Mianyou 305 showed a significantly low number of pods in CK (64 and 81) compared to other treatments. The 1000-grain weight of Mianyou 305 was highest in T4 (3.62 and 6.56), followed by T3 (3.56 and 5.46), T2 (3.49 and 4.42), and T1 (3.42 and 4.28) compared to CK (3.05 and 3.85). Furthermore, the number of branches of Mianyou 305 was highest in T4 (14), followed by T3 (8) and T2 (7), while no significant difference was found between CK and T1, respectively (Table 1).
In the case of Mianyou 15, the number of grains was significantly (p < 0.05) high in T4 (2026 and 4827), while a low number of grains were found in CK (1431 and 1119). Apart from these, the number of pods of Mianyou 15 also followed similar trend (as were found in Mianyou 305), which were highest in T4 (101 and 267), followed by T3 (86 and 203), T2 (87 and 159), and T1 (80 and 120), respectively, while a significantly (p < 0.05) low number of pods were found in CK (62 and 67) compared to other treatments. The 1000-grain weight of Mianyou 15 was highest in T4 (4.89 and 6.87), followed by T3 (4.07 and 4.21) and T2 (3.74 and 4.13), while no significant difference was found between CK and T1. Furthermore, the number of branches of Mianyou 15 was highest in T4 (8), followed by T3 (6), while a low significant difference was found in T1 (4) and CK (3), respectively (Table 1).

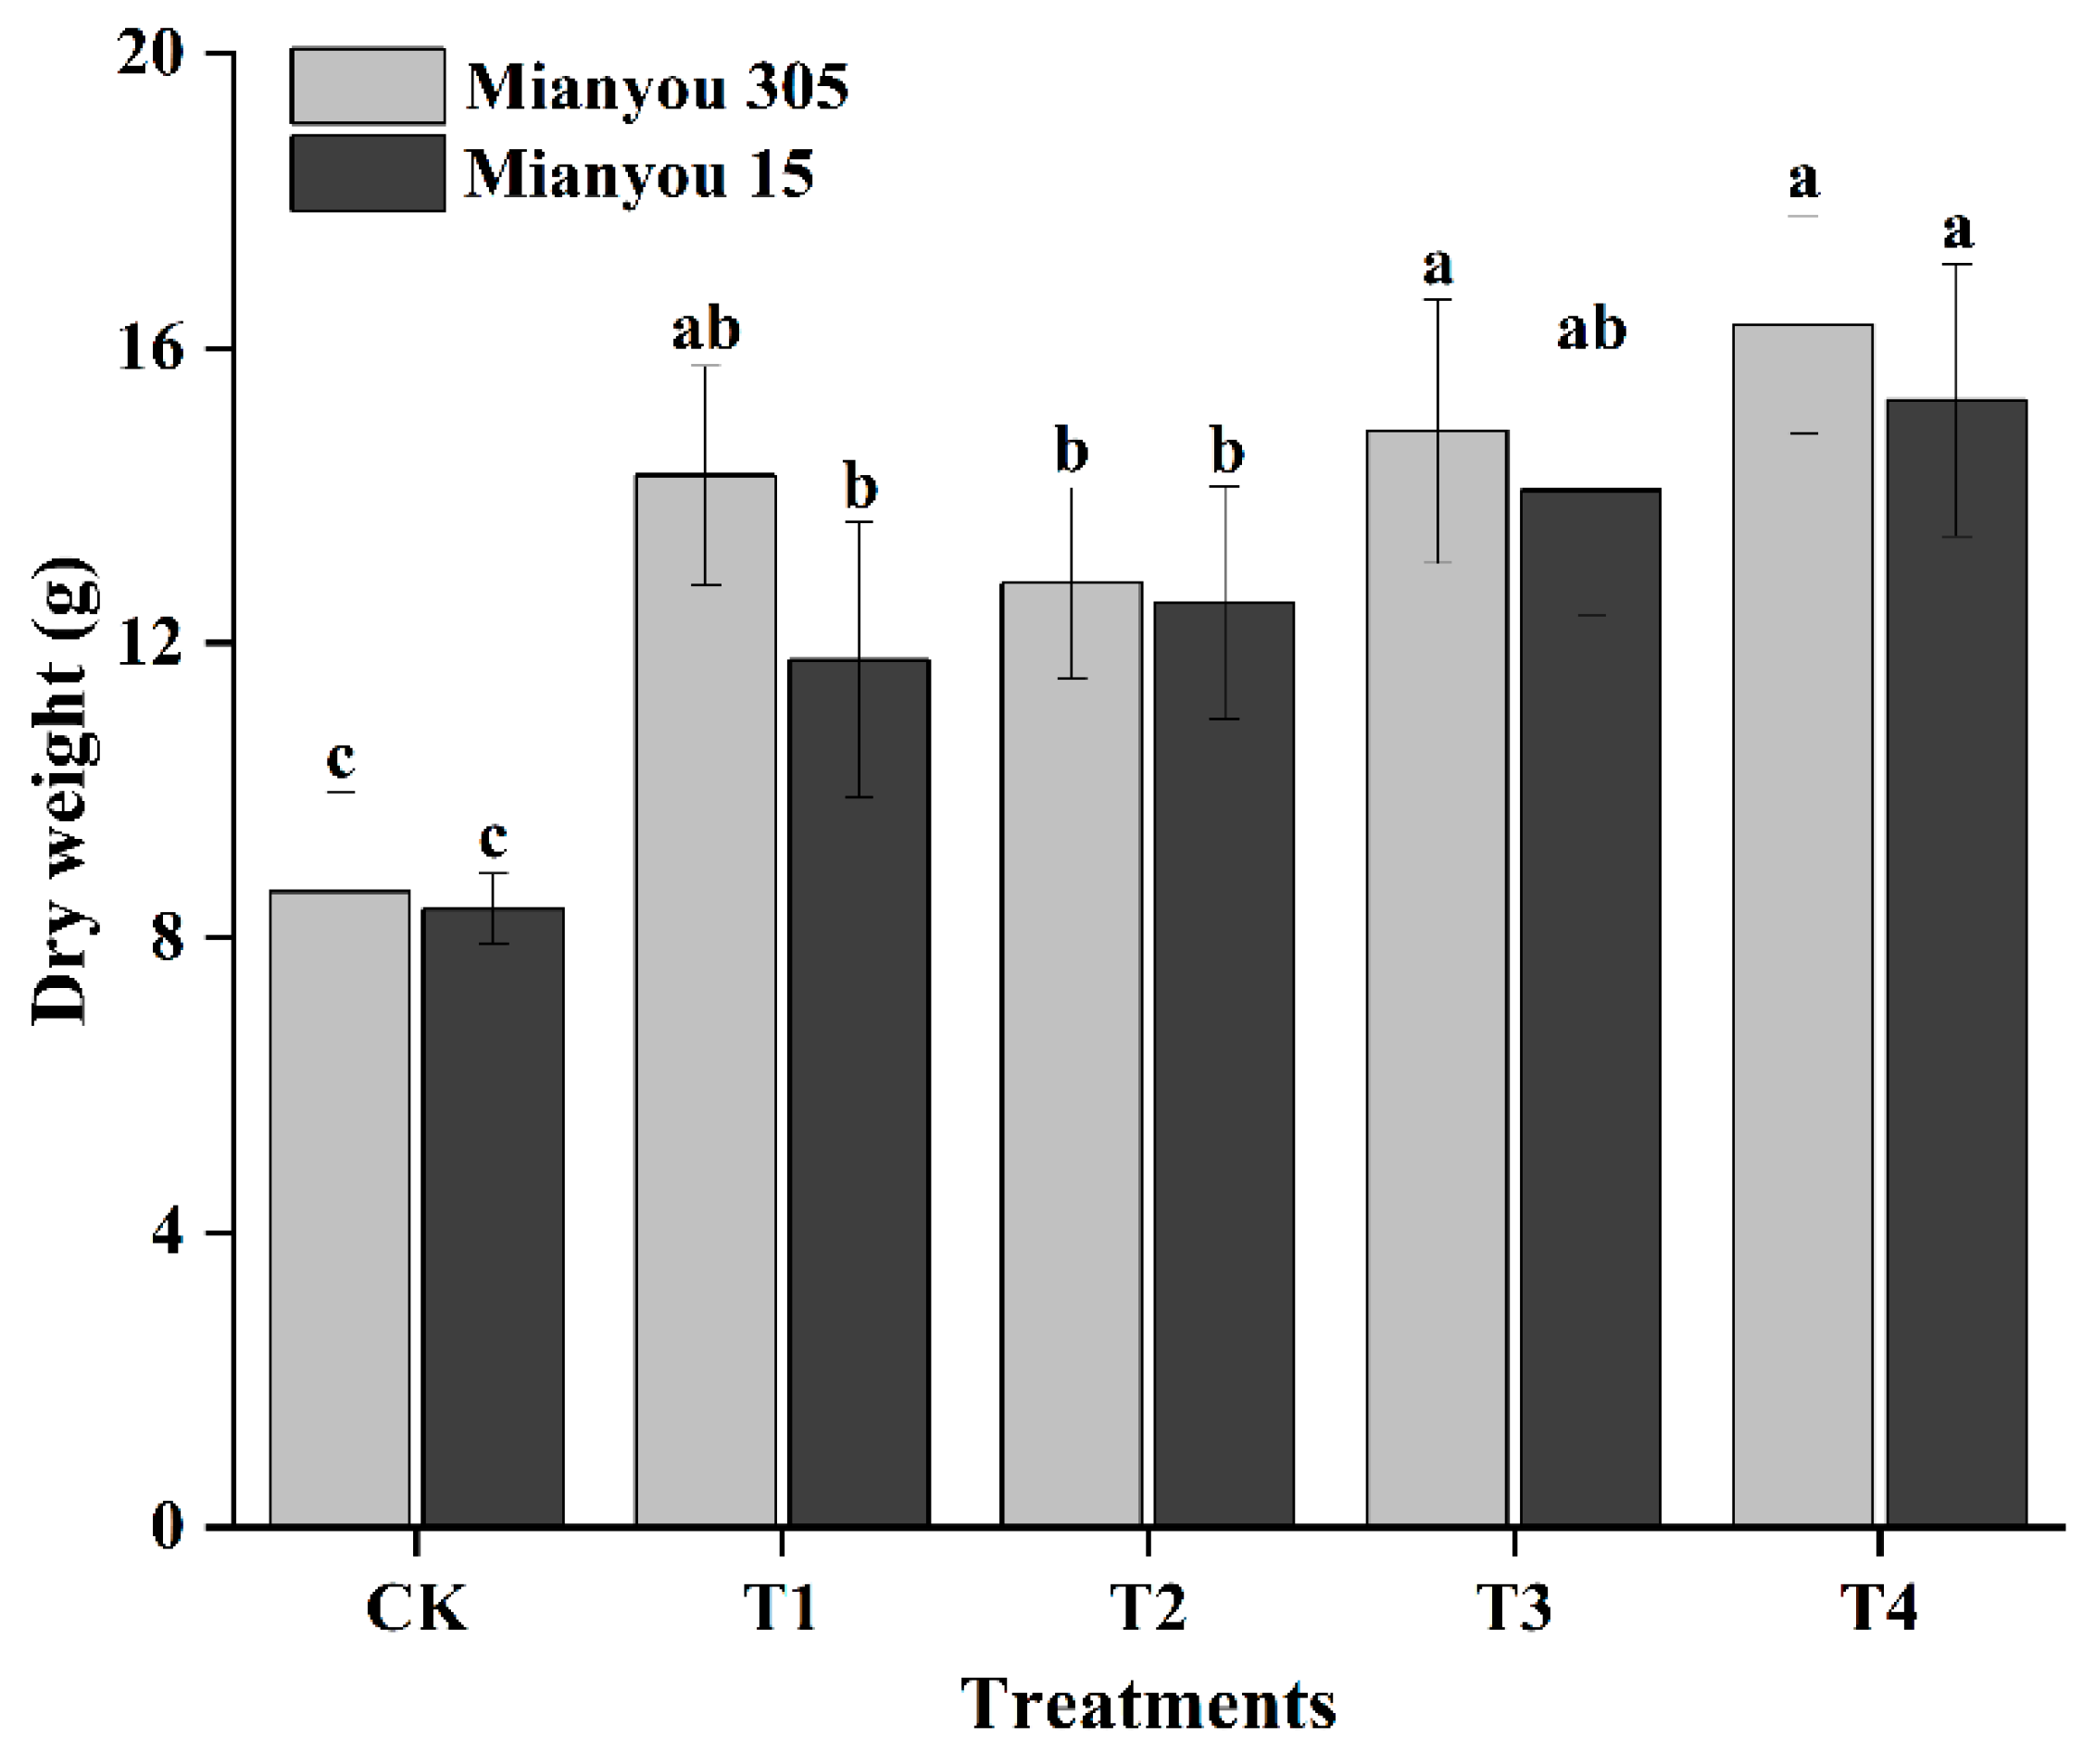
3.2. Plant Dry Weight

The oilseed rape cultivar Mianyou 305 showed significantly (p < 0.05) high dry weight in T4 (16.32 g), followed by T3 (14.87 g), T1 (14.27 g), and T2 (12.81 g), while low dry weight was found in CK (8.62 g), respectively (Figure 2). Similar results were found in Mianyou 15, where significantly (p < 0.05) high dry weight was found in T4 (15.30 g) followed by T3 (14.07 g), T2 (12.55 g) and T1 (11.76 g), respectively. Similar to Mianyou 305, a significantly (p < 0.05) low dry weight of Mianyou 15 was also found in CK (8.39 g), respectively (Figure 2).

3.3. Nitrogen Use Efficiency

We determined nitrogen agronomic efficiency (NAE), nitrogen-use efficiency (NUE), and nitrogen physiological efficiency (NPE) of oilseed rape cultivars Mianyou 305 and Mianyou 15. The mean NAE, NUE, and NPE values were significantly (p < 0.05) higher in Mianyou 15 compared to Mianyou 305, and each variety showed a similar trend of NAE, NUE, and NPE within treatments in Table 2. In detail, the NAE value was significantly (p < 0.05) high in T2 (8.43 and 11.16), while significantly (p < 0.05) low NAE values were found in T4 (2.56 and 3.69) of both oilseed rape varieties. Unlike NAE, we found significantly high NUE values in T4 (42.24 and 38.24), while significantly low NUE values were found in T2 (25.50 and 19.83) of both oilseed rape varieties, respectively. The NPE values in this study followed the NAE trend, which was high in T2 (33.04 and 56.23), and significantly (p < 0.05) low values were found in T4 (18.14 and 28.91) of both varieties, respectively (Table 2).

3.4. Soil Physiochemical Properties

In our findings, we examined the soil physiochemical properties to understand the effects of straw returning and degradation on soil physical and chemical characteristics. Soil pH was assessed, revealing a slightly alkaline pH across all soil types (p < 0.05). Specifically, CK and T4 exhibited significantly higher pH values (7.79 and 7.59, respectively), while T1 and T3 demonstrated significantly lower pH values (7.30 and 7.38, respectively) (p < 0.05). Conversely, EC values were lowest in CK (0.07 dS/m), with significantly higher values observed in T4 (0.18 dS/m) and moderate values in T2 (0.13 dS/m), T1 (0.14 dS/m), and T3 (0.16 dS/m). Soil water-holding capacity (WHC) was notably higher in T4 (34.85%), followed by T2 (32.99%), T1 (32.65%), and T3 (30.19%), whereas CK exhibited significantly lower WHC (21.36%) (p < 0.05). Bulk density (BD) varied significantly across treatments, with higher values recorded in CK (1.32 g/cm3) and T3 (1.14 g/cm3), and lower values in T1 (1.08 g/cm3), T2 (1.06 g/cm3), and T4 (1.04 g/cm3). Similarly, soil porosity (SP) also varied among treatments, with higher SP observed in T4 (65.39%), T2 (63.92%), and T1 (62.32%), and lower SP in T3 (58.63%) and CK (41.88%) (Table 3).

3.5. Soil Nutrients

We analyzed soil nutrient levels, including total nitrogen (TN), nitrate nitrogen (NN), ammonium nitrogen (AN), total phosphorus (TP), and available phosphorus (AP). TN content varied significantly among treatments (p < 0.05), with the lowest value recorded in CK (480.6 mg/kg) and higher values observed in nitrogen-enriched treatments, such as T4 (926.3 mg/kg), T3 (839.5 mg/kg), and T2 (818.6 mg/kg). Similarly, NN levels were lower in CK (14.1 mg/kg), T1 (14.2 mg/kg), and T2 (15.3 mg/kg), while higher values were detected in T4 (25.3 mg/kg) and T3 (23.1 mg/kg). AN exhibited a comparable pattern, with elevated levels in T4 (27.7 mg/kg) and T3 (26.3 mg/kg) and lower values in CK (12.4 mg/kg), T1 (17.4 mg/kg), and T2 (22.4 mg/kg). Regarding phosphorus fractions, TP values were notably higher in T4 (1195 mg/kg), T3 (1168 mg/kg), and T2 (1049 mg/kg), while the lowest value was observed in CK (446.6 mg/kg), with a moderate value found in T1 (675.8 mg/kg). AP values followed a similar trend, with the highest concentrations in T4 (34.3 mg/kg), T3 (31.3 mg/kg), T2 (31.6 mg/kg), and T1 (30.5 mg/kg), and the lowest in CK (12.2 mg/kg) (Table 4).

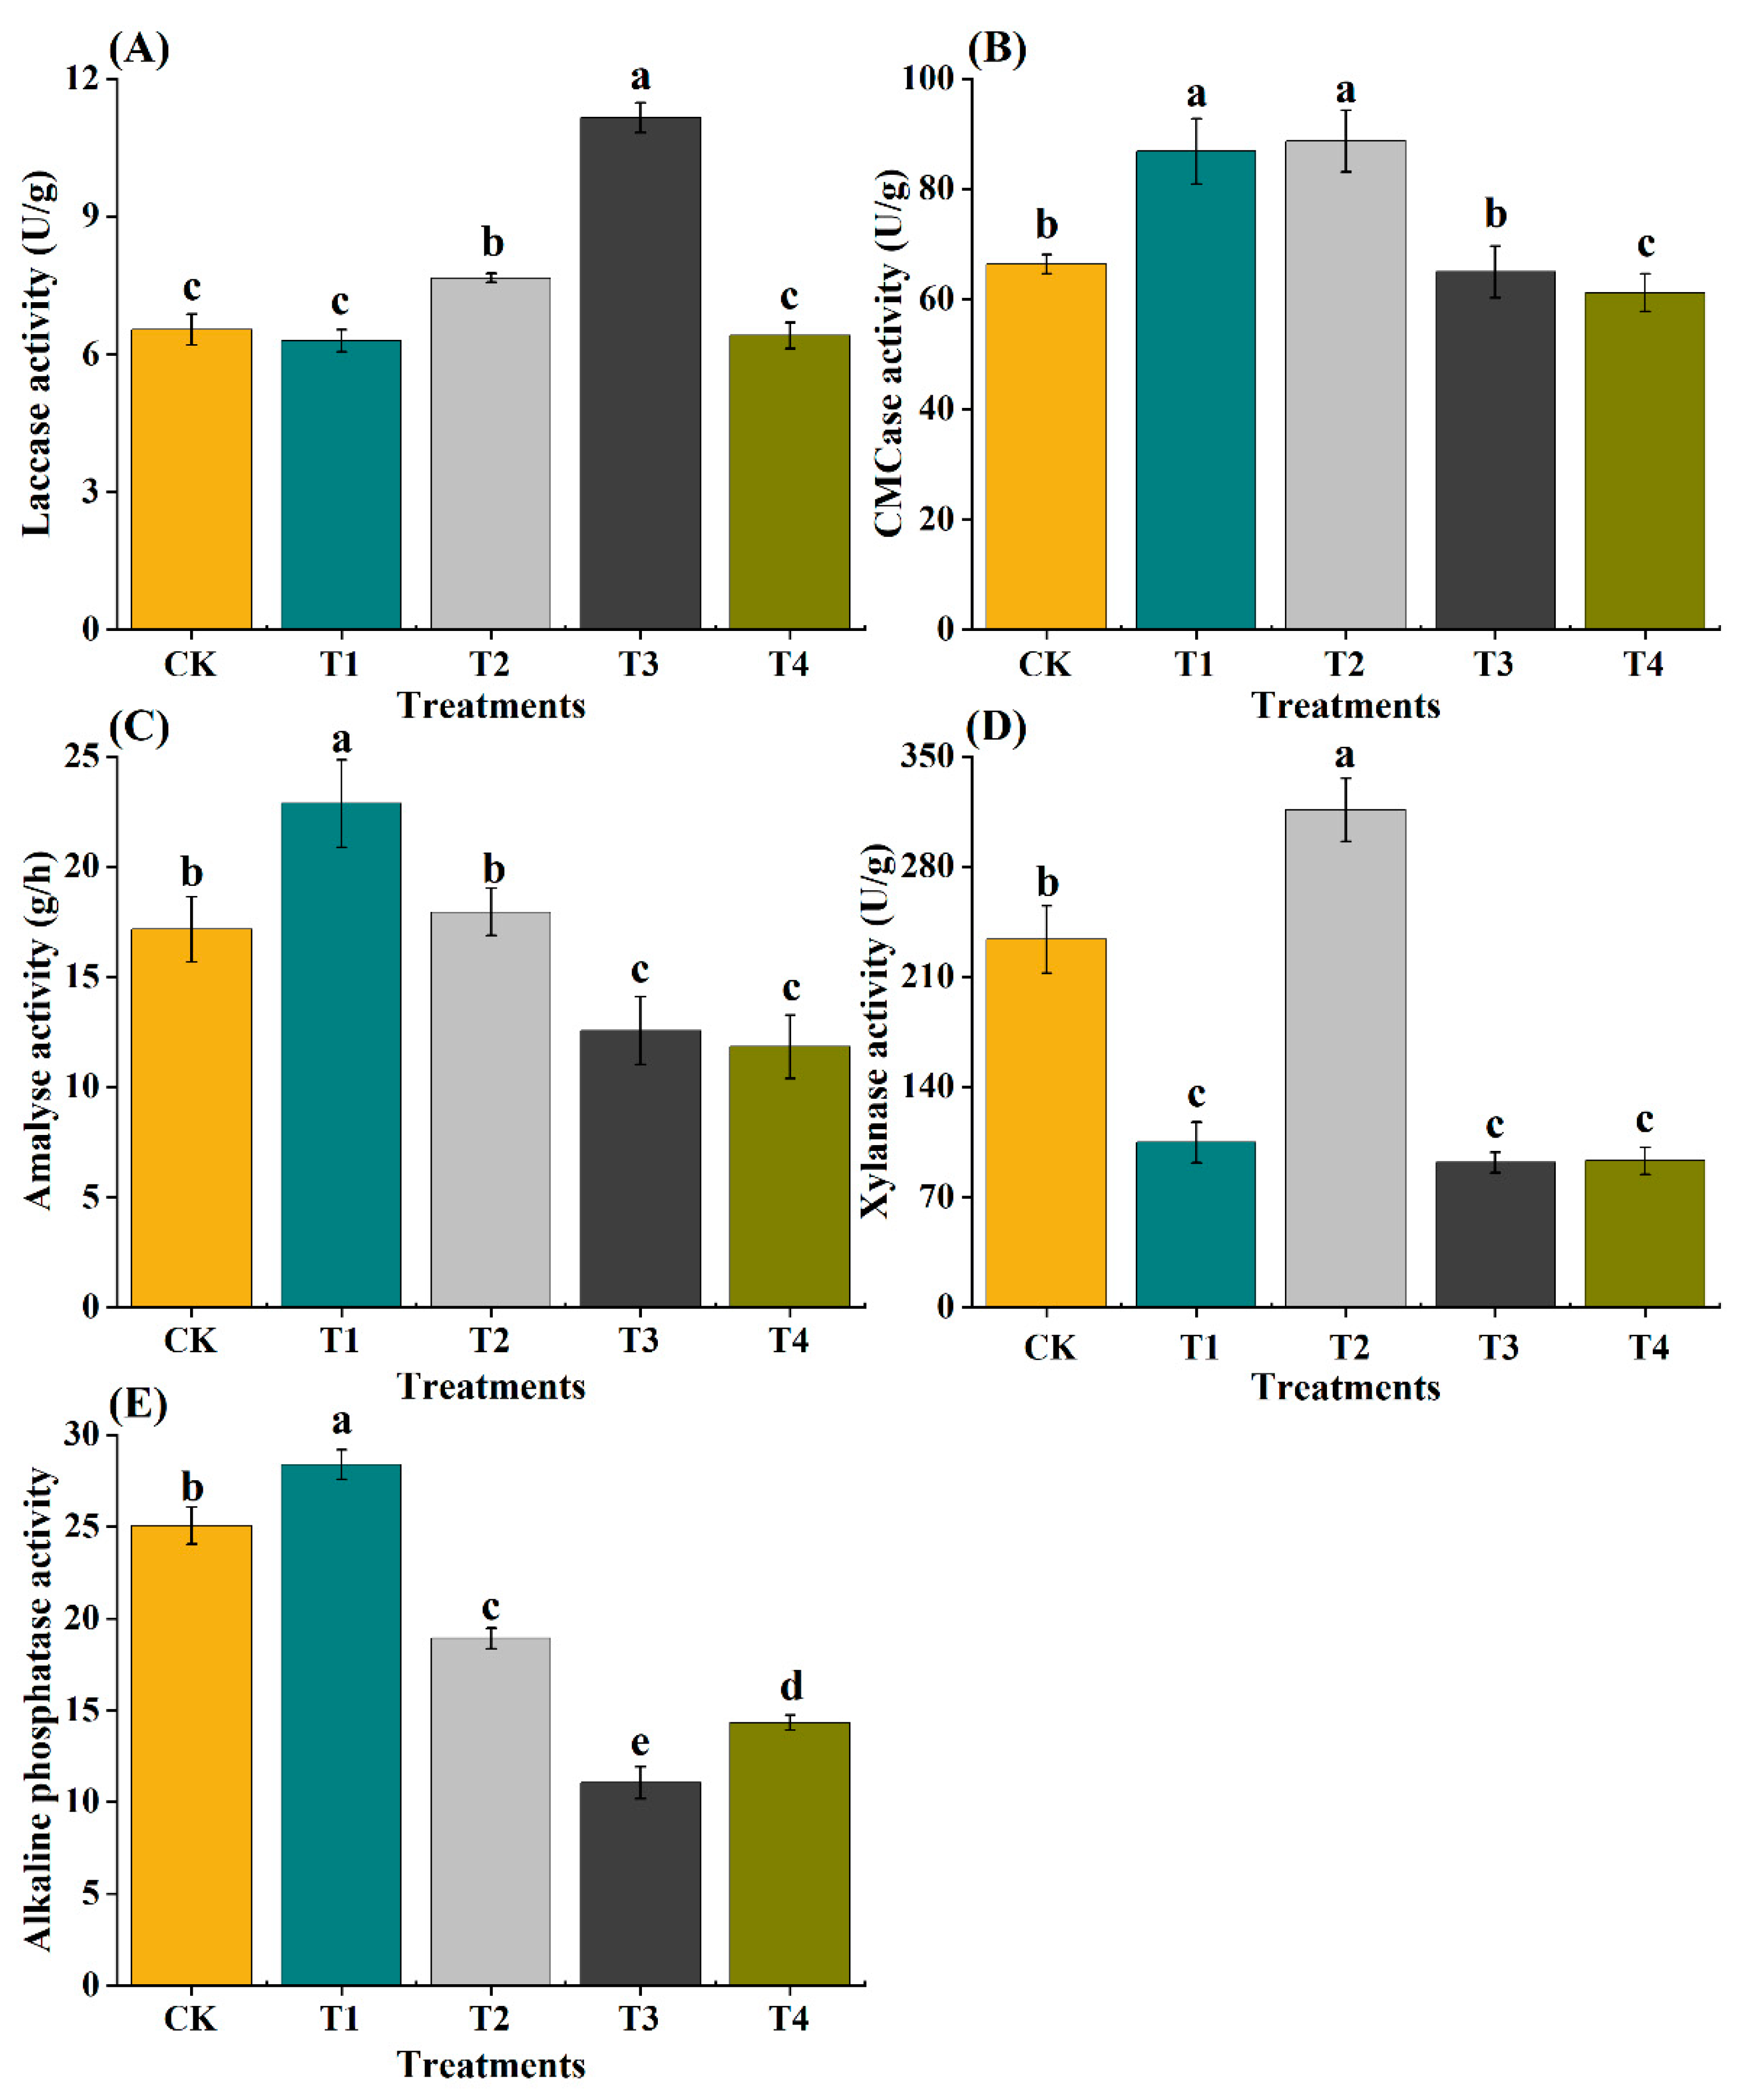
3.6. Soil Enzyme Activities

The varying concentrations of fertilizers significantly impacted enzyme activity across all soil types (p < 0.05). More specifically, laccase enzyme activity exhibited significant variability among experimental soils. T3 demonstrated the highest laccase enzyme activity (11.15 U/g), whereas no significant differences were observed between T2 (7.66 U/g), CK (6.53 U/g), T4 (6.40 U/g), and T1 (6.29 U/g) (Figure 3A). The highest CMCase enzyme activity was recorded in T2 (88.70 U/g) and T1 (86.83 U/g), whereas significantly lower values were observed in CK (66.34 U/g), T3 (64.94 U/g) and T4 (61.18 U/g) (p < 0.05) (Figure 3B). Similarly, a decreasing trend was evident in amylase enzyme activity, with the highest value found in T1 (22.86 g/h) and lower values recorded in T2 (17.94 g/h), CK (17.15 g/h), T3 (12.56 g/h), and T4 (11.82 g/h) (Figure 3C).
Xylanase enzyme activity also varied significantly with fertilization doses. T2 exhibited the highest enzyme activity (316.12 U/g), followed by CK (233.79 U/g), whereas lower values were observed in T1 (104.93 U/g), T4 (93.04 U/g), and T3 (91.98 U/g) (p < 0.05) (Figure 3D). However, alkaline phosphatase activity showed a distinct trend, with significantly higher activity recorded in T1 (28.38 µMpNP/h) and CK (25.04 µMpNP/h), and lower values observed in T2 (18.90 µMpNP/h), T4 (14.33 µMpNP/h), and T3 (11.06 µMpNP/h) treatments (p < 0.05) (Figure 3E).

3.7. Soil Organic Matter and Lignocellulose Content

The organic matter (OM) content exhibited significant variation across all treatments (p < 0.05). Particularly, T4 demonstrated significantly higher OM content (39.66%), followed by CK (35.14%), T2 (30.51%), and T1 (28.36%), while significantly lower OM content was observed in T3 (17.02%) (Figure 4A). Cellulose content displayed a similar trend, with higher values recorded in T4 (221.06 g/kg), T2 (202.39 g/kg), CK (201.54 g/kg), and T1 (195.06 g/kg), while significantly lower cellulose content was found in T3 (145.27 g/kg) (Figure 4B). Likewise, hemicellulose content followed a consistent pattern, with higher levels observed in T4 (108.38 g/kg), CK (102.08 g/kg), T1 (95.08 g/kg), and T2 (89.22 g/kg), and significantly lower levels detected in T3 (39.20 g/kg) (Figure 4C). Lignin content also varied significantly among treatments (p < 0.05). T4 exhibited the highest lignin content (181.3 g/kg), followed by CK (167.29 g/kg) and T1 (153.33 g/kg), whereas significantly lower lignin content was found in T2 (141.23 g/kg) and T3 (135.88 g/kg) (Figure 4D).

3.8. Pearsons Correlation Coefficient between Nutrients and Physiochemical Properties

In our investigation, we observed that nutrient input significantly influenced straw degradation during winter and also had a significant impact on lignocellulolytic enzyme activity in the soil. To further explore this relationship, we conducted Pearson’s correlation analysis to identify the associations between nutrient concentrations and other physiochemical properties. Our findings revealed significant correlations (p < 0.05) between TP, AP, TN, and AN with overall physiochemical properties. Specifically, TP, TN, AP, and AN exhibited significant positive correlations (p < 0.05) with EC, SP, and WHC while demonstrating significant negative correlations (p < 0.05) with BD, alkaline phosphatase, and amylase enzyme activities, respectively. Furthermore, CMCase, xylanase, amylase, and alkaline phosphatase enzymes showed significant negative correlations (p < 0.05) with NN, while EC displayed a significant positive correlation (p < 0.05) with NN (Figure S4).

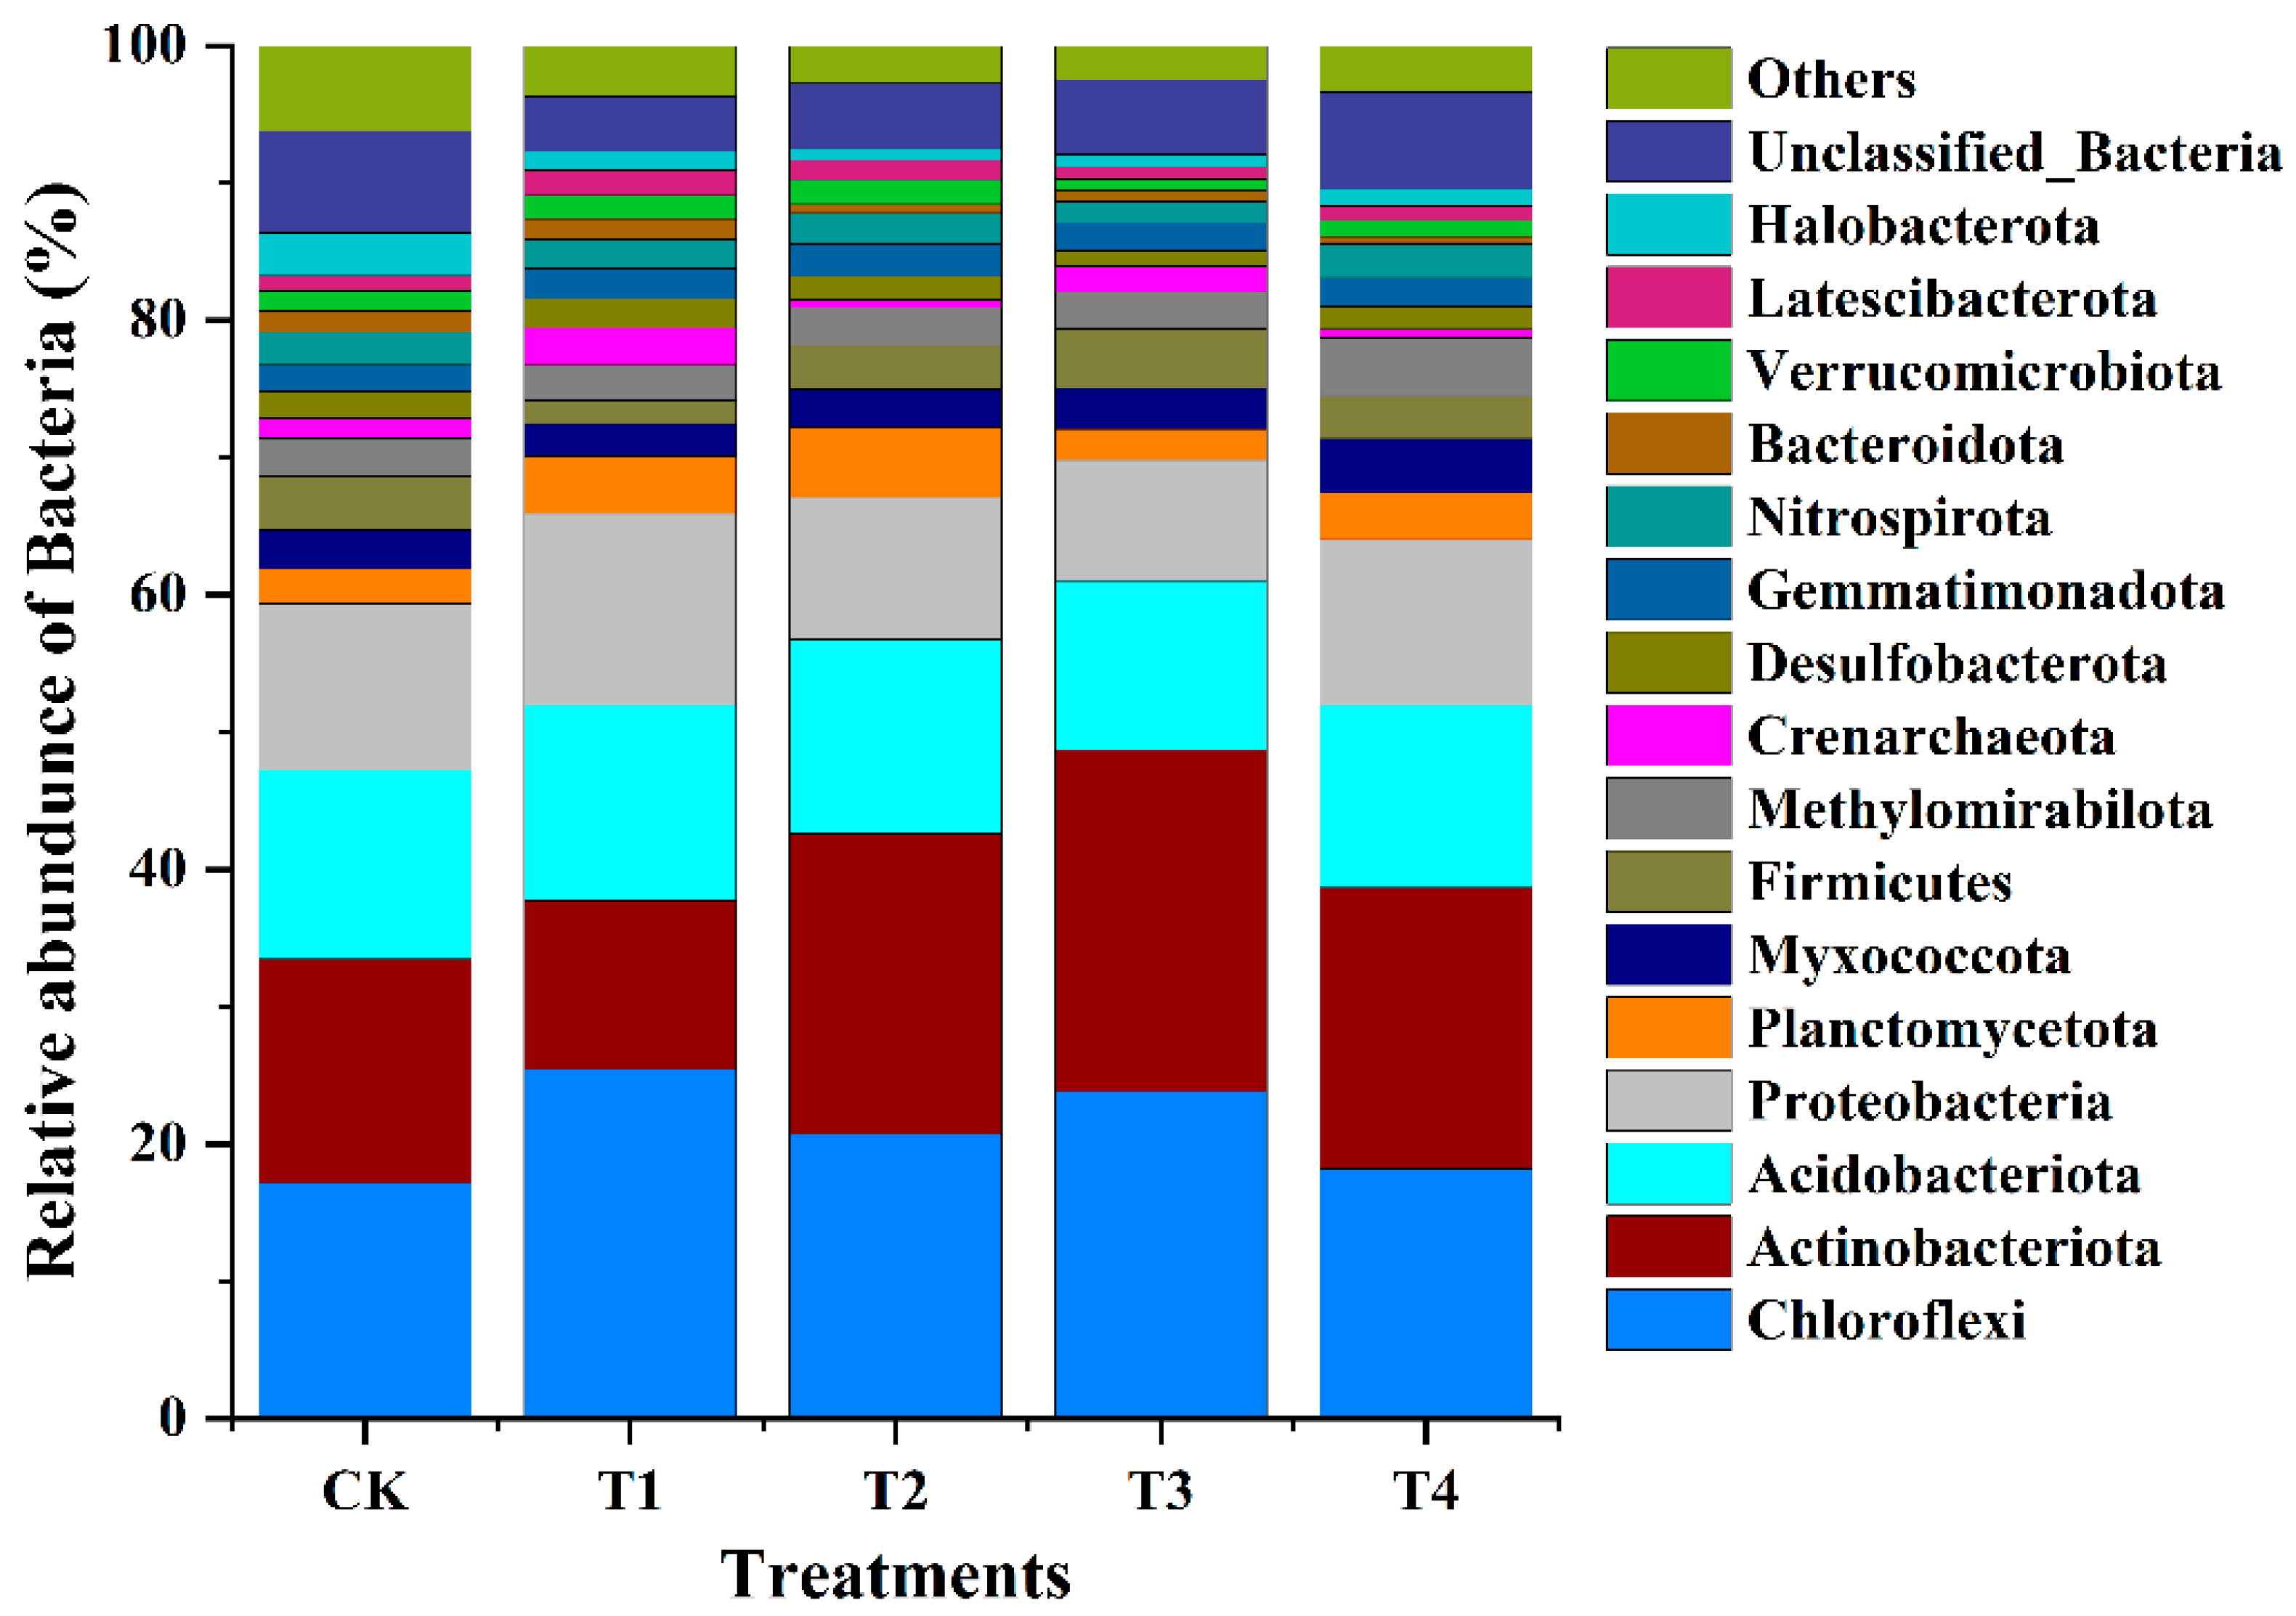
3.9. Bacterial Diversity and Composition

3.9.1. Impact of Rice Straw on Bacterial Alpha Diversity and Total Composition

In our study, we identified a total of 1,062,322 optimized sequences comprising 288,991,527 bases, with an average sequence length of 236 bp. The number of valid sequences was high in CK (122,112), followed by T3 (102,125), T1 (101,985), T4 (100,365), and T2 (098,634). The operational taxonomic units (OTUs) values exhibited significant variability across all treatments. Specifically, the highest OTU count was observed in T3 (128), while the lowest counts were recorded in T1 (117), followed by CK (114), T4 (105), and T2 (101), respectively. Similar trends were observed for Chao1 values, with higher values found in T3 (3841) and significantly lower values observed in T1 (3217), CK (3212), T4 (3115), and T2 (3012) treatments (p < 0.05). Additionally, Simpson values were significantly higher in T3 (0.21), whereas lower values were observed in T4 (0.06), CK (0.05), T1 (0.02), and T2 (0.01) treatments, respectively (Table 5).

3.9.2. Bacterial Diversity and Composition

In our investigation, a total of 52 bacterial phyla, 151 classes, 312 orders, 472 families, and 719 genera were identified. Specifically, CK exhibited the highest number of phyla (52), followed by T3 and T4, with 50 phyla each, showing no significant difference between them. Regarding classes, CK and T3 treatments displayed the highest counts (151 and 148, respectively), while lower counts were observed in T1, T2, and T4 treatments (142, 141, and 140, respectively), with no significant difference among them. A similar pattern was observed for the number of orders, with CK having the highest count (312), followed by T3 (310), whereas significantly lower counts were found in T1, T2, and T4 treatments (299, 291, and 290, respectively). The trend continued for families, with CK and T3 treatments showing the highest counts (472 and 445, respectively), while significantly lower counts were observed in T1, T2, and T4 treatments (427, 421, and 402, respectively). At the genus level, CK exhibited the highest count (719), whereas significantly lower counts were observed in T3, T1, T4, and T2 treatments (642, 624, 603, and 602, respectively) (Table 6).

3.9.3. Impact of Nitrogen Fertilization on Bacterial Community Composition

In our study, we analyzed two levels of taxonomic composition data: the highest-ranked phyla composition and order composition. Among various bacterial phyla, Chloroflexi, Actinobacteriota, Acidobacteriota, and Proteobacteria were the most prominent in all treatments. Chloroflexi exhibited high relative abundance (RA) in T1 (25.41%), T3 (23.81%), and T2 (20.68%), with lower RA observed in T4 (18.17%) and CK (17.15%). Actinobacteriota were highly abundant in T3 (24.90%), T2 (24.91%), and T4 (20.49%), while lower values were found in CK (16.28%) and T1 (12.27%). The phylum Acidobacteriota displayed high RA in T1 (14.25%), T2 (14.14%), CK (13.81%), and T4 (13.28%), with lower RA observed in T3 (12.30%). Additionally, some phyla such as Bacteroidota, Crenarchaeota, Desulfobacterota, Gemmatimonadota, Halobacterota, Latescibacterota, Nitrospirota, and Verrucomicrobiota showed very low RA across all treatments (Figure 5).
At the lower taxonomy level (order level), the relative abundance (RA) of bacteria varied significantly among all treatments, with the phylum Chloroflexi being dominant in all treatments, followed by Actinobacteria and Acidobacteria. Among Chloroflexi, the order Anaerolineales exhibited the highest RA in T3 (12.45%), followed by T1 (11.12%) and T2 (11.09%), while lower RA was observed in CK (8.85%) and T4 (10.23%). Additionally, a significant percentage of unclassified Chloroflexi were also observed in this study.
Actinobacteria, the second most abundant phylum, contained diverse orders with significant changes in all treatments. The most prominent orders within Actinobacteria were Micrococcales and Micromonosporales. Specifically, Micrococcales showed high RA in T3 (7.66%), T4 (5.47%), and CK (4.27%), while lower RA was found in T1 (3.46%) and T2 (2.27%). Similarly, Micromonosporales exhibited high RA in CK (11.08%), followed by T2 (10.45%) and T4 (8.05%), with lower RA observed in T1 (4.23%) and T3 (2.06%). The third most abundant phylum, Acidobacteria, featured the order Vicinamibacterales as the most dominant. Vicinamibacterales exhibited high RA in CK (9.04%), T4 (6.54%), and T3 (6.39%), while lower RA was observed in T1 (4.16%) and T2 (5.33%). Additionally, high RA of Burkholderiales and Rhizobiales, belonging to the phylum Pseudomonadota, were observed in all treatments (Figure S5).

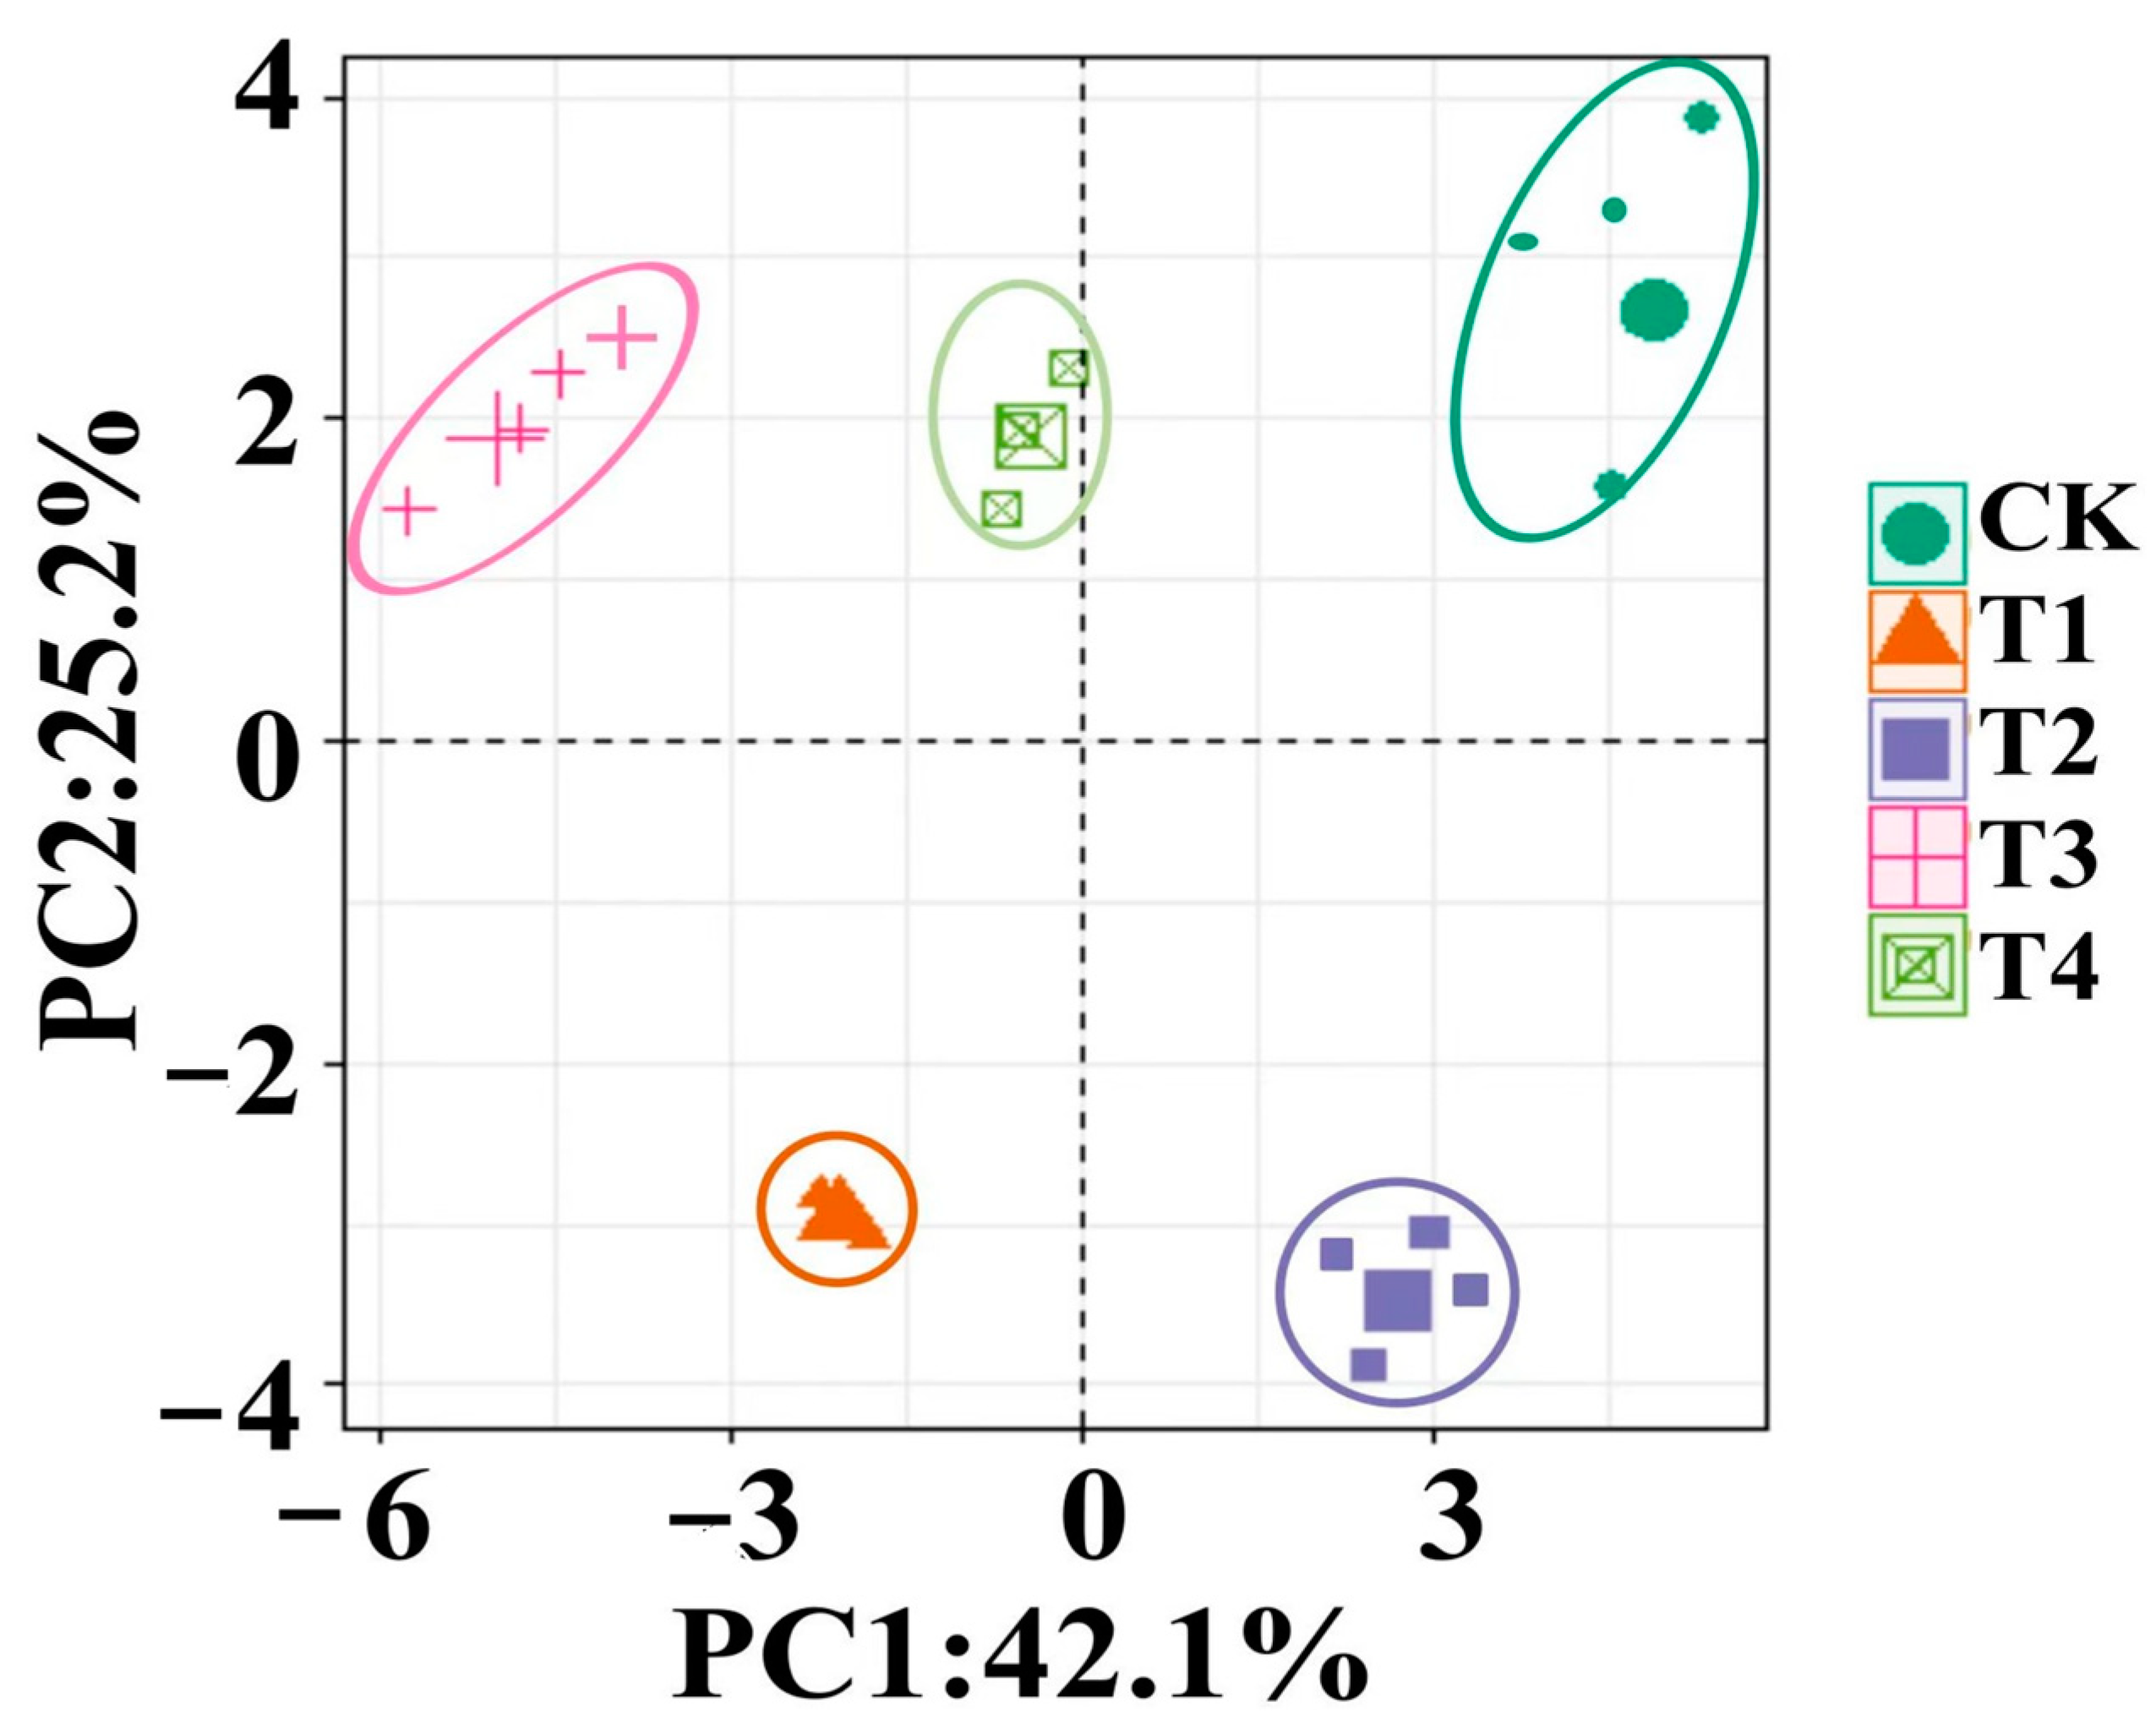
3.9.4. Principal Component Analysis of Bacterial Composition (Order Level)

The principal component analysis (PCA) was performed for bacterial composition at order level to identify each bacteria microcosm in different treatments and how nitrogen rich treatments were different from control (CK) treatments. Figure 6 shows PCA plots for bacterial composition, and the first two components (PC1-PC2) accounted for 67.3% of the variability, and the treatments were grouped according to the principal into five distinguished clusters (CK, T1, T2, T3, and T4). In Figure 6, CK clearly showed a distance from all other treatments, while T1 and T2 composition was found close to PC1. The treatments T3 and T4 showed the most unique cluster and were found on distance (at PC2) from other treatments. These findings are consistent with the findings discussed above, which state that nitrogen input resulted in a significant change in microbial composition in all treatments, which caused changes in the degradation rate of crop straw and lignocellulolytic enzyme activity.

4. Discussion

Straw returning is a widely practiced sustainable agricultural method, particularly in countries like China, aimed at waste management and enhancing soil quality and crop yield [47]. The prolonged use of straw returning alongside nutrient supplementation can notably modify soil physiochemical properties [48], which are crucial indicators of soil health assessment. In our investigation, soil pH across all treatments tended to be slightly alkaline, with significantly higher pH observed in the control group (CK) and lower pH noted in treatments T1, T2, and T3. Soil pH plays a pivotal role in crop growth by influencing various soil characteristics, thus affecting crop morphology, quality, and yield. This finding is in line with previous studies, such as Xu et al. [49], who reported that crop straw incorporation increased soil pH. The slightly high pH in T4 was one of the reasons for the low degradation of straw, as it is worth mentioning that alkaline pH can also reduce the availability of some nutrients [50]. In contrast to pH levels, the electrical conductivity (EC) values were at their lowest in the control group (CK) in our study, with significantly higher values recorded in treatments T4 and T3. The rise in soil EC values in treatments receiving higher chemical fertilization (T4 and T3) could be ascribed to the accumulation of dissolved salts in these soils [51]. Previous studies have suggested that organic amendments, such as straw, can also increase soil EC in agricultural soil [52]. However, in our study, EC values were low in the control group (CK), suggesting that the combination of straw and high chemical fertilizer input are the primary factors contributing to increased ion mobility in agricultural soil, thus leading to increased EC values in treatments T4 and T3.
Water Holding Capacity (WHC) refers to the ability of soil with a specific texture to retain water against gravitational force [53]. This retention is facilitated by soil particles holding water molecules through cohesion [54]. In this study, WHC was highest in treatment T4, followed by T2, T3, and T1, while lower values were observed in the control group (CK). This finding is consistent with the results of Fan et al. [55], who reported that long-term straw incorporation alongside moderate fertilization significantly improved soil WHC and maintained higher soil water contents. The bulk density (BD) of soil indicates the mass or weight of a given volume of soil and influences factors such as infiltration, available WHC, and soil porosity (SP). These factors indirectly impact plant root development, soil microbial activity, root proliferation, and nutrient availability. In this study, the control group (CK) exhibited higher BD, whereas lower BD values were observed in treatments T3, T1, T2, and T4, with no significant differences among them. Previous studies have suggested that crop straw serves as organic fertilizer, enhancing soil BD and SP, thereby improving soil infiltration and increasing water retention to meet the demands of crop growth [56]. Consistent with this statement, we analyzed soil SP and found higher values in treatments T4, T2, and T1, while significantly lower values were observed in the control group (CK) and treatment T3. These results indicate that the impact of nitrogen input significantly increases soil WHC, BD, and SP compared to treatments with no fertilization.
Field crops require several macro elements, including carbon (C), nitrogen (N), phosphorus (P), potassium (K), calcium (Ca), and magnesium (Mg), for their growth and development [57]. Shortages or excesses of these elements can have negative impacts on soil health. Therefore, in this study, we applied different doses of nitrogen (N) fertilizer to assess its effects on soil properties and evaluated various forms of nutrients to understand their relationships with other physiochemical or microbial properties. Soil N availability is a crucial limiting factor for both natural and agricultural productivity in terrestrial ecosystems [58,59]. Agricultural soils typically receive higher rates of N-based chemical fertilizers, and the straw returned to fields contains significant amounts of N fractions. Soil nitrogen (N) is present in three primary forms: organic N compounds, ammonium (NH4+) ions, and nitrate (NO3) ions [60]. Therefore, we conducted a comprehensive analysis of total nitrogen (TN), ammonium nitrogen (AN), and nitrate nitrogen (NN) in all treatments. We found significantly high TN values in treatments receiving high N fertilization, such as T4 and T3, and moderate TN values in T1. Similarly, high NN values were observed in treatments with high N inputs, particularly in T4 and T3. Correspondingly, AN values followed a similar trend, with high values in T4 and significantly lower values in the control group (CK). In agricultural fields, plants are typically fertilized with N-containing compounds, primarily in the form of urea. Urea hydrolysis generates ammonium (NH4+), which is subsequently oxidized to nitrate (NO3) in the oxic soil surrounding plant roots. In this study, lower NN and AN values were observed compared to TN, which is consistent with previous research indicating that cereal crops primarily utilize NN. Additionally, strong correlations have been observed between soil NN and crop yield [61,62,63].
Phosphorus (P) is the second most crucial element after nitrogen (N) due to its significant influence on the productivity and overall health of terrestrial ecosystems [64]. Historically, considerable efforts have been directed toward field-specific P management, which is crucial for enhancing crop yield while minimizing inputs [65]. In this study, phosphorus fertilization remained constant across treatments T1-T4; however, changes in phosphorus fractions were observed among different treatments. We noted high total phosphorus (TP) values in treatments T4 and T3, while lower values were observed in the control group (CK) and treatment T1. It is important to note that TP in the soil does not directly reflect the available phosphorus (AP) for plant uptake, as approximately 80% of TP remains immobile and unavailable for plant absorption [66]. Thus, we also assessed AP in all treatments, which exhibited variability. Higher AP values were observed in treatment T4, while moderately lower AP values were recorded in treatments T2 and T3, with approximately 15.7% and 5.1% reductions, respectively, compared to T4.
Previous studies have demonstrated that agronomic practices influence soil AP availability for plant uptake, subsequently impacting phosphorus use efficiency. Our findings are consistent with Jiang et al. [67], who reported that straw incorporation alongside high fertilization increased soil AP content. This phenomenon may be attributed to the fact that under low N dosage, plants exhibit an increased dependence on phosphorus, resulting in higher uptake in treatments T2 and T3. Conversely, in the case of high N treatment (T4), plants may have sufficient nutrient availability, leading to reduced phosphorus uptake as they prioritize other nutrients. The activity of soil enzymes has long served as a fundamental indicator of soil quality [68]. These enzymatic activities, generated and released by soil microbes, play a key role in the degradation of organic matter [69]. In fields where straw is returned, it is essential to assess lignocellulolytic enzyme activity. Therefore, we evaluated the activities of CMCase, xylanase, laccase, and amylase enzymes across all soil samples. Specifically, significantly high CMCase enzyme activity was observed in treatment T1, followed by T2 and T3, while significantly lower activity was found in the control group (CK) and treatment T4. Similarly, xylanase enzyme activity exhibited high levels in T3 and T2, followed by T1, whereas significantly lower activity was observed in T2 and CK. Laccase enzyme activity also followed a similar trend, with high levels in T3 and T2 and significantly lower activity in T1 and T4. The trend continued with amylase enzyme activity, which showed high levels in T1 and T2, while significantly lower activity was found in T3, T4, and CK. These results are consistent with previous studies indicating that soil enzymatic activities increase in response to moderate chemical fertilizer application and straw return. Under such conditions, there is a greater carbon demand for microbial development [70]. The increase in soil enzyme activities may be attributed to changes in microbial community composition, as well as enhanced soil microorganism metabolism and microbial activity stimulated by nutrient addition [70].
Therefore, straw return alongside moderate fertilizer application can provide organic supplements, increase microbial biomass, and create an appropriate environment for soil enzyme development [71]. In contrast to lignocellulolytic enzymes, alkaline phosphatase enzyme activity exhibited high levels in T1, while significantly lower activity was observed in T3, T4, T2, and CK. Microorganisms can only assimilate dissolved phosphate, making phosphatase activity fundamental in the transformation of phosphorus from soil organic matter into available forms [72]. The higher alkaline phosphatase activity in T1 could be attributed to stress triggered by plant hormones, indicating a need for an available form of phosphorus, resulting in increased enzyme activity. Conversely, the low alkaline phosphatase activity in treatments receiving high nitrogen fertilization is likely due to the higher availability of nutrients.
Additionally, Pearson’s correlation coefficient analysis identified significant relationships between nutrient concentrations (AN, AP, NN, TN, and TP) and soil enzyme activities. This underscores the intricate interplay between nutrient availability and soil microbial processes. Soil organic matter (OM) content stands as a pivotal factor influencing soil properties and functions, encompassing various physical characteristics such as water-holding capacity (WHC) and aggregate stability [73]. OM serves as a major binding agent that stabilizes soil aggregates [74,75]. Many studies have underscored the richness of crop straw in OM and soil nutrients, positioning it as an increasingly vital natural organic fertilizer [76,77]. In this study, high OM percentages were observed in treatments T4 and CK, whereas lower values were noted in treatments T3 and T1. For a comprehensive analysis of each constituent of OM in soil, we evaluated cellulose, hemicellulose, and lignin content. The results unveiled significantly high cellulose content in treatments T4, CK, T2, and T1, with notably lower levels observed in treatment T3. A similar trend was observed for hemicellulose and lignin content, which exhibited markedly lower levels in treatment T3 compared to other treatments. Currently, over 60% of straw is returned to fields, with this proportion expected to increase gradually [78]. Nevertheless, a comprehensive understanding of straw degradation in the field remains elusive. Our findings suggest that moderate fertilization positively impacts straw degradation compared to high or no fertilization. These results align with those of Wang et al. [79], who similarly found that fertilizer input significantly enhances straw degradation and enhances soil fertility.
The practice of straw returning, coupled with varying dosages of chemical fertilization, induces shifts in soil pH, as well as in the contents of carbon (C), nitrogen (N), phosphorus (P), and potassium (K), directly impacting the structure and function of the microbial community in soil [80]. In this study, bacterial operational taxonomic units (OTUs), Chao1, and Simpson indices were notably lower in treatment T4 compared to moderate or unfertilized treatments, indicating a positive impact of moderate fertilization on bacterial diversity in the context of straw returning. These findings corroborate those of Cui et al. [81], who concluded that straw returning enriches the soil with organic carbon, providing nutrients for bacterial growth, thereby fostering their reproduction and enhancing bacterial community diversity in agricultural soil.
At the level of bacterial community composition, treatment T1 exhibited the highest relative abundance (RA) of Chloroflexi, followed by T3 and T2, while lower RA was observed in treatments T4 and CK. These observations align with previous studies that have identified Chloroflexi as one of the most abundant phyla in agricultural soils [82]. Chloroflexi, being anaerobic bacteria, play a crucial role in the degradation of complex organic matter in deep soil, facilitating nutrient release [83]. In addition to Chloroflexi, Actinobacteriota, Acidobacteriota, and Proteobacteria were also present in all experimental soils, with higher RA observed in moderate fertilization treatments. This is consistent with reports indicating that Proteobacteria are typically the dominant microbial phylum found in soil samples [84,85]. Proteobacteria thrive in nutrient-rich soil environments, and the decomposition of rice straw can lead to significant nutrient release into the soil ecosystem, thereby supporting the proliferation of these bacteria in paddy fields. Principal component analysis of bacterial composition further revealed that the addition of nutrient inputs reshaped the bacterial community, with each treatment showing a distinct cluster of bacterial composition.
We conclude by this study that straw returning is a sustainable approach, which indeed enhances soil quality and crop yield by reducing the huge amount of straw waste generated per season. Nutrient input plays a significant role in organic matter degradation. However, high concentrations of nutrients can cause negative impacts by increasing soil alkalinity and EC, which ultimately affects soil enzymes, which are responsible for the degradation of straw lignocellulose in soil. That is why it is worth mentioning that moderate fertilization, along with good farming practices, can enhance soil-suitable microbiome diversity, which leads to the development of good soil health. These findings practically encourage farmers to adopt straw returning as a practice to improve soil health and crop yield. This practice is cost-effective, and farmers can save on input costs by using fertilizers more efficiently.
Further research should be conducted to focus on a detailed analysis of microbial communities and their active metabolites and metagenomes, which will broaden the exact mechanism behind the role of nutrient input in straw degradation under various environmental factors.
Our study investigated the impact of different levels of nitrogen (N) fertilization on rice straw degradation and oilseed rape yield in cold winter conditions in Southwest China. The findings indicate significant benefits of optimized nitrogen fertilization for enhancing straw degradation and crop yield. To further contextualize our results within the existing literature, we present a comparison of the advantages and disadvantages of our study with similar studies (Table 7).

5. Conclusions

Returning crop straw to the field is a huge environmental revolution for agronomists, and it is more challenging for farmers to adapt to intense agricultural practices and dramatically changing climate. Consequently, in this study, we evaluated the impact of different levels of nitrogen (N) fertilization on the degradation of rice straw and the yield of oilseed rape under cold winter conditions in Southwest China. We found high nitrogen (N180) was most suitable to achieve a high yield of oilseed rape (1690 and 1399 kg/ha), but it showed low NAE (3.69–2.56) and NPE (28.91–18.14) values as compared to N120 treatment. It also impacts positively on WHC, BD, and SP. The higher degradation of OM was also found in T2 (N60) and T3 (N120) as compared to control and T4 (N180), which is consistent with the degradation of lignocellulosic material in soil. The degradation of lignocellulose was related to soil lignocellulolytic enzyme activities as well, which was high in T2 and T3 treatments as compared to control and T4. Moderate fertilization also reshaped soil bacterial composition by increasing the richness and evenness of lignocellulolytic bacteria, such as the high abundance of Chloroflexi and Actinobacteria found in T3 and T4. We suggest farmers and agronomists follow N120P90 as the best fertilizer dosage for winter oilseed rape fields where rice straw degradation is needed, with little compromise of yield. We also conclude that optimal nitrogen fertilization can significantly enhance straw degradation and improve crop yield, thus offering valuable insights for sustainable agricultural practices in similar environments. Such effective crop residue management not only improves soil health and crop productivity but also plays a crucial role in soil carbon sequestration, contributing to climate change mitigation and long-term agricultural sustainability. However, the regional specificity, short duration, and limited crop varieties could be limitations of this study, and further studies should be conducted with different crop varieties, with different climates, and long-term experiments. Further research should be conducted to focus on microbial active metabolites and metagenomes, for the evaluation of the exact mechanism behind the role of nutrient input in straw degradation under various environmental factors.

Supplementary Materials

The following supporting information can be downloaded at https://www.mdpi.com/article/10.3390/su16135580/s1, Figure S1. The trends in minimum and maximum seasonal rainfall (mm) from October to May; Figure S2. The trends in minimum and maximum seasonal temperature from October to May; Figure S3. Research design and flow chart of experiments conducted during this study; Figure S4. Pearson’s correlation analysis between nutrient concentration and soil physiochemical properties. Correlation coefficients are shown in each box. Values with “****”, “***”, “**”, and “*” means the correlation between two variables are significant at p < 0.0001, p < 0.001, p < 0.01, and p < 0.05, respectively, while values without any “*” means no significance between 2 variables found; Figure S5. Impact of nitrogen input on the relative abundance of bacterial orders. CK, (N0P0); T1, (N0P90); T2, (N60P90); T3, (N120P90); and T4, (N180P90).

Author Contributions

X.W. designed the study and supervision. F.N. and S.S. collected the samples. H.W., F.N. and S.M.M.S. conducted the laboratory experiments, writing—original draft preparation, and formal analysis. S.S., H.W. and R.K. writing—review and editing. F.N. and H.W. conducted bioinformatics and statistical analyses. All authors have read and agreed to the published version of the manuscript.

Funding

This study was supported by the Sichuan Science and Technology program (2021NZZJ0024, 2021YFN0053, 2021YFN0049, 2021ZHFP0126).

Institutional Review Board Statement

Not applicable.

Informed Consent Statement

Not applicable.

Data Availability Statement

Not applicable.

Acknowledgments

Special thanks are extended to the staff of the agricultural station of SWUST for their irreplaceable work in managing the field experiment and collecting the samples. We would also like to thank the reviewers and editor who provided valuable suggestions to improve this paper.

Conflicts of Interest

The authors declare no conflict of interest. The funders had no role in the design of the study, in the collection, analyses, or interpretation of data, in the writing of the manuscript, or in the decision to publish the results.

References

  1. Tilman, D.; Clark, M. Global diets link environmental sustainability and human health. Nature 2014, 515, 518–522. [Google Scholar] [CrossRef]
  2. Khan, N.; Ray, R.L.; Sargani, G.R.; Ihtisham, M.; Khayyam, M.; Ismail, S. Current progress and future prospects of agriculture technology: Gateway to sustainable agriculture. Sustainability 2021, 13, 4883. [Google Scholar] [CrossRef]
  3. Chen, L.; Sun, S.; Yao, B.; Peng, Y.; Gao, C.; Qin, T.; Zhou, Y.; Sun, C.; Quan, W. Effects of straw return and straw biochar on soil properties and crop growth: A review. Front. Plant Sci. 2022, 13, 986763. [Google Scholar] [CrossRef] [PubMed]
  4. Li, C.; Xiong, Y.; Qu, Z.; Xu, X.; Huang, Q.; Huang, G. Impact of biochar addition on soil properties and water-fertilizer productivity of tomato in semi-arid region of Inner Mongolia, China. Geoderma 2018, 331, 100–108. [Google Scholar] [CrossRef]
  5. Wang, Y.J.; Bi, Y.Y.; Gao, C.Y. The assessment and utilization of straw resources in China. Agric. Sci. China 2010, 9, 1807–1815. [Google Scholar] [CrossRef]
  6. Jin, Z.; Shah, T.; Zhang, L.; Liu, H.; Peng, S.; Nie, L. Effect of straw returning on soil organic carbon in rice–wheat rotation system: A review. Food Energy Secur. 2020, 9, e200. [Google Scholar] [CrossRef]
  7. Zhang, R.; Li, X.; Fadel, J. Oyster mushroom cultivation with rice and wheat straw. Bioresour. Technol. 2002, 82, 277–284. [Google Scholar] [CrossRef] [PubMed]
  8. Binod, P.; Sindhu, R.; Singhania, R.R.; Vikram, S.; Devi, L.; Nagalakshmi, S.; Kurien, N.; Sukumaran, R.K.; Pandey, A. Bioethanol production from rice straw: An overview. Bioresour. Technol. 2010, 101, 4767–4774. [Google Scholar] [CrossRef] [PubMed]
  9. Mothe, S.; Polisetty, V.R. Review on anaerobic digestion of rice straw for biogas production. Environ. Sci. Pollut. Res. 2021, 28, 24455–24469. [Google Scholar] [CrossRef]
  10. Roca-Pérez, L.; Martínez, C.; Marcilla, P.; Boluda, R. Composting rice straw with sewage sludge and compost effects on the soil–plant system. Chemosphere 2009, 75, 781–787. [Google Scholar] [CrossRef]
  11. Yin, H.; Zhao, W.; Li, T.; Cheng, X.; Liu, Q. Balancing straw returning and chemical fertilizers in China: Role of straw nutrient resources. Renew. Sustain. Energy Rev. 2018, 81, 2695–2702. [Google Scholar] [CrossRef]
  12. Ma, E.; Zhang, G.; Ma, J.; Xu, H.; Cai, Z.; Yagi, K. Effects of rice straw returning methods on N2O emission during wheat-growing season. Nutr. Cycl. Agroecosyst. 2010, 88, 463–469. [Google Scholar] [CrossRef]
  13. Su, W.; Lu, J.; Wang, W.; Li, X.; Ren, T.; Cong, R. Influence of rice straw mulching on seed yield and nitrogen use efficiency of winter oilseed rape (Brassica napus L.) in intensive rice–oilseed rape cropping system. Field Crops Res. 2014, 159, 53–61. [Google Scholar] [CrossRef]
  14. Jansson, J.K.; Taş, N. The microbial ecology of permafrost. Nat. Rev. Microbiol. 2014, 12, 414–425. [Google Scholar] [CrossRef] [PubMed]
  15. Kirschbaum, M.U.F. The temperature dependence of organic-matter decomposition—Still a topic of debate. Soil Biol. Biochem. 2006, 38, 2510–2518. [Google Scholar] [CrossRef]
  16. Pullens, J.W.M.; Sharif, B.; Trnka, M.; Balek, J.; Semenov, M.A.; Olesen, J.E. Risk factors for European winter oilseed rape production under climate change. Agric. For. Meteorol. 2019, 272, 30–39. [Google Scholar] [CrossRef]
  17. Moradtalab, N.; Ahmed, A.; Geistlinger, J.; Walker, F.; Höglinger, B.; Ludewig, U.; Neumann, G. Synergisms of microbial consortia, N forms, and micronutrients alleviate oxidative damage and stimulate hormonal cold stress adaptations in maize. Front. Plant Sci. 2020, 11, 396. [Google Scholar] [CrossRef]
  18. Gous, P.W.; Warren, F.; Mo, O.W.; Gilbert, R.G.; Fox, G.P. The effects of variable nitrogen application on barley starch structure under drought stress. J. Inst. Brew. 2015, 121, 502–509. [Google Scholar] [CrossRef]
  19. Andrianary, B.H.; Tsujimoto, Y.; Rakotonindrina, H.; Oo, A.Z.; Rabenarivo, M.; Ramifehiarivo, N.; Razakamanarivo, H. Phosphorus application affects lowland rice yields by changing phenological development and cold stress degrees in the central highlands of Madagascar. Field Crops Res. 2021, 271, 108256. [Google Scholar] [CrossRef]
  20. Näsholm, T.; Kielland, K.; Ganeteg, U. Uptake of organic nitrogen by plants. New Phytol. 2009, 182, 31–48. [Google Scholar] [CrossRef]
  21. Han, S.-W.; Yoshikuni, Y. Microbiome engineering for sustainable agriculture: Using synthetic biology to enhance nitrogen metabolism in plant-associated microbes. Curr. Opin. Microbiol. 2022, 68, 102172. [Google Scholar] [CrossRef] [PubMed]
  22. Løvdal, T.; Lillo, C. Reference gene selection for quantitative real-time PCR normalization in tomato subjected to nitrogen, cold, and light stress. Anal. Biochem. 2009, 387, 238–242. [Google Scholar] [CrossRef] [PubMed]
  23. Xiong, X.; Chang, L.; Khalid, M.; Zhang, J.; Huang, D. Alleviation of drought stress by nitrogen application in Brassica campestris ssp. Chinensis L. Agronomy 2018, 8, 66. [Google Scholar] [CrossRef]
  24. Zhang, C.; Zhang, Z.; Zhou, J.; Wang, Y.; Ai, Y.; Li, X.; Zhang, P.; Zhou, S. Responses of the root morphology and photosynthetic pigments of ryegrass to fertilizer application under combined petroleum–heavy metal stress. Environ. Sci. Pollut. Res. 2022, 29, 87874–87883. [Google Scholar] [CrossRef] [PubMed]
  25. Siddiqui, M.; Khan, M.; Mohammad, F.; Khan, M. Role of nitrogen and gibberellin (GA3) in the regulation of enzyme activities and in osmoprotectant accumulation in Brassica juncea L. under salt stress. J. Agron. Crop Sci. 2008, 194, 214–224. [Google Scholar] [CrossRef]
  26. Liu, L.; Cheng, M.; Yang, L.; Gu, X.; Jin, J.; Fu, M. Regulation of straw decomposition and its effect on soil function by the amount of returned straw in a cool zone rice crop system. Sci. Rep. 2023, 13, 15673. [Google Scholar] [CrossRef]
  27. Zhu, S.; Vivanco, J.M.; Manter, D.K. Nitrogen fertilizer rate affects root exudation, the rhizosphere microbiome and nitrogen-use-efficiency of maize. Appl. Soil Ecol. 2016, 107, 324–333. [Google Scholar] [CrossRef]
  28. Yang, G.; Nabi, F.; Sajid, S.; Kaleri, A.R.; Jakhar, A.M.; Cheng, L.; Raspor, M.; Muhammad, N.; Ma, J.; Hu, Y. Response of root development and nutrient uptake of two chinese cultivars of hybrid rice to nitrogen and phosphorus fertilization in Sichuan Province, China. Mol. Biol. Rep. 2021, 48, 8009–8021. [Google Scholar] [CrossRef]
  29. Nabi, F.; Chen, H.; Sajid, S.; Yang, G.; Kyung, Y.; Shah, S.M.M.; Wang, X.; Hu, Y. Degradation of agricultural waste is dependent on chemical fertilizers in long-term paddy-dry rotation field. J. Environ. Manag. 2024, 355, 120460. [Google Scholar] [CrossRef]
  30. Vereecken, H.; Maes, J.; Feyen, J.; Darius, P. Estimating the soil moisture retention characteristic from texture, bulk density, and carbon content. Soil Sci. 1989, 148, 389–403. [Google Scholar] [CrossRef]
  31. Mahe, G.; Paturel, J.-E.; Servat, E.; Conway, D.; Dezetter, A. The impact of land use change on soil water holding capacity and river flow modelling in the Nakambe River, Burkina-Faso. J. Hydrol. 2005, 300, 33–43. [Google Scholar] [CrossRef]
  32. Bradstreet, R.B. Kjeldahl method for organic nitrogen. Anal. Chem. 1954, 26, 185–187. [Google Scholar] [CrossRef]
  33. Norman, R.; Stucki, J. The determination of nitrate and nitrite in soil extracts by ultraviolet spectrophotometry. Soil Sci. Soc. Am. J. 1981, 45, 347–353. [Google Scholar] [CrossRef]
  34. Robertson, G.P.; Wedin, D.; Groffman, P.; Blair, J.; Holland, E.; Nedelhoffer, K.; Harris, D. Soil carbon and nitrogen availability. Nitrogen mineralization, nitrification and soil respiration potentials. Stand. Soil Methods Long-Term Ecol. Res. 1999, 258–271. [Google Scholar]
  35. Dong, J.; Xing, Y.H.; Gong, X.M. Study on Novel Structures Phosphorus Sorption Capacity of Surficial Sediment in Dongping Lake and Risk Assessment of Potential Phosphorus Release. Adv. Mater. Res. 2012, 518, 1089–1092. [Google Scholar] [CrossRef]
  36. Olsen, S.R. Estimation of Available Phosphorus in Soils by Extraction with Sodium Bicarbonate; US Department of Agriculture: Washington, DC, USA, 1954.
  37. Kumar, A.; Singh, D.; Sharma, K.K.; Arora, S.; Singh, A.K.; Gill, S.S.; Singhal, B. Gel-based purification and biochemical study of laccase isozymes from Ganoderma sp. and its role in enhanced cotton callogenesis. Front. Microbiol. 2017, 8, 674. [Google Scholar] [CrossRef]
  38. Tabatabai, M.A.; Bremner, J.M. Use of p-nitrophenyl phosphate for assay of soil phosphatase activity. Soil Biol. Biochem. 1969, 1, 301–307. [Google Scholar] [CrossRef]
  39. Wu, Y.; Zhou, J.; Li, C.; Ma, Y. Antifungal and plant growth promotion activity of volatile organic compounds produced by Bacillus amyloliquefaciens. MicrobiologyOpen 2019, 8, e00813. [Google Scholar] [CrossRef]
  40. Sajid, S.; Zveushe, O.K.; de Dios, V.R.; Nabi, F.; Lee, Y.K.; Kaleri, A.R.; Ma, L.; Zhou, L.; Zhang, W.; Dong, F. Pretreatment of rice straw by newly isolated fungal consortium enhanced lignocellulose degradation and humification during composting. Bioresour. Technol. 2022, 354, 127150. [Google Scholar] [CrossRef]
  41. Eiland, F.; Leth, M.; Klamer, M.; Lind, A.M.; Jensen, H.; Iversen, J. C and N turnover and lignocellulose degradation during composting of Miscanthus straw and liquid pig manure. Compos. Sci. Util. 2001, 9, 186–196. [Google Scholar] [CrossRef]
  42. Ibáñez, A.B.; Bauer, S. Downscaled method using glass microfiber filters for the determination of Klason lignin and structural carbohydrates. Biomass Bioenergy 2014, 68, 75–81. [Google Scholar] [CrossRef]
  43. Callahan, B.J.; McMurdie, P.J.; Rosen, M.J.; Han, A.W.; Johnson, A.J.A.; Holmes, S.P. DADA2: High-resolution sample inference from Illumina amplicon data. Nat. Methods 2016, 13, 581–583. [Google Scholar] [CrossRef] [PubMed]
  44. Jiang, R.; Lönnerdal, B. Cloning and characterization of the human lactoferrin receptor gene promoter. Biometals 2018, 31, 357–368. [Google Scholar] [CrossRef] [PubMed]
  45. Hu, B.; Shao, S.; Fu, Z.; Li, Y.; Ni, H.; Chen, S.; Zhou, Y.; Jin, B.; Shi, Z. Identifying heavy metal pollution hot spots in soil-rice systems: A case study in South of Yangtze River Delta, China. Sci. Total Environ. 2019, 658, 614–625. [Google Scholar] [CrossRef]
  46. Lê, S.; Josse, J.; Husson, F. FactoMineR: An R package for multivariate analysis. J. Stat. Softw. 2008, 25, 1–18. [Google Scholar] [CrossRef]
  47. Zhao, X.; Liu, B.Y.; Liu, S.L.; Qi, J.Y.; Wang, X.; Pu, C.; Li, S.S.; Zhang, X.Z.; Yang, X.G.; Lal, R. Sustaining crop production in China’s cropland by crop residue retention: A meta-analysis. Land Degrad. Dev. 2020, 31, 694–709. [Google Scholar] [CrossRef]
  48. Wang, J.; Wang, X.; Xu, M.; Feng, G.; Zhang, W.; Lu, C. Crop yield and soil organic matter after long-term straw return to soil in China. Nutr. Cycl. Agroecosyst. 2015, 102, 371–381. [Google Scholar] [CrossRef]
  49. Xu, P.; Sun, C.-X.; Ye, X.-Z.; Xiao, W.-D.; Zhang, Q.; Wang, Q. The effect of biochar and crop straws on heavy metal bioavailability and plant accumulation in a Cd and Pb polluted soil. Ecotoxicol. Environ. Saf. 2016, 132, 94–100. [Google Scholar] [CrossRef]
  50. Msimbira, L.A.; Smith, D.L. The roles of plant growth promoting microbes in enhancing plant tolerance to acidity and alkalinity stresses. Front. Sustain. Food Syst. 2020, 4, 106. [Google Scholar] [CrossRef]
  51. Jacobs, D.F.; Timmer, V.R. Fertilizer-induced changes in rhizosphere electrical conductivity: Relation to forest tree seedling root system growth and function. New For. 2005, 30, 147–166. [Google Scholar] [CrossRef]
  52. Miller, J.; Beasley, B.; Larney, F.; Olson, B. Soil salinity and sodicity after application of fresh and composted manure with straw or wood-chips. Can. J. Soil Sci. 2005, 85, 427–438. [Google Scholar] [CrossRef]
  53. Piedallu, C.; Gégout, J.-C.; Bruand, A.; Seynave, I. Mapping soil water holding capacity over large areas to predict potential production of forest stands. Geoderma 2011, 160, 355–366. [Google Scholar] [CrossRef]
  54. Bravo, E.L.; Tijskens, E.; Suárez, M.H.; Cueto, O.G.; Ramon, H. Prediction model for non-inversion soil tillage implemented on discrete element method. Comput. Electron. Agric. 2014, 106, 120–127. [Google Scholar] [CrossRef]
  55. Fan, T.; Stewart, B.; Yong, W.; Luo, J.; Zhou, G. Long-term fertilization effects on grain yield, water-use efficiency and soil fertility in the dryland of Loess Plateau in China. Agric. Ecosyst. Environ. 2005, 106, 313–329. [Google Scholar] [CrossRef]
  56. Zhang, H.; Liu, Q.; Liu, S.; Li, J.; Geng, J.; Wang, L. Key soil properties influencing infiltration capacity after long-term straw incorporation in a wheat (Triticum aestivum L.)–maize (Zea mays L.) rotation system. Agric. Ecosyst. Environ. 2023, 344, 108301. [Google Scholar] [CrossRef]
  57. Ostmeyer, T.; Parker, N.; Jaenisch, B.; Alkotami, L.; Bustamante, C.; Jagadish, S.K. Impacts of heat, drought, and their interaction with nutrients on physiology, grain yield, and quality in field crops. Plant Physiol. Rep. 2020, 25, 549–568. [Google Scholar] [CrossRef]
  58. O’Neill, P.M.; Shanahan, J.F.; Schepers, J.S.; Caldwell, B. Agronomic responses of corn hybrids from different eras to deficit and adequate levels of water and nitrogen. Agron. J. 2004, 96, 1660–1667. [Google Scholar] [CrossRef]
  59. Elser, J.J.; Bracken, M.E.; Cleland, E.E.; Gruner, D.S.; Harpole, W.S.; Hillebrand, H.; Ngai, J.T.; Seabloom, E.W.; Shurin, J.B.; Smith, J.E. Global analysis of nitrogen and phosphorus limitation of primary producers in freshwater, marine and terrestrial ecosystems. Ecol. Lett. 2007, 10, 1135–1142. [Google Scholar] [CrossRef]
  60. Chen, X.; Yang, S.-H.; Jiang, Z.-W.; Ding, J.; Sun, X. Biochar as a tool to reduce environmental impacts of nitrogen loss in water-saving irrigation paddy field. J. Clean. Prod. 2021, 290, 125811. [Google Scholar] [CrossRef]
  61. Yang, S.; Li, F.; Malhi, S.S.; Wang, P.; Suo, D.; Wang, J. Long-term fertilization effects on crop yield and nitrate nitrogen accumulation in soil in northwestern China. Agron. J. 2004, 96, 1039–1049. [Google Scholar] [CrossRef]
  62. Zhou, M.; Butterbach-Bahl, K. Assessment of nitrate leaching loss on a yield-scaled basis from maize and wheat cropping systems. Plant Soil 2014, 374, 977–991. [Google Scholar] [CrossRef]
  63. Shi, Z.; Liu, D.; Luo, W.; Hafeez, M.B.; Li, J.; Wen, P.; Wang, X. Combined nitrogen and phosphorus management based on nitrate nitrogen threshold for balancing crop yield and soil nitrogen supply capacity. Agric. Ecosyst. Environ. 2022, 337, 108071. [Google Scholar] [CrossRef]
  64. Baligar, V.; Fageria, N.; He, Z. Nutrient use efficiency in plants. Commun. Soil Sci. Plant Anal. 2001, 32, 921–950. [Google Scholar] [CrossRef]
  65. Nishigaki, T.; Tsujimoto, Y.; Rinasoa, S.; Rakotoson, T.; Andriamananjara, A.; Razafimbelo, T. Phosphorus uptake of rice plants is affected by phosphorus forms and physicochemical properties of tropical weathered soils. Plant Soil 2019, 435, 27–38. [Google Scholar] [CrossRef]
  66. Lopez-Bucio, J.; De la Vega, O.M.; Guevara-Garcia, A.; Herrera-Estrella, L. Enhanced phosphorus uptake in transgenic tobacco plants that overproduce citrate. Nat. Biotechnol. 2000, 18, 450–453. [Google Scholar] [CrossRef] [PubMed]
  67. Jiang, B.; Jianlin, S.; Minghong, S.; Yajun, H.; Jiang, W.; Juan, W.; Yong, L.; Jinshui, W. Soil phosphorus availability and rice phosphorus uptake in paddy fields under various agronomic practices. Pedosphere 2021, 31, 103–115. [Google Scholar] [CrossRef]
  68. Borase, D.; Nath, C.; Hazra, K.; Senthilkumar, M.; Singh, S.; Praharaj, C.; Singh, U.; Kumar, N. Long-term impact of diversified crop rotations and nutrient management practices on soil microbial functions and soil enzymes activity. Ecol. Indic. 2020, 114, 106322. [Google Scholar] [CrossRef]
  69. Burns, R.G.; DeForest, J.L.; Marxsen, J.; Sinsabaugh, R.L.; Stromberger, M.E.; Wallenstein, M.D.; Weintraub, M.N.; Zoppini, A. Soil enzymes in a changing environment: Current knowledge and future directions. Soil Biol. Biochem. 2013, 58, 216–234. [Google Scholar] [CrossRef]
  70. Liu, Y.; Pan, Y.; Yang, L.; Ahmad, S.; Zhou, X. Stover return and nitrogen application affect soil organic carbon and nitrogen in a double-season maize field. Plant Biol. 2022, 24, 387–395. [Google Scholar] [CrossRef]
  71. Gianfreda, L.; Rao, M.A.; Piotrowska, A.; Palumbo, G.; Colombo, C. Soil enzyme activities as affected by anthropogenic alterations: Intensive agricultural practices and organic pollution. Sci. Total Environ. 2005, 341, 265–279. [Google Scholar] [CrossRef]
  72. Caldwell, B.A. Enzyme activities as a component of soil biodiversity: A review. Pedobiologia 2005, 49, 637–644. [Google Scholar] [CrossRef]
  73. Carter, M.R. Soil quality for sustainable land management: Organic matter and aggregation interactions that maintain soil functions. Agron. J. 2002, 94, 38–47. [Google Scholar] [CrossRef]
  74. Tisdall, J.M.; Oades, J.M. Organic matter and water-stable aggregates in soils. J. Soil Sci. 1982, 33, 141–163. [Google Scholar] [CrossRef]
  75. Haynes, R.; Beare, M. Influence of six crop species on aggregate stability and some labile organic matter fractions. Soil Biol. Biochem. 1997, 29, 1647–1653. [Google Scholar] [CrossRef]
  76. Saroa, G.; Lal, R. Soil restorative effects of mulching on aggregation and carbon sequestration in a Miamian soil in central Ohio. Land Degrad. Dev. 2003, 14, 481–493. [Google Scholar] [CrossRef]
  77. Tan, D.; Jin, J.; Huang, S.; Li, S.; He, P. Effect of long-term application of K fertilizer and wheat straw to soil on crop yield and soil K under different planting systems. Agric. Sci. China 2007, 6, 200–207. [Google Scholar]
  78. Cui, X.; Guo, L.; Li, C.; Liu, M.; Wu, G.; Jiang, G. The total biomass nitrogen reservoir and its potential of replacing chemical fertilizers in China. Renew. Sustain. Energy Rev. 2021, 135, 110215. [Google Scholar] [CrossRef]
  79. Wang, X.; Wang, X.; Geng, P.; Yang, Q.; Chen, K.; Liu, N.; Fan, Y.; Zhan, X.; Han, X. Effects of different returning method combined with decomposer on decomposition of organic components of straw and soil fertility. Sci. Rep. 2021, 11, 15495. [Google Scholar] [CrossRef]
  80. Jin, S.; Huang, Y.; Dong, C.; Bai, Y.; Pan, H.; Hu, Z. Effects of different straw returning amounts and fertilizer conditions on bacteria of rice’s different part in rare earth mining area. Sci. Rep. 2023, 13, 412. [Google Scholar] [CrossRef]
  81. Cui, X.; Zhang, Y.; Wu, J.; Peng, F. Research progress on the effects of returning straw to fields on soil quality and crop growth. Chin. J. Soil Sci. 2014, 45, 1527–1532. [Google Scholar]
  82. Qiu, J.; Chen, Y.; Feng, Y.; Li, X.; Xu, J.; Jiang, J. Adaptation of Rhizosphere Microbial Communities to Continuous Exposure to Multiple Residual Antibiotics in Vegetable Farms. Int. J. Environ. Res. Public Health 2023, 20, 3137. [Google Scholar] [CrossRef] [PubMed]
  83. Wang, J.; Cao, L.; Liu, Y.; Zhang, Q.; Ruan, R.; Luo, X. Effect of acclimatized paddy soil microorganisms using swine wastewater on degradation of rice straw. Bioresour. Technol. 2021, 332, 125039. [Google Scholar] [CrossRef] [PubMed]
  84. Faoro, H.; Alves, A.; Souza, E.; Rigo, L.; Cruz, L.; Al-Janabi, S.; Monteiro, R.; Baura, V.; Pedrosa, F. Influence of soil characteristics on the diversity of bacteria in the Southern Brazilian Atlantic Forest. Appl. Environ. Microbiol. 2010, 76, 4744–4749. [Google Scholar] [CrossRef] [PubMed]
  85. Yin, C.; Jones, K.L.; Peterson, D.E.; Garrett, K.A.; Hulbert, S.H.; Paulitz, T.C. Members of soil bacterial communities sensitive to tillage and crop rotation. Soil Biol. Biochem. 2010, 42, 2111–2118. [Google Scholar] [CrossRef]
  86. Chen, X.; Shi, C.; Han, X.; Wang, X.; Guo, Z.; Lu, X.; Zou, W.; Yan, J. Microbial Responses of Soil Fertility to Depth of Tillage and Incorporation of Straw in a Haplic Chernozem in Northeast China. Chin. Geogr. Sci. 2023, 33, 693–707. [Google Scholar] [CrossRef]
  87. Limon-Ortega, A.; Sayre, K.D.; Drijber, R.A.; Francis, C.A. Soil attributes in a furrow-irrigated bed planting system in northwest Mexico. Soil Tillage Res. 2002, 63, 123–132. [Google Scholar] [CrossRef]
  88. Dai, W.; Wang, J.; Fang, K.; Cao, L.; Sha, Z.; Cao, L. Wheat straw incorporation affecting soil carbon and nitrogen fractions in Chinese paddy soil. Agriculture 2021, 11, 803. [Google Scholar] [CrossRef]
  89. Björnsson, L.; Prade, T. Sustainable cereal straw management: Use as feedstock for emerging biobased industries or cropland soil incorporation? Waste Biomass Valorization 2021, 12, 5649–5663. [Google Scholar] [CrossRef]
  90. García-Gutiérrez, S.; García-Marco, S.; Jiménez-Horcajada, R.; Montoya, M.; Vallejo, A.; Guardia, G. Maize residue input rather than cover cropping influenced N2O emissions and soil–crop N dynamics during the intercrop and cash crop periods. Agric. Ecosyst. Environ. 2024, 363, 108873. [Google Scholar] [CrossRef]
  91. Chen, H.; Yang, L.; Mickan, B.S.; Li, Z.; Zhang, F. Long–term (25 years) continuous cotton cropping combined with residue incorporation affects the fungal communities in reclaimed saline soil. Pedobiologia 2024, 102, 150928. [Google Scholar] [CrossRef]
  92. Ahmad, A.; Arif, M.S.; Shahzad, S.M.; Yasmeen, T.; Shakoor, A.; Iqbal, S.; Riaz, A.; Zahid, A.; Chapman, S.J. Long-term raw crop residue but not burned residue incorporation improved soil multifunctionality in semi-arid agroecosystems. Soil Tillage Res. 2024, 240, 106073. [Google Scholar] [CrossRef]
  93. Lin, H.; Zhou, M.; Zeng, F.; Xu, P.; Ma, S.; Zhang, B.; Li, Z.; Wang, Y.; Zhu, B. How do soil organic carbon pool, stock and their stability respond to crop residue incorporation in subtropical calcareous agricultural soils? Agric. Ecosyst. Environ. 2022, 332, 107927. [Google Scholar] [CrossRef]
  94. Choudhary, V.; Gurjar, D.; Meena, R.S. Crop residue and weed biomass incorporation with microbial inoculation improve the crop and soil productivity in the rice (Oryza sativa L.)-toria (Brassica rapa L.) cropping system. Environ. Sustain. Indic. 2020, 7, 100048. [Google Scholar] [CrossRef]
  95. Canalli, L.B.d.S.; Santos, J.B.d.; Silva, A.A.; Muchinski, A.; Feliciano, E.; Penteado, D. Residues decomposition in crop rotations under no-till system. Braz. Arch. Biol. Technol. 2020, 63, e20190609. [Google Scholar] [CrossRef]
Figure 1. Effect of nitrogen fertilization on yield of oilseed rape cultivars Mianyou 305 and Mianyou 15. CK, (N0P0); T1, (N0P90); T2, (N60P90); T3, (N120P90); and T4, (N180P90). Data are the means of three measurements, and numbers are mean ± standard deviation from three replicates. Lowercase letter on each bar indicates a significant difference between all treatments (Tukey HSD, p < 0.05).
Sustainability 16 05580 g001
Figure 2. Dry weight of oilseed rape cultivars in different nitrogen treatments Mianyou 305 and Mianyou 15. CK, (N0P0); T1, (N0P90); T2, (N60P90); T3, (N120P90); and T4, (N180P90). Data are the means of three measurements, and numbers are mean ± standard deviation from three replicates. Lowercase letter on each bar indicates a significant difference between all treatments (Tukey HSD, p < 0.05).
Sustainability 16 05580 g002
Figure 3. Impact of nitrogen fertilization on soil enzymes activity in an oilseed rape field. (A) Laccase activity, (B) CMCase activity, (C) Amylase activity, (D) Xylanase activity, and (E) Alkaline phosphatase activity. CK, (N0P0); T1, (N0P90); T2, (N60P90); T3, (N120P90); and T4, (N180P90). Data are the means of three measurements, and numbers are mean ± standard deviation from three replicates. Lowercase letter on each bar indicates a significant difference between all treatments (Tukey HSD, p < 0.05).
Sustainability 16 05580 g003
Figure 4. Impact of nitrogen fertilization on organic matter and lignocellulose content in an oilseed rape field. (A) Organic matter (%); (B) Cellulose; (C) Hemicellulose; and (D) lignin content. CK, (N0P0); T1, (N0P90); T2, (N60P90); T3, (N120P90); and T4, (N180P90). Data are the means of three measurements, and numbers are mean ± standard deviation from three replicates. Lowercase letter on each bar indicates a significant difference between all treatments (Tukey HSD, p < 0.05).
Sustainability 16 05580 g004
Figure 5. Impact of nitrogen fertilization on relative abundance of the bacterial phylum. CK, (N0P0); T1, (N0P90); T2, (N60P90); T3, (N120P90); and T4, (N180P90).
Sustainability 16 05580 g005
Figure 6. Principal component analysis of bacterial composition (order level). CK, (N0P0); T1, (N0P90); T2, (N60P90); T3, (N120P90); and T4, (N180P90).
Sustainability 16 05580 g006
Table 1. Impact of nitrogen fertilization on yield parameters of Mianyou 305 and Mianyou 15.
CultivarsTreatmentsMain BranchPrimary and Secondary Branches
Number of PodsNumber of Grains1000-Grains WeightNumber of BranchesNumber of PodsNumber of Grains1000-Grains Weight
Mianyou 305CK64 ± 7.54 c1567 ± 110 d3.05 ± 0.20 a5 ± 0.58 c81 ± 11.2 e2299 ± 122 d3.85 ± 1.68 c
T168 ± 5.03 c1647 ± 302 c3.42 ± 0.53 a5 ± 0.52 c109 ± 9.54 d2349 ± 223 d4.28 ± 1.55 b
T278 ± 15.50 b1714 ± 102 b3.49 ± 0.09 a7 ± 0.64 b168 ± 8.71 c3133 ± 168 c4.42 ± 2.06 b
T378 ± 8.96 b1776 ± 336 b3.56 ± 0.13 a8 ± 0.78 b185 ± 13.6 b3776 ± 731 b5.46 ± 1.89 ab
T491 ± 11.51 a2502 ± 874 a3.62 ± 0.12 a14 ± 1.16 a384 ± 10.5 a7047 ± 445 a6.56 ± 0.79 a
Mianyou 15CK62 ± 9.64 d1431 ± 300 d3.53 ± 0.13 b3 ± 1.0 d67 ± 3.46 e1119 ± 156 d3.59 ± 0.12 c
T180 ± 6.19 c1515 ± 336 c3.68 ± 0.81 b4 ± 1.5 d120 ± 27.7 d2368 ± 276 c3.71 ± 0.36 c
T287 ± 3.60 b1714 ± 749 b3.74 ± 0.43 b5 ± 1.0 c159 ± 27.1 c3133 ± 168 b4.13 ± 1.34 b
T386 ± 2.64 bc1780 ± 222 b4.07 ± 0.19 a6 ± 0.3 b203 ± 36.9 b3318 ± 482 b4.21 ± 1.47 b
T4101 ± 19.5 a2026 ± 265 a4.89 ± 0.54 a8 ± 2.0 a267 ± 91.5 a4827 ± 582 a6.87 ± 2.56 a
Notes: CK, (N0P0); T1, (N0P90); T2, (N60P90); T3, (N120P90); and T4, (N180P90). Data are the means of three measurements, and numbers are mean ± standard deviation from three replicates. Lowercase letter in a column of data indicates a significant difference between all treatments (Tukey HSD, p < 0.05).
Table 2. Nitrogen using efficiency of oilseed rape cultivars.
TreatmentsMianyou 305Mianyou 15
NAE
(kg Nkg−1)
NUE
(%)
NPE
(kg Nkg−1)
NAE
(kg Nkg−1)
NUE
(%)
NPE
(kg Nkg−1)
CK------
T1------
T28.43 a25.50 c33.04 b11.16 a19.83 c56.23 a
T38.39 a36.42 b46.07 a6.49 b32.42 b40.05 b
T42.56 b42.24 a18.14 c3.69 c38.24 a28.91 c
Notes: NAE (nitrogen agronomic efficiency), NUE (nitrogen use efficiency); and NPE (nitrogen physiological efficiency); CK, (N0P0); T1, (N0P90); T2, (N60P90); T3, (N120P90); and T4, (N180P90). Data are the means of three measurements, and numbers are mean ± standard deviation from three replicates. Lowercase letter in a column of data indicates a significant difference between all treatments (Tukey HSD, p < 0.05).
Table 3. Impact of nitrogen fertilization on soil physiochemical properties.
TreatmentspHEC (dS/m)WHC (%)BD (g/cm3)SP (%)
CK7.79 ± 0.05 a0.07 ± 0.01 e21.36 ± 2.12 d1.32 ± 0.02 a41.88 ± 1.90 c
T17.30 ± 0.04 e0.14 ± 0.01 b32.65 ± 1.98 b1.08 ± 0.02 b62.32 ± 2.12 a
T27.45 ± 0.05 c0.13 ± 0.01 b32.99 ± 2.57 b1.06 ± 0.11 b63.92 ± 2.19 a
T37.38 ± 0.03 d0.16 ± 0.01 b30.19 ± 2.23 c1.14 ± 0.21 b58.63 ± 2.82 b
T47.59 ± 0.06 b0.18 ± 0.01 a34.85 ± 2.32 a1.04 ± 0.11 b65.39 ± 2.56 a
Notes: EC, soil electrical conductivity; WHC, water holding capacity; SP, soil porosity; CK, (N0P0); T1, (N0P90); T2, (N60P90); T3, (N120P90); and T4, (N180P90). Data are the means of three measurements, and numbers are mean ± standard deviation from three replicates. Lowercase letter in a column of data indicates a significant difference between all treatments (Tukey HSD, p < 0.05).
Table 4. Impact of nitrogen fertilization on soil nutrients.
TreatmentsTN (mg/kg)NN (mg/kg)AN (mg/kg)TP (mg/kg)AP (mg/kg)
CK480.6 ± 6.59 d14.1 ± 1.58 c12.4 ± 1.89 d446.6 ± 27 d12.2 ± 1.67 c
T1682.6 ± 9.46 c14.2 ± 2.16 c17.4 ± 2.06 c675.8 ± 19 c30.5 ± 1.76 b
T2818.6 ± 12.2 b15.3 ± 2.28 c22.4 ± 2.35 b1049 ± 29 b31.6 ± 2.49 b
T3839.5 ± 7.76 b23.1 ± 2.33 b26.3 ± 1.66 a1168 ± 32 a31.3 ± 2.22 b
T4926.3 ± 12.2 a25.3 ± 2.30 a27.7 ± 2.53 a1195 ± 29 a34.3 ± 2.32 a
Notes: TN, total nitrogen; NN, Nitrate nitrogen; AN, available nitrogen; TP, total phosphorus; AP, available phosphorus; CK, (N0P0); T1, (N0P90); T2, (N60P90); T3, (N120P90); and T4, (N180P90). Data are the means of three measurements, and numbers are mean ± standard deviation from three replicates. Lowercase letter in a column of data indicates a significant difference between all treatments (Tukey HSD, p < 0.05).
Table 5. Impact of nitrogen fertilization on bacterial alpha diversity.
TreatmentsValid SequencesOTUsChao1Simpson
CK122,112 ± 365 a114 ± 18 b3212 ± 112 b0.05 ± 0.01 b
T1101,985 ± 556 b117 ± 25 b3217 ± 195 b0.02 ± 0.01 c
T2 98,634 ± 532 c101 ± 12 c3012 ± 145 d0.01 ± 0.01 c
T3102,125 ± 523 b128 ± 12 a3841 ± 125 a0.21 ± 0.03 a
T4100,365 ± 668 b105 ± 13 c3115 ± 142 c0.06 ± 0.01 b
Notes: CK, (N0P0); T1, (N0P90); T2, (N60P90); T3, (N120P90); and T4, (N180P90). Data are the means of three measurements, and numbers are mean ± standard deviation from three replicates. Lowercase letter in a column of data indicates a significant difference between all treatments (Tukey HSD, p < 0.05).
Table 6. Impact of nitrogen fertilization on bacterial composition.
TreatmentsPhylumClassOrderFamilyGenus
CK52 ± 1.74 a151 ± 06.23 a312 ± 11.23 a472 ± 22.18 a719 ± 42.12 a
T148 ± 2.14 b142 ± 11.12 c299 ± 10.96 b427 ± 29.65 c624 ± 34.12 c
T249 ± 2.98 b141 ± 09.23 c291 ± 09.66 c421 ± 14.52 d602 ± 22.45 d
T350 ± 4.12 ab148 ± 09.65 b310 ± 09.24 a445 ± 31.55 b642 ± 54.26 b
T450 ± 3.12 ab140 ± 08.51 c290 ± 08.65 c402 ± 18.22 e603 ± 19.45 d
Notes: CK, (N0P0); T1, (N0P90); T2, (N60P90); T3, (N120P90); and T4, (N180P90). Data are the means of three measurements, and numbers are mean ± standard deviation from three replicates. Lowercase letter in a column of data indicates a significant difference between all treatments (Tukey HSD, p < 0.05).
Table 7. Comparison of current study with similar studies in the literature.
StudyDesignEnvironmental ConditionsResults on Straw DegradationResults on Crop YieldMethodological ApproachesAdvantagesDisadvantages
Current StudyShort-term field experimentCold winter, Southwest ChinaSignificant enhancement with optimized NIncreased yield of oilseed rapeStandardized N and P levels, multiple N treatmentsRegional focus, practical application insights, detailed enzyme activity analysisShort-term duration, specific to Southwest China
Chen et al. [86]Short-term field experimentCold climate, Northeast ChinaModerate improvement with N additionConsistent yield increase over yearsVariation in conventional tillage and straw incorporationShort-term insights, broader environmental applicabilityLimited enzyme activity analysis, high variability in conditions
Limon-Ortega et al. [87]Long-term field experimentArid conditions, Northern MexicoLimited impact with N fertilizationVariable yield resultsStandardized N and P levelsInsights for arid conditions, practical recommendationsLong-term duration, specific to arid regions
Dai et al. [88]Short-term crop rotation studySubtropical climate, Southern ChinaImproved soil organic carbon and microbial biomassEnhanced yield over multiple cropsCrop rotation, single-year assessmentShort-term crop insights, nutrient cycling understandingComplex interaction effects, regional focus
Björnsson and Prade [89]Multi-site field experimentCold climate climates, SwedenVariable results based on siteYield improvement at most sitesStandardized protocols across sitesBroad applicability, multi-site validationHigh variability, site-specific recommendations
García-Gutiérrez et al. [90]Field studyMediterranean climate, SpainMaize residue was incorporated into soilYield improved in N-fertilized treatmentsCrop rotation single-year assessmentShort-term crop insights, GHG emission analysisSpecific regional focus, without assessing the degradation rate of maize residues
Chen et al. [91]Long-term field studyCold climate, NorthCotton residue was incorporated into soilIncreased yield over several yearsLong-term, detailed environmental monitoringLong-term insights to reclaim saline soilRegional focus, limited to cold climate regions
Ahmad et al. [92]Field study with different residuesSemi-arid climate, PakistanEnhanced degradation Yield improvement with residue managementDiverse residue types, practical agricultural implicationsLong-term insights to improve soil multifunctionalitySoil metagenomics and enzymes were not analyzed
Lin et al. [93]Field studySubtropical climate, Southwest ChinaCrop residues increased SOC up to 25%Organic improvement notedDiverse residue types, wheat-maize rotationLong-term field study focusing on soil organic carbonModerate field applicability, Crop residue degradation rate was not determined
Choudhary et al. [94]Field study over multiple seasonsRain-fed climate, IndiaMixed residue incorporation increased available NYield increases with crop residue returnMulti-season dataLong-term field study focusing on crop yield and biomassLimited long-term insights, soil physiochemical properties were not explained
Canalli et al. [95]Crop residue management studyHumid climate, BrazilImproved degradation with mixed managementYield improvement with residue techniquesPractical recommendations, humid climate focusApplicability to humid regions, practical insightsShort-term duration, specific to humid conditions
Disclaimer/Publisher’s Note: The statements, opinions and data contained in all publications are solely those of the individual author(s) and contributor(s) and not of MDPI and/or the editor(s). MDPI and/or the editor(s) disclaim responsibility for any injury to people or property resulting from any ideas, methods, instructions or products referred to in the content.

