Article

Analysis of Water Quality Prediction in the Yangtze River Delta under the River Chief System

1
School of Law, Fuzhou University, Fuzhou 350116, China
2
School of Business, Taizhou University, Taizhou 318000, China
*
Author to whom correspondence should be addressed.
Sustainability 2024, 16(13), 5578; https://doi.org/10.3390/su16135578
Submission received: 18 April 2024 / Revised: 7 June 2024 / Accepted: 27 June 2024 / Published: 29 June 2024

Abstract

:
Water quality prediction is essential for effective water resource management and pollution prevention. In China, research on predictive analytics for various water bodies has not kept pace with environmental needs. This study addresses this gap by conducting a comprehensive analysis and modeling of water quality monitoring data from multiple distributed water bodies specifically within the Yangtze River Delta. Using a novel approach, this paper introduces a distributed water quality prediction system enhanced by a CNN-LSTM joint model. This model synergistically combines convolutional neural networks (CNN) and long short-term memory (LSTM) networks to robustly extract and utilize spatiotemporal data, thereby significantly improving the accuracy of predicting dynamic water quality trends. Notably, the excellent predictive performance of the joint model enables its prediction results to achieve RMSE and MAPE as low as 1.08% and 6.8%, respectively. Empirical results from this study highlight the system’s superior predictive performance. Based on these findings, this paper offers targeted recommendations for water quality monitoring, treatment, and management strategies tailored to the specific needs of the Yangtze River Delta. These contributions are poised to aid policymakers and environmental managers in making more informed decisions.

1. Introduction

Water is a crucial resource for human survival and development. However, water pollution has become a global environmental problem, causing serious harm to ecosystems and human society. In China, distributed water bodies in various regions, as important economic and ecological resources, have increasingly prominent water quality issues. Water quality prediction has become a key means to solve water problems but currently faces challenges such as low data quality and complex water quality changes [1,2,3,4].
With the rapid development of current models, more and more scholars are using intelligent algorithms to construct water quality prediction models. Early research on water quality prediction mainly focused on statistical models and machine learning methods such as linear regression and support vector machines. However, these methods have limitations in dealing with nonlinear relationships and dynamic changes in water quality data. In order to overcome these problems, researchers have begun to introduce deep learning methods into the field of water quality prediction. Pan et al. [5] built a water quality prediction model based on a recurrent neural network and a convolutional neural network, which improved the accuracy of water quality prediction.
Subsequently, although deep learning methods have achieved certain results in water quality prediction, traditional neural network models face difficulties in processing time series data. In order to solve this problem, Wang et al. [6] applied a long short-term memory network (LSTM) to water quality prediction, established a water quality prediction model based on this LSTM, and obtained better results than deep learning methods. However, the prediction performance of a single LSTM network model is limited. In order to improve the performance of the LSTM water quality prediction model and improve its generalization ability, researchers have begun to attempt to introduce recurrent neural networks and long short-term memory networks into water quality prediction models. However, the predictive performance of a single LSTM network model is still limited. In order to further improve predictive performance and generalization ability, some researchers have begun to explore methods of combining an LSTM with other models. For example, Chen et al. [7] constructed an AT-LSTM model based on an attention mechanism to predict the dissolved oxygen characteristics of the Burnett River, which greatly improved the prediction accuracy compared to traditional methods; Zhang et al. [8] introduced an attention mechanism for bidirectional feature extraction of water quality time series data and constructed a Bi-LSTM model that significantly improved the accuracy of water quality prediction. Qi et al. [9] built an LSTM-RNN model to monitor water quality parameters.
At the same time, inspired by the joint management of distributed waters by the river length system in China, we find that there is a certain correlation between the water quality of distributed waters, that is, the rich spatiotemporal information contained in distributed water bodies has not been fully utilized. For this situation, a distributed water quality prediction method based on spatiotemporal correlation was proposed, a distributed water quality prediction system was constructed, and a CNN-LSTM joint prediction model and its training algorithm and input–output data structure were designed. The research results indicate that the system proposed in this article has significant advantages in water quality prediction.

2. Materials and Methods

2.1. Introduction to Water Quality Characteristics

The selection of water quality characteristics has a decisive impact on water quality prediction research. In existing research in the literature and actual water quality monitoring work, water pH (pH), ammonia nitrogen concentration (NH4), permanganate index (COD), and dissolved oxygen (DO) are mainly used as water quality evaluation characteristics [10]. However, each indicator has unique advantages and limitations [11,12,13,14,15,16,17,18]. For example, the pH value of a water body, a simple and easily measurable indicator, can intuitively reflect the acidity and alkalinity of the water body but lacks specificity and comprehensiveness. The concentration of ammonia nitrogen, an important indicator reflecting the content of organic waste in water, has direct indicative properties but is greatly affected by temperature and biological factors. The permanganate index, an indicator of organic matter concentration, has high sensitivity but requires high operational requirements and lacks specificity. Dissolved oxygen, a key indicator for evaluating the health of aquatic ecosystems, has ecological sensitivity but is greatly influenced by temperature and biological factors.

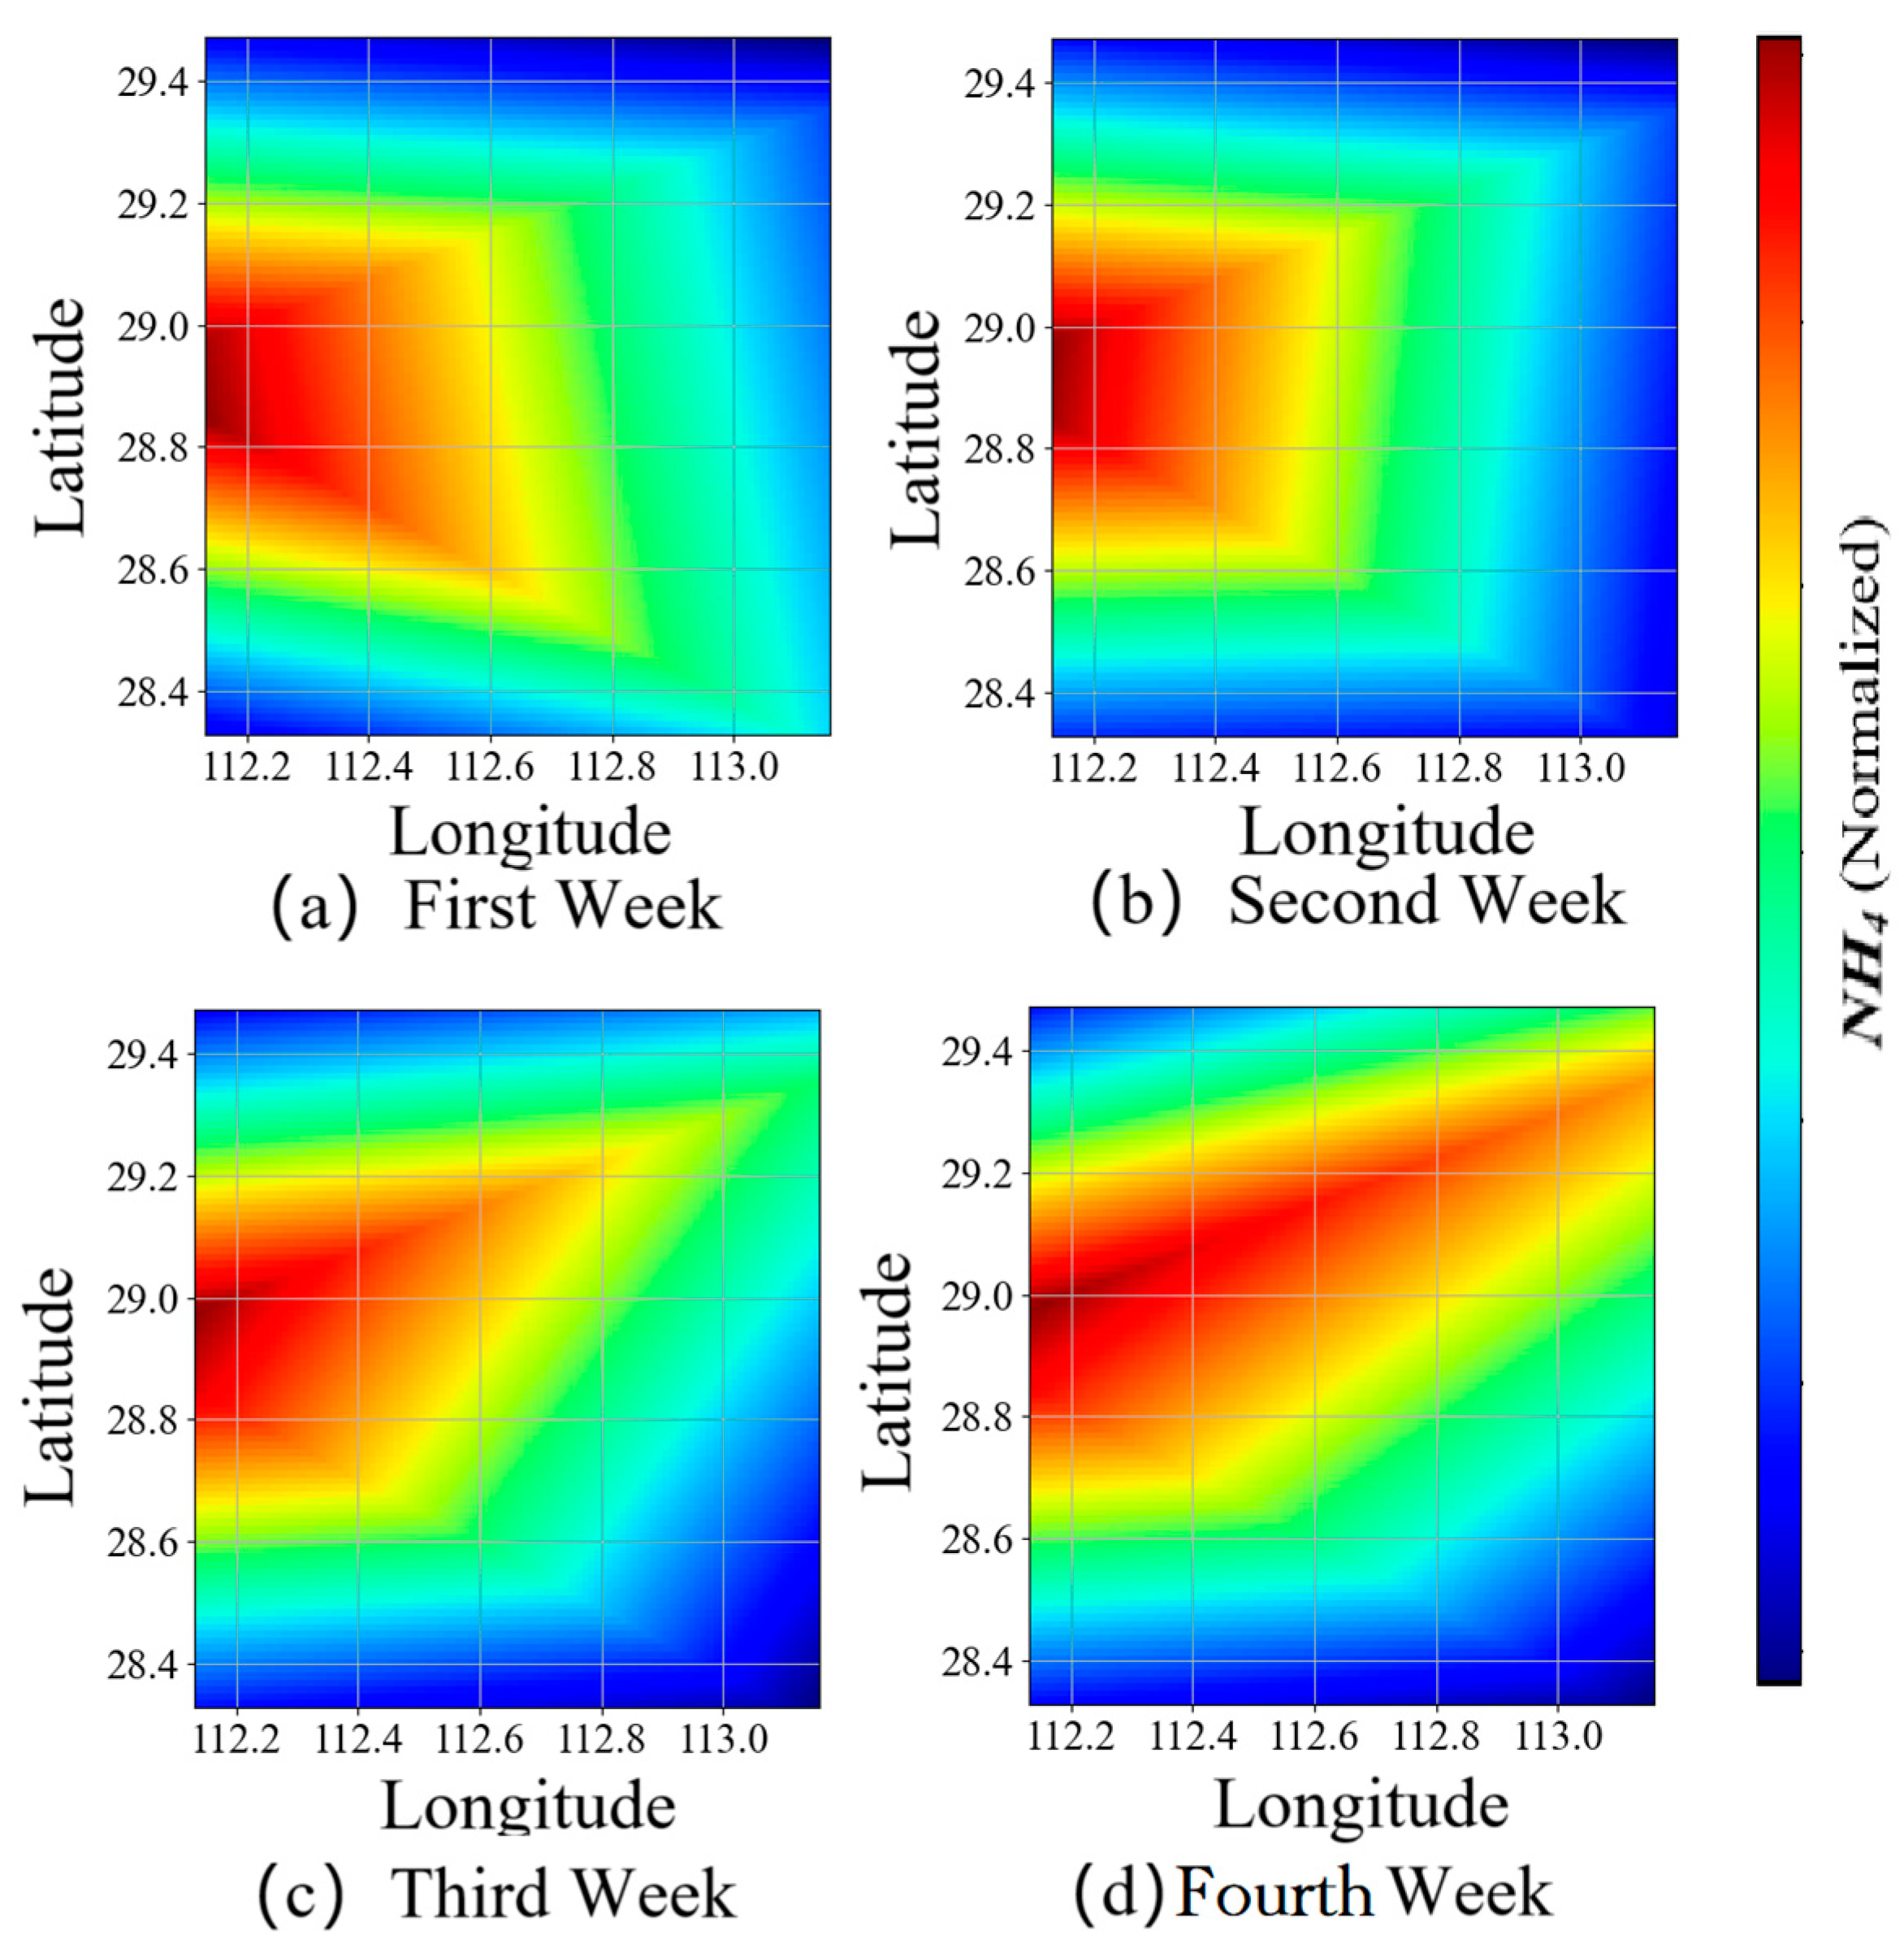
2.2. Analysis of Spatiotemporal Correlation of Water Quality Characteristics

Within a certain range of nature, the flow of water systems has significant spatiotemporal correlations. This correlation originates from the continuous circulation and flow of water on the surface, including processes such as evaporation, precipitation, groundwater recharge, and river movement [19]. Due to these complex and continuous movements, water quality characteristics inevitably exhibit significant correlations within a certain spatiotemporal range. To analyze and verify the spatiotemporal correlation of water quality characteristics, this article takes the water quality characteristics of five stations in central China as an example for analysis. The heat map of the water quality characteristic distribution is drawn in Figure 1.
In Figure 1d, it can be seen that over time, the NH4 value in the southeast water area gradually decreases, while the NH4 value in the northeast water area gradually increases. In other words, the NH4 change in the water system flows back from the southeast water area to the central western region and then flows towards the northeast region. It can be clearly seen from the heat map that the water flow direction of the NH4 index, that is, the water quality characteristics, shows spatiotemporal correlation within a certain range with the flow of the water system.
In summary, the fluidity of natural water bodies endows significant spatiotemporal information to the water quality characteristics of adjacent water bodies. This spatiotemporal information is rooted in the dynamic changes of water bodies in geographical locations and time scales, reflecting the rich connotations of water system flow trends. In this context, the spatiotemporal correlation between water body features can be extracted to reveal the interrelationships and driving mechanisms between water quality features at different spatial and temporal scales, providing effective support for distributed water quality prediction models in adjacent water bodies.

2.3. Traditional Forecasting Model
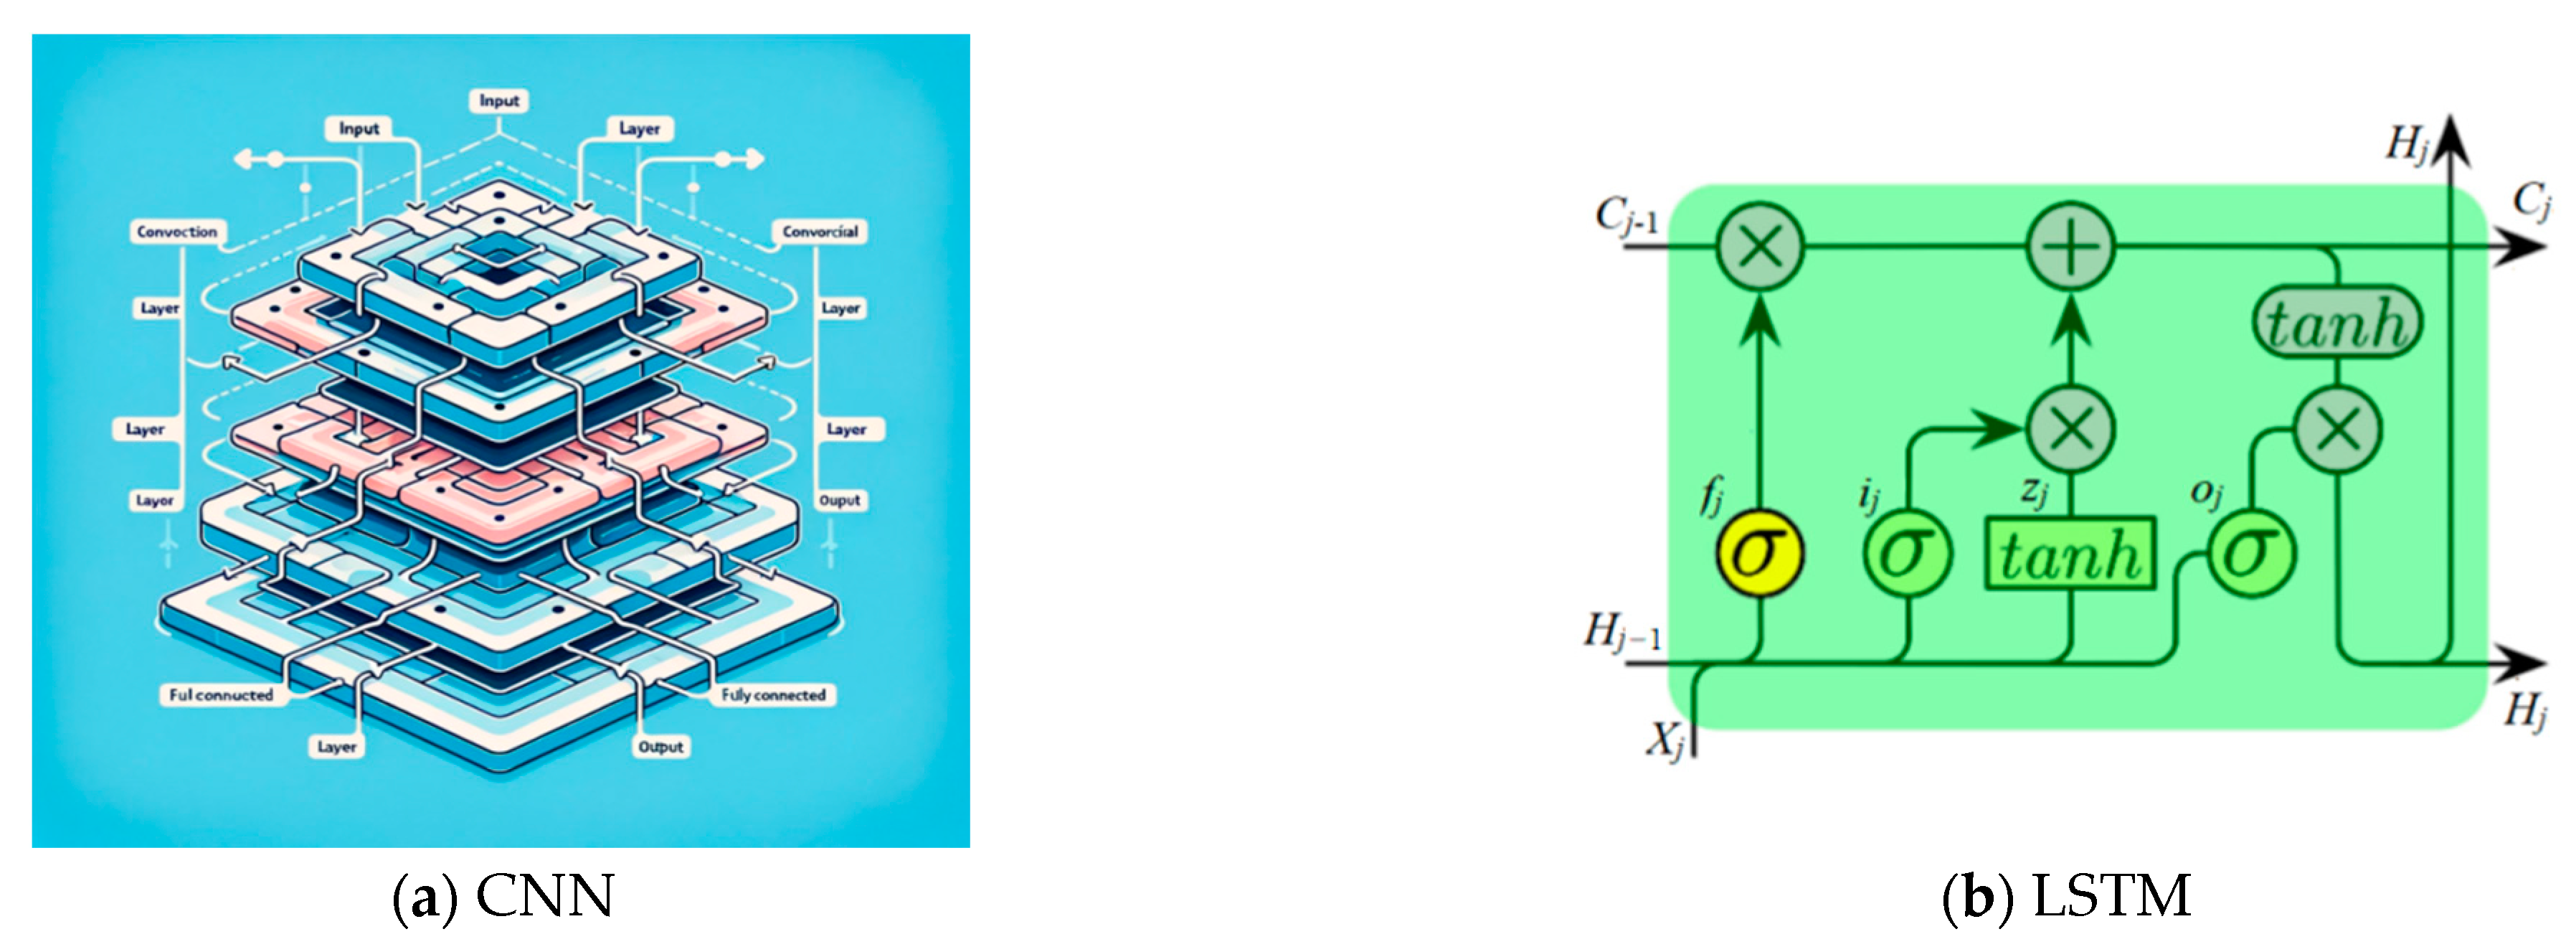
As shown in Figure 2a, a convolutional neural network [20,21,22] (CNN) is a special type of deep learning model mainly composed of an input layer, a convolutional layer, an activation function layer, a pooling layer, and a fully connected layer. The convolutional layer and pooling layer filter data and extract useful information, the activation layer outputs nonlinear mapping characteristics, the pooling layer selects the most representative features, and the fully connected layer summarizes the learned features and maps them into a two-dimensional output. These five layers make the CNN have a local connection, weight sharing, and pooling downsampling characteristics. In water quality prediction, the local connection and weight sharing characteristics of the CNN can help the network identify local features in water bodies, such as water flow and pollutants. Pooled downsampling can help reduce the dimensionality of data, filter irrelevant information, and improve the generalization ability of the model. Therefore, by applying CNN to water quality prediction, water quality changes can be more accurately predicted, providing strong support for water resource management and protection.
Long short-term memory (LSTM) is a special recurrent neural network (RNN) structure that, unlike standard RNNs, can effectively handle long-term dependency problems. In standard RNN, the input of each time step and the hidden state of the previous time step are fed to the next time step. This can help the network remember previous information, but if the sequence is too long, it will be difficult for the network to effectively maintain its memory of past information. The LSTM solves this problem by introducing gating mechanisms, enabling it to better remember long-term dependencies. In addition, the standard RNN model is also prone to gradient vanishing or exploding problems, which limits the learning effect. Therefore, this article includes LSTM as the time series prediction model.
The cell structure diagram of the LSTM is shown in Figure 2b [23,24,25]. Each LSTM cell has three corresponding forget gates fj, input gates ij, and output gates oj. The weight parameters of the model are Wf, Wi, and Wo, and the bias parameters of the model are bf, bi, and bo.

2.4. CNN-LSTM Model

Water quality information exhibits periodicity over time and is influenced by multiple factors, exhibiting a non-linear trend. However, using the LSTM model alone may lead to the introduction of noise unrelated to water quality prediction and may cause the model to be influenced by larger and smaller values in the time series, thereby affecting the prediction performance. On the other hand, although the independent use of CNN models can effectively extract local features from water quality information, they do not have a sensitivity to the temporal order of water quality information.
Considering that the water quality characteristics of distributed water bodies within a certain range can be regarded as graphical features distributed along longitude and latitude, it is necessary to consider the temporal correlation of flow in each water body. Traditional standalone training models like CNN and LSTM have not been trained based on spatiotemporal correlations. In light of this, this article proposes a joint prediction model that combines the graphic feature extraction of the CNN model and the time series prediction of the LSTM model, aiming to fully utilize the advantages of both to improve the accuracy and robustness of water quality prediction by extracting the spatiotemporal correlations. The model principle is shown in Figure 3.
The training data input for the CNN-LSTM model is a real-time comprehensive information matrix Dj (j = K, K − 1, …, Kn + 1) that includes the water quality characteristics of all distributed water measurement points. n is the number of information matrices trained each time, and K is the total number of current information matrices. The width of the information matrix is the number of measurement points included in the input data, and the height is the number of features in the input data. The core of CNN is a convolutional group composed of convolutional layers and pooling layers. In this paper, multiple convolutional groups are constructed to sequentially extract deep-level features and reduce the dimensionality of the input information matrix. To fully utilize the data from each water measurement point, the receptive field height of the convolution group is set so that it is consistent with the height of the information matrix. After convolving Dj (j = K, K − 1, …, Kn + 1) through multiple convolution groups, the deep feature Fj (j = K, K − 1, …, Kn + 1) is obtained. To meet the input requirements of the LSTM, an unfolding layer is set to concatenate and unfold the deep features into one-dimensional feature vectors Xj (j = K, K − 1, …, Kn + 1) in rows as the input of the LSTM. Among them, for the first cell in the LSTM tandem cell group, its cell state Cj−1 and the previous cell output Hj−1 are usually set to 0. Finally, the output Hj of the LSTM cell tandem group is input into the fully connected layer, and the water quality prediction sequence values are mapped through the fully connected layer.

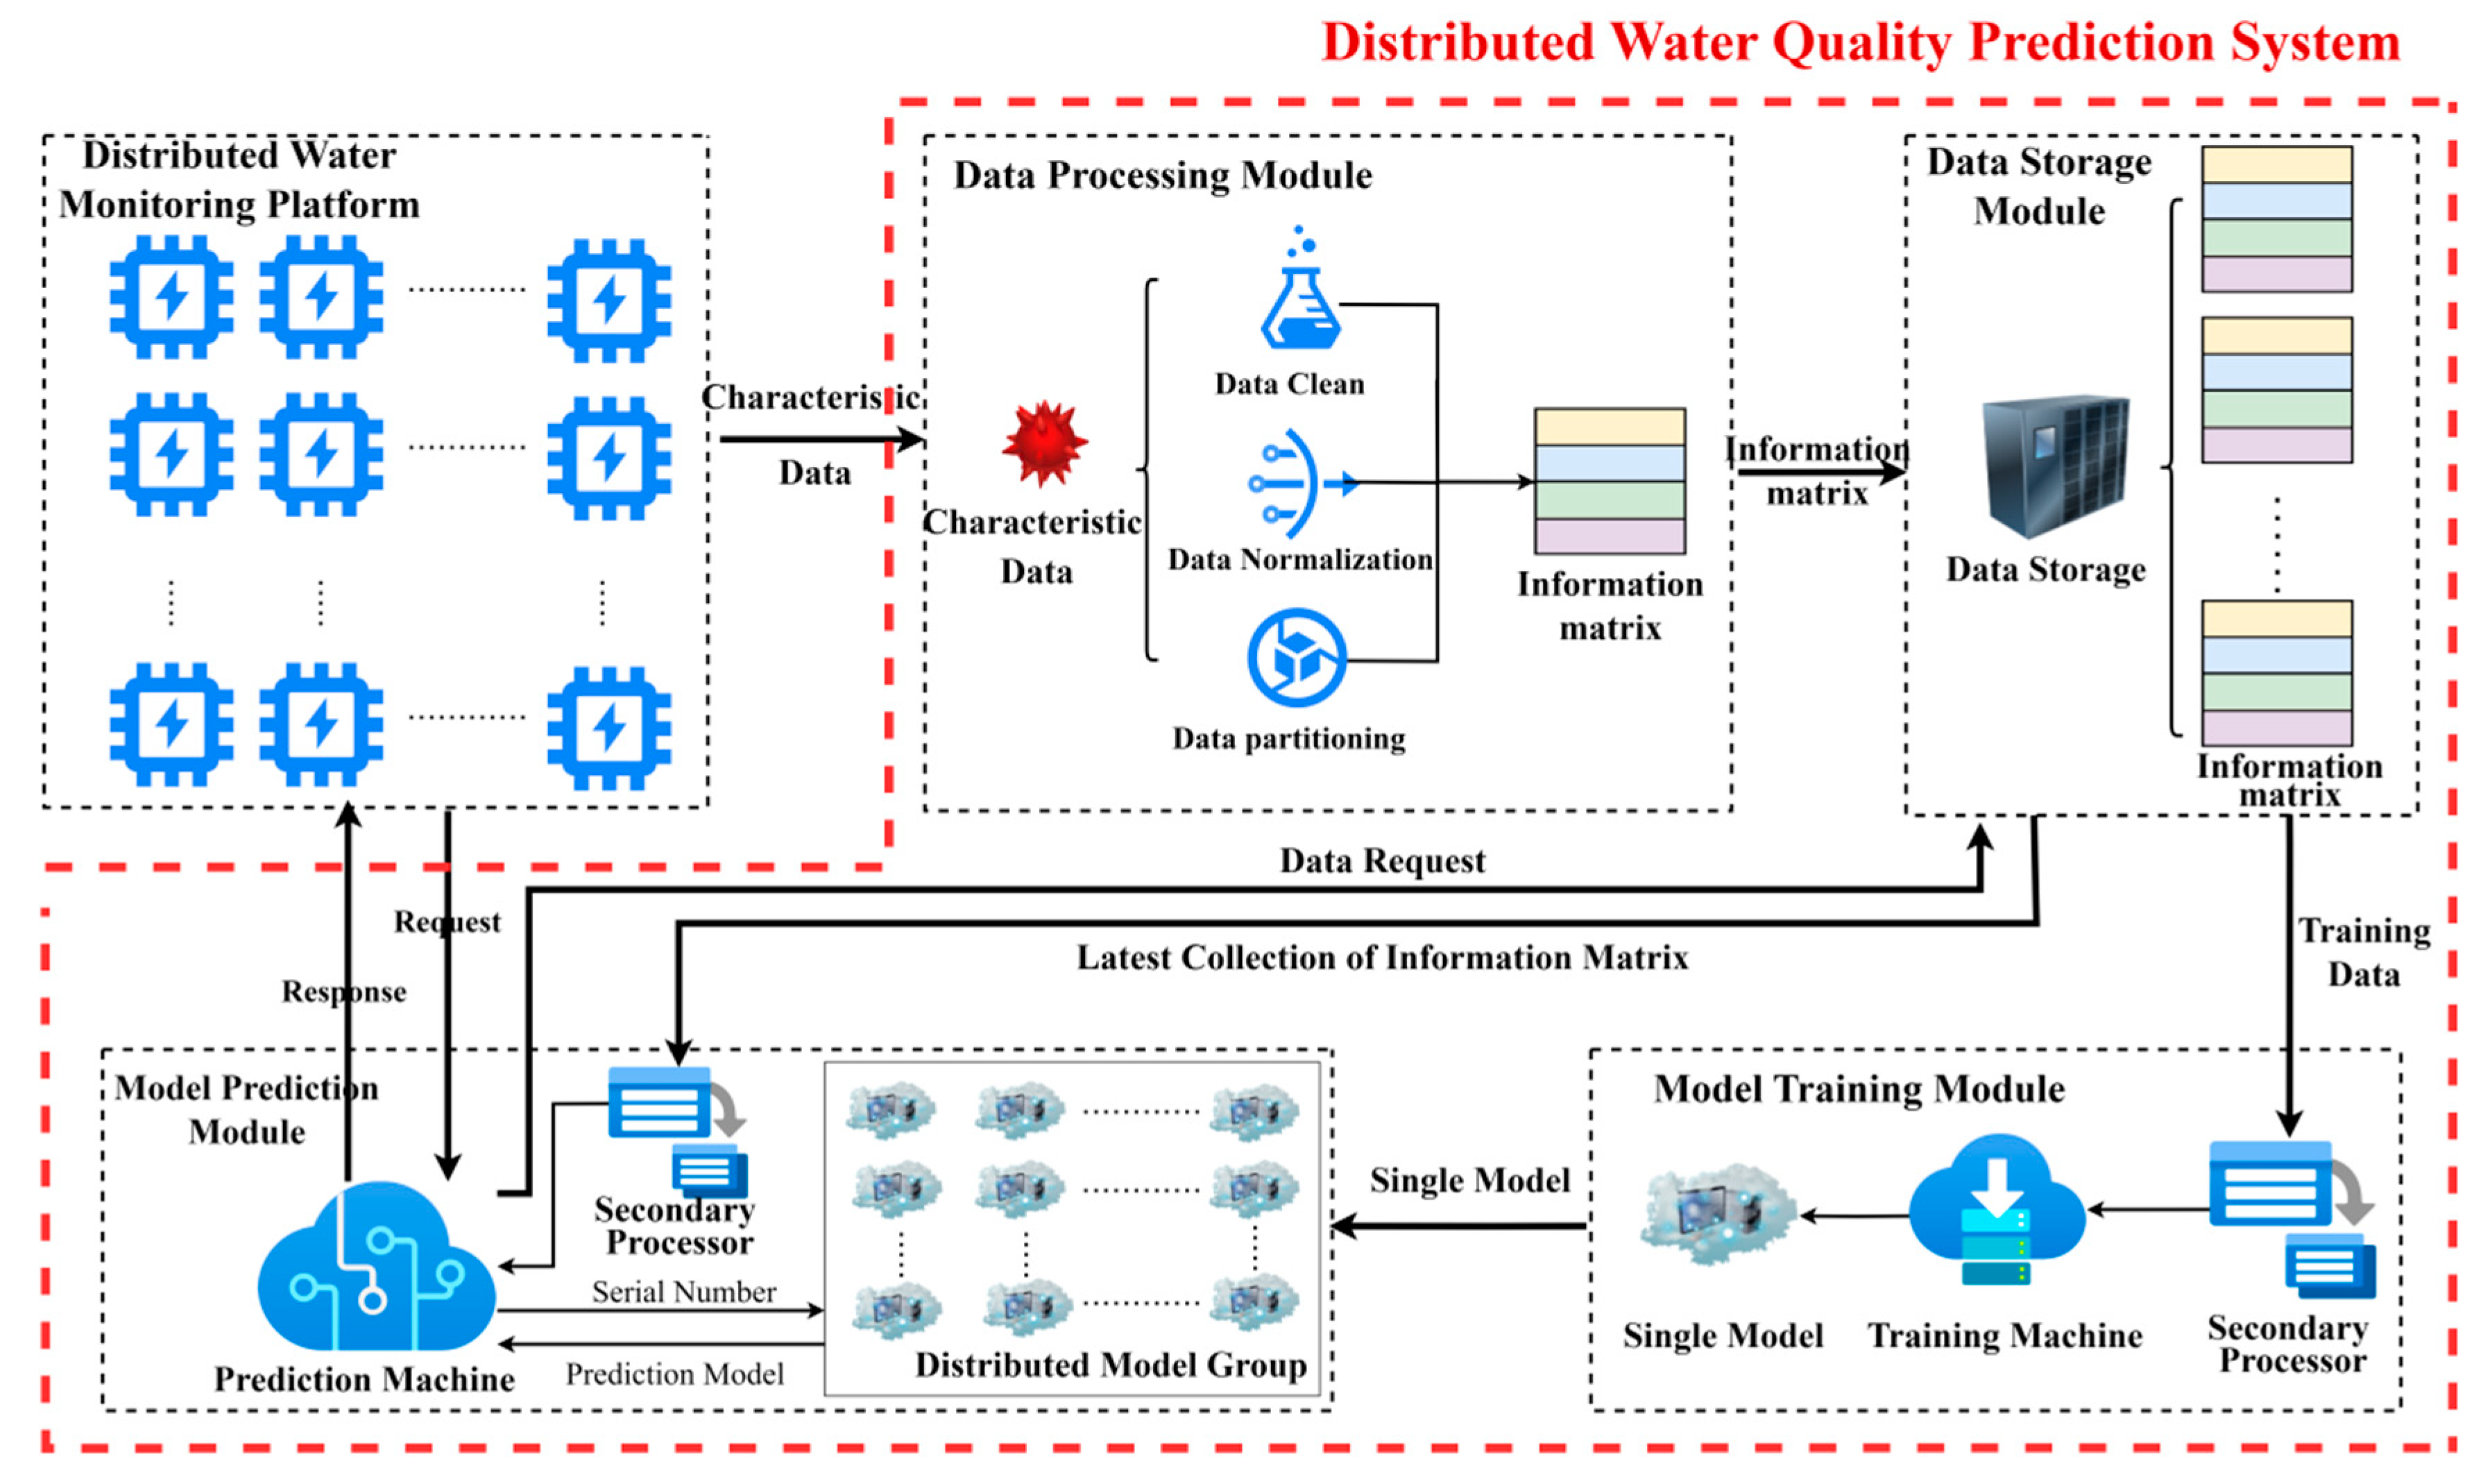
2.5. Architecture of Distributed Water Quality Feature Prediction System

In order to achieve the distributed water quality prediction method based on spatiotemporal correlation mentioned above, the overall architecture of the distributed water quality prediction system is constructed as shown in Figure 4.
The prediction system mainly includes a data preprocessing module, a data storage module, a model training module, and a power prediction module.
The specific descriptions of the functions of each module are as follows:
The data preprocessing module receives and clarifies the distributed water quality characteristic data, normalizes the data, and divides the dataset to form a real-time information matrix, which is then transmitted to the data storage module.
The data storage module stores the historical information matrix and updates it in real time while providing the required dataset for model training and power prediction based on the requests of the model training module and power prediction module.
In the model training module, the secondary processor performs secondary processing on the training data, which is then fed into the model trainer for model training. Each distributed water monitoring point can train a prediction model, which is transmitted to the water quality prediction module for unified storage.
In the water quality prediction module, the water quality predictor receives prediction requests sent by the distributed water monitoring platform, extracts the prediction model based on the water sequence number, and receives the latest comprehensive information matrix set after secondary processing. The water quality prediction value sequence is calculated and transmitted to the monitoring platform.

2.6. Data Preprocessing

This study includes water quality data from the automatic monitoring weekly report provided by the China Environmental Monitoring Station in the Yangtze River Basin from 1 January 2016 to 30 December 2018 as model testing data. The collection frequency of this data is one time per week.
To ensure the accuracy of the model training data, it is necessary to clean and normalize the data source, partition the dataset, and finally perform data restoration processing. The detailed steps are as follows.
(1)
Data cleaning
Considering that the obtained data may be lost or have anomalies causing prediction errors, the data are first preprocessed. Interpolation is used to fill in the missing parts of the data, and the Rayda criterion is mainly used to handle outliers. Duplicate data are deleted.
(2)
Data normalization
In order to avoid the influence of certain outliers, the original data are normalized and mapped between the range [−1, 1], so that the model converges faster and improves its stability. The formula is as follows:
X norm * = X X min X max X min ,
In the formula, Xnorm* is the normalized indicator; X represents the data before normalization; Xmin is the minimum value of the total sample; Xmax is the maximum value of the total sample.
(3)
Partition dataset
To improve the performance of the evaluation model and prevent overfitting, dividing the training and validation sets in a 9:1 ratio means using the first 90% of the sample data for training the model and the remaining 10% for validating the model’s performance.
(4)
Data restoration.
When evaluating the model after training, the normalized data are restored according to Equation (1) to determine the error of the model’s predicted values. The specific formula is as follows (2):
X = X norm * X max X min + X min
In order to better evaluate the predictive performance of the model, this article uses commonly used regression model evaluation indicators, including mean absolute error (MAE), root mean square error (RMSE), and goodness of fit (R-square, R2) to evaluate the experimental results.

3. Results

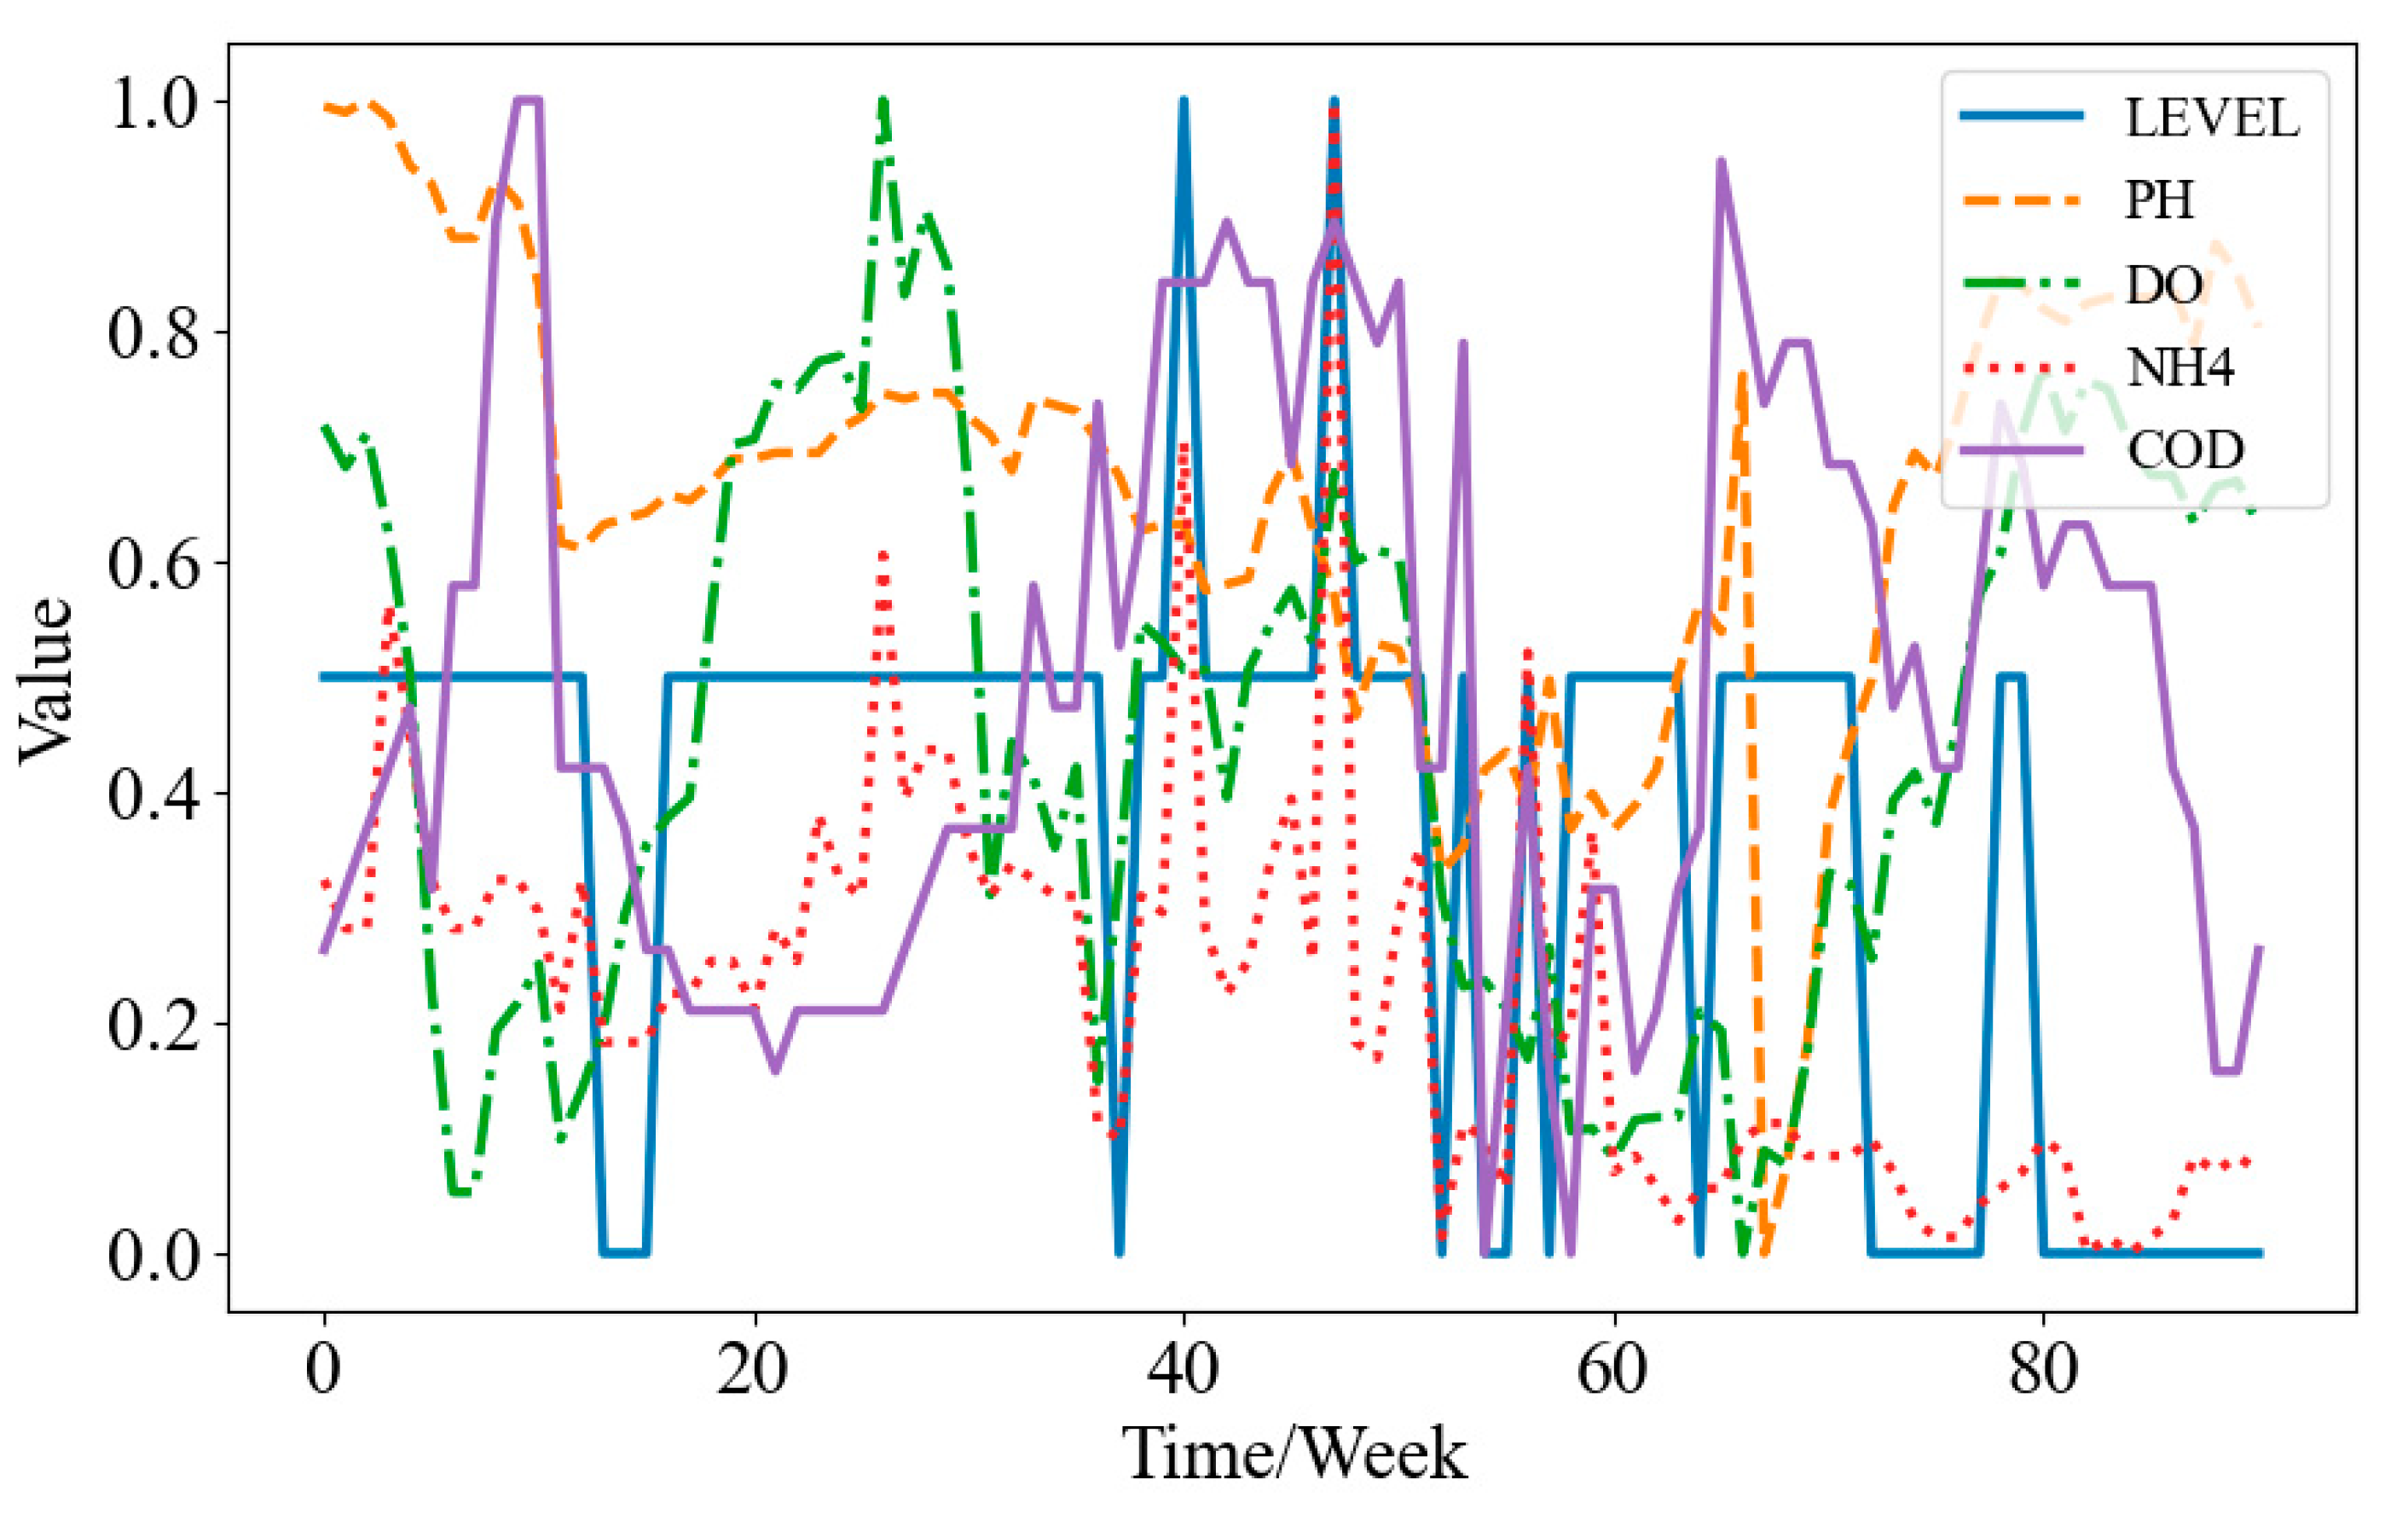
3.1. Selection of Indicators

Therefore, in order to objectively and effectively select indicators for the training of the model, this article combines data-driven thinking and assists in the selection of indicators by calculating the Pearson correlation coefficient between each indicator. Among them, monitoring data of various indicators from a water source in central China from 2016 to 2018 were selected as the data source, including water quality health level (LEVEL), pH, DO, NH4, and COD, with a sampling frequency of one time per week. At the same time, in order to conduct sufficient and effective correlation discrimination and avoid experimental randomness, this article normalized all indicator data to 0–1 and calculated the Pearson correlation coefficients between the four indicators and LEVEL at 25%, 50%, 75%, and 100% of the data volume. The schematic diagrams of each indicator and the final results are shown in Figure 5 and Table 1, respectively.
From the table, it can be seen that the Pearson correlation coefficients of the pH, DO, and COD indicators underwent significant changes with the increase in data volume and are generally at a low level, indicating poor stability of the above three indicators and low correlation with water quality and health category indicators. On the other hand, the NH4 indicator did not show significant changes with the increase in data volume and generally remained at a high level (between 0.63 and 0.68), indicating strong stability and strong correlation with water quality and health category indicators. In summary, this article includes the NH4 index as the key water quality characteristic index for subsequent water quality prediction research.

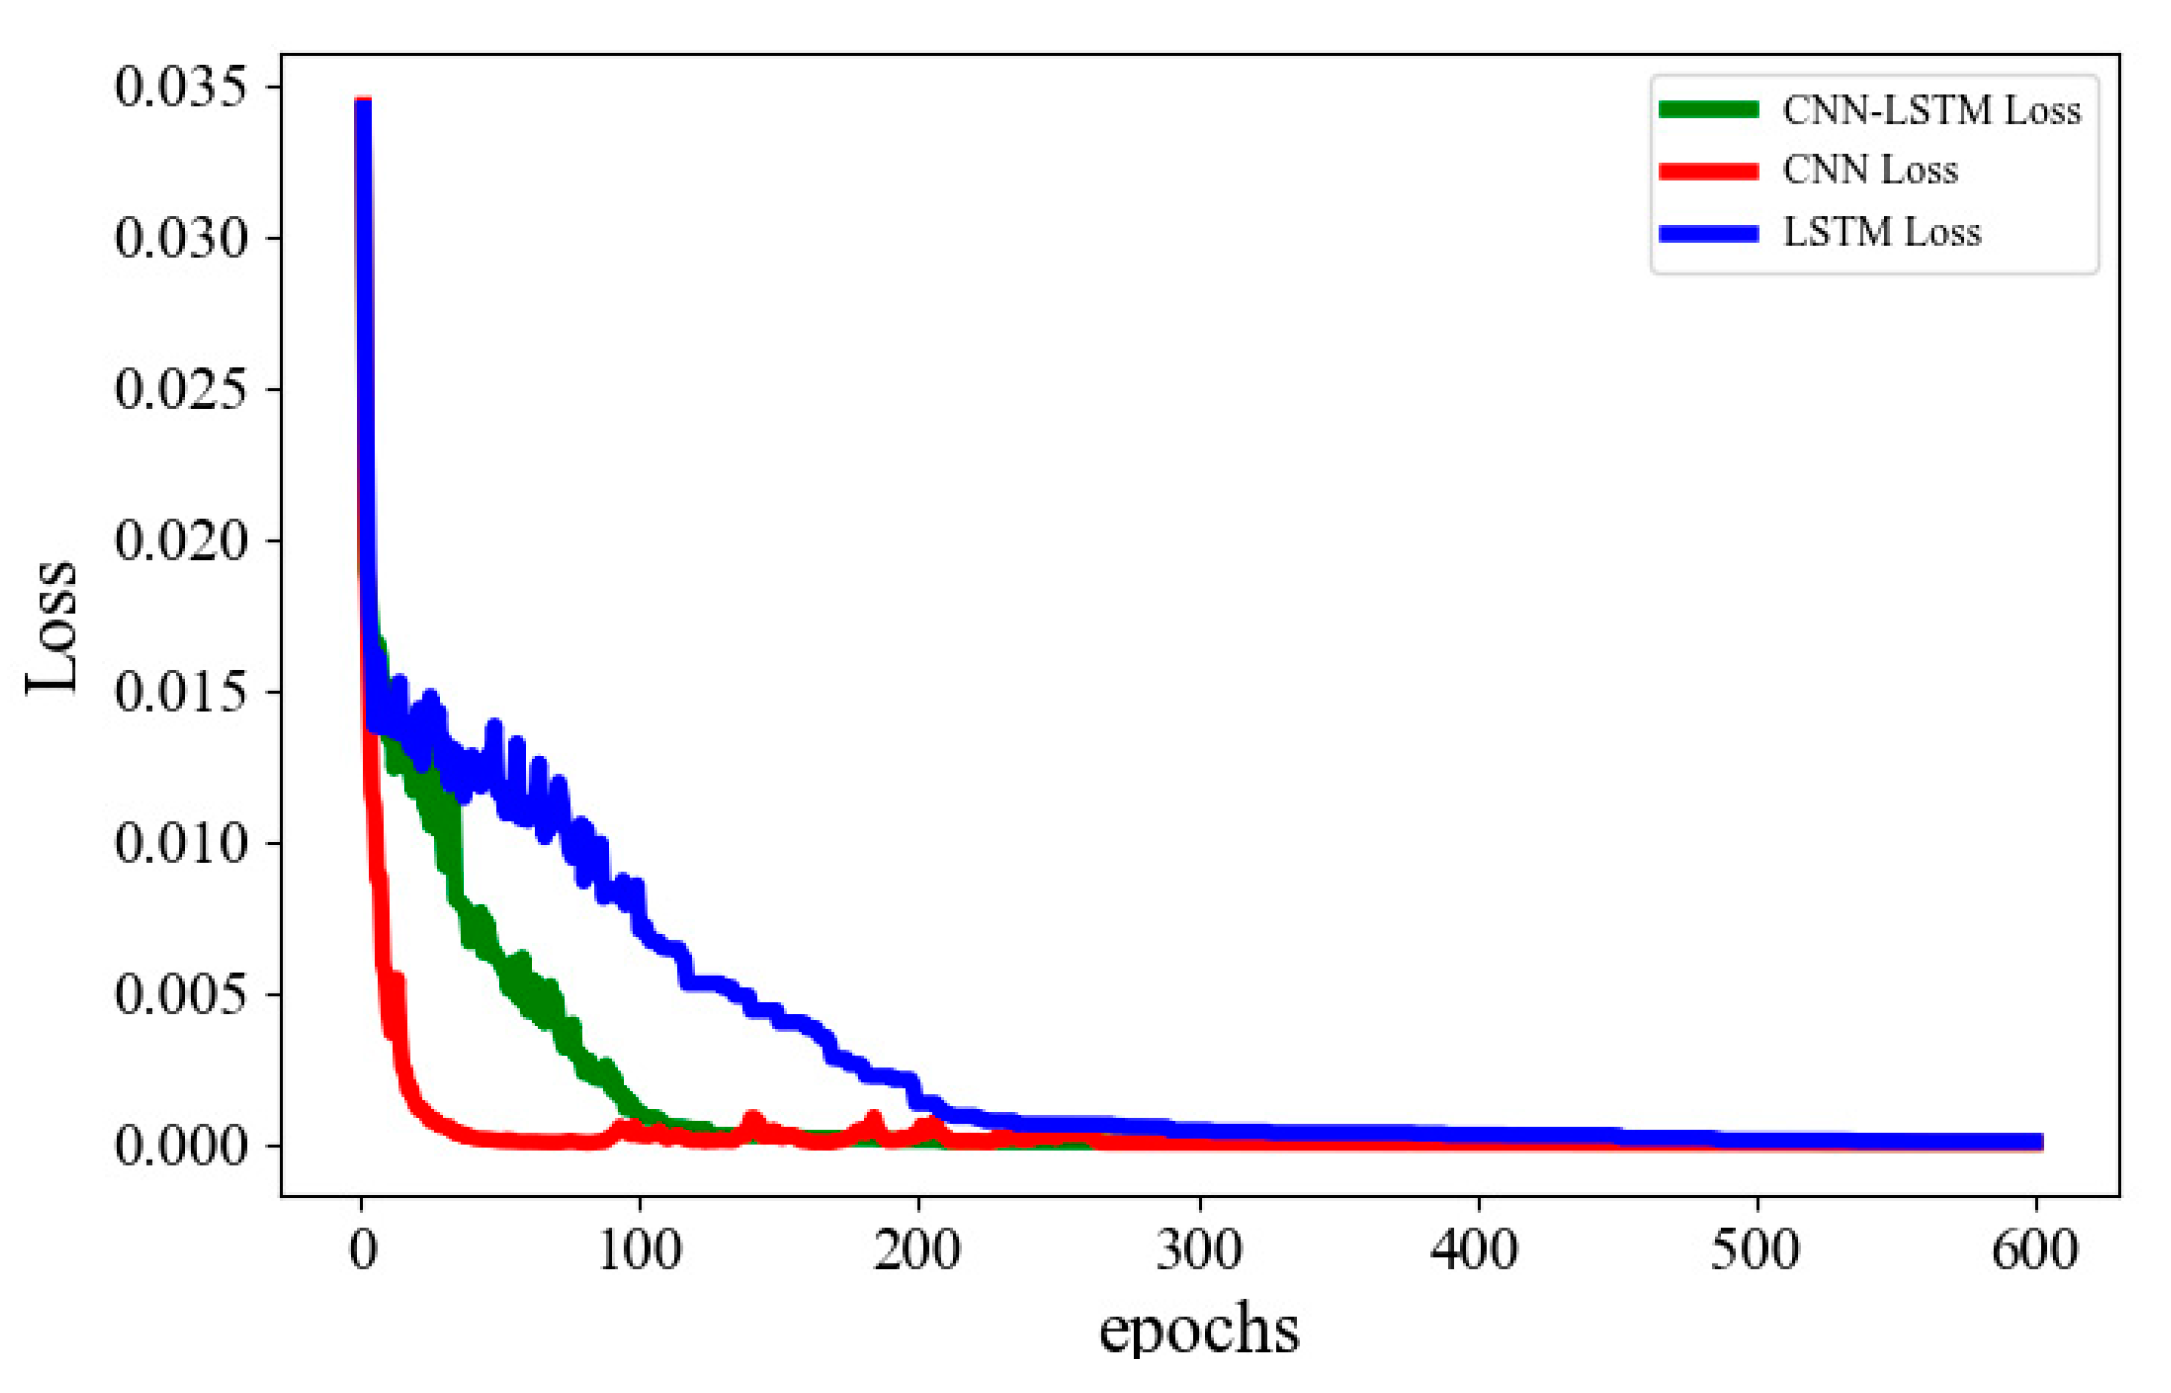
3.2. Prediction Results and Analysis

Figure 6 shows the loss curves of the CNN, LSTM, and CNN-LSTM models. From the graph, it can be observed that as the number of iterations increases, the loss of the CNN model decreases more rapidly, followed by the CNN-LSTM model, and the loss of the LSTM model decreases more slowly. However, the CNN model still exhibits small fluctuations at 200 epochs, while the CNN-LSTM model stabilizes at its minimum value at 120 epochs.
Based on the actual training process, this article sets the training parameters for the CNN-LSTM model as follows: the total number of epochs for training is 600, the batch size for a single training is two, the initial learning rate is 0.001, and the optimization algorithm uses the Adam (Adam optimization algorithm) algorithm.
Based on the above parameters, the final prediction performance of each model is shown in Figure 7, and the indicators for recording the prediction results are shown in Table 2. As shown in the figure, compared to the CNN model and the LSTM model, the prediction curve of the CNN-LSTM model is obviously more in line with the actual water quality curve.
From the data dimension, it can be seen that the MAPE and RMSE of the CNN-LSTM model are much lower than those of the CNN model and LSTM model (about 1/4 of the latter two). The CNN model is similar to the LSTM model. Meanwhile, the R2 of CNN-LSTM is as high as 0.99, and both the CNN and LSTM models are around 0.92. Obviously, the above data further confirm the superiority of the CNN-LSTM model in distributed water quality prediction. At the same time, the CNN-LSTM model using distributed data from multiple water sites for prediction shows a better prediction effect than the CNN-LSTM model using only data from a single site. This indicates that, compared with the traditional method, the water quality information of other distributed stations introduced in the prediction method in this paper does not interfere with the prediction effect. On the contrary, the prediction accuracy is significantly improved by analyzing the spatiotemporal correlation information contained therein.

4. Discussion

From the prediction results in the previous section and the overall trend of water quality, it can be seen that the water quality in the region fluctuates greatly and that the water quality health status is at a relatively low level. Based on the viewpoints described in this article, the following suggestions are given:
(1)
Strengthen monitoring and prediction of water quality and health: Based on the accuracy of the CNN-LSTM prediction model, we have sufficient technical capabilities to establish a sound water quality monitoring network, strengthen the real-time monitoring of water bodies and generate early warnings if necessary, timely detect and treat water pollution problems, and ensure the normalization of water quality safety.
(2)
Integrated water quality management in the region: Based on the above research, it is evident that there is a strong spatiotemporal correlation between the water quality indicators of various water bodies. When carrying out water body governance, it is necessary to comprehensively consider the governance plans for distributed water bodies, elevate this perspective regarding water body governance, adopt a holistic approach, and improve the overall water quality within the region.
(3)
Strengthen water source protection: establish water source protection zones, no-breeding zones, etc., strengthen the management and protection of water source areas, and avoid social activities that pollute water bodies.
(4)
Strengthen sewage treatment: invest in the construction of sewage treatment facilities, adopt advanced technologies to treat urban sewage, reduce pollutant emissions, and protect the health of water ecosystems.
(5)
Promote rational utilization of water resources: optimize water resource allocation, strengthen water resource protection and conservation, improve water resource utilization efficiency, and reduce exploitation and consumption of the Yangtze River water body.
(6)
Strengthen ecological protection in the watershed: protect the wetlands, forests, and other ecosystems in the watershed, repair degraded ecological environments, enhance the ecological function of the watershed, and purify water bodies.

5. Conclusions

In response to the shortcomings of traditional water quality prediction methods that do not utilize the spatiotemporal correlation of surrounding water bodies, this paper proposes a distributed water quality prediction method based on spatiotemporal correlation, constructs a distributed water quality prediction system, and designs a CNN-LSTM joint prediction model, its training algorithm, and an input–output data structure. Through actual case testing at a water station in a certain area of East China, it has been verified that the method proposed in this article can accurately achieve distributed water quality predictions. In addition, optimization suggestions for subsequent water quality control in the region have been provided based on the predicted results.

Author Contributions

Writing—original draft preparation, G.W.; writing—review and editing, C.Z. All authors have read and agreed to the published version of the manuscript.

Funding

This research was funded by the National Social Science Fund of China, grant number “18BFX175”.

Institutional Review Board Statement

Not applicable.

Informed Consent Statement

Not applicable.

Data Availability Statement

All the data are in the paper.

Acknowledgments

We thank the editors and reviewers.

Conflicts of Interest

The authors declare no conflicts of interest.

References

  1. Zheng, L.; Chen, J.; Chen, F.; Chen, B.; Xue, W.; Guo, P.; Li, J. Rotating machinery fault prediction method based on Bi-LSTM and attention mechanism. In Proceedings of the 2019 IEEE International Conference on Energy Internet (ICEI), Nanjing, China, 27–31 May 2019; IEEE: Nanjing, China, 2019; pp. 53–58. [Google Scholar]
  2. Heidari, A.; Khovalyg, D. Short-term energy use prediction of solar-assisted water heating system: Application case of combined attention-based LSTM and time-series decomposition. Sol. Energy 2020, 207, 626–639. [Google Scholar] [CrossRef]
  3. Beverly, C.; Roberts, A.; Bennett, F.R. Assessing the feasibility and net costs of achieving water quality targets: A case study in the Burnett-Mary region, Queensland, Australia. In Proceedings of the 2016 International Nitrogen Initiative Conference, “Solutions to Improve Nitrogen Use Efficiency for the World”, Melbourne, Australia, 4–8 December 2016. [Google Scholar]
  4. Abbaspour, K.C.; Yang, J.; Maximov, I.; Siber, R.; Bogner, K.; Mieleitner, J.; Zobrist, J.; Srinivasan, R. Modelling hydrology and water quality in the pre-alpine/alpine Thur watershed using SWAT. J. Hydrol. 2007, 333, 413–430. [Google Scholar] [CrossRef]
  5. Pan, M.Y.; Zhou, H.N.; Cao, J.Y.; Liu, Y.; Hao, J.; Li, S.; Chen, C.H. Water level prediction model based on GRU and CNN. IEEE Access 2020, 8, 60090–60100. [Google Scholar] [CrossRef]
  6. Wang, Y.; Zhou, J.; Chen, K.; Wang, Y.; Liu, L. Water quality prediction method based on LSTM neural network. In Proceedings of the 2017 12th International Conference on Intelligent Systems and Knowledge Engineering (ISKE), Nanjing, China, 24–26 November 2017; IEEE: Nanjing, China, 2017; pp. 1–5. [Google Scholar]
  7. Chen, H.; Yang, J.; Fu, X.; Zheng, Q.; Song, X.; Fu, Z.; Wang, J.; Liang, Y.; Yin, H.; Liu, Z.; et al. Water quality prediction based on LSTM and attention mechanism: A case study of the burnett river, australia. Sustainability 2022, 14, 13231. [Google Scholar] [CrossRef]
  8. Zhang, Q.; Wang, R.; Qi, Y.; Wen, F. A watershed water quality prediction model based on attention mechanism and Bi-LSTM. Environ. Sci. Pollut. Res. 2022, 29, 75664–75680. [Google Scholar] [CrossRef] [PubMed]
  9. Qi, C.; Huang, S.; Wang, X. Monitoring water quality parameters of Taihu Lake based on remote sensing images and LSTM-RNN. IEEE Access 2020, 8, 188068–188081. [Google Scholar] [CrossRef]
  10. Rahaman, M.F.; Ali, M.S.; Arefin, R.; Mazumder, Q.H.; Majumder, R.K.; Jahan, C.S. Assessment of drinking water quality characteristics and quality index of Rajshahi city, Bangladesh. Environ. Dev. Sustain. 2020, 22, 3957–3971. [Google Scholar] [CrossRef]
  11. Gao, Y.; Qian, H.; Ren, W.; Wang, H.; Liu, F.; Yang, F. Hydrogeochemical characterization and quality assessment of groundwater based on integrated-weight water quality index in a concentrated urban area. J. Clean. Prod. 2020, 260, 121006. [Google Scholar] [CrossRef]
  12. Gorgan-Mohammadi, F.; Rajaee, T.; Zounemat-Kermani, M. Decision tree models in predicting water quality parameters of dissolved oxygen and phosphorus in lake water. Sustain. Water Resour. Manag. 2023, 9, 1. [Google Scholar]
  13. Chong, L.; Zhong, J.; Sun, Z.; Hu, C. Temporal variations and trends prediction of water quality during 2010–2019 in the middle Yangtze river, China. Environ. Sci. Pollut. Res. 2023, 30, 28745–28758. [Google Scholar] [CrossRef] [PubMed]
  14. Navasakthi, S.; Pandey, A.; Dandautiya, R.; Hasan, M.; Khan, M.A.; Perveen, K.; Alam, S.; Garg, R.; Qamar, O. Assessment of spatial and temporal variation in water quality for the Godavari river. Water 2023, 15, 3076. [Google Scholar] [CrossRef]
  15. Tenebe, I.T.; Julian, J.P.; Emenike, P.C.; Dede-Bamfo, N.; Maxwell, O.; Sanni, S.E.; Babatunde, E.O.; Alves, D.D. Multi-dimensional surface water quality analyses in the Manawatu river Catchment, New Zealand. Water 2023, 15, 2939. [Google Scholar] [CrossRef]
  16. Athauda, A.M.N.; Abinaiyan, I.; Liyanage, G.Y.; Bandara, K.R.V.; Manage, P.M. Spatio-temporal variation of water quality in the Yan Oya River basin, Sri Lanka. Water Air Soil Pollut. 2023, 234, 207. [Google Scholar] [CrossRef]
  17. Zhang, D.; Chang, R.; Wang, H.; Wang, Y.; Wang, H.; Chen, S. Predicting water quality based on EEMD and LSTM networks. In Proceedings of the 2021 33rd Chinese Control and Decision Conference (CCDC), Kunming, China, 22–24 May 2021; pp. 2372–2377. [Google Scholar]
  18. Alahakoon, A.M.P.B.; Nibraz, M.M.; Gunarathna, P.M.S.S.B.; Thenuja, S.; Kahandawaarchchi, K.A.D.C.P.; Gamage, N.D.U. Water quality index based prediction of ground water properties for safe consumption. In Proceedings of the 2020 2nd International Conference on Advancements in Computing (ICAC), Malabe, Sri Lanka, 10–11 December 2020; ICAC: Malabe, Sri Lanka, 2020; pp. 55–60. [Google Scholar]
  19. Aghel, B.; Rezaei, A.; Mohadesi, M. Modeling and prediction of water quality parameters using a hybrid particle swarm optimization–neural fuzzy approach. Int. J. Environ. Sci. Technol. 2019, 16, 4823–4832. [Google Scholar] [CrossRef]
  20. Barzegar, R.; Aalami, M.T.; Adamowski, J. Short-term water quality variable prediction using a hybrid CNN–LSTM deep learning model. Stoch. Environ. Res. Risk Assess. 2020, 34, 415–433. [Google Scholar] [CrossRef]
  21. Baek, S.S.; Pyo, J.; Chun, J.A. Prediction of water level and water quality using a CNN-LSTM combined deep learning approach. Water 2020, 12, 3399. [Google Scholar] [CrossRef]
  22. Pyo, J.; Park, L.J.; Pachepsky, Y.; Baek, S.S.; Kim, K.; Cho, K.H. Using convolutional neural network for predicting cyanobacteria concentrations in river water. Water Res. 2020, 186, 116349. [Google Scholar] [CrossRef] [PubMed]
  23. Zhang, J.; Zhu, Y.; Zhang, X.; Ye, M.; Yang, J. Developing a long short-term memory (LSTM) based model for predicting water table depth in agricultural areas. J. Hydrol. 2018, 561, 918–929. [Google Scholar] [CrossRef]
  24. Zheng, L.; Wang, H.; Liu, C.; Zhang, S.; Ding, A.; Xie, E.; Li, J.; Wang, S. Prediction of harmful algal blooms in large water bodies using the combined EFDC and LSTM models. J. Environ. Manag. 2021, 295, 113060. [Google Scholar] [CrossRef] [PubMed]
  25. Kim, T.Y.; Cho, S.B. Predicting the household power consumption using CNN-LSTM hybrid networks. In Proceedings of the Intelligent Data Engineering and Automated Learning–IDEAL 2018: 19th International Conference, Madrid, Spain, 21–23 November 2018; Springer: Madrid, Spain, 2018; pp. 481–490. [Google Scholar]
Figure 1. Distribution of NH4.
Sustainability 16 05578 g001
Figure 2. Schematic of traditional forecasting model.
Sustainability 16 05578 g002
Figure 3. CNN-LSTM model.
Sustainability 16 05578 g003
Figure 4. Schematic diagram of prediction model.
Sustainability 16 05578 g004
Figure 5. Comparison of water quality characteristic indicators.
Sustainability 16 05578 g005
Figure 6. Comparison of loss between the 3 models.
Sustainability 16 05578 g006
Figure 7. Comparison of prediction between the 3 models.
Sustainability 16 05578 g007
Table 1. Comparison of Pearson coefficient for water quality characteristic indicators.
Data Volume25%50%75%100%
pH0.4260.1470.181−0.114
DO0.1980.2240.262−0.047
COD0.1220.1820.3310.256
NH40.6690.6390.6530.678
Table 2. Comparison of prediction between the 3 models.
Evaluation IndicatorsCNNLSTMCNN-LSTM (Single Site)CNN-LSTM (Distributed Sites)
RMSE4.19%4.20%2.65%1.08%
MAPE18.26%16.13%10.52%6.80%
R20.920.920.960.99
Disclaimer/Publisher’s Note: The statements, opinions and data contained in all publications are solely those of the individual author(s) and contributor(s) and not of MDPI and/or the editor(s). MDPI and/or the editor(s) disclaim responsibility for any injury to people or property resulting from any ideas, methods, instructions or products referred to in the content.

