Article

Assessing the Spatiotemporal Dynamics of Environmental Sustainability in China

1
Graduate School of Economics, Osaka University, Osaka 565-0871, Japan
2
Graduate School of Engineering, Osaka University, Osaka 565-0871, Japan
3
Faculty of Social and Environmental Studies, Tokoha University, Shizuoka 422-8581, Japan
4
College of Sustainability and Tourism, Ritsumeikan Asia Pacific University, Beppu 874-0011, Japan
*
Author to whom correspondence should be addressed.
Sustainability 2024, 16(13), 5322; https://doi.org/10.3390/su16135322
Submission received: 1 May 2024 / Revised: 7 June 2024 / Accepted: 19 June 2024 / Published: 22 June 2024

Abstract

:
Environmental sustainability is crucial to the Sustainable Development Goals (SDGs). We can gain an overview of a region’s or country’s dynamics by quantifying and analyzing its patterns over time and space. It can then be used to develop more sustainable policies. This study created a database of indices covering China’s environment, economy, and resource domains. Using an improved Environmental Sustainability Index (ESI) approach, we assessed sustainability and its spatiotemporal dynamics in 31 Chinese provinces between 2000 and 2017. Our findings suggest that provinces with high levels of socioeconomic development tend to have higher environmental scores, especially after experiencing severe environmental issues. Some underdeveloped provinces achieved high scores due to their relatively low environmental pressure and high resource efficiency. However, most underdeveloped provinces had high environmental pressure and low resource efficiency, leading to low environmental sustainability. We also discovered that sustainability scores improved between 2000 and 2017, mainly due to socioeconomic advancements. Yet, some environmental issues, such as air pollution, worsened during the latter part. Therefore, we confirmed an inverted U-curve relationship between environmental, resource, and socioeconomic components. Clustering analysis based on provincial economic and demographic characteristics also revealed different chronological patterns of environmental scores across the clusters. Additionally, we detected the transfer of pollution from developed to less-developed regions during the early 2000s.

1. Introduction

China has enjoyed rapid economic growth over the last few decades, undeniably contributing to the nation’s overall affluence. However, such economic growth, accompanied by urbanization and industrialization, has caused various environmental problems, such as water and air pollution, increased waste generation, and overconsumption of natural resources, to name a few. In addition, societal problems, such as growing gaps between urban and rural incomes, have emerged as severe challenges to its sustainable development. Given the situation, it is becoming increasingly crucial that China pursues sustainable and balanced development paths with long-term perspectives in the pathways of the 2030 agenda (i.e., SDGs). In order to envision such a sustainable society, it is critical to have a comprehensive understanding of the complex mechanism of sustainability status. Sustainability assessment should play an essential role in gaining such an understanding [1].
Sustainability indicators, one of the central tools of sustainability assessment, aim to measure environmental improvement, social progress, and economic development [2]. Indeed, various sustainability indicators have been developed and used for assessments [3]. For example, many studies focused on energy and resource use efficiency, alerting to the current pace of resource use increase [4,5,6], while some studies also addressed the aspects of human development and well-being [7,8]. Regarding the scale, many have attempted to carry out sustainability assessments for China at the city level [9,10,11,12,13,14,15] and nationwide or at the provincial level [2,16,17,18]. Some studies have estimated composite indices of variables in the sustainability components, showing the trends and direction of sustainability conditions based on the triple-bottom-line concepts [19]. Focus has been put on objective weights among variables or the identification of key indicators [20].
Recent studies on sustainability assessment emphasize the environmental impacts of human activities and their influence on sustainability metrics. They utilize specific indicators or frameworks, like human footprint patterns, provincial indicator systems, and the human footprint index, for CO2 emissions [21,22,23,24]. These studies recognize the role of industrialization and economic factors in driving environmental changes, focusing on urban income differences, energy consumption per GDP unit, and disposable income. Regional analyses are increasing, particularly in areas like Jiangsu Province and various parts of China, to understand local sustainability variations [21,22]. These studies provide policy insights to enhance sustainability and reduce environmental impacts, including the effects of high-quality development measures [24]. Additionally, correlations between human activities and environmental impacts, such as the impact of industrialization on human footprint patterns and the positive correlation between human pressures and CO2 emissions, are identified.
However, the complex mechanism of sustainability has yet to be further understood. Sustainability indicators can help to identify and clarify problems [2]. In addition, assessment results can also be used to envision and design the future of society. In particular, information on past trends regarding sustainability status and the mechanisms behind them could provide insights into how to envision future society. Recently, Future Design was developed, which is the design and praxis of social systems to succeed in a sustainable society for future generations [25]. Various studies and practices on Future Design have been performed and developed [26,27,28,29]. In Future Design, past assessment results can be effectively used. Therefore, developing indicator systems and assessment practices should be further advanced.
In this study, we shed light on the complex mechanism among the sustainability factors for Chinese provinces. We employ the “Environmental Sustainability Index (ESI)” approach to compute sustainability component scores, such as the environment, socioeconomics, and resource use for Chinese provinces [30]. Our assessment is demonstrated by aggregating the scores of sustainability components and indicators relevant to sustainability. In this sense, the ESI is an indicative approach, not a definitive approach. Although an indicative approach per se does not inform us whether a country is on a sustainable path, our approach of using an assessment system allows us to untangle the complex relationship between factors that potentially affect sustainable development in the regions.
Our calculation method follows our previous research [2] that modified the ESI calculation procedure so that the chronological performance of sustainability is presented. Compared with [2], we extended the data duration before COVID-19 and improved the spatiotemporal dynamics of sustainability status analysis. Specifically, we conducted a chronological assessment using data from 2000 to 2017, which enabled us to compare sustainability performance across provinces over time. Judging whether the target region is moving toward sustainability is particularly interesting in assessing sustainability. This study first determines the direction of each province in China over time in terms of individual sustainability components. Then, we delve into the relationships among the sustainability component and factors while considering spatiotemporal dynamics.

2. Assessment System and Methods

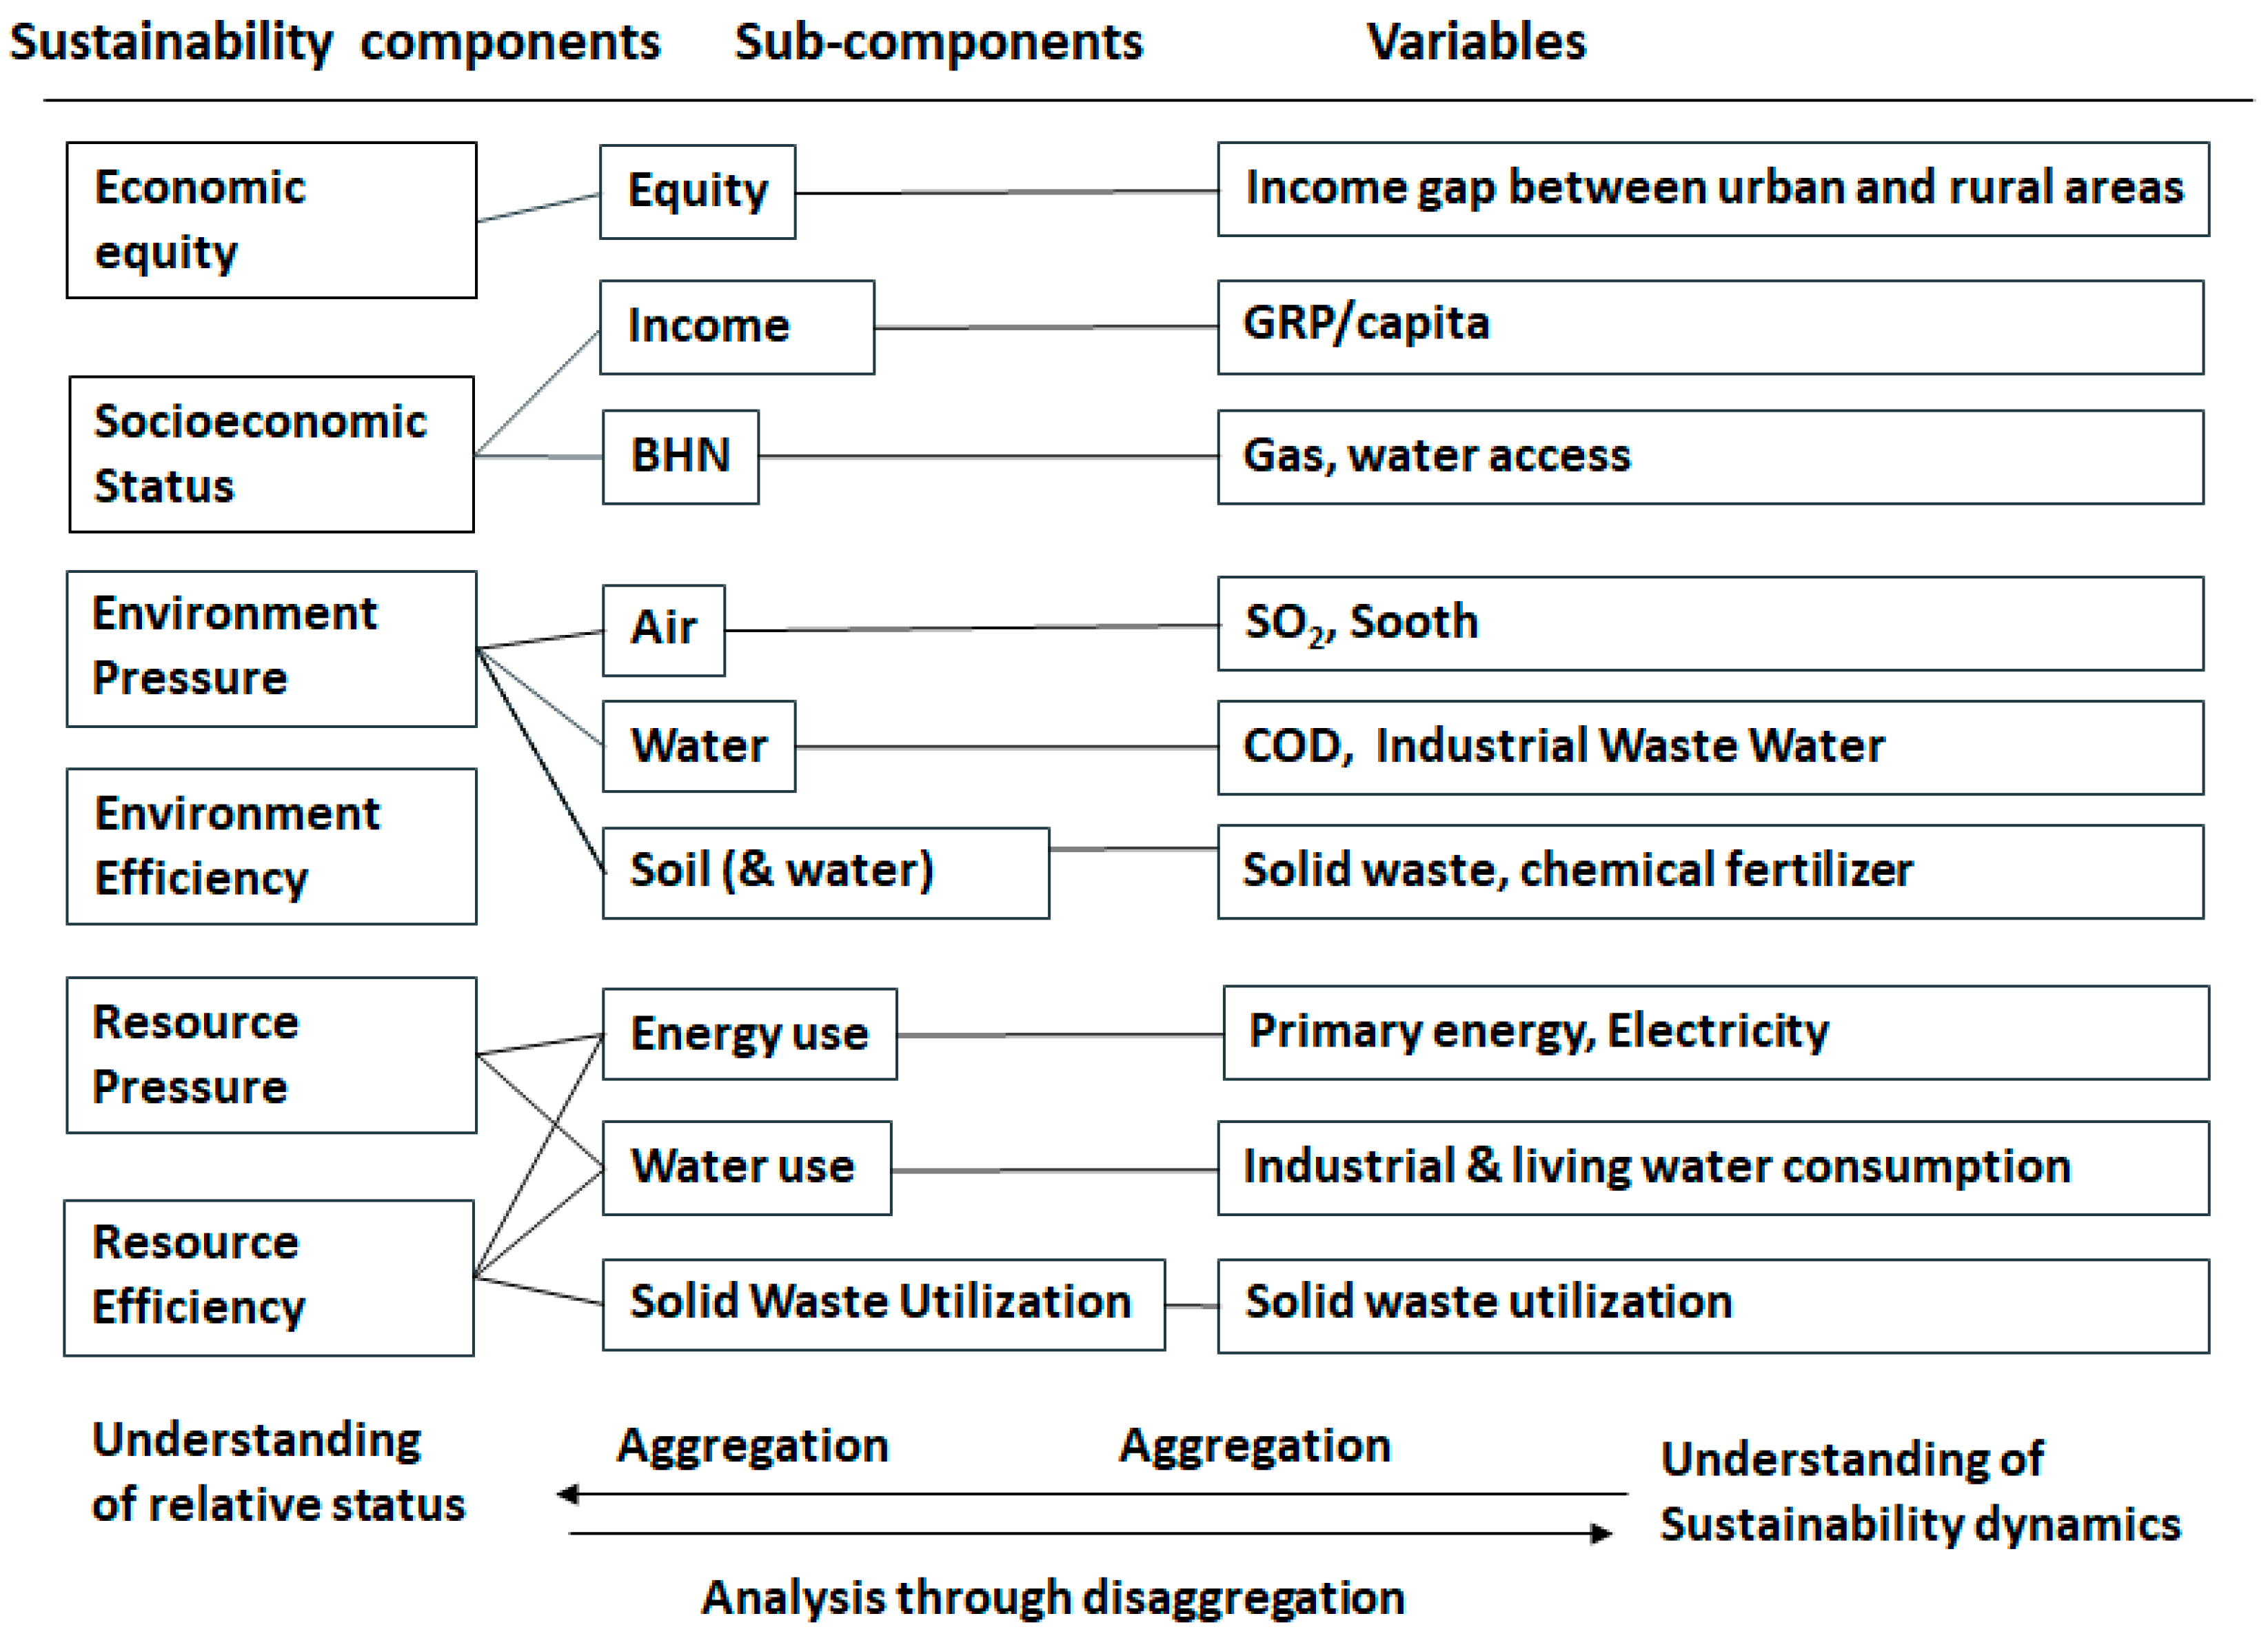
2.1. Assessment System

Our assessment approach is similar to the min–max assessment approach, which is a widely used method for assessment, such as the Human Development Index [31]. With this approach, we first select indicators of interest, normalize those indicators (by taking min–max scaling or by calculating z-scores, for example), and then aggregate the normalized measurements to create indices for assessment. This study develops an assessment system that allows us to demonstrate a systematic comparison of sustainability levels, not only across provinces, but also in different periods.
Figure 1 illustrates the sustainability assessment system developed in this study. The sustainability assessment strategy is as follows. We first select a set of sustainability components for assessing the sustainability of Chinese provinces. Second, we determine which variables are needed to represent the individual components. When computing the sustainability component scores, we start at the right part of the system and calculate variable indicators, which are then used to compute the indicators or indices of the left part of the system by aggregation. The calculated indicator shows the relative sustainability status in each target region at a given time. Thus, we perform aggregation that moves from the right to the left of the system. With this system, we then move from the left to the right of the system to analyze the sustainability conditions in detail. This investigation clarifies the relationships among the indicators and derives detailed profiles of sustainability for each province.
Specifically, the first component is socioeconomic development, which has two sub-components: equity, basic human needs, and income. These are measured by gross regional products (GRPs, the sum of added value produced within a province). In this study, the economy refers to the difference in income, wealth, and economic opportunities between different groups within a region or between regions. This gap can manifest in various ways, including disparities in earnings, access to resources, education, and living standards, indicating sustainability’s importance. Regarding environmental sustainability, we divided it into two groups, the environment and resource use, each for which we looked at the pressure aspects and efficiency aspects. We examine the efficiency aspects because they balance socioeconomic development and environmental or resource conservation.
Regarding environmental sustainability, we divided it into two categories: environment and resource use. For each, we examine the pressure aspects and efficiency aspects. We examine the efficiency aspects because they encompass the balance between socioeconomic development and environmental or resource conservation.
Simultaneously, the environmental pressure component meticulously evaluates the extent to which a province’s economic activities impact the environment. The environmental pressure variables, such as pollution emissions, are measured with precision on a per capita basis in the fields of water, air, and soil. Similarly, the environmental efficiency component also scrutinizes the pollution emissions into the water, air, and soil. However, the efficiency component and its corresponding sub-components are measured with equal thoroughness on a per GRP basis.
In the assessment system, 15 variables constitute the 9 sub-components and the 6 sustainability components, taken from the official statistical yearbooks from 2000 to 2020 [32,33]. The principal criteria of the variable selection were: (1) data are available spatially and chronologically; (2) variables are specific, measurable, and credible; and variables are meaningful for policy decision-making objectives [17,34]. The socio-economic component contains three sub-components composed of four variables: income, income gap between urban and rural areas within the region, and access to safe water and gas. Although these variables are associated with one another, we included them considering that each has different functions that affect people’s quality of life and, thus, sustainability in different ways. The environmental pressure and efficiency components consist of variables, including sulfur dioxide emissions, industrial gas emissions, solid waste generation, COD discharge, industrial wastewater discharge, and the use of chemical fertilizer. Each of these variables represents the essential aspects of the environment: water, air, and soil.
Finally, the resource component represents the efficiency and availability of the resources used in economic activities. Six of these variables belong to energy, water, or materials utilization, and these indicators constitute the resource-use component, otherwise explained.
Finally, we do not claim that this assessment system reveals everything regarding sustainability. Looking at the component scores alone can generate misleading conclusions. Notably, our assessment system, including the variable selection, implicitly assumes the following conditions:
  • Unlimited supply of natural resources: Individual indicators alone do not convey anything about their tipping points or carrying capacity;
  • The potential of technological progress: This is a significant factor in our assessment system as the relevance and significance of indicators can change over time due to technological advancements;
  • Sustainability status depending on current situations (mutual dependency);
  • Ignoring other essential factors, such as carbon dioxide emissions
It is important to clarify that this paper does not incorporate carbon emission variables, primarily due to the limited availability of provincial-level emissions data over time. Additionally, their inclusion may not be suitable for provincial analysis in China, given the nationwide rollout of China’s global warming countermeasures to promote renewable energy. For instance, the promotion of large-scale wind power in a province could lead to a reduction in greenhouse gas emissions for surrounding provinces. With the above conditions, this paper demonstrates chronological and spatial analyses within our assessment system to understand the sustainability status.

2.2. Calculation Procedure

This sub-section explains the aggregation procedure to calculate sustainability component scores.
(1)
Normality test for pooled data: We computed each variable’s skewness. If its value exceeds 2, we transform the variable by taking either a logarithm or a power;
(2)
Z-score calculation: The variables have different averages and variances for which we could not aggregate. Therefore, we calculated a z-score of a variable for which a lower value indicates better sustainability by:
z m i t = μ j m X j m i t σ j m
where i t denotes a province in year t , j m denotes a variable name within a component m M = ( S S ,   E Q ,   E P ,   E F ,   R P ,   R E ) , where SS, EQ, EP, EF, RP, and RE, respectively, denote socioeconomic status, economic equality, environmental pressure, environmental efficiency, resource pressure, and resource efficiency. X is a normalized variable, as shown in Step 1. μ and σ are the mean and variance of the transformed variable, respectively. Notice that the sustainability component indices are calculated in such a way that the lower the index, the better the performance in sustainability. This means that all the z-scores shall be calculated in the same manner. Equation (1) is used for variables for which a higher value of the variable means better sustainability. For variables for which higher values indicate better sustainability (e.g., GRP per capita), we instead use:
z m ( i t ) = X j m ( i t ) μ j m σ j m
(3)
Z-score aggregation: After obtaining z-scores for all variables in the two time periods, we aggregated the z-scores over the variables within the same sustainability sub-component:
C m ( i t ) = j m w m z m ( i t )
where w m denotes a weight for each variable in component m. Following the ESI approach, we use equal weights for the three components. For example, the environmental component consists of eight variables and, therefore, the weight used for the aggregation was 1 / 4 = 0.25 . Thus, even in the case of missing variables, we use the average as a weight for the aggregation.
(4)
Calculation of Sustainability Component Scores (SCS): The sustainability indicator for province i in year t is the mean (again, the equally weighted average) of the sustainability sub-component indicators. That is,
I n d i c a t o r ( i t ) = m M w C m ( i t )
with the component weight w determined to take the average of the sub-components. Notice that the index theoretically takes a value from −∞ to ∞. It may, however, be convenient to transform the indicators into the index system, in which the values range from 0 to 1, to determine the relative status of a region. To obtain the SI, we mapped
S u s I n d i c a t o r   F : S C S [ 0 ,   1 ]
We used the standard normal distribution function (i.e., F) to map the indicators.

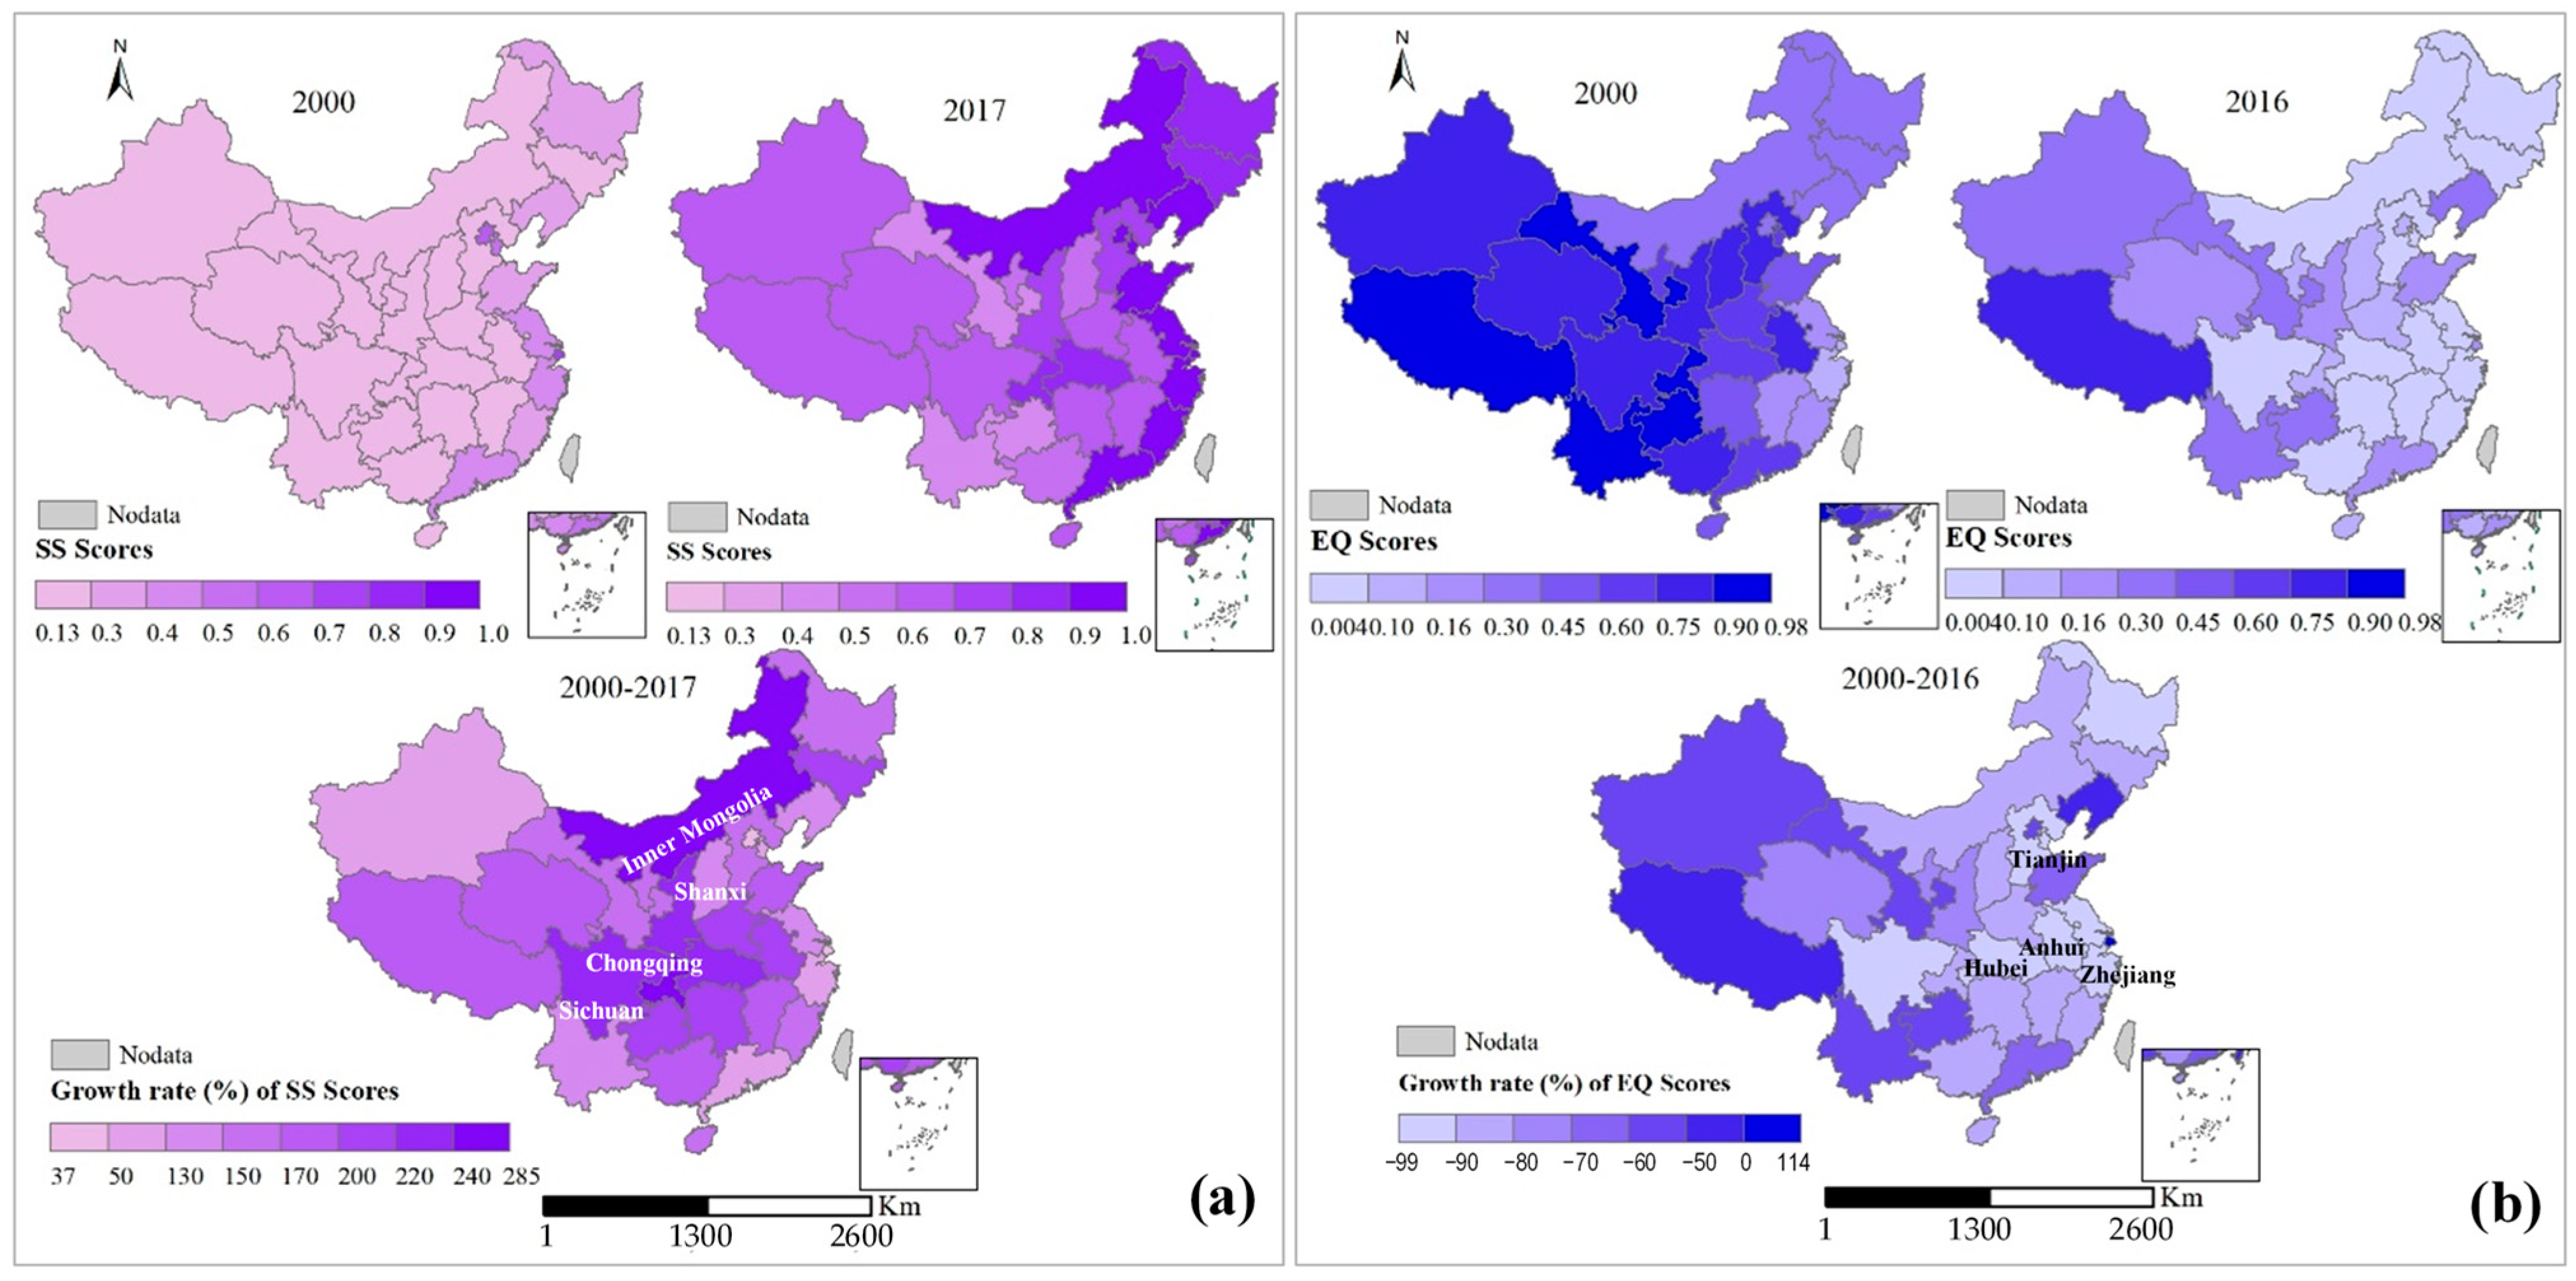
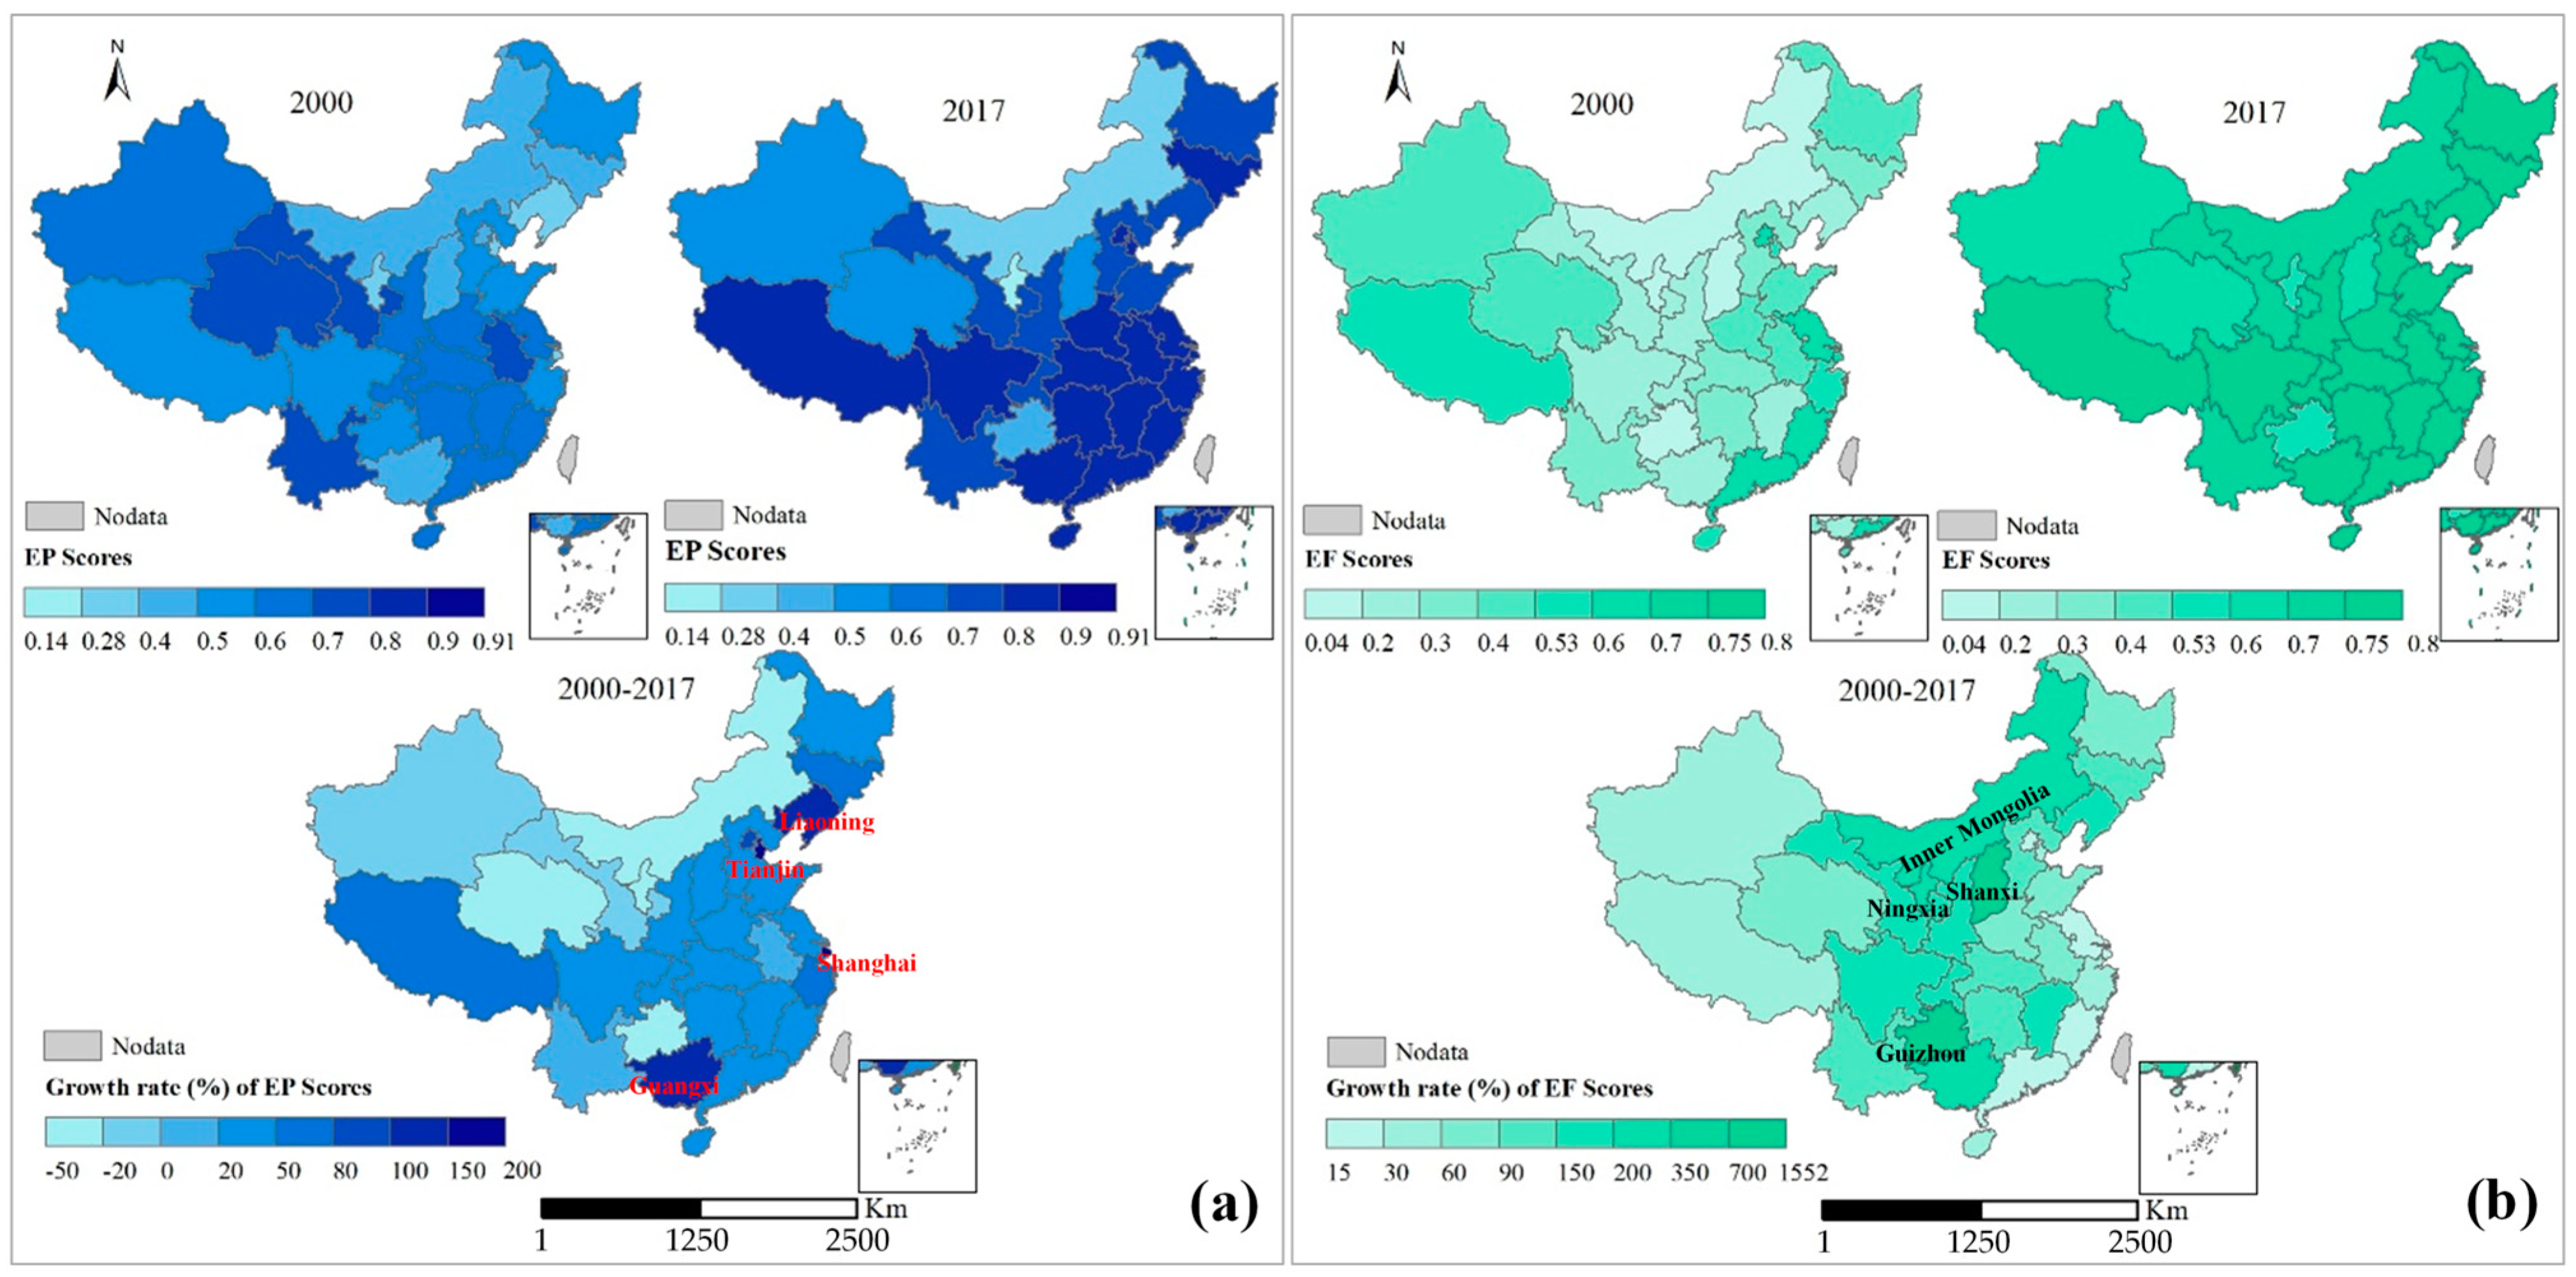
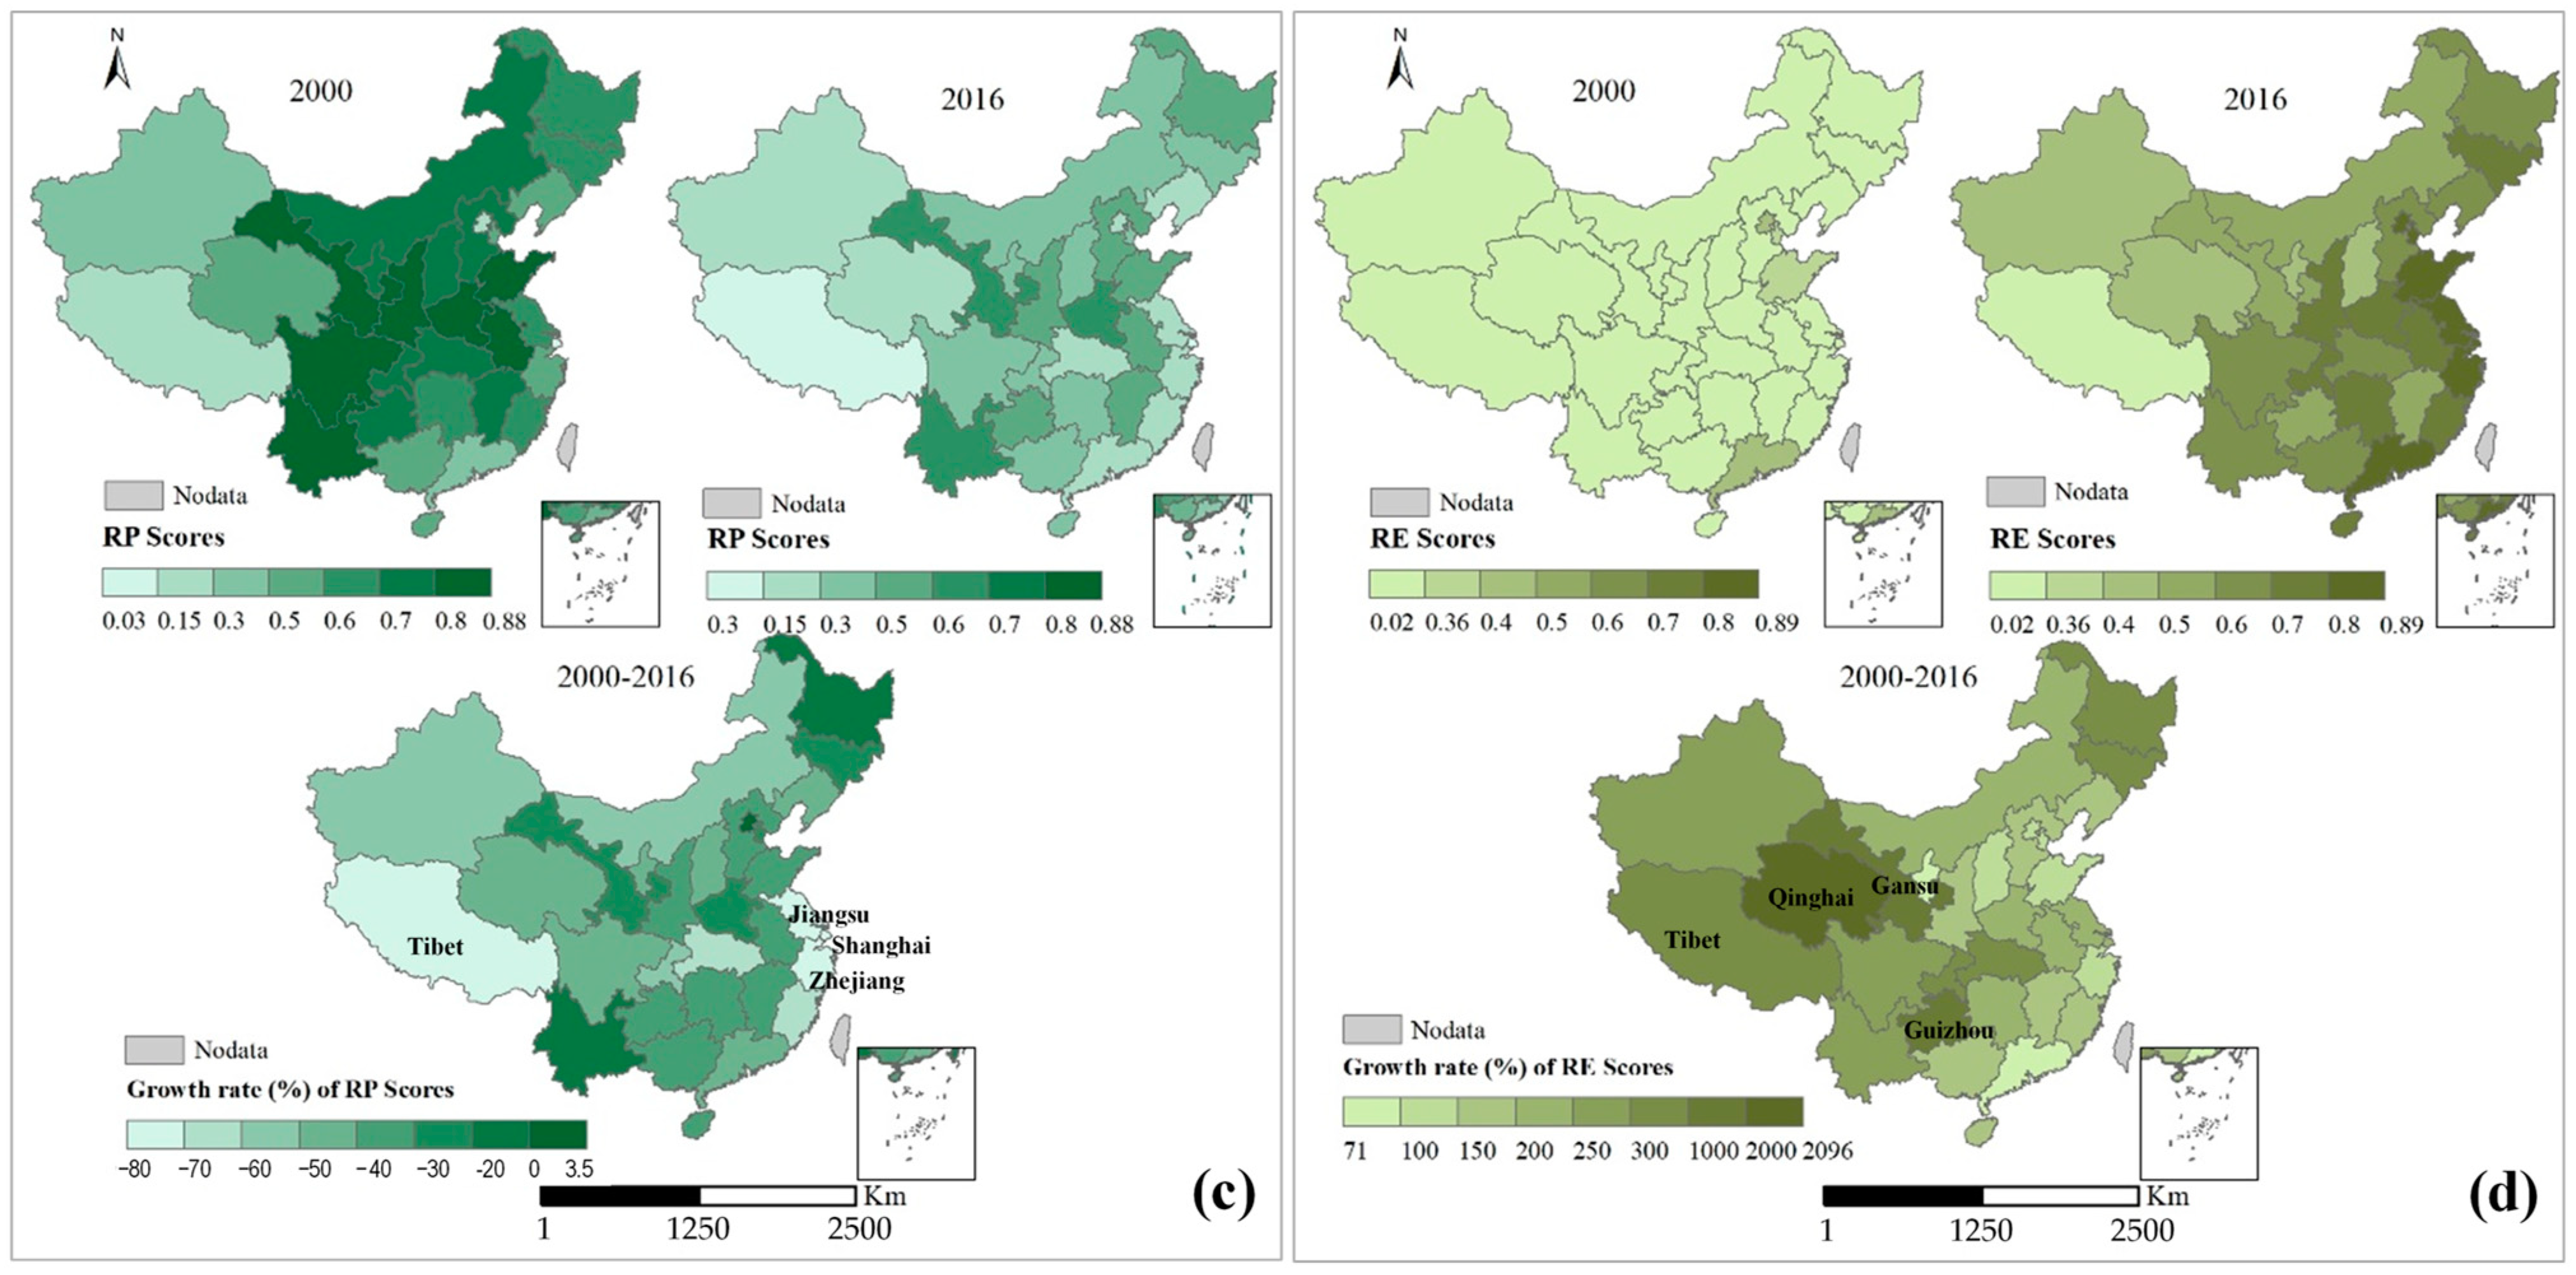
3. Sustainability Components Scores: Spatial and Chronological Patterns

Table 1 lists the top five and bottom three provinces based on average scores for the six sustainability components over the observed period. Highly developed provinces achieved high socioeconomic and ecological efficiency scores, whereas less developed provinces scored lower. The top five provinces in terms of socioeconomic status were Shanghai, Beijing, Tianjin, Zhejiang, and Jiangsu, all located along China’s coast. In contrast, the bottom five provinces in socioeconomic status were Ningxia, Tibet, Yunnan, Gansu, and Guizhou, which are all inland.
The results also indicated that developed regions performed poorly in ecological pressure and economic equity scores, while underdeveloped provinces fared better. Additionally, some regions had a significant presence of heavy industries. Provinces like Inner Mongolia and Shanxi, known for their heavy industry and mining activities, performed poorly in ecological component scores. Conversely, Beijing ranked among the top five in ecological scores. In the following, this section presents spatiotemporal analyses to derive more insights into sustainability conditions.

3.1. Spatial Patterns of Sustainability Components in China

Figure 2 shows that the socioeconomic development status of most Chinese provinces has significantly improved between 2000 and 2017. The central region of China has witnessed the fastest improvement in socioeconomic status, with the annual growth rates of SS in Chongqing, Sichuan, Shaanxi, and Inner Mongolia reaching 7.4–8.2%. The eastern and coastal regions have maintained a relatively higher socio-economic status due to their accumulated good foundation of GDP and infrastructure development, with an average growth rate for SS of less than 5% per annum. Economic equity has been dramatically improved in Tianjin, Hubei, and Zhejiang Provinces, with their SQ score reducing at an annual rate of over 22%. However, the income gap showed less improvement in western regions of China, such as the Tibet, Xinjiang, and Gansu Provinces, and even enlarged in Shanghai.
Figure 3 illustrates China’s environmental sustainability in terms of environment and resources. Environmental pressure has decreased in less developed provinces, like Ningxia, Qinghai, and Inner Mongolia, at an annual rate of 1.7% to 3.8%. In contrast, it has worsened in most developed regions, such as Shanghai, Tianjin, and Liaoning. Environmental efficiency has also followed a similar trend to environmental pressure.
Moreover, the past two decades have witnessed a significant decrease in resource pressure in most provinces, with Tibet, Shanghai, and Zhejiang leading the way. However, what piques our interest is the enhanced resource efficiency in western and less-developed regions, such as Qinghai, Guizhou, Gansu, and Tibet. This progress, when compared with the eastern and developed regions, presents a compelling area for further research and exploration.

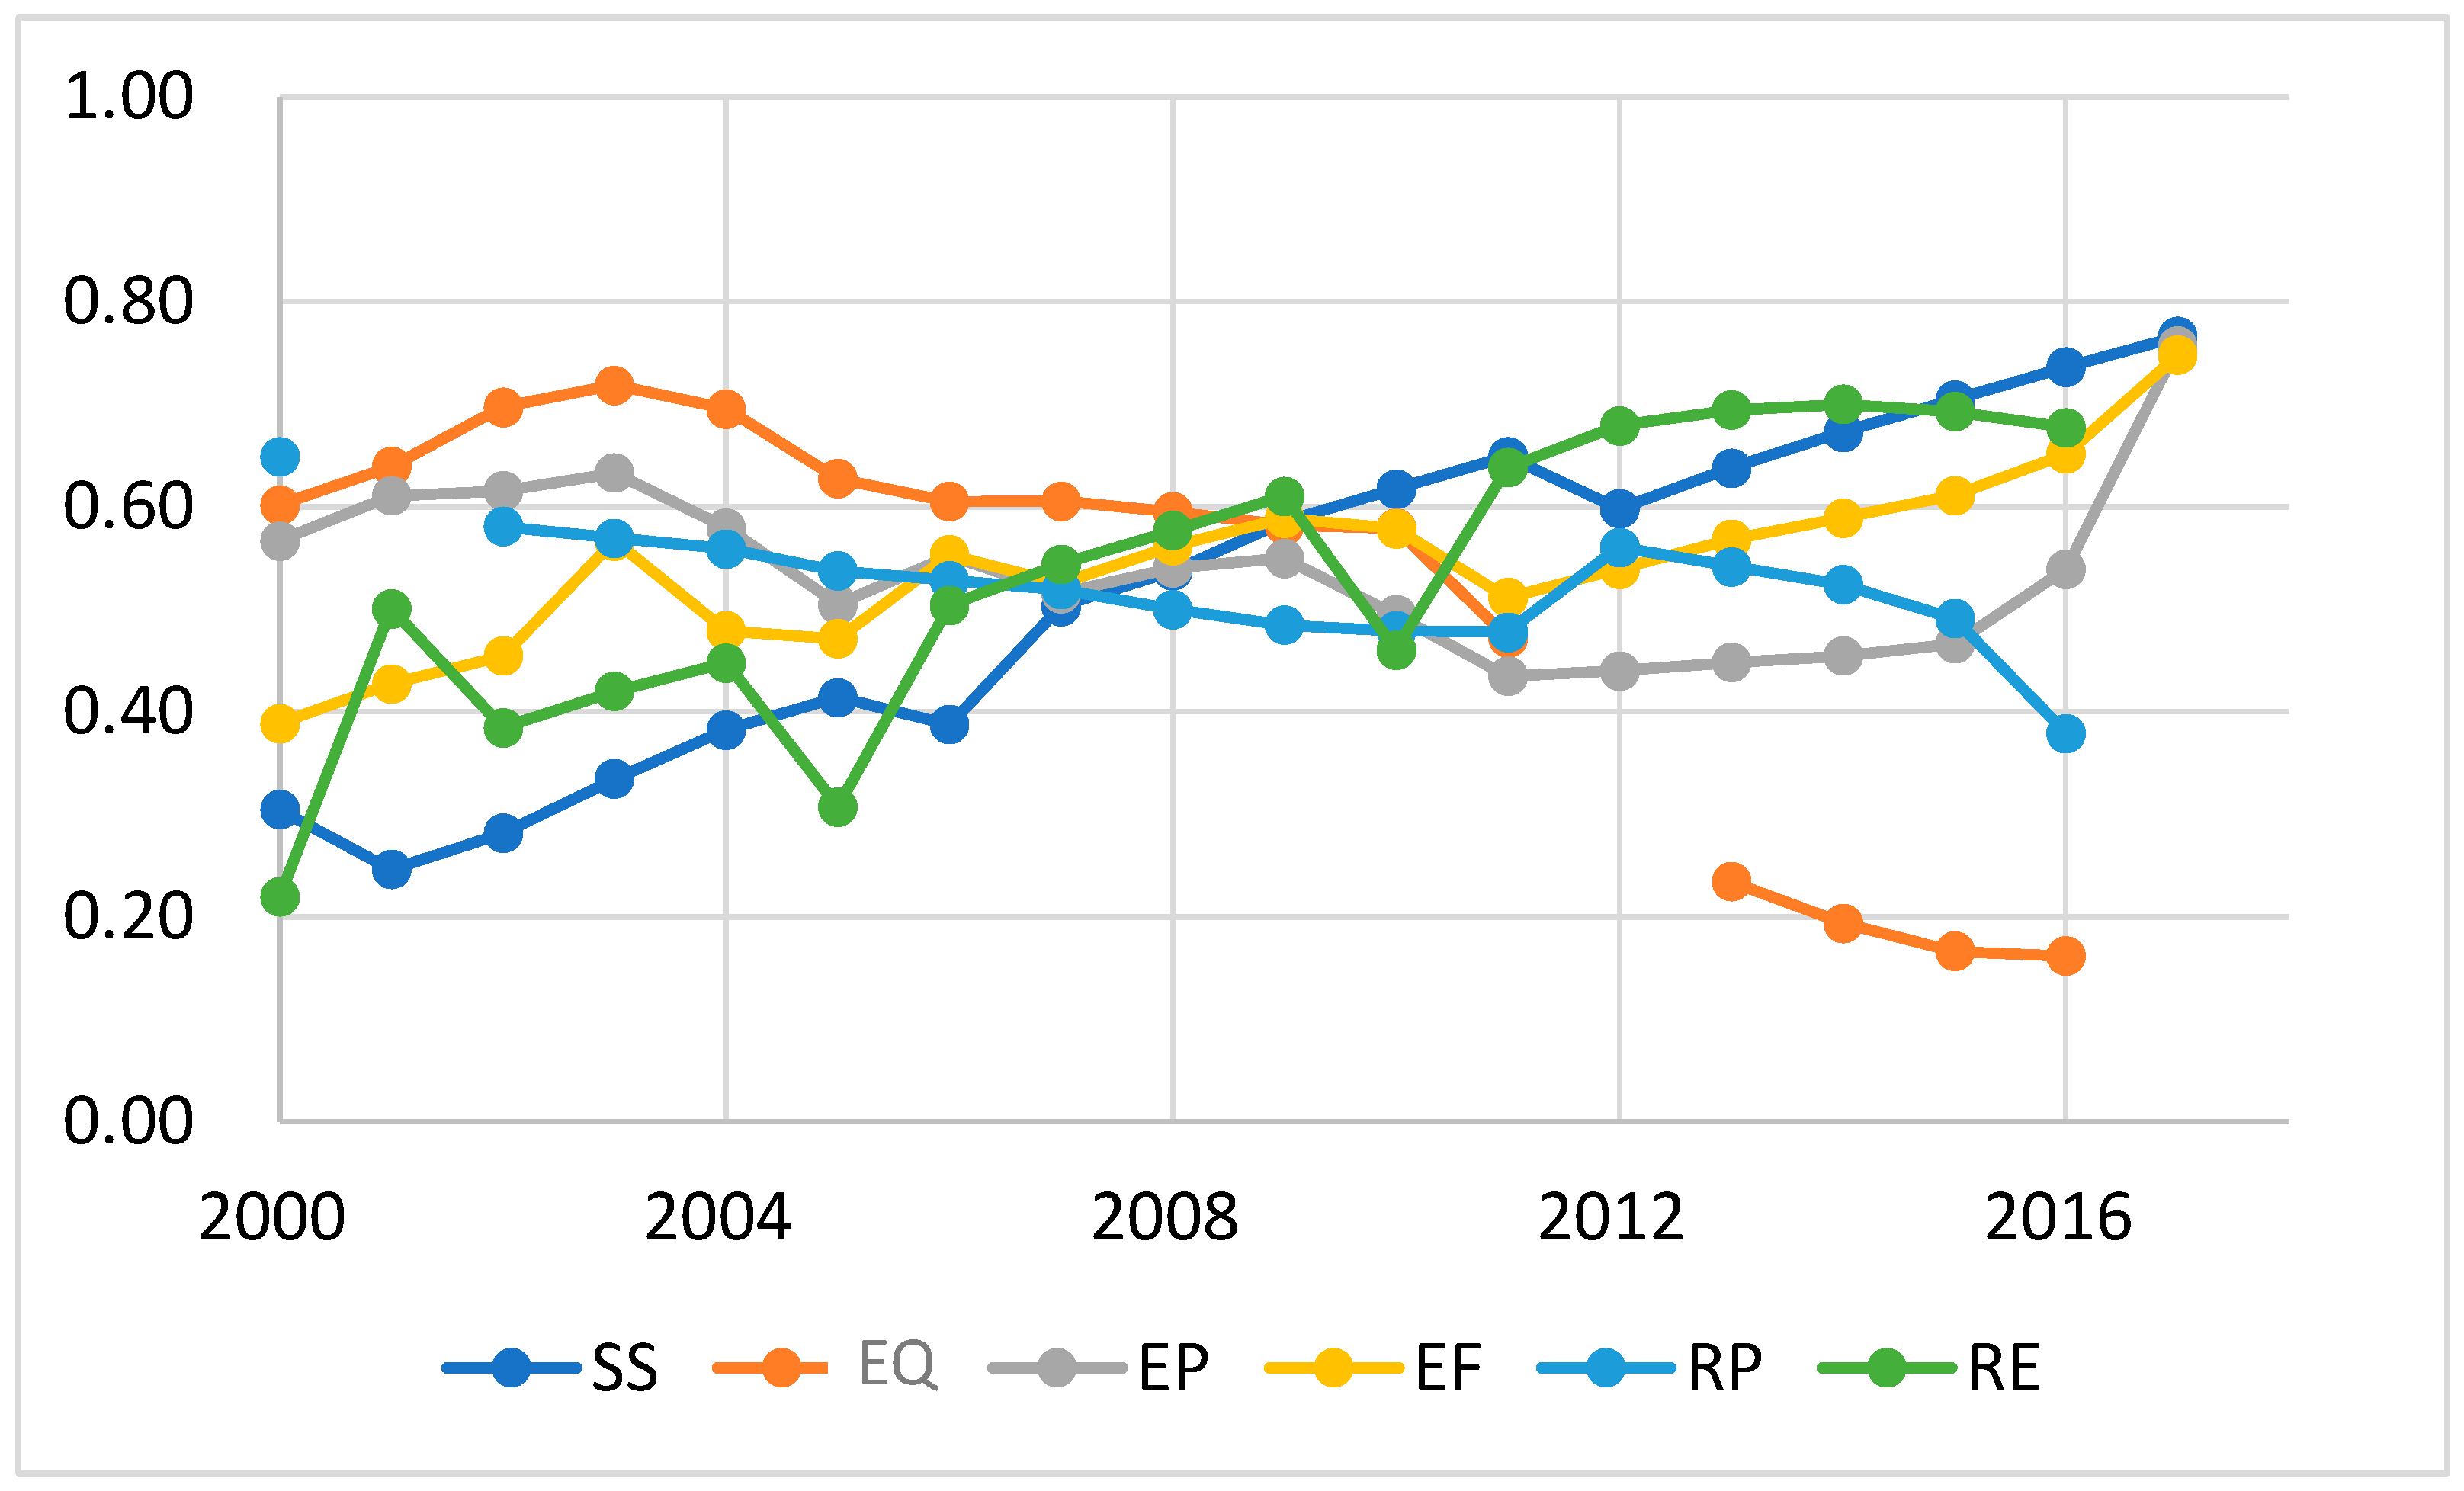
3.2. Temporal Features of Sustainability Components in China

Figure 4 shows the temporal trends of the average sustainability component scores between 2000 and 2017. Socioeconomic conditions and efficiency component scores increased mainly because of rapid economic growth. However, the economic equity situation and environmental pressure worsened in many of the periods. In particular, environmental and resource pressures substantially worsened during the eight years for most provinces. Even the provinces with the most robust performance in 2000 faced significant environmental degradation and resource pressures. Finally, some provinces, including Beijing and Shanghai, which are highly developed regions, improved their environmental pressure performances during the periods, as observed in part in Table 1. We confirm this pattern statistically in the next section.
Another interesting result is the performance gap across provinces within the sustainability component in given years (Table 2). The variance (i.e., gap) in the socioeconomic status scores increased between 2000 and 2016, although the scores improved on average during this period. These results imply that the gap between prosperous and less developed provinces has increased. In the meantime, the variance in the environmental pressure scores decreased because some developed provinces, such as Beijing, started improving their performance. This observation can be a part of the theory of the environmental Kuznets curve. The following sub-section demonstrates in-depth analyses of sustainability components, including the tests for the Kuznets curve hypothesis.
We showed different patterns of sustainability components from 2000 to 2017 and observed some associations among sustainability component scores. However, it is meaningful to conduct statistical analysis to confirm our assertion and to provide more insights into the structure of sustainability.

3.3. Analysis of the Sustainability Subcomponent

We posit that the stage of development, industrial structure, and demographic factors are the significant determinants of sustainability component dynamics. To see how those factors affect sustainability component dynamics, we first conduct cluster analysis to elicit the characteristics of provincial groups based on the sustainability component dynamics. Specifically, we tried different clustering methods, such as k-mean and k-median clustering with different k numbers. As all these different methods generated similar results, we show the results of k-means clustering with k = 6 .
Table 3 presents the average economic indicators, demographic information, and industrial structure of the clusters, and Table 4 summarizes the characteristics of each cluster. Among the clusters, Cluster F shows, by far, the highest environmental scores, followed by Cluster A, which includes Inner Mongolia and Heilongjiang. Cluster B, in the meantime, has the highest share of industry in GRP and Cluster C shows the fastest GRP growth rate. Clusters D and E seem similar in that they are located in inland China, with less urbanization and a higher share of the primary sector in the economy. The clustering results indicate that provinces differ not only in the stage of development, but also in the development pathways.
We now examine how those factors affect sustainability component dynamics. Specifically, we demonstrate regression analyses for each sustainability sub-component where the explained variables are individual sustainability sub-component scores, and determinant factors are each province’s GRP per capita, industrial structure, and urbanization rates. Moreover, those income levels (GRP per capita) were interlinked with another sustainability subcomponent. Specifically, we tested the Environmental Kuznets curve hypotheses for different sustainability sub-component variables by the clusters. Thus, we included the square of GRP per capita in the regression equation to determine if a non-linear relation exists between sustainability performance and income level. We employed fixed effect regression estimates as our data set included panel data.
Table 5 summarizes the results of the regression analyses. It only presents the outcome from statistically significant results to show the relationship shape between each sustainability sub-component and GRP per capita. First, in all the clusters, ecological efficiency components, including solid waste utilization, tended to improve during the period. Examples include SOx emissions and solid waste utilization. These results are due to a rapid increase in income and technological progress, such as the installment of end-of-pipe technology. Second, many of the resource pressure components and some of the environmental pressure components have deteriorated across provinces. Examples are energy and living water consumption and wastewater charges. Thus, we need clear evidence of decoupling for these resource uses. Likewise, no clear relation was seen between income level and solid waste generation across the clusters. Third, we confirm the U-shaped relationship between income level and a sub-component status for some ecological sub-components. Typically, the economic growth of a region in the early stage of development is attained through the development of the industrial sector and capital accumulation [30]. Although industrialization inevitably causes environmental degradation, society will turn to starting to improve environmental conditions at some point. The reasons for this turning include (1) the increasing demand from the public for a cleaner environment, (2) the imposition of stricter regulations, and (3) the diffusion of environmentally friendly technology and systems.
Finally, the cluster analysis characterized provincial groups based on the six components of sustainability. However, we ignored the spatial elements in the analysis. There has been an increasing amount of literature on spatial analysis in economics, and it has shown that geographical location substantially affects economies [35]. It is, therefore, interesting to detect any spatial patterns in the calculated indices. We examine if there is a pollution heaven effect across provinces. Dirty industries are forced or willing to move to provinces with less environmental costs and regulations. As there is a significant gap in income levels across regions, the degree of environmental cost can differ, which incurs industry transfers [36]. To evaluate this, we take the adjacent Hebei and Beijing provinces. Note that Beijing initiated fundamental urban planning to maintain clean environments in the region in the early 2000s to host the Beijing Olympics 2008, which plausibly led to the imposition of stricter environmental policies and dirty industries’ transfer outside Beijing.
Our study is anchored on a crucial regression analysis, where the explained variable is SOx per capita emissions in Hebei. The explanatory variables are GRP per capita and SOx emissions in Beijing in previous years. This analysis is pivotal as it helps us to understand the potential transfer of industries from Beijing to Hebei and how this could impact emissions in Hebei in the following years, all while controlling for the effects of other factors.
Table 6 presents the results. All the coefficients of the explanatory variables are statistically significant with the expected signs (i.e., negative for the first-order term and positive for the second-order term). First, the overall regression results support the environmental Kuznets curve hypothesis [37]. Given the selection of the environmental component variables, these results show that Hubei could afford to increase its investment in reducing environmental pressures above a certain income level and socioeconomic development. For example, firms could introduce end-of-pipe technologies that reduce the emission of some pollutants. Second, the coefficient of the Beijing lag variable is negative and statistically significant. That is, an improvement in environmental conditions in Beijing in previous years created an adverse effect on Hebei’s SOx emission levels, with other things being constant, which implies pollution transfer effects.
Figure 5 depicts a hypothetical scatter diagram representing the environmental Kuznets curve. The regression results for data from 31 provinces demonstrated an inverted U-shaped relationship between economic growth and environmental pressure (see Table 5). Similar to other provinces, Hebei initially experienced environmental degradation, which began to improve at a certain point. Additionally, the regression results suggest that the curve shifted downward due to the influx of polluting industries from outside the province.
Figure 6 shows the share of the industrial output of the electricity, steel, and cement sectors, GRP, and the population of Hebei, Shandong, and Zhejiang provinces (national output is the total). Although these provinces account for 20% of the GDP and 18% of the population in China, their steel and cement production shares grew during the period. These provinces produced 40% of the national steel output and 30% of the national cement in 2005. The steel and cement industries are energy-intensive and, thus, are the primary source of air pollutants, including SOx, NOx, and CO2 (although this is not included in our assessment). This fact explains the degradation of air quality in these regions. In addition, there are substantial flows of steel and cement products from these provinces to the other regions [34]. The regional input–output table of China in 2000 implies the development of the dependency of steel and cement products in the Beijing/Tianjin region on these provinces. Following the flow patterns between regions would reveal the change in the economic dependency of a region on the others. For this, the latest input–output table is to be constructed. In the highly developed regions in China, the main economic sectors are shifting from the secondary to the service sectors, while the demand for steel and cement products remains strong. Thus, these provinces are becoming centers of dirty industries.

4. Conclusions

We developed an assessment system based on indicators and analyzed the structure of sustainability components and their spatiotemporal changes. The sustainability assessment of China’s provinces revealed overall improvements in scores, with dynamic analysis providing insights into sustainability structure.
Specifically, coastal provinces, which are highly developed, excelled in socioeconomic and ecological efficiency, while inland and underdeveloped provinces scored lower in these areas. Developed regions had lower ecological pressure and economic equity scores than less developed areas. Provinces with heavy industries, like Inner Mongolia and Shanxi, showed poor ecological performance, contrasting with Beijing’s top ecological scores. Over the period from 2000 to 2016, there was a widening gap in socioeconomic status scores among provinces, indicating increasing disparities. However, the environmental pressure score variance decreased, especially in developed areas, like Beijing, supporting the environmental Kuznets curve theory.
Yet, the environmental Kuznets curve does not necessarily mean the overall reduction of environmental loads and thus sustainability. However, with our assessment system, the detailed analyses of Beijing, Hebei, and Shandong Provinces have revealed the potential effects of pollution transfer, which can be mitigated. Individual provinces, of course, need to promote an increase in the share of specially protected areas, encourage innovation in the production cycle, and transition to conserving water resources and reducing pollutant emissions while optimizing waste collection and processing. These strategies, when implemented effectively, can lead to significant improvements. Fostering inter-regional cooperation and facilitating technology transfer is crucial for achieving these environmental goals and ensuring comprehensive sustainability, offering a promising path forward.
In future studies, it is essential to address how to use analysis and assessment results in envisioning and designing a sustainable future society. Methodologies need to be developed to link practices of sustainability assessment to Future Design research.

Author Contributions

Conceptualization, M.U. and K.H.; methodology, M.U., K.H., and M.K.; software, M.U., M.K., and J.H.; validation, M.K. and J.H.; writing—original draft preparation, M.U. and J.H.; writing—review and editing, K.H. and M.K. All authors have read and agreed to the published version of the manuscript.

Funding

This research received no external funding.

Institutional Review Board Statement

Not applicable.

Informed Consent Statement

Not applicable.

Data Availability Statement

The calculation results of sustainability component scores in a spreadsheet are available from the authors upon request.

Conflicts of Interest

The authors declare no conflicts of interest.

References

  1. Costanza, R.; Patten, B.C. Defining and predicting sustainability. Ecol. Econ. 1995, 15, 193–196. [Google Scholar] [CrossRef]
  2. Hara, K.; Uwasu, M.; Yabar, H.; Zhang, H. Sustainability Assessment with Time-Series Scores—A Case Study of Chinese Provinces. Sustain. Sci. 2009, 4, 81–97. [Google Scholar] [CrossRef]
  3. Barry, N.; Urbel-Piirsalua, E.; Stefan, A.; Lennart, O. Categorizing tools for sustainability assessment. Ecol. Econ. 2007, 80, 498–508. [Google Scholar]
  4. Yuan, J.H.; Kang, J.G.; Zhao, C.H.; Hu, Z.G. Energy consumption and economic growth: Evidence from China at both aggregated and disaggregated levels. Energy Econ. 2008, 30, 3077–3094. [Google Scholar] [CrossRef]
  5. Feng, T.; Sun, L.; Zhang, Y. The relationship between energy consumption structure, economic structure and energy intensity in China. Energy Policy 2009, 37, 5457–5483. [Google Scholar] [CrossRef]
  6. Zhang, B.; Bi, J.; Fan, Z.; Yuan, Z.; Ge, J. Eco-efficiency analysis of Industrial System in China: A Data envelopment analysis approach. Ecol. Econ. 2008, 68, 306–316. [Google Scholar] [CrossRef]
  7. United Nations Development Programme. The National Human Development Reports for China; United Nations Development Programme, China Country Office: Beijing, China, 2005. [Google Scholar]
  8. Han, J.; Liang, H.; Hara, K.; Uwasu, M.; Dong, L. Quality of life in China’s largest city, Shanghai: A 20-year subjective and objective composite assessment. J. Clean. Prod. 2018, 173, 135–142. [Google Scholar] [CrossRef]
  9. Yi, P.; Li, W.; Zhang, D.J. Sustainability assessment and key factors identification of first-tier cities in China. J. Clean. Prod. 2021, 281, 125369. [Google Scholar] [CrossRef]
  10. Tanguay, A.G.; Rajaonson, J.; Lefebvre, J.F.; Lanoie, P. Measuring the Sustainability of Cities: An Analysis of the Use of Local Indicators. Ecol. Indic. 2010, 10, 407–418. [Google Scholar] [CrossRef]
  11. Fan, P.; Qi, J. Assessing the Sustainability of Major Cities in China. Sustain. Sci. 2010, 5, 51–68. [Google Scholar] [CrossRef]
  12. Li, W.; Yi, P. Assessment of city sustainability—Coupling coordinated development among economy, society, and environment. J. Clean. Prod. 2020, 256, 120453. [Google Scholar] [CrossRef]
  13. Zhang, L.; Xu, Y.; Yeh, C.H.; Liu, Y.; Zhou, D.Q. City sustainability evaluation using MCDM with objective weights of interdependent criteria. J. Clean. Prod. 2016, 131, 491–499. [Google Scholar] [CrossRef]
  14. Van Dijk, M.P.; Zhang, M. Sustainability indices as a tool for urban managers, evidence from four medium-sized Chinese cities. Environ. Impact Assess. Rev. 2004, 25, 667–688. [Google Scholar] [CrossRef]
  15. Zhou, Y.; Yi, P.; Li, W.; Gong, C. Society, Assessment of city sustainability from the perspective of multi-source data-driven. Sustain. Cities Soc. 2021, 70, 102918. [Google Scholar] [CrossRef]
  16. Xu, M.; Hu, W.Q.J. A research on coordination between economy, society and environment in China: A case study of Jiangsu. J. Clean. Prod. 2020, 258, 120641. [Google Scholar] [CrossRef]
  17. Sun, L.; Ni, J.; Borthwick, A.G.L. Rapid Assessment of Sustainability in Mainland China. J. Environ. Manag. 2010, 91, 1021–1031. [Google Scholar] [CrossRef] [PubMed]
  18. Yi, P.; Wang, L.; Zhang, D.; Li, W. Sustainability assessment of provincial-level regions in China using composite sustainable indicator. Sustainability 2019, 11, 5289. [Google Scholar] [CrossRef]
  19. Elkington, J. Towards the sustainable corporation: Win-win-win business strategies for sustainable development. Calif. Manag. Rev. 1994, 36, 90–100. [Google Scholar] [CrossRef]
  20. Tang, J.; Zhu, H.; Liu, Z.; Jia, F.; Zheng, X. Urban sustainability evaluation under the modified TOPSIS based on grey relational analysis. Int. J. Environ. Res. Public Health 2019, 16, 256. [Google Scholar] [CrossRef]
  21. Shen, F.; Yang, L.; He, X.; Zhou, C.; Adams, J.M. Understanding the spatial-temporal variation of human footprint in Jiangsu Province, China, its anthropogenic and natural drivers and potential implications. Sci. Rep. 2020, 10, 13316. [Google Scholar] [CrossRef]
  22. Li, W.; Zhang, D.; Hui, W. Predictive sustainability assessment based on provincial 5-year development plans in China. Environ. Dev. Sustain. 2023, 1–21. [Google Scholar] [CrossRef]
  23. Li, Y.; Mi, W.; Zhang, Y.; Li, J.; He, Q.; Wang, Y.; Bi, Y. Change of Human Footprint in China and Its Implications for Carbon Dioxide (CO2) Emissions. Remote Sens. 2023, 15, 426. [Google Scholar] [CrossRef]
  24. Sharma, P, Santanu Bandyopadhyay, SA quantitative framework for sustainability assessment. Clean Technol. Environ. Policy 2023, 25, 2971–2985. [CrossRef]
  25. Saijo, T. Future design: Bequeathing sustainable natural environments and sustainable societies to future generations. Sustainability, 2020; 12, 6467. [Google Scholar] [CrossRef]
  26. Kamijo, Y.; Komiya, A.; Mifune, N.; Saijo, T. Negotiating with the future: Incorporating imaginary future generations into negotiations. Sustain. Sci. 2017, 12, 409–420. [Google Scholar] [CrossRef] [PubMed]
  27. Hara, K.; Yoshioka, R.; Kuroda, M.; Kurimoto, S.; Saijo, T. Reconciling intergenerational conflicts with imaginary future generations—Evidence from a participatory deliberation practice in a municipality in Japan. Sustain. Sci. 2019, 14, 1605–1619. [Google Scholar] [CrossRef]
  28. Uwasu, M.; Kishita, Y.; Hara, K.; Nomaguchi, Y. Citizen-participatory Scenario Design Methodology with Future Design Approach: A Case Study of Visioning for Low-Carbon Society in Suita City, Japan. Sustainability 2020, 12, 4746. [Google Scholar] [CrossRef]
  29. Hara, K.; Kitakaji, Y.; Sugino, H.; Yoshioka, R.; Takeda, H.; Hizen, Y.; Saijo, T. Effects of Experiencing the Role of Imaginary Future Generations in Decision-Making—A Case Study of Participatory Deliberation in a Japanese Town. Sustain. Sci. 2021, 16, 1001–1016. [Google Scholar] [CrossRef]
  30. Esty, C.D.; Levy, M.; Srebotnjak, T.; Sherbinin, A. 2005 Environmental Sustainability Index: Benchmarking National Environmental Stewardship; Yale Center for Environmental Law & Policy: New Haven, CT, USA, 2005. [Google Scholar]
  31. UNDP. Human Development Report; United Nations Development Programme: Oxford, UK, 1995. [Google Scholar]
  32. National Bureau of Statistics of China. China Statistical Yearbook; China Statistics Press: Beijing, China, 2000. [Google Scholar]
  33. China Environmental Yearbook; China Environmental Statistics Publishing: Beijing, China, 2000.
  34. Harger, J.; Meyer, R.E. Definition of indicators for environmentally sustainable development. Chemosphere 1996, 33, 1749–1775. [Google Scholar] [CrossRef]
  35. Fujita, M.; Krugman, P.; Venables, A.J. The Spatial Economy; The MIT Press: Cambridge, UK, 2000. [Google Scholar]
  36. Levinson, A.M.; Taylor, S. Unmasking the Pollution Haven Effect. Int. Econ. Rev. 2008, 49, 223–254. [Google Scholar] [CrossRef]
  37. Hayami, Y. Development Economics; Sobunsha: Tokyo, Japan, 1995; pp. 36–40. [Google Scholar]
Figure 1. Sustainability assessment system.
Sustainability 16 05322 g001
Figure 2. Spatial patterns of China’s socioeconomic development. (a) Socioeconomic status (SS); (b) Economic equity (SQ).
Sustainability 16 05322 g002
Figure 3. Spatial patterns of China’s environmental sustainability. (a) Environment pressure (EP); (b) Environment efficiency (EE); (c) Resource pressure (RP); (d) Resource efficiency (RE).
Sustainability 16 05322 g003aSustainability 16 05322 g003b
Figure 4. Chronological patterns of sustainability components. Note: SS = socioeconomic status, EQ = economic equality, EP = environmental pressure, EF environmental efficiency, RP = resource pressure, and RE = resource efficiency.
Sustainability 16 05322 g004
Figure 5. Environmental Kuznets curve and pollution transfer effects.
Sustainability 16 05322 g005
Figure 6. Industrial structure change in Hebei, Shandong, and Zhejiang.
Sustainability 16 05322 g006
Table 1. Ranking of sustainability components’ average scores (2000–2018).
RankSocioeconomic
Status (SS)
Economic
Equality (EQ)
Environmental
Pressure (EP)
Environmental
Efficiency (EF)
Resource
Pressure (RP)
Resource
Efficiency (RE)
1ShanghaiTibetTibetBeijingNingxiaTianjin
2BeijingGuizhouHainanTibetShanxiShandong
3TianjinGansuAnhuiShanghaiHenanBeijing
29YunnanJiangsuLiaoningGuizhouGuangdongQinghai
30GansuShanghaiInner MongoliaShanxiBeijingTibet
31GuizhouZhejiangNingxiaNingxiaShanghaiGuizhou
Table 2. Variance in the component scores in 2000 and 2016.
SSEQEPEFRPRE
20000.140.270.130.170.200.11
20160.200.170.140.120.170.15
Table 3. Profiles of the region clusters.
ClusterGRP Per CapitaUrban Pop (%)Pop DensityPrimarySecondaryTertiaryGRP Growth (%)
A2.5356.61164.1212.6546.8640.49474.41
B1.5450.81203.126.5452.3441.12356.86
C1.9951.23271.4011.124939.88511.44
D1.3939.06151.6916.6342.1941.18433.42
E1.6447.80249.5816.2343.7640.01449.14
F4.2772.80998.354.6845.3349.99376.34
Note: GRP per capita is the average GRP per capita in 2000 and 2017 in RMB at prices in 2000. Urban pop indicates the share of the urban population. Primary, secondary, and tertiary indicate the share of GRP in the primary, secondary, and tertiary sectors, respectively.
Table 4. Characteristics of the region clusters.
ARapid urbanization and high income levels. Characterized by thriving heavy industry and mining
BThe highest share of the secondary sector in the economy.
CHighest economic growth
DInland provinces. The least development and lowest urbanization rate
EMostly located along the Yangtze River. Income and urbanization rates are at low levels.
FHighest income level and urbanization rate.
Table 5. Relationships between income level and sustainability sub-component indices.
Cluster ACluster BCluster CCluster DCluster ECluster FPool
Income gap b/w rural and urbanDDUDDDU
Forest coverageIUIIUIUNSIUI
Waste water charge per capitaUDDUUDD
Waste water charge per GRPUDDUUIUU
COD discharge per capitaIIICIICICIC
COD discharge per GRPICIICICICICIC
Industry gas emissions per capitaDDDDDDD
Industry gas emissions GRPDDDDDID
Industry SOx emissions per capitaIUUIIII
Industry SOx emissions per GRPIIIIIII
Solid waste generation per capitaDDDDDUU
Solid waste generation per GRPUNSNSIUNSNSIC
Solid waste utilizationIIIIIII
Primary energy consumption per capitaDDDDDDD
Primary energy consumption per GRPIIIIIII
Electricity consumption per capitaDDDDDDD
Electricity consumption per GRPIIIIIII
Living water consumption per capitaDDDNSDDD
Living water consumption per GRPICICICICICICIC
Industrial water consumption per GRPICICICICICICIC
Note: The letters in the table indicate the relationship between each sustainability variable and GRP per capita as follows: I = Increasing, D = Decreasing, U = U-shaped, IU = Inverted U-shaped, IC = Increase at an increasing rate, and NS = Income not statistically significant.
Table 6. Regression results.
VariableCoefficientStandard Error
GRP/capita−1.19 ***0.36
(GRP/capita)20.17 ***0.03
Beijing SOx lag−0.25 ***0.10
Year0.08 **0.03
Constant−177.2 **79.47
Note: ** and *** denote statistically significant at the 5% level and at the 1% level, respectively.
Disclaimer/Publisher’s Note: The statements, opinions and data contained in all publications are solely those of the individual author(s) and contributor(s) and not of MDPI and/or the editor(s). MDPI and/or the editor(s) disclaim responsibility for any injury to people or property resulting from any ideas, methods, instructions or products referred to in the content.

