Article

Antibiotic Resistance Genes and Faecal Sterols in Marine Sediments: An Evidence of Their Presence away from Point Sources–Kuwait’s Example

1
Environment and Life Sciences Research Centre, Kuwait Institute for Scientific Research, Safat 13109, Kuwait
2
Environment Public Authority, Safat 70050, Kuwait
3
Gulf Geoinformation Solutions, Sharjah P.O. Box 49590, United Arab Emirates
*
Author to whom correspondence should be addressed.
Sustainability 2024, 16(10), 4320; https://doi.org/10.3390/su16104320
Submission received: 5 April 2024 / Revised: 11 May 2024 / Accepted: 15 May 2024 / Published: 20 May 2024

Abstract

:
Coastal areas are vital ecosystems, supporting diverse marine life and providing resources essential to human well-being. However, sewage pollution poses a significant threat to these delicate environments, impacting water quality, biodiversity, and public health. Antimicrobial resistance (AMR) has gained importance. We believe the presence of faecal sterols in coastal and marine sediments is a reliable indicator of sewage contamination. At most sites, the faecal contamination was observed with ranges from <dl to 18713 ng g−1 dw. The coprostanol/cholesterol ratio was >0.2 at 68% of the sampling sites, suggesting a large spatial distribution of sewage contamination beyond the discharge points. The positive correlation of faecal sterols with AMR provides an insight that antibiotic resistance genes (ARGs) can spread to areas away from point sources. We propose that sterol ratios be considered as a screening tool for selecting the sites for AMR assessment. The analyses of sterols will be less time and cost-intensive compared to pharmaceutical analyses and can be a reliable indicator for AMR studies in areas where prior knowledge and experience are lacking.

1. Introduction

Almost 40% of the world’s population resides in the coastal areas [1], making the coastal zone an economic [2,3,4], recreational [5], and ecological hub, hosting a multitude of organisms and providing various ecosystem services [6]. Multiple stressors affect the coastal and marine environment of the Gulf, including heavy metals [6,7], persistent organic pollutants [8], hydrocarbon pollution [9,10,11], and pharmaceutical residues [11] to name a few. The wastewater treatment plants (WWTPs) are, generally, not very efficient in removing pharmaceutical compounds resulting in measurable levels of these compounds in the aquatic environment where the effluent is discharged, likely to affect the biota [12,13,14,15]. The urban build-up in the coastal areas is linked to sewage contamination and pharmaceutical discharge [16] into the coastal waters, which often results in the development of antimicrobial resistance (AMR). However, since most of these chemicals are hydrophobic, their likelihood of settling and remaining in the sediments is high. The accentuation of drug resistance by aquatic environments has garnered a great deal of attention recently [17]. Antimicrobial compounds, resistance genes, and bacteria are introduced into marine and aquatic habitats mostly by agricultural run-off and faecal source discharges into the water through wastewater treatment plants or illicit discharges. Furthermore, a wide range of anthropogenic contaminants that have been demonstrated to co-select for AMR are known to be present in both treated and untreated sewage discharges.
The most widely used indicator of sewage contamination in coastal areas is Coliform bacteria [18], but their biodegradation at higher salinities and temporal fluctuations are well known [19], which can compromise their usefulness as a biomarker of sewage contamination and AMR. Faecal sterols, on the other hand, are quite stable under anoxic conditions. Coprostanol (predominant sterol in human faeces) is produced in the gut of mammals by enzymatic reduction of cholesterol and is a reliable indicator of human faecal contamination and, being hydrophobic, assimilates into the bottom sediments [20]. The persistent nature of coprostanol and other sterols (such as cholesterol, epicoprostanol, and cholestanol) makes them a reliable indicator for faecal contamination and useful in tracking sediment transport from sources to sink [20,21,22,23,24]. In this study, the ratio of coprostanol and cholesterol was used to ascertain the degree of pollution. The faecal sterols as biomarkers can differentiate between human and animal sources [25]. However, individual sterols cannot pinpoint sources of faecal pollution, as they are not exclusive to one organism. The ratios of cholesterol, cholestanol, coprostanol, and epicoprostanol [26,27,28,29,30,31,32,33,34] are a useful indicator for distinguishing between human and non-human faecal contamination.
The coprostanol/cholesterol ratio has been suggested as a valuable indicator of sewage due to its normalisation for total lipid content, as cholesterol is ubiquitous in most organisms. This ratio examines various biogenic sources of sterols and confirms the presence of urban sewage, displaying a positive correlation with other sewage pollution markers in oceans and estuarine sediments. To detect contamination originating from human waste, the ratio of coprostanol to other sterols has been suggested. Another ratio proposed by Grimalt et al. [21] suggested differential hydrogenation of cholesterol to cholestanol versus coprostanol, distinguishing urban sewage pollution from natural sources.
Although all the wastewater is treated in Kuwait, the expectations were that there would be less prevalence of AMR in coastal sediments. Unfortunately, the observations were contrary; resistance genes and faecal sterols were detected even away from point sources, which is likely to call for additional explanations and research on the process of transmission.
In addition, the samples were subjected to high throughput shotgun metagenomics sequencing to capture the presence of antibiotic resistant genes (ARGs). Since then, some studies have indicated the presence of AMR in Escherichia coli in Kuwait’s coastal waters from non-polluted sites [35,36], raising a concern if this characterisation of non-polluted sites based on coliform presence is reliable, or whether these ARGs are associated with the redistribution of sewage-contaminated sediments which is substantiated by the presence of sterols.

2. Material and Methods

The sediment samples were collected from twenty coastal sites that were selected based on prior knowledge of the area approximately 3–4 kilometres away from stormwater and emergency outlets. Some remote and pristine sites were also selected. The details of the site and its coordinates are provided in Table 1, and spatial disposition is plotted in Figure 1 for a synoptic overview. The samples from the coastal area were collected in January–February 2023, while the samples from the Jahra Pool Reserve were collected in May 2023.
Samples were collected from coastal areas using a 45 cm Van Veen grab sampler that was deployed from Research Vessel Bahith 5 of the Kuwait Institute for Scientific Research (KISR). The sediment samples were extracted from the grab using 50 mL falcon tubes by pressing them straight down and retrieving 10 cm of the top layer. From each grab, 6 tubes were extracted. The samples were transported on ice and stored in a freezer at −20 °C until analysed.

2.1. Sterol Analysis

The sediment samples collected were freeze-dried using an Operon freeze dryer (Operon, South Korea) and sieved through a 250 µm sieve on a Retsch Sieve Shaker (Restsch, Germany). For analysis, 2–5 g of freeze-dried sample was spiked with 5 μL of 2 mg L−1 of internal standard (5α-androstan-3β-ol) and extracted using hexane-dichloromethane 1:1 (v:v) three times by ultrasonication. Activated copper filings were added for sulphur removal. The dried extract was saponified with 0.5 M methanolic potassium hydroxide at 70 °C for 30 min. Neutral lipids (containing sterols) were separated with hexane, drying over sodium sulfate and evaporating to dryness under a nitrogen stream. The dried residue was reacted with N,O-Bis(trimethylsilyl)trifluoroacetamide (BSTFA) reagent to prepare silyl derivatives of sterols. The dried residue was taken up in 1 mL iso-octane. The derivatised sterols were analysed using a Shimadzu GC2030 coupled to a Shimadzu QP-2020 NX mass spectrometer. A Shimadzu AOC-20i plus autosampler was used for introducing the samples to the GC-MS. The temperatures of the injection port, interface, and ion source were 280 °C, 270 °C, and 240 °C, respectively. Helium was used as a carrier gas and was flowing through the column (coated with SPB-5, 0.25 mm ID and 30 m length) at 1 mL min−1. The initial temperature of the GC was 60 °C and was raised to 100 °C at the rate of 10 °C min−1. From 100–270 °C, the rate of temperature increase was kept at 4 °C min−1 and finally held for 20 min. The data were acquired and processed using Shimadzu GCMS Solution software. To identify and quantify the compounds of interest, the selective ion monitoring (SIM) mode was used. The SIM mode identified androstanol: 333; cholesterol: 368 and 458; cholestanol: 445 and 460, coprostanol: 370, 355; and epicoprostanol: 370 and 355. The quantification was carried out using internal standard androstanol (5α-anthrosan-3β-ol) in addition to its usage as a recovery standard. The recoveries were between 79 and 103%. Recoveries less than 75% were repeated until an acceptable recovery was obtained. A total of 20% of the samples were repeated for quantity assurance and quality control. As part of the QA/QC, a standard reference material IAEA-408 was concurrently analysed with the sample batch. In addition, reagent blanks were also processed. The detection limit for the method was 5 ng g−1 dw.

2.2. DNA Isolation

DNeasy® Power Soil Pro® Kit (QIAGEN, Germantown, MD, USA) was used to extract DNA from each sample (0.25 g). The DNA was extracted multiple times (n = 6) from each site and pooled to obtain a homogenous sample. Each sample was weighed and placed in a sterile 1.5 mL microcentrifuge tube (Eppendorf, Darmstadt, Germany) containing lysis solution C1. The lysate was then transferred to the power bead tube and vortexed for 10 min at room temperature. The manufacturer’s protocol was followed to precipitate, bind, wash, and elute the DNA. The quantity of isolated DNA was estimated on a fluorometer (Qubit, Thermo Fisher Scientific, Waltham, MA, USA) employing the BR dsDNA kit (Qubit, Thermo Fisher Scientific, USA). The quality was assessed on a 0.8% agarose gel run for 45 min at 100 V (Bio-Rad, Darmstadt, Germany) [36]. DNA was stored at −80 °C until further processing.

2.3. Bacterial Counts by qPCR

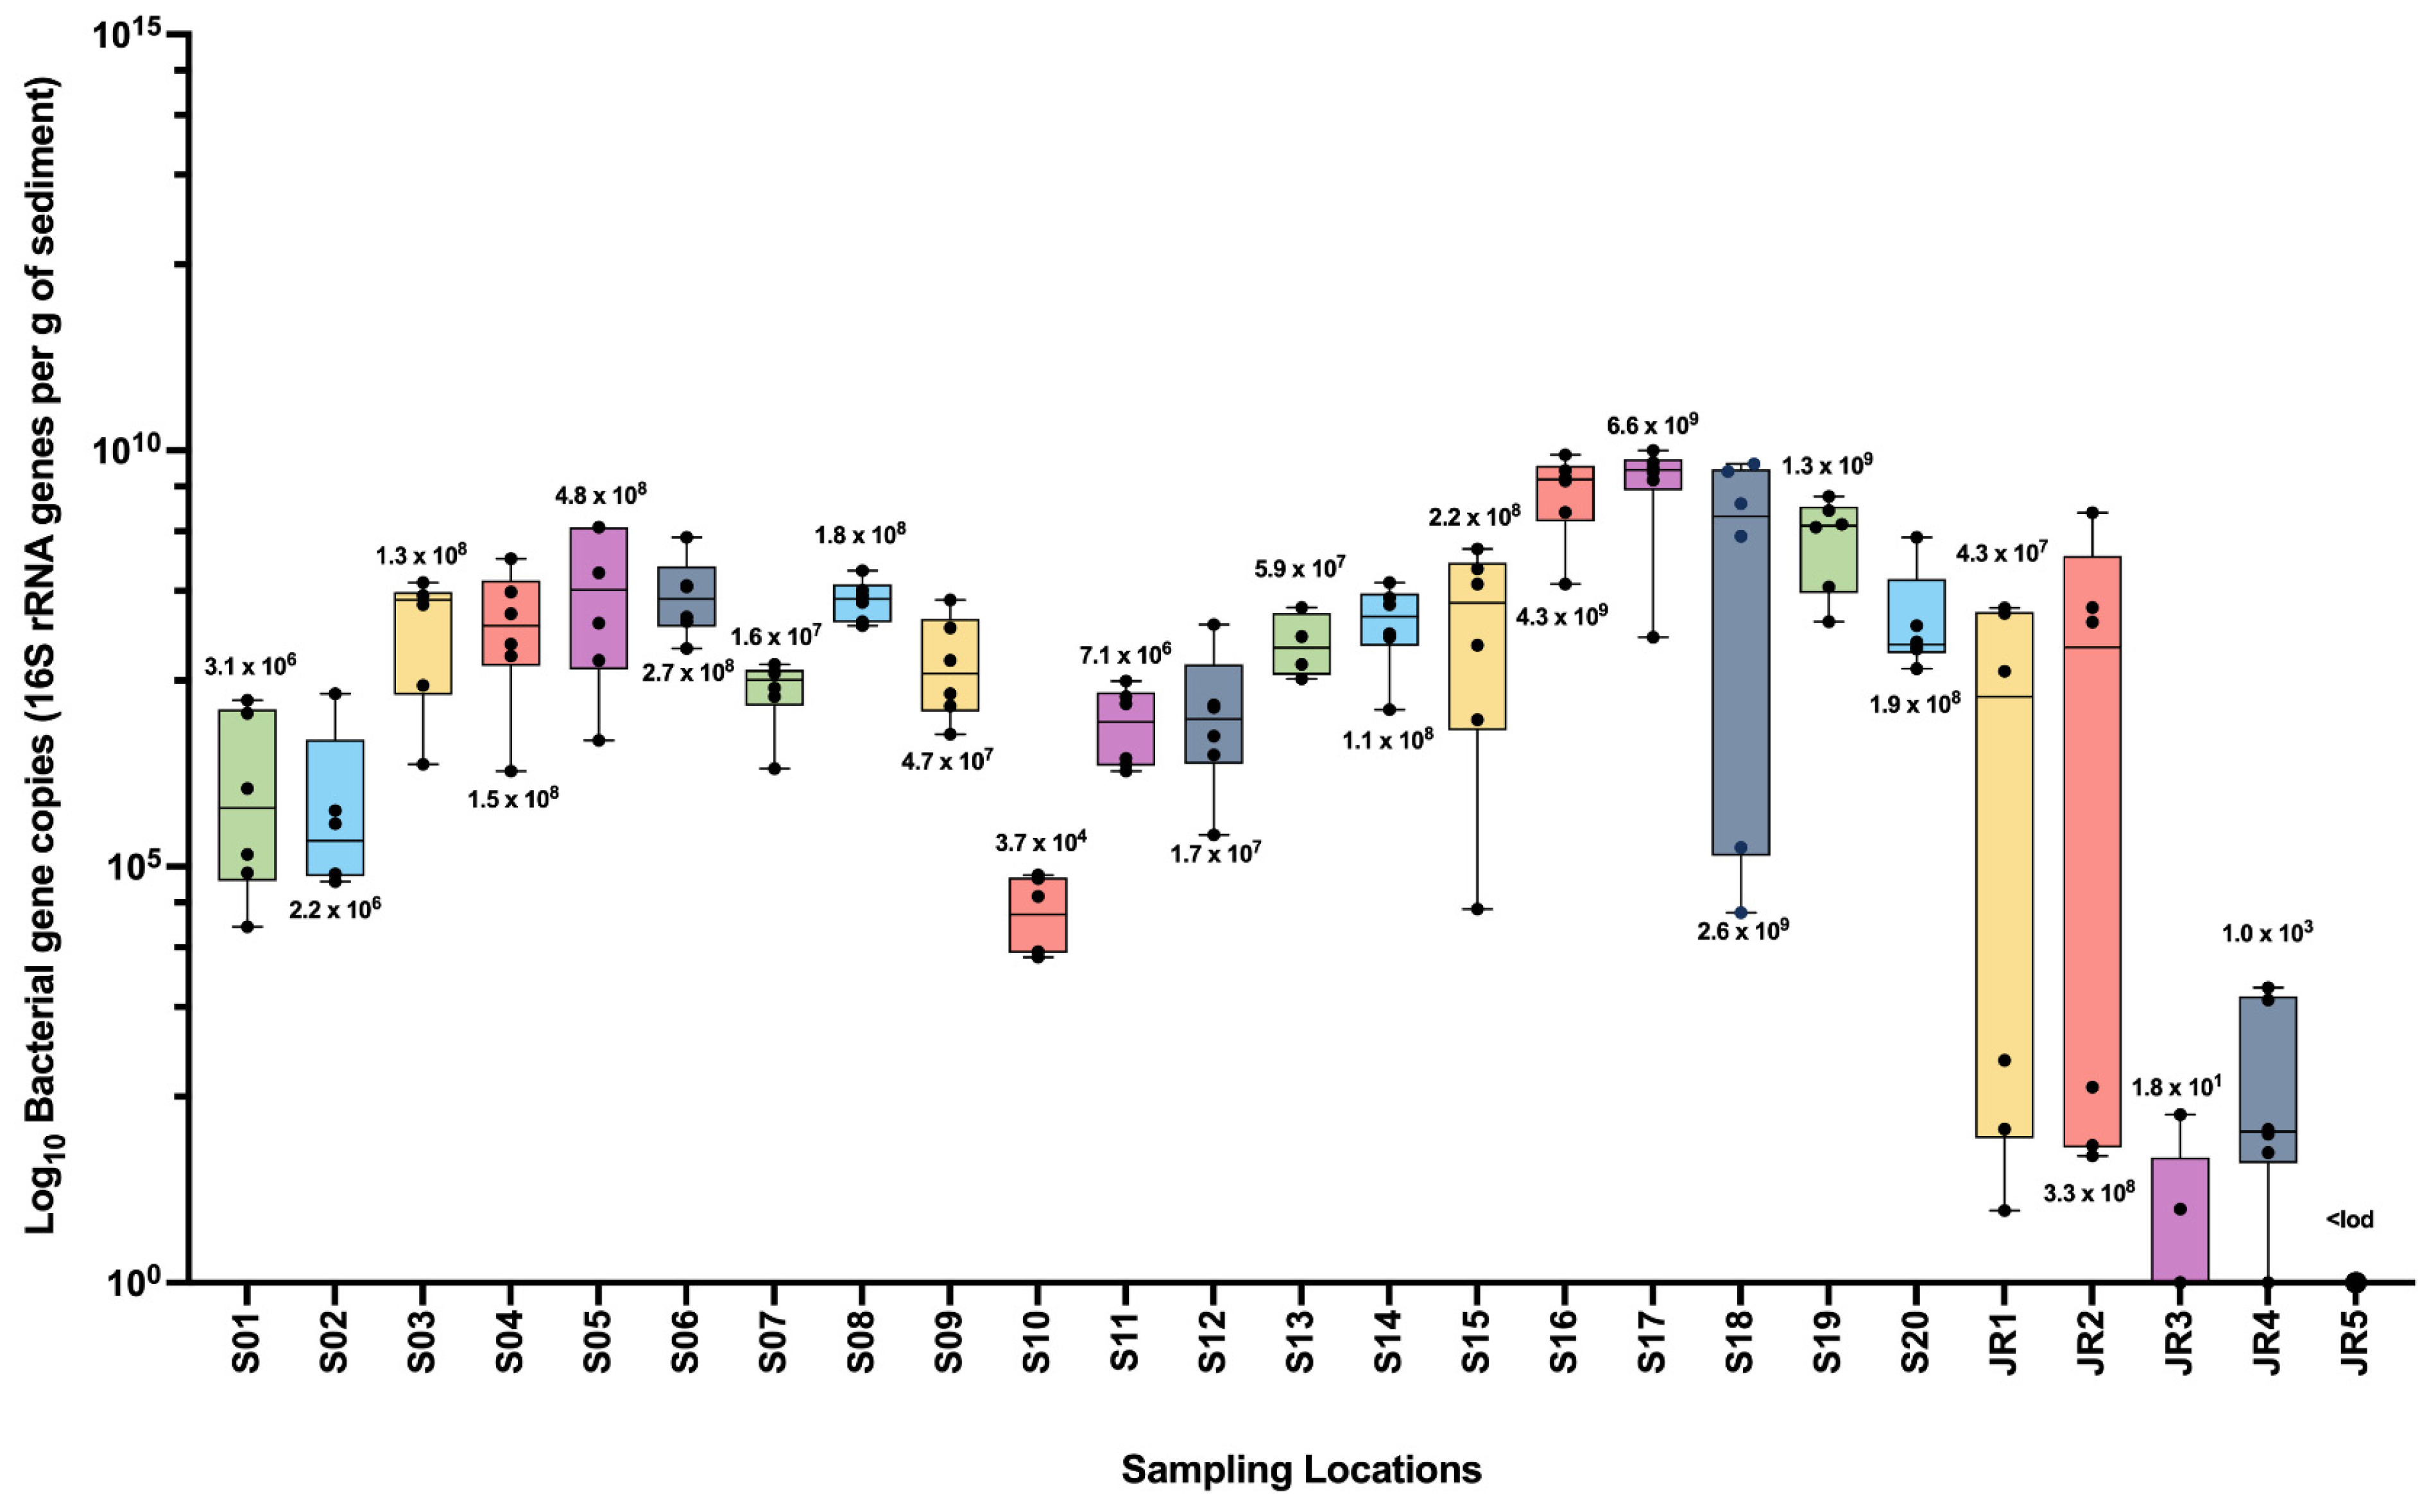
Quantitative polymerase chain reaction (qPCR) was used to estimate the 16S rRNA gene copy numbers employing degenerate primers [37]. The polymerase chain reaction (PCR) was assembled in a volume of 20 µL and consisted of 2 × PCR master mix (iQTM SYBR® Green supermix (BioRad), 300 nM primers (Forward 5′-CCTACGGGNBGCASCAG-3′ and Reverse 5′-GACTACNVGGGTATCTAATCC-3), template DNA (2 ng), and nuclease-free water. PCR was run on a CFX96TM Deep Well thermal cycler (BioRad, Hamburg, Germany). The cycling conditions for the PCR are described in our previous studies [38]. A melt curve analysis (60 °C) was performed to rule out non-specific amplification and primer-dimers. Standard Escherichia coli DNA was used as a positive control. A non-template control (NTC) sample was run along with the PCR reaction as a negative control. The CT was set at 30, and values above this threshold were excluded. Six technical replicates were used per site. Mean CT was used to calculate the gene numbers at each location. A PCR efficiency of 100.0% was achieved. The melt curve analysis was carried out at 60 °C to check for non-specific amplification [13]. For each sample, six replicates were analysed. A box and whisker plot was drawn for the counts obtained at each sampling location in the GraphPad Prism v10 software. The data were distributed in the box encompassing the 25 to 75% interquartile range, whereas the upper and lower whiskers represented the 10 and 90% of data, respectively. The median values were marked as a black line in the centre.

2.4. Shotgun Metagenomic Sequencing

The isolated DNA was also subjected to whole genome metagenomic sequencing. The steps of analysis for this method have been described elsewhere [36]. Shortly, 1 µg of DNA was sonicated, end-repaired, A-tailed, indexed, and sequenced on a NovaSeq 6000 (Illumina, San Diego, CA, USA) following the 2 × 150 bp paired-end chemistry. The raw sequences were processed through standard bioinformatics pipelines. Firstly, the raw sequences were checked for quality statistics (FASTQC); thereafter, the low-quality bases were removed, adapters were trimmed (Trimmomatic), and clean reads assembled through MEGAHIT v 1.04 into ≥500 bp scaftigs [39]. The scaftigs were used for gene prediction using the MetaGeneMark v 2.10. that were aligned against the Comprehensive Antibiotic Research Database (CARD) (BLASTP e value ≤ 1 × 10). The visualisation of genes was performed in the R package, 2D track CIRCOS for the circus plots [40]. gplots in R was used to create the heat maps [41].

3. Results

There are many sources of sterols in the aquatic environment, e.g., fungi, planktons, protozoan, vascular plants, zooplanktons, and sewage. The sterols found can have in situ origin or can be distributed by oceanic processes i.e., currents and tides. The spatial distribution of sterols is presented in Table 2. Detectable levels of coprostanol have been measured in most samples ranging between <dl to 18,713 ng g−1 dw. Coprostanol constitutes about 60% of sterols in human faeces. The sample results have been colour-coded for ease of representation, with values in 10–100 ng g−1 indicating uncontaminated samples [21] (indicated as green). The coprostanol concentration of >100 ng g−1 indicates sewage contamination (colour-coded yellow), and values >500 ng g−1 indicating severe sewage contamination are indicated as red in Table 2. Epicoprostanol is present only in trace amounts in human faeces; however, it is considered an indicator of sewage treatment of faecal material, as it originates in the digested sludge of the wastewater treatment plants [42,43]. The concentration of epicoprostanol in the study area was variable between <dl to 16,401 ng g−1 dw.
Several authors have used the coprostanol/coprostanol + cholestanol ratio to assess faecal contamination [44,45], with a consensus that <0.3 represents uncontaminated areas and >0.7 confirms sewage contamination. The ratio in the samples was >0.7, except for the four stations 2, 3, 17, and 20.

4. Bacterial Gene Counts

The bacterial genes (16S rRNA) were present in all 20 marine sediment samples (Figure 2). The counts ranged between 104 and 109 16S rRNA copies per gram of sediment. Maximum gene copies were found at Station 17 (5.6 × 10⁹ gene copies per gram), followed by Station 18 (2.6 × 10⁹ gene copies per gram) and Station 19 (1.3 × 10⁹ gene copies per gram). There were 0.0 gene copies per gram at JR5, while, in the coastal sediments, Station 10 had the minimum load of 3.7 × 10⁴ gene copies per gram. Within the Jahra Reserve, the highest count of 3.3 × 10⁸ gene copies per gram was at JR2 (Figure 2).

5. Sequencing Statistics

Sequencing of twenty marine sediment samples (1–20) with an insert size of 350 bp yielded 11,959.96 to 13,535.25 raw reads (Table S1). The Jahra sediments (JR1–JR5) generated sequences between 6037.02 and 6280.11. With post-quality filtering, almost 99% of the data passed for downstream processing. On average, 97% and 93% of data had a Phred score > Q20 and >Q30, respectively. The GC% of the clean data ranged between 55 and 61.7% (Table S1). Roughly, 130,551,113 bp to 403,266,246 bp were assembled into contigs (185,838 to 485,156) with an average length of 784.57 bp (Max—58,542.58 bp). The average N50 and N90 were 746.55 bp and 530.60 bp, respectively (Table S2). The effective size > 95% is regarded as good quality usable data for downstream analysis.

6. Prevalence and Abundance of ARGs

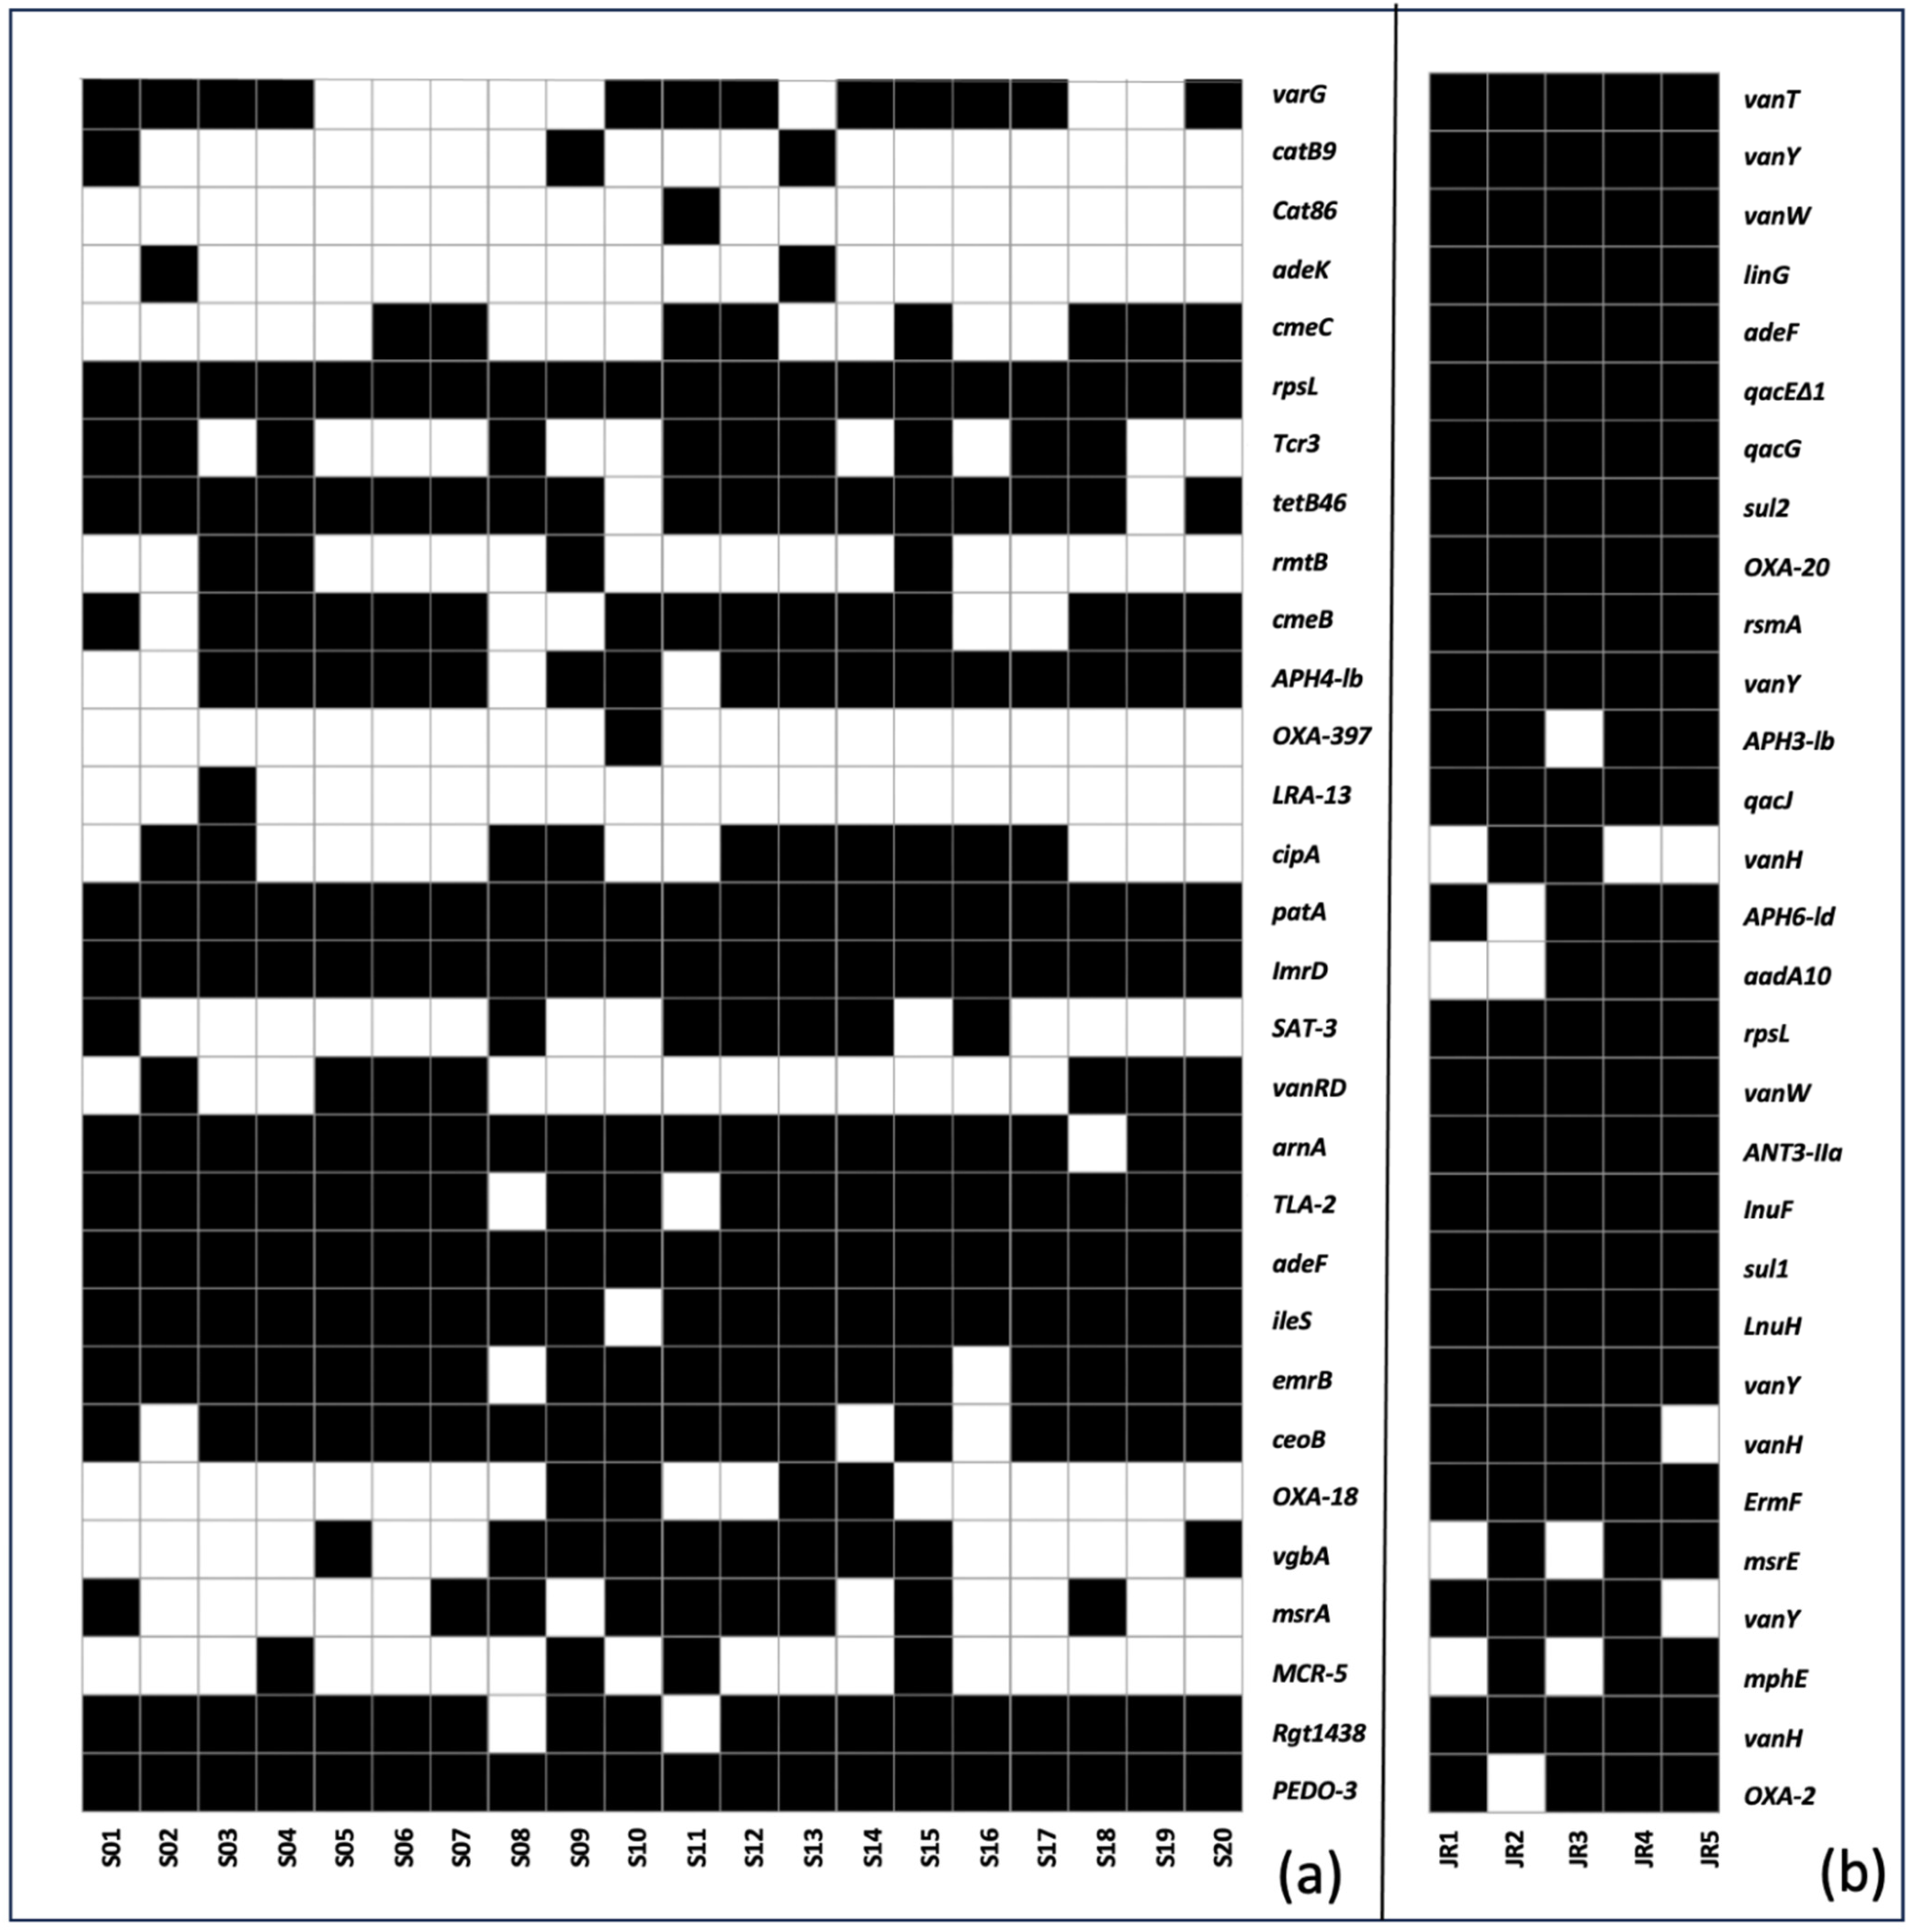
Shotgun metagenomics provided a qualitative estimation of the genes based on the number of sequences aligned against the CARD database. Each site recorded variable abundances of hundreds of antibiotic resistance genes (ARGs) (Tables S3 and S4). Genes with a sample prevalence above 5% and relative abundance > 0.01 are shown on the heat maps (Figure 3a,b). ARGs such as rpsL, patA, ImrD, adeF, and PEDO-3 were omnipresent (100% prevalence) in all the samples (Stations 1–20). The relative abundances (RA%) of these genes were 4.83 ± 3.5 (Max—14.08, Min—0.42), 3.15 ± 1.3 (Max—6.16, Min—1.2), 1.7 ± 1.2 (Max—5.7, Min—0.41), 2.8 ± 1.16 (Max—5.4, Min—1.3), and 0.99 ± 1.0 (Max—0.99, Min—0.07), respectively. Among other dominant genes (>80% sample prevalence) were tetB46, APH4lb, arnA, TLA-2, ileS, emrB, ceoB, and rgt1438. The RA% of all the genes are presented in Table S4.
The sediments from the Jahra Reserve (JR1–JR5) were richer in ARG abundance. About 21 genes exhibited a prevalence of 100%. Intriguingly, these samples exhibited a richness of van cluster genes.

7. Mechanism of Action and Microbial Hosts

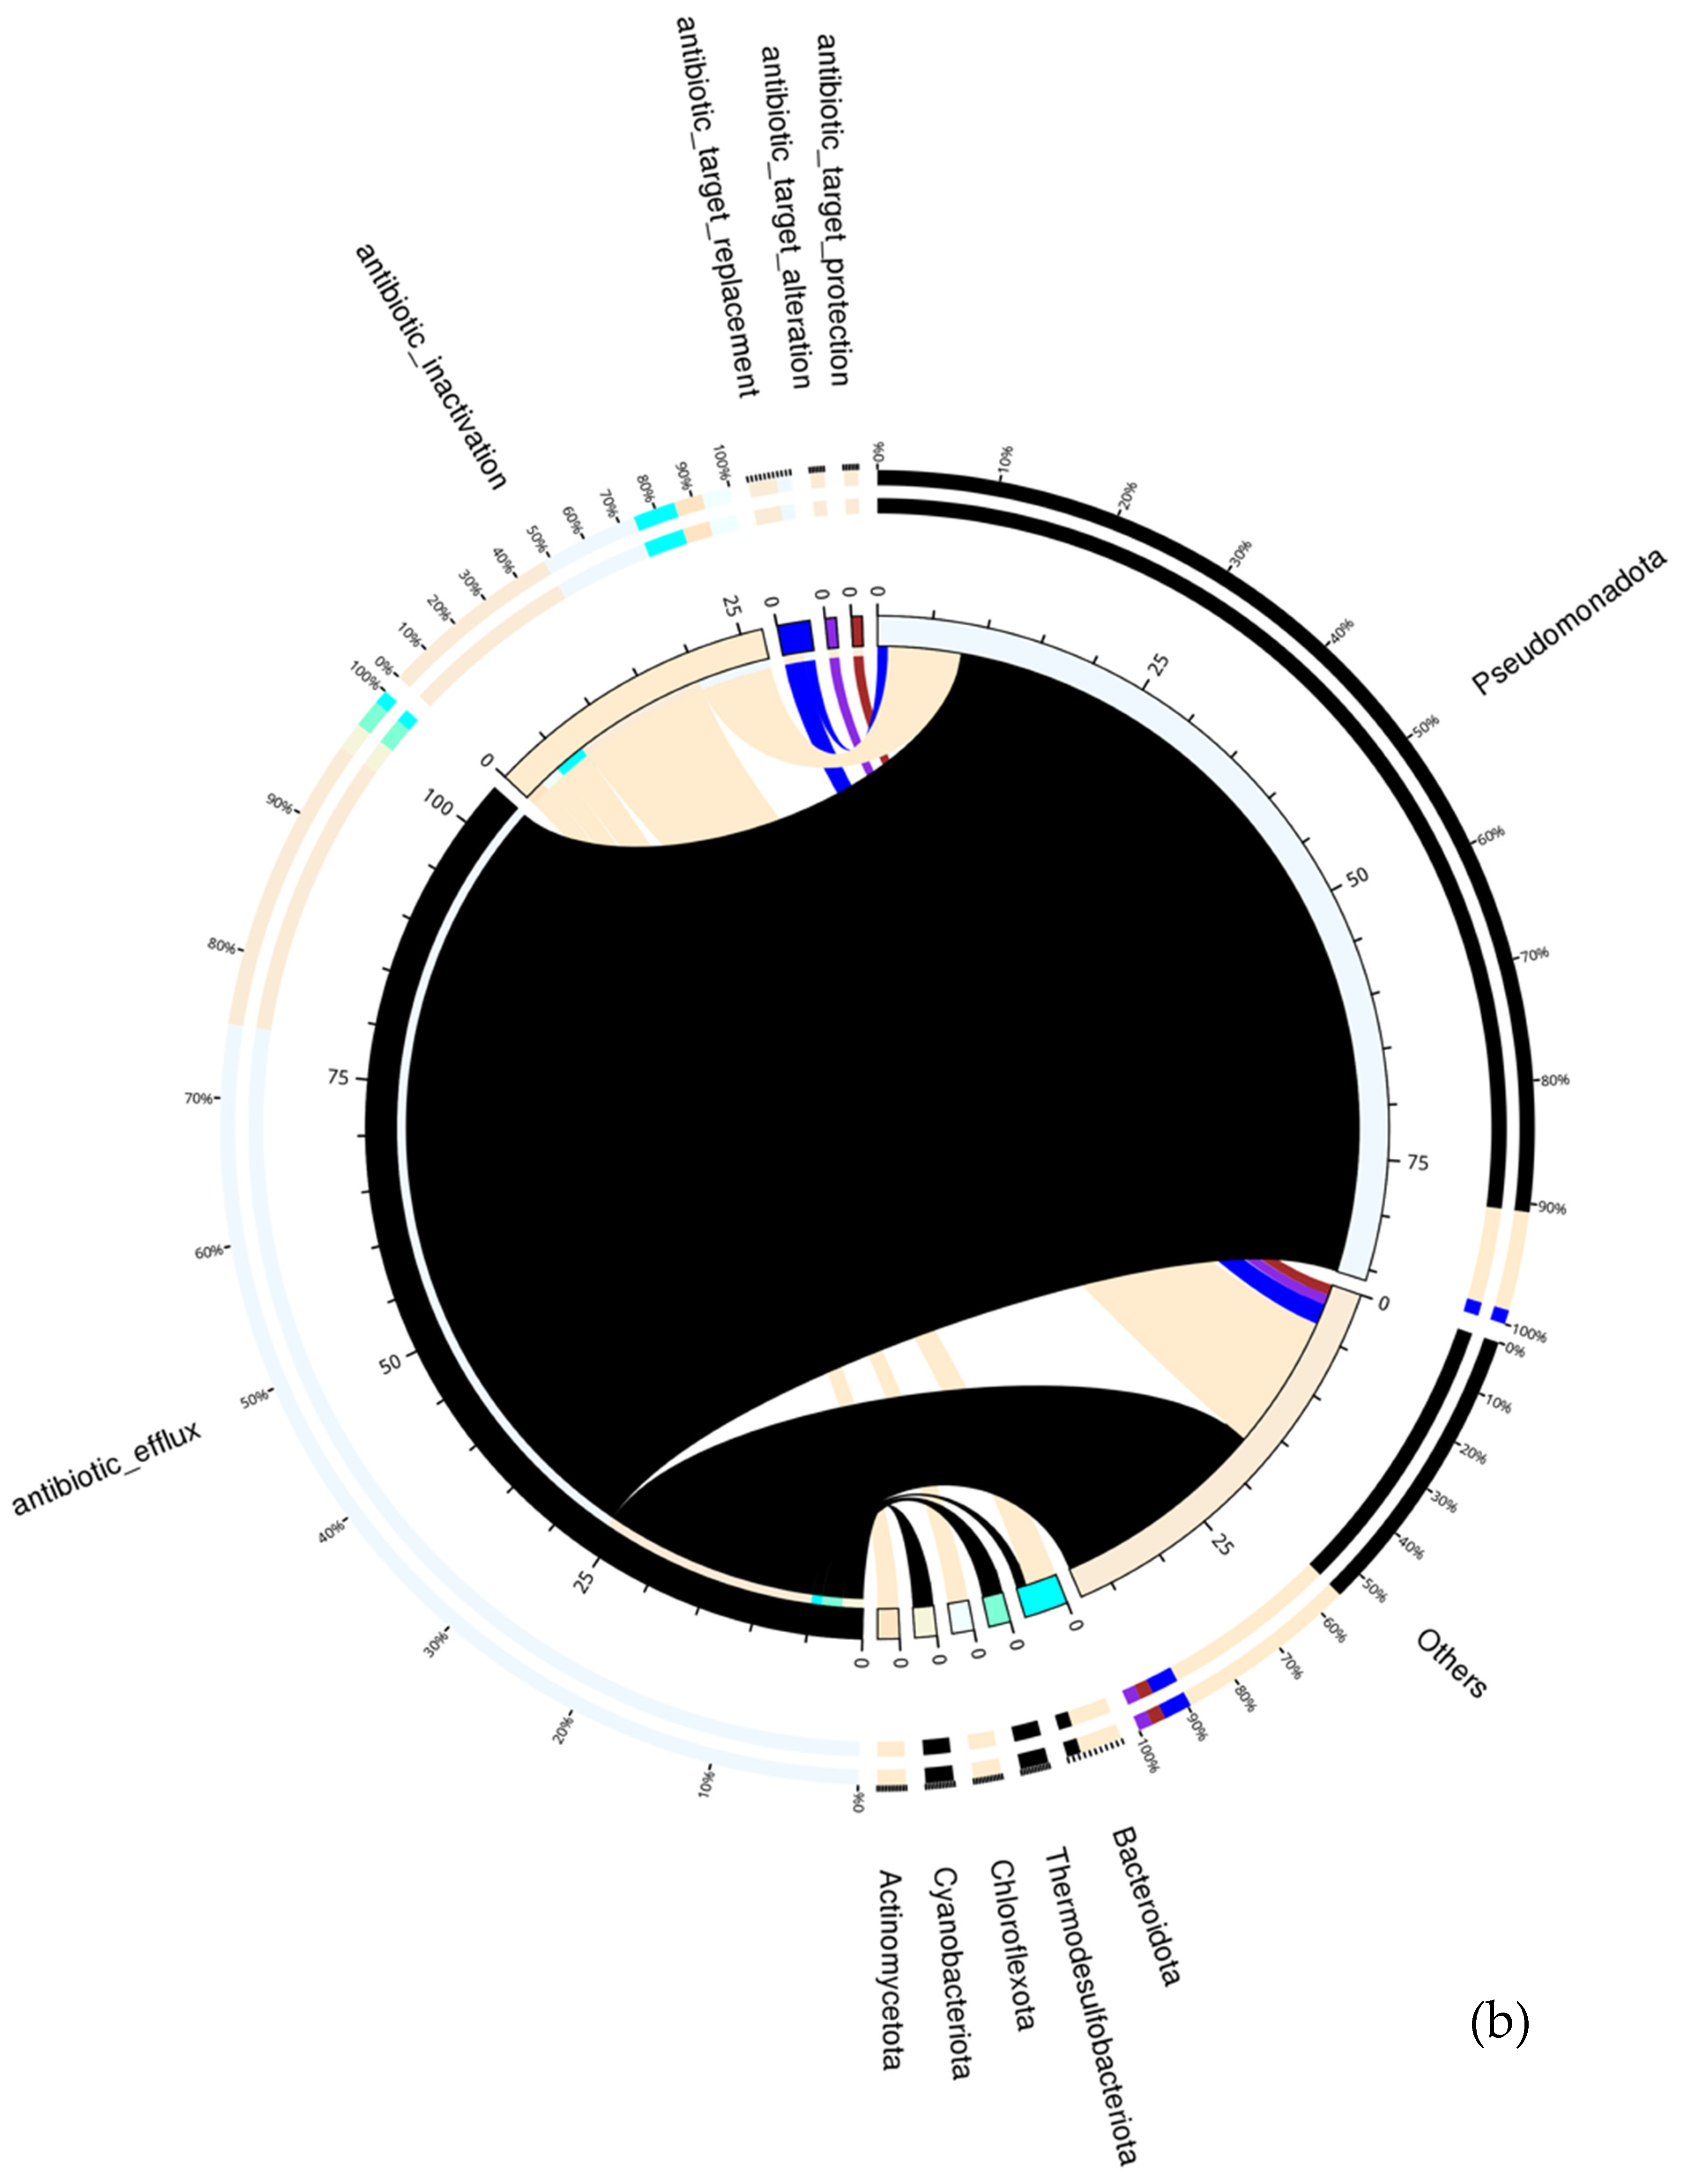
The mechanism of antibiotic action was investigated. The most dominant action of ARGs was antibiotic efflux, followed by antibiotic inactivation in marine sediments. The other mechanisms were antibiotic target alteration, antibiotic target replacement, and antibiotic target protection (Figure 4a). Some genes synergistically acted through two mechanisms of action (Table S5). The phyla Proteobacteria possessed maximum genes involved in the antibiotic efflux mode of action. Bacterial phyla such as Actinobacteria, Chloroflexi, Cyanobacteria, Bacteroidetes, Firmicutes, Verrumicrobiaea, and ARGs also originated from some archaeal phyla such as Candidatus, Tectomicrobia, Thaumarcheota, and Euarcheaota.
In the case of Jahra reserve samples, the microbial hosts were Pseudomonadota, Bacteroidota, Thermodesulfobacteriota, Chloroflexota, Cyanobacteriota, Actinomycetota, and others. The mechanism of antibiotic action was antibiotic efflux > antibiotic inactivation > antibiotic target replacement > antibiotic target alteration and antibiotic target protection (Figure 4b; Table S6).

8. Discussions

The data show that out of the 25 sampled locations, the coprostanol concentration was <dl at only four locations, and in 21 locations it was significantly higher, suggesting the ubiquitous presence of faecal contamination in the study area despite the enormous wastewater treatment facilities and the claims that all the wastewater generated is treated. This is not the first time such exceedances in coprostanol have been observed; in a previous investigation, Lyons et al. [46] reported 3 locations where coprostanol levels were >500 ng g−1, 6 locations where the levels were between 100 and 500 ng g−1, and 18 coastal and 2 open water locations where the concentration was <100 ng g−1. Saeed et al. [47] reported >500 ng g−1 coprostanol from 13 locations in Kuwait Bay and 5 locations in the southern waters. Correlating the data generated in this study with the previous reports suggests sewage contamination is a chronic problem in the region, even though most of the wastewater is treated. The presence of pharmaceuticals in the wastewater effluent and the coastal waters of Kuwait was linked to the emergence of antimicrobial resistance. In addition to the presence of sterols, pharmaceuticals are reported in measurable concentrations in coastal and marine sediments [48,49,50,51,52,53,54] indicating the spatial distribution of sewage much beyond point source discharges. The presence of sterols, especially corprostanol, is a reliable indicator of faecal contamination. The ratios of corprostanol/cholestrol and coprostanol/(coprostanol + cholestanol) are robust indicators of faecal contamination. The coprostanol/cholesterol ratio >1 indicates severe sewage contamination; however, in this study, most sites have a coprostanol/cholesterol ratio of >0.2, which is indicative of faecal contamination. This lower ratio can be a result of the large spatial distribution of sewage, and the lowering of the ratio can also be due to the in situ production of cholesterol. A more robust coprostanol/(coprostanol + cholestanol) ratio indicates a similar trend, where most sites have a ratio >3 indicating sewage contamination.
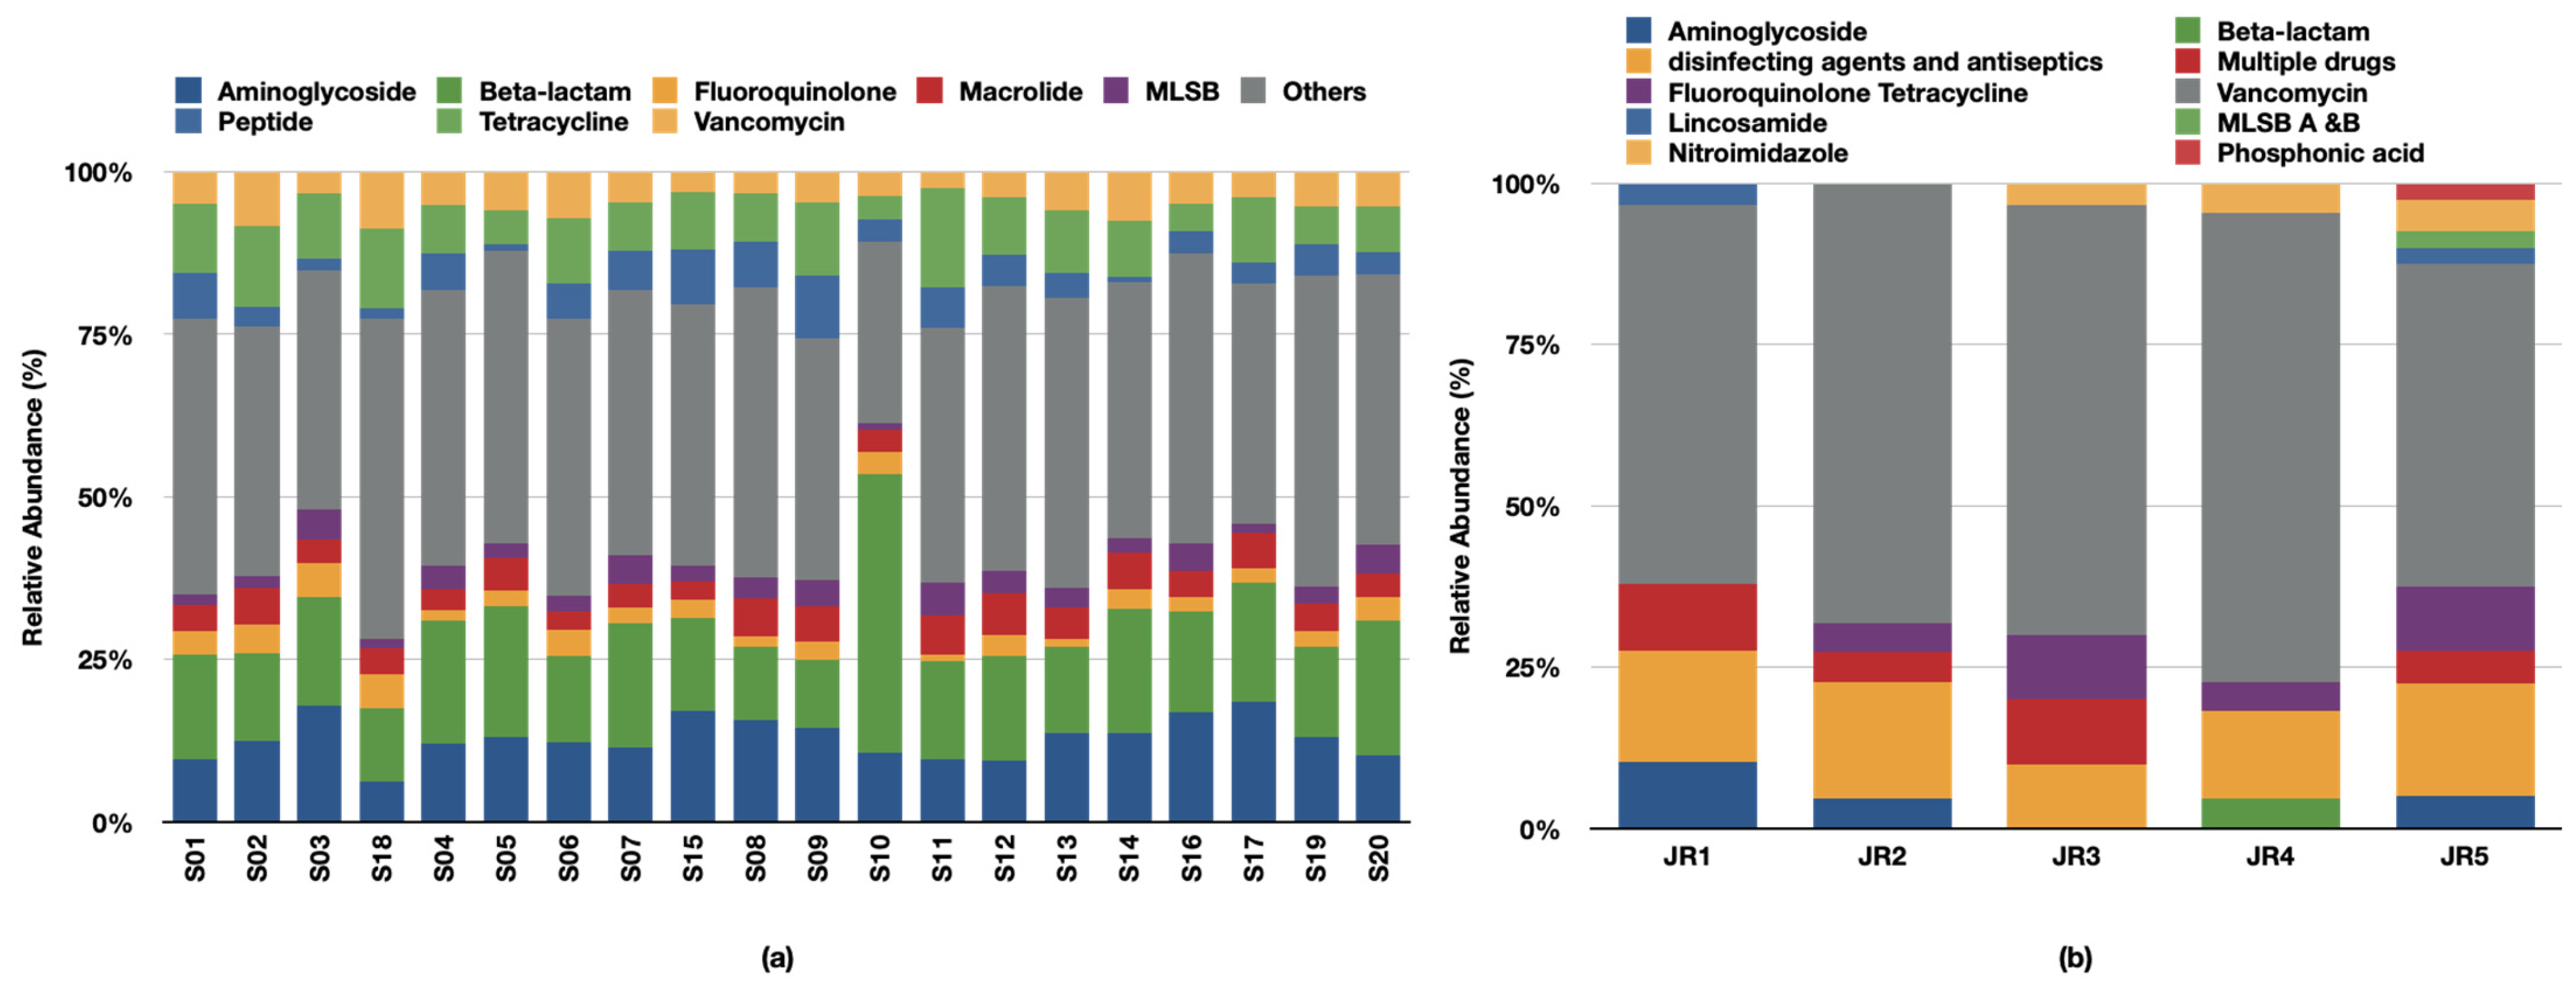
The ARGs in Kuwait marine sediments originated from 38 antibiotic families (Table S5), whereas the Jahra reserve samples belonged to 12 drug classes (Table S6). The drug classes with higher abundances were aminoglycoside, beta-lactams, fluoroquinolones, macrolide, MLSB (macrolide-lincosamide-streptogramin B), peptide, tetracycline, and vancomycin (Figure 5a). Several drug classes with <10 ARGs (nucleoside, acridine dye, antibacterial free fatty acids, nitroimidazole, bicyclomycin, elfamycin, fusidic acid, tetracenomycin, rhodamine, benzalkonium chloride, oxazolidnone, nitrofuran) were merged as others. In the Jahra reserve, the majority of the genes originated from the drug class of vancomycin, followed by disinfecting reagents (Figure 5b). Genes conferring resistance against fluroquinolone, phenicol, and diaminopyrimidine were grouped as multiple drugs. All the detected drug categories in the present study are used to treat bacterial infections of humans as well as animals. More intriguing is the presence of genes resistant against multiple antibiotics and the broad range of beta-lactams (cephalosporins, cephamycin, carbapenem, penam, penem, monobactam). Beta-lactams are the last choice of drugs used to treat chronic infections [55]. Multiple drug resistance is rising alarmingly and risking the lives of immunocompromised patients [56,57]. Resistance against aminoglycoside, beta-lactams, and macrolides was also observed elsewhere, i.e., deep ocean sediments of the northern South China Sea [58]. The efflux pumps were recorded in Kuwait’s marine sediments similar to other regions like the marine sediments collected from the polluted sites of Tolo Harbour [59]. In contrast, antibiotic inactivation was more prevalent in contaminated sites of the South China Sea [58]. ARGs also originated from archaeal phyla such as Candidatus Tectomicrobia, Thaumarcheota, and Euarcheaota. In addition to these archaeal families, viral contigs also hosted ARGs in Hadal oceanic environments [60].
The 20 stations sampled were strategically considered to cover areas that are 3–4 kilometres away from the emergency outfall, while the 5 remote stations were considerably far (20–48 km) from any emergency outfall. The presence of ARGs at two near-coast stations, namely 2 and 3, and the offshore stations 17 and 20 where the corprostanol was <dl suggests potential confounding factors like horizontal gene transfer and heavy metals [61] can be responsible for the spread of ARGs. The presence of antibiotic resistant microbes at all other sites are suggestive of a positive correlation between the sterols and AMR. A study conducted in Oko Nigeria reported the co-occurrence of faecal coliforms (~105 CFU/mL) and multidrug resistant bacteria in shallow hand-dug drinking water wells. These sites were in the vicinity of pit latrines in the region. The concentrations of coprostanol ranged between 1.6 and 2.6 abs, indicating the occurrence of faecal contamination at these sites [62]. Faecal indicator microorganisms and sterols were cofound in sediments from Admiralty Bay, Antarctica [63]. In addition to this, both phenotypically and genotypically resistant E. coli were reported earlier in the marine environment of Kuwait [64]. The present study endorses the applicability of a multiparamter approach in assessments of faecal contamination and antimicrobial resistance, as advisories based on Enterococci alone are misleading at times [65].
ARGs were recorded in the deepest abyssal–hadal transition zones of the Mariana Trench as well [66]. Approximately 40.0% (n = 267) of ARGs detected presently were also found in the near-shore surface sediments of Kuwait [36]. There were 133 and 400 genes unique to coastal and off-shore sediments, respectively.

9. Conclusions

The data indicate that sewage contamination in the coastal waters is on a large spatial scale much beyond the point inputs. The presence of coprostanol at most sites indicates faecal contamination. The ratios above the uncontaminated threshold indicate the likely dispersal of sewage contamination with the currents and suspended particulate matter. The presence of antimicrobial resistance across the spatial domain correlates positively with faecal sterols. The lower coprostanol/cholesterol ratio can be attributed to the dispersion of faecal contamination, more specifically coprostanol and the in situ contribution of cholesterol. The AMR reporting can be supported by sterol data to support observations in the absence of pharmaceutical data.

Supplementary Materials

The following supporting information can be downloaded at: https://www.mdpi.com/article/10.3390/su16104320/s1, Table S1: Raw Sequence statistics; Table S2: Assembly statistics; Table S3: ARGs found in 20 sediment samples collected away from Kuwait ‘s shore; Table S4: ARGs filtered from Jahra reserve sediment samples; Table S5: Drug Classes and Resistance Mechanism sediment samples of Kuwait; Table S6: Drug Classes and Resistance Mechanism sediment samples Jahra reserve.

Author Contributions

S.U.: Conceptualisation, methodology, formal analysis, data curation, writing the original draft, review, and editing. N.H.: methodology, formal analysis, writing the original draft, visualisation. T.S.: Methodology, formal analysis, writing the original draft. H.A.A.-S.: Methodology. M.B.: Methodology, visualisation. M.F.: methodology and visualisation. All authors have read and agreed to the published version of the manuscript.

Funding

The authors are thankful to the Kuwait Institute for Scientific Research, Kuwait for supporting EM123C and to the Centre for Environment, Fisheries and Aquaculture Science, United Kingdom EM123C.

Institutional Review Board Statement

The study does not require any ethical approval, as no human subject was involved. These are coastal and marine environmental samples.

Informed Consent Statement

No human subject is involved in this study, hence no consent to participate was obtained.

Data Availability Statement

Raw Sequences have been deposited at National Centre for Biotechnology Information (NCBI) under accession nos. PRJNA819259 (SRR24653960- SRR24653979) and PRJNA1077636 (SRR28000231-SRR28000235).

Acknowledgments

The authors are thankful to Athina Papadopoulou, Nicola Coyle, and Will Le Quesne from the Centre for Environment, Fisheries and Aquaculture Science, United Kingdom for the very informative discussions.

Conflicts of Interest

The authors confirm there are no conflicts of interest to report.

References

  1. Honsel, L.E.; Reimann, L.; Vafeidis, A.T. Population development as a driver of coastal risk: Current trends and future pathways. Camb. Prism. Coast. Futures 2023, 1, e14. [Google Scholar] [CrossRef]
  2. Martínez, M.L.; Intralawan, A.; Vázquez, G.; Pérez-Maqueo, O.; Sutton, P.; Landgrave, R. The coasts of our world: Ecological, economic and social importance. Ecol. Econ. 2007, 63, 254–272. [Google Scholar] [CrossRef]
  3. Ram-Bidesi, V.; Lal, P.N.; Conner, N. Economics of Coastal Zone Management in the Pacific; IUCN: Gland, Switzerland; Suva, Fiji, 2011; xiv + 88. [Google Scholar]
  4. Mehvar, S.; Filatova, T.; Dastgheib, A.; De Ruyter van Steveninck, E.; Ranasinghe, R. Quantifying Economic Value of Coastal Ecosystem Services: A Review. J. Mar. Sci. Eng. 2018, 6, 5. [Google Scholar] [CrossRef]
  5. Klein, Y.L.; Osleeb, J.P.; Viola, M.R. Tourism-Generated Earnings in the Coastal Zone: A Regional Analysis. J. Coast. Res. 2004, 20, 1080–1088. [Google Scholar]
  6. Bateman, I.J.; Mace, G.M.; Fezzi, C.; Atkinson, G.; Turner, K. Economic Analysis for Ecosystem Service Assessments. Environ. Resour. Econ. 2011, 48, 177–218. [Google Scholar] [CrossRef]
  7. Jupp, B.P.; Uddin, S.; Fowler, S.W.; Faizuddin, M. Trace metal and TBT pollution in the Gulf and Oman: Spatial variation and hot spots. Environ. Sci. Pollut. Res. 2023, 30, 76351–76371. [Google Scholar] [CrossRef] [PubMed]
  8. Gevao, B.; Alegria, H.; Jaward, F.; Beg, M. Persistent Organic Pollutants in the Developing World; John Wiley & Sons, Ltd.: Chichester, UK, 2009; pp. 137–169. [Google Scholar]
  9. Zhang, B.; Matchinski, E.J.; Chen, B.; Ye, X.; Jing, L.; Lee, K. Chapter 21—Marine Oil Spills—Oil Pollution, Sources and Effects. In World Seas: An Environmental Evaluation, 2nd ed.; Sheppard, C., Ed.; Academic Press: Cambridge, MA, USA, 2019; pp. 391–406. [Google Scholar]
  10. Nicolaus, E.E.M.; Wright, S.R.; Barry, J.; Bolam, T.P.C.; Ghareeb, K.; Ghaloom, M.; Al-Kanderi, N.; Harley, B.F.M.; Le Quesne, W.J.F.; Devlin, M.J.; et al. Spatial and temporal analysis of the risks posed by total petroleum hydrocarbon and trace element contaminants in coastal waters of Kuwait. Mar. Pollut. Bull. 2017, 120, 422–427. [Google Scholar] [CrossRef] [PubMed]
  11. Gevao, B.; Uddin, S.; Krishnan, D.; Rajagopalan, S.; Habibi, N. Antibiotics in Wastewater: Baseline of the Influent and Effluent Streams in Kuwait. Toxics 2022, 10, 174. [Google Scholar] [CrossRef]
  12. Alder, A.C.; Schaffner, C.; Majewsky, M.; Klasmeier, J.; Fenner, K. Fate of beta-blocker human pharmaceuticals in surface water: Comparison of measured and simulated concentrations in the Glatt Valley Watershed, Switzerland. Water Res. 2010, 44, 936–948. [Google Scholar] [CrossRef] [PubMed]
  13. Zeilinger, J.; Steger-Hartmann, T.; Maser, E.; Goller, S.; Vonk, R.; Länge, R. Effects of synthetic gestagens on fish reproduction. Environ. Toxicol. Chem. 2009, 28, 2663–2670. [Google Scholar] [CrossRef] [PubMed]
  14. Weston, A.; Caminada, D.; Galicia, H.; Fent, K. Effects of lipid-lowering pharmaceuticals bezafibrate and clofibric acid on lipid metabolism in fathead minnow (Pimephales promelas). Environ. Toxicol. Chem. 2009, 28, 2648–2655. [Google Scholar] [CrossRef] [PubMed]
  15. Branchet, P.; Arpin-Pont, L.; Piram, A.; Boissery, P.; Wong-Wah-Chung, P.; Doumenq, P. Pharmaceuticals in the marine environment: What are the present challenges in their monitoring? Sci. Total Environ. 2021, 766, 142644. [Google Scholar] [CrossRef] [PubMed]
  16. Boxall, A.B.; Rudd, M.A.; Brooks, B.W.; Caldwell, D.J.; Choi, K.; Hickmann, S.; Innes, E.; Ostapyk, K.; Staveley, J.P.; Verslycke, T.; et al. Pharmaceuticals and personal care products in the environment: What are the big questions? Environ. Health Perspect 2012, 120, 1221–1229. [Google Scholar] [CrossRef] [PubMed]
  17. Le Quesne, W.; Baker-Austin, C.; Verner-Jeffreys, D.W.; Al-Sarawi, H.A.; Balkhy, H.H.; Lyons, B.P. Antimicrobial Resistance in the Gulf Cooperation Council Region: A proposed framework to assess threats, impacts and mitigation measures associated with AMR in the marine and aquatic environment. Environ. Int. 2018, 121, 1003–1010. [Google Scholar] [CrossRef] [PubMed]
  18. Grimalt, J.O.; Fernandez, P.; Bayona, J.M.; Albaiges, J. Assessment of fecal sterols and ketones as indicators of urban sewage inputs to coastal waters. Environ. Sci. Technol. 1990, 24, 357–363. [Google Scholar] [CrossRef]
  19. Florini, S.; Shahsavari, E.; Aburto-Medina, A.; Khudur, L.S.; Mudge, S.M.; Smith, D.J.; Ball, A.S. Are Sterols Useful for the Identification of Sources of Faecal Contamination in Shellfish? A Case Study. Water 2020, 12, 3076. [Google Scholar] [CrossRef]
  20. Venkatesan, M.I.; Ruth, E.; Kaplan, I.R. Coprostanols in Antarctic marine sediments: A biomarker for marine mammals and not human pollution. Mar. Pollut. Bull. 1986, 17, 554–557. [Google Scholar] [CrossRef]
  21. Kolm, H.E.; Gomes, K.V.; Ishii, F.K.; Martins, C.C. An integrated appraisement of multiple faecal indicator bacteria and sterols in the detection of sewage contamination in subtropical tidal creeks. Int. J. Hyg. Environ. Health 2018, 221, 1032–1039. [Google Scholar] [CrossRef] [PubMed]
  22. Venkatesan, M.I.; Kaplan, I.R. Sedimentary coprostanol as an index of sewage addition in Santa Monica basin, southern California. Environ. Sci. Technol. 1990, 24, 208–214. [Google Scholar] [CrossRef]
  23. Frena, M.; Souza, M.R.R.; Damasceno, F.C.; Madureira, L.A.S.; Alexandre, M.R. Evaluation of anthropogenic contamination using sterol markers in a tropical estuarine system of northeast Brazil. Mar. Pollut. Bull. 2016, 109, 619–623. [Google Scholar] [CrossRef] [PubMed]
  24. Bull, I.D.; Lockheart, M.J.; Elhmmali, M.M.; Roberts, D.J.; Evershed, R.P. The origin of faeces by means of biomarker detection. Environ. Int. 2002, 27, 647–654. [Google Scholar] [CrossRef] [PubMed]
  25. Bethell, P.H.; Goad, L.J.; Evershed, R.P.; Ottaway, J. The Study of Molecular Markers of Human Activity: The Use of Coprostanol in the Soil as an Indicator of Human Faecal Material. J. Archaeol. Sci. 1994, 21, 619–632. [Google Scholar] [CrossRef]
  26. Gilpin, B.J.; Gregor, J.E.; Savill, M.G. Identification of the source of faecal pollution in contaminated rivers. Water Sci. Technol. 2002, 46, 9–15. [Google Scholar] [CrossRef]
  27. He, D.; Zhang, K.; Tang, J.; Cui, X.; Sun, Y. Using fecal sterols to assess dynamics of sewage input in sediments along a human-impacted river-estuary system in eastern China. Sci. Total Environ. 2018, 636, 787–797. [Google Scholar] [CrossRef] [PubMed]
  28. Marvin, C.; Coakley, J.; Mayer, T.; Brown, M.; Thiessen, L. Application of Faecal Sterol Ratios in Sediments and Effluents as Source Tracers. Water Qual. Res. J. 2001, 36, 781–792. [Google Scholar] [CrossRef]
  29. An, Y.-J.; Kampbell, D.H.; Peter Breidenbach, G. Escherichia coli and total coliforms in water and sediments at lake marinas. Environ. Pollut. 2002, 120, 771–778. [Google Scholar] [CrossRef] [PubMed]
  30. Rovirosa, N.; Sánchez, E.; Cruz, M.; Veiga, M.C.; Borja, R. Coliform concentration reduction and related performance evaluation of a down-flow anaerobic fixed bed reactor treating low-strength saline wastewater. Bioresour. Technol. 2004, 94, 119–127. [Google Scholar] [CrossRef] [PubMed]
  31. Carreira, R.; Wagener, A.; Readman, J. Sterols as markers of sewage contamination in a tropical urban estuary (Guanabara Bay, Brazil): Space-time variations. Estuar. Coast. Shelf Sci. 2004, 60, 587–598. [Google Scholar] [CrossRef]
  32. Pratt, C.; Warnken, J.; Leeming, R.; Arthur, J.M.; Grice, D.I. Detection of Intermittent Sewage Pollution in a Subtropical, Oligotrophic, Semi-enclosed Embayment System Using Sterol Signatures in Sediments. Environ. Sci. Technol. 2007, 41, 792–802. [Google Scholar] [CrossRef] [PubMed]
  33. Reeves, A.D.; Patton, D. Faecal sterols as indicators of sewage contamination in estuarine sediments of the Tay Estuary, Scotland: An extended baseline survey. Hydrol. Earth Syst. Sci. 2005, 9, 81–94. [Google Scholar] [CrossRef]
  34. Carvalho, F.P.; Villeneuve, J.P.; Cattini, C. Determination of organochlorine compounds, petroleum hydrocarbons, and sterols in a sediment sample, IAEA-383. Results of an intercomparison exercise. Int. J. Environ. Anal. Chem. 1999, 75, 315–329. [Google Scholar] [CrossRef]
  35. Al-Sarawi, H.A.; Najem, A.B.; Lyons, B.P.; Uddin, S.; Al-Sarawi, M.A. Antimicrobial Resistance in Escherichia coli Isolated from Marine Sediment Samples from Kuwait Bay. Sustainability 2022, 14, 11325. [Google Scholar] [CrossRef]
  36. Habibi, N.; Uddin, S.; Lyons, B.; Al-Sarawi, H.A.; Behbehani, M.; Shajan, A.; Razzack, N.A.; Zakir, F.; Alam, F. Antibiotic Resistance Genes Associated with Marine Surface Sediments: A Baseline from the Shores of Kuwait. Sustainability 2022, 14, 8029. [Google Scholar] [CrossRef]
  37. Klindworth, A.; Pruesse, E.; Schweer, T.; Peplies, J.; Quast, C.; Horn, M.; Glöckner, F.O. Evaluation of general 16S ribosomal RNA gene PCR primers for classical and next-generation sequencing-based diversity studies. Nucleic Acids Res. 2013, 41, e1. [Google Scholar] [CrossRef] [PubMed]
  38. Habibi, N.; Uddin, S.; Behbehani, M.; Kishk, M.; Abdul Razzack, N.; Zakir, F.; Shajan, A. Antibiotic Resistance Genes in Aerosols: Baseline from Kuwait. Int. J. Mol. Sci. 2023, 24, 6756. [Google Scholar] [CrossRef] [PubMed]
  39. Habibi, N.; Uddin, S.; Al-Sarawi, H.; Aldhameer, A.; Shajan, A.; Zakir, F.; Abdul Razzack, N.; Alam, F. Metagenomes from Coastal Sediments of Kuwait: Insights into the Microbiome, Metabolic Functions and Resistome. Microorganisms 2023, 11, 531. [Google Scholar] [CrossRef] [PubMed]
  40. Zhang, H.; Meltzer, P.; Davis, S. RCircos: An R package for Circos 2D track plots. BMC Bioinform. 2013, 14, 244. [Google Scholar] [CrossRef] [PubMed]
  41. Barter, R.L.; Yu, B. Superheat: An R package for creating beautiful and extendable heatmaps for visualizing complex data. J. Comput. Graph. Stat. 2018, 27, 910–922. [Google Scholar] [CrossRef] [PubMed]
  42. Readman, J.W.; Fillmann, G.; Tolosa, I.; Bartocci, J.; Mee, L.D. The use of steroid markers to assess sewage contamination of the Black Sea. Mar. Pollut. Bull. 2005, 50, 310–318. [Google Scholar] [CrossRef] [PubMed]
  43. Tolosa, I.; Mesa, M.; Alonso-Hernandez, C.M. Steroid markers to assess sewage and other sources of organic contaminants in surface sediments of Cienfuegos Bay, Cuba. Mar. Pollut. Bull. 2014, 86, 84–90. [Google Scholar] [CrossRef] [PubMed]
  44. Anceski Bataglion, G.; Koolen, H.; Weber, R.; Eberlin, M. Quantification of Sterol and Triterpenol Biomarkers in Sediments of the Cananéia-Iguape Estuarine-Lagoonal System (Brazil) by UHPLC-MS/MS. Int. J. Anal. Chem. 2016, 2016, 8361375. [Google Scholar] [CrossRef] [PubMed]
  45. Resende, M.F.; Santos, M.D.R.; Matos, R.C.; Matos, M.A.C. The analysis of faecal sterols in sediment samples by HPLC-UV using ultrasound-assisted treatment. Anal. Methods 2014, 6, 9581–9587. [Google Scholar] [CrossRef]
  46. Jing, H.; Xiao, X.; Zhang, Y.; Li, Z.; Jian, H.; Luo, Y.; Han, Z. Composition and ecological roles of the core microbiome along the Abyssal-Hadal transition zone sediments of the Mariana Trench. Microbiol. Spectr. 2022, 10, e01988-21. [Google Scholar] [CrossRef] [PubMed]
  47. Lyons, B.P.; Devlin, M.J.; Abdul Hamid, S.A.; Al-Otiabi, A.F.; Al-Enezi, M.; Massoud, M.S.; Al-Zaidan, A.S.; Smith, A.J.; Morris, S.; Bersuder, P.; et al. Microbial water quality and sedimentary faecal sterols as markers of sewage contamination in Kuwait. Mar. Pollut. Bull. 2015, 100, 689–698. [Google Scholar] [CrossRef] [PubMed]
  48. Saeed, T.; Al-Shimmari, F.; Al-Mutairi, A.; Abdullah, H. Spatial assessment of the sewage contamination of Kuwait’s marine areas. Mar. Pollut. Bull. 2015, 94, 307–317. [Google Scholar] [CrossRef] [PubMed]
  49. Hogarth, C.; Arnold, K.; McLauchlin, A.; Rannard, S.P.; Siccardi, M.; McDonald, T.O. Evaluating the impact of systematic hydrophobic modification of model drugs on the control, stability and loading of lipid-based nanoparticles. J. Mater. Chem. B 2021, 9, 9874–9884. [Google Scholar] [CrossRef] [PubMed]
  50. Baena-Nogueras, R.M.; Hobman, J.L.; Gomes, R.L. Chapter 4—Occurrence and distribution of antibiotics and antibiotic resistance determinants in coastal environments. In Pharmaceuticals in Marine and Coastal Environments; Durán-Álvarez, J.C., Jiménez-Cisneros, B., Eds.; Elsevier: Amsterdam, The Netherlands, 2021; Volume 1, pp. 121–167. [Google Scholar]
  51. Beiras, R. Chapter 6—Environmental risk assessment of pharmaceutical and personal care products in estuarine and coastal waters. In Pharmaceuticals in Marine and Coastal Environments; Durán-Álvarez, J.C., Jiménez-Cisneros, B., Eds.; Elsevier: Amsterdam, The Netherlands, 2021; Volume 1, pp. 195–252. [Google Scholar]
  52. Biel-Maeso, M.; Lara-Martín, P.A. Chapter 1—Point and diffuse sources of pharmaceuticals in coastal zones. In Pharmaceuticals in Marine and Coastal Environments; Durán-Álvarez, J.C., Jiménez-Cisneros, B., Eds.; Elsevier: Amsterdam, The Netherlands, 2021; Volume 1, pp. 1–25. [Google Scholar]
  53. Durán-Álvarez, J.C.; Mejia-Almaguer, D.; del Campo, M.N. Chapter 2—Occurrence, spatiotemporal distribution and environmental fate of pharmaceutical residues in urban estuaries. In Pharmaceuticals in Marine and Coastal Environments; Durán-Álvarez, J.C., Jiménez-Cisneros, B., Eds.; Elsevier: Amsterdam, The Netherlands, 2021; Volume 1, pp. 27–89. [Google Scholar]
  54. Mahjoub, O.; Chmengui, W. Chapter 3—Pharmaceutical active compounds in marine and coastal environments of arid and semi-arid countries of the Arab region. In Pharmaceuticals in Marine and Coastal Environments; Durán-Álvarez, J.C., Jiménez-Cisneros, B., Eds.; Elsevier: Amsterdam, The Netherlands, 2021; Volume 1, pp. 91–119. [Google Scholar]
  55. Prado, B.; Rodríguez-Varela, M.; Castro-Gutiérrez, J.A. Chapter 11—Occurrence of pharmaceutical residues in marine sediments. In Pharmaceuticals in Marine and Coastal Environments; Durán-Álvarez, J.C., Jiménez-Cisneros, B., Eds.; Elsevier: Amsterdam, The Netherlands, 2021; Volume 1, pp. 351–377. [Google Scholar]
  56. Chen, J.; McIlroy, S.E.; Archana, A.; Baker, D.M.; Panagiotou, G. A pollution gradient contributes to the taxonomic, functional, and resistome diversity of microbial communities in marine sediments. Microbiome 2019, 7, 104. [Google Scholar] [CrossRef]
  57. Chen, B.; Yang, Y.; Liang, X.; Yu, K.; Zhang, T.; Li, X. Metagenomic profiles of antibiotic resistance genes (ARGs) between human impacted estuary and deep ocean sediments. Environ. Sci. Technol. 2013, 47, 12753–12760. [Google Scholar] [CrossRef]
  58. Su, H.; Wu, C.; Han, P.; Liu, Z.; Liang, M.; Zhang, Z.; Wang, Z.; Guo, G.; He, X.; Pang, J. The microbiome and its association with antibiotic resistance genes in the hadal biosphere at the Yap Trench. J. Hazard. Mater. 2022, 439, 129543. [Google Scholar] [CrossRef] [PubMed]
  59. Tooke, C.L.; Hinchliffe, P.; Bragginton, E.C.; Colenso, C.K.; Hirvonen, V.H.; Takebayashi, Y.; Spencer, J. β-Lactamases and β-Lactamase Inhibitors in the 21st Century. J. Mol. Biol. 2019, 431, 3472–3500. [Google Scholar] [CrossRef] [PubMed]
  60. Tanwar, J.; Das, S.; Fatima, Z.; Hameed, S. Multidrug resistance: An emerging crisis. Interdiscip. Perspect. Infect. Dis. 2014, 2014, 541340. [Google Scholar] [CrossRef] [PubMed]
  61. Thompson, T. The staggering death toll of drug-resistant bacteria. Nature 2022. [Google Scholar] [CrossRef] [PubMed]
  62. Li, Y.-J.; Yuan, Y.; Tan, W.-B.; Xi, B.-D.; Wang, H.; Hui, K.-L.; Chen, J.-B.; Zhang, Y.-F.; Wang, L.-F.; Li, R.-F. Antibiotic resistance genes and heavy metals in landfill: A review. J. Hazard. Mater. 2024, 464, 132395. [Google Scholar] [CrossRef] [PubMed]
  63. Ayandele, A.A.; Adewoyin, A.G.; Olatunde, S.K. Detection of antibiotic resistant bacteria and sterol concentration in hand dug wells cited near pit latrine in Southwestern Nigeria. J. Microbiol. Antimicrob. 2018, 11, 11–21. [Google Scholar] [CrossRef]
  64. Martins, C.D.; Montone, R.C.; Gamba, R.C.; Pellizari, V.H. Sterols and fecal indicator microorganisms in sediments from Admiralty Bay, Antarctica. Braz. J. Oceanogr. 2005, 53, 1–2. [Google Scholar] [CrossRef]
  65. Sarawi, H.A.A.; Habibi, N.; Uddin, S.; Jha, A.N.; Al-Sarawi, M.A.; Lyons, B.P. Antibiotic Resistance Mediated by Escherichia coli in Kuwait Marine Environment as Revealed through Genomic Analysis. Antibiotics 2023, 12, 1366. [Google Scholar]
  66. Powers, N.C.; Wallgren, H.R.; Marbach, S.; Turner, J.W. Relationship between rainfall, fecal pollution, antimicrobial resistance, and microbial diversity in an urbanized subtropical bay. Appl. Environ. Microbiol. 2020, 86, e01229-20. [Google Scholar] [CrossRef] [PubMed]
Figure 1. Kuwait map with marked points of sample collection.
Sustainability 16 04320 g001
Figure 2. Bacterial gene (16S rRNA) copies detected within the marine sediments collected from Kuwait. The sampling locations are located on the x-axis. The respective gene counts as estimated by the quantitative polymerase chain reaction (qPCR) have been plotted on the y-axis. Each box represents an interquartile range of 25–75%. The upper and lower whiskers point to 10 and 90%, and the black line indicates mean copy numbers. The box plots were created in GraphPad Prism version 10.
Sustainability 16 04320 g002
Figure 3. Detection of ARGs in (a) marine sediments of Kuwait and (b) sediments from Jahra reserve. The heat maps were created in Rpackage (gplots). The x-axis denotes the sampling locations, and the y-axis shows the genes identified. Genes were filtered through the Comprehensive Antibiotic Resistance Genes Database (CARD) (blastp e value ≤ 1 × 10). Black colour signifies the presence, whereas white represents the absence of the gene at the respective location.
Sustainability 16 04320 g003
Figure 4. Mechanism of action and microbial hosts of the ARGs found in (a) marine sediments and in (b) Jahra reserve sediments. The predominant 10 bacterial taxons and their mechanism of action were laid on the circus plots employing Rcircos.
Sustainability 16 04320 g004aSustainability 16 04320 g004b
Figure 5. Bar charts showing the most abundant drug classes in (a) marine sediments and (b) Jahra reserve. The x-axis shows the sampling locations, and the relative abundances (RA%) are shown on the y-axis.
Sustainability 16 04320 g005
Table 1. Sampling locations and physico-chemical parameters.
Sample IDLocationLatitudeLongitudeSite DescriptionDates of Sample Collection
1Khadmah Bay29°23′10′′ N47°44′43′′ EA distal end of Kuwait Bay15 January 2023
2Near MPA29°21′12′′ N47°53′15′′ ENear Doha Multi-stage flash Power and Desalination Plant outfall15 January 2023
3Shuwaikh Outfall29°21′51′′ N47°56′59′′ EDistant to outfall receiving emergency waste near Shuwaikh Beach15 January 2023
4Sharq29°23′49′′ N47°59′02′′ EDistant to outfall receiving emergency waste near Kuwait City15 January 2023
5Kuwait Tower29°23′46′′ N48°00′12′′ EDistant to outfall receiving emergency waste 15 January 2023
6Marina Food Court29°20′55′′ N48°04′52′′ EDistant to outfall receiving emergency waste15 January 2023
7Al Bida29°18′54′′ N48°05′41′′ EDistant to outfall receiving emergency waste15 January 2023
8Khairan28°39′18′′ N48°23′50′′ EWastes from recreational resorts16 January 2023
9Ras Zour28°44′59′′ N48°24′17′′ EProximity to Al-Zour refinery16 January 2023
10Bnaider28°53′27′′ N48°16′45′′ ERecreational beach16 January 2023
11CFP Mina Abdulla28°58′44′′ N48°10′53′′ EThe area receiving refinery waste16 January 2023
12Fahaheel29°05′09′′ N48°08′36′′ EDistant to outfall receiving emergency waste16 January 2023
13Mahboula29°08′19′′ N48°08′12′′ EDistant to outfall receiving emergency waste16 January 2023
14Eagila29°11′01′′ N48°07′24′′ EDistant to outfall receiving emergency waste16 January 2023
15Messila29°15′29′′ N48°05′48′′ EDistant to outfall receiving sewage discharge16 January 2023
16Al Qaruh28°48′52′′ N48°46′45′′ EA remote island with oil contamination5 February 2023
17Umm Ul Maradim28°41′70′′ N48°39′30′′ ERemote island 5 February 2023
18Subiya outfall29°28′54′′ N48°07′10′′ EWaste of Subiya power plant6 February 2023
19Failaka29°25′57′′ N48°15′54′′ EWastes from resorts on the island6 February 2023
20Auha29°23′10′′ N48°17′40′′ ERemote uninhabited island 6 February 2023
JR1Jahra Reserve 29°21′32′′ N47°41′37′′ ELake in Jahra Pool Reserve11 May 2023
JR2Jahra Reserve 29°21′41′′ N47°42′22′′ ELake in Jahra Pool Reserve11 May 2023
JR3Jahra Reserve 29°21′42′′ N47°41′25′′ EOutflow to Sea 11 May 2023
JR4Jahra Reserve 29°21′52′′ N47°41′33′′ ELake in Jahra Pool Reserve11 May 2023
JR5Jahra Reserve 29°21′32′′ N47°41′27′′ ELake in Jahra Pool Reserve11 May 2023
Average water temperature = 18.7 °C; average depth = 5–30 m; average salinity = 41.82‰; average salinity (17‰) shown as open triangles in Figure 1, average temperature (24.6 °C), depth (0–40 cm); outfall receiving emergency waste are conduits that are usually a stormwater network that is sometimes used to discharge waste in emergencies.
Table 2. Faecal sterols in sediment samples (ng g−1, dry wt.).
Samples ID CoprostanolEpicoprostanolCholesterolCholestanolCop/CholesterolEpicop/CopCop/(Cop + Cholestanol)
1778.39565.102889.202227.150.2690.7260.259
2<dl<dl<dl<dl---
3<dl<dl<dl<dl---
4279.14257.67604.29388.040.4620.9230.418
5303.80230.981315.22480.710.2310.7600.387
6 403.85399.04873.08658.650.4630.9880.380
7261.28237.33795.54428.970.3280.9080.379
8 194.17203.88427.18257.280.4551.0500.430
9196.32202.94963.24311.270.2041.0340.387
10 268.37274.762635.78472.840.1021.0240.362
11 238.23227.155531.58396.120.0430.9530.376
12206.11206.11531.81282.440.3881.0000.422
13 265.85200.00485.37275.610.5480.7520.491
14 253.59207.69425.64292.310.5960.8190.465
15 215.540.00729.32300.750.2960.0000.417
16243.77227.151016.62324.100.2400.9320.429
17<dl215.43436.17281.91---
18 459.77244.25681.03445.400.6750.5310.508
19 290.78297.87645.39586.880.4511.0240.331
20 <dl207.69384.62256.41---
JR1428.9216,401.965017.161345.590.08538.2400.242
JR25021.464727.473849.792493.561.3040.9410.668
JR3888.13271.692093.61863.010.4240.3060.507
JR418,713.134885.459858.59405.661.8980.2610.979
JR52800.005828.5729,800.0022,971.430.0942.0820.109
Note: red is severely contaminated; yellow indicates faecal contamination; green is uncontaminated sites.
Disclaimer/Publisher’s Note: The statements, opinions and data contained in all publications are solely those of the individual author(s) and contributor(s) and not of MDPI and/or the editor(s). MDPI and/or the editor(s) disclaim responsibility for any injury to people or property resulting from any ideas, methods, instructions or products referred to in the content.