1. Introduction
An essential element of any company’s strategy is to minimize the business risk to a level that ensures the safety of the market. To ensure efficiency, effectiveness, and competitiveness, the organization must implement a system and a comprehensive approach to managing risks, ranging from the identification of risks to analysis, the development of measures, and the evaluation of their effectiveness using appropriate tools and in a dynamic way that ensures that all the changes are considered and the risks resulting from them will be appropriately treated by this system. With a spectrum of factors impacting the business, such as regulatory risk, market disruption, the environment, human health, product safety, and even business model obsolescence, companies urgently need to rethink their management procedures. They need to shift their thinking to a risk-based strategy and risk-based decisionmaking, away from the operational level and regulatory compliance perspective [
1].
The risk management process provides a basis for informed decisionmaking to determine one or more courses of action. Risk management is a discipline of decisionmaking that should be integrated into all the aspects of the organization. One of the characteristics of effective and efficient risk management is its dynamic nature [
2,
3]. Risks can change, be minimized, or eliminated when the internal and external conditions that influence the organization’s purpose and strategic direction change. Risk management anticipates, recognizes, and reacts to these changes and events in an appropriate and timely manner [
4,
5]. Finally, the STN EN ISO 9001:2015 and IATF 16949:2016 standards applied in the automotive sector also emphasize the importance of effective quality management while taking risks into account [
6,
7,
8].
1.1. Risk
Risk is usually defined as something unstable and indeterminate, which is related to the course of the phenomenon and often disruptive to the intended behavior [
9]. Risk, uncertainty, and indeterminacy are part of the human activity in any environment [
10,
11,
12,
13]. We can analyze risk from different perspectives [
14]. The two main components of risk analysis are the probability that something will go wrong and the negative consequences if it does. Risks can be difficult to recognize, but not if we prepare properly [
15]. Therefore, risk analysis is an important tool in all cases where a job or process involves risk [
16,
17,
18]. It can help us to recognize and understand the risks we may be exposed to in any task. As explained in [
19], the risk environment (
Figure 1) in which we operate defines the risk areas that we can identify and control (the area of the gray circle), those that we can identify but not control (the area outside the circle bounded by a square), and finally all the existing risks, including the unknown and uncontrollable risks (the area bounded by the dashed line).
Risk as an effect of uncertainty is often expressed as a combination of the consequences of an event (including changes in circumstances) and the associated possibility of its occurrence [
19]. As part of a comprehensive approach to risk management, risk can be defined as the impact of uncertainty on the achievement of objectives [
3,
20,
21].
The term risk is an elusive construct with a variety of meanings, measures, and interpretations depending on the field of research [
22].
Risk is the product of the probability of an event to occur and the severity of its consequences [
23].
Risk is a two-dimensional entity (often referred to as risk equals impact times probability), and assessing the level of risk means assessing both the impact and probability and judging their combination against some risk criteria [
24].
Strategic management can be defined as a complex, continuous, and internally divided process of developing long-term goals and their gradual implementation under the conditions of a changing environment.
Strategic management involves the formulation and implementation of the key objectives and initiatives decided by the organization’s top management on behalf of the owners based on considering the resources and assessing the internal and external environments in which the organization operates [
25].
1.2. Risk Management
In a general sense, risk management refers to the architecture (principles, system, and processes) of effective risk management. Risk management refers to the practical application of this architecture to a specific risk. Risk management is a process in which the management attempts to prevent the effects of the existing and future factors and to propose solutions that help to eliminate the effects of undesirable influences and, on the contrary, enable the utilization of the opportunities created by the effects of positive influences [
26]. An integral part of the risk management process is a decisionmaking process based on risk analysis. Risk management develops, analyzes, and compares the possible preventive and regulatory measures, considering other factors, primarily economic and technical, but also social and political. From these measures, it then selects those that minimize the existing risk.
Risk assessment and risk management as scientific disciplines provide important contributions to support decisionmaking in practice [
27,
28,
29]. By implementing the risk management process, the management of the organization ensures that the resources are used appropriately and efficiently, which at least leads to the planned results [
30].
The risk management process helps in decisionmaking because it takes into account the uncertainties and the possibility of future events or circumstances and their impact on the established objectives [
23].
Risk management is a gradual process and can be divided into three steps: identification, assessment, and mitigation [
31].
The ISO 31000 standard has become an internationally recognized guide for implementing a logical and systematic risk management process that helps organizations to develop a risk management strategy, thereby increasing the probability of achieving their objectives and improving the protection of their assets. The main objective is to develop a risk management culture in which employees and stakeholders are aware of the importance of risk monitoring and management [
4,
32].
The risk management process involves the systematic application of policies, procedures, and practices in the areas of communication and consultation, identification, assessment, treatment, monitoring, control, recording, and reporting of risks [
2].
Risk management requires the development of alternative risk management plans for situations that may arise and trigger the implementation of appropriate corrective actions that we plan when a risk occurs, and this is detected and diagnosed with the cause of the risk [
33].
Surveys in this area confirm the dominance of the application of ISO 31000 in the decisionmaking processes [
34]. The fundamental principle and purpose of risk management is to create and protect value. The principles of risk management connect the framework and practice of risk management to the strategic objectives of the organization [
4].
Due to the increasing dynamics of socio-economic processes, risk and uncertainty are becoming more important and play a major role in decisionmaking. Dynamic management is management that assumes that the target system (i.e., the goals and the way alternative futures are evaluated) will change, although not necessarily in a predictable way [
35,
36,
37]. Dynamic management is a natural aspect of what is commonly referred to as risk management [
31,
38,
39]. Dynamic risk management can be defined as a continuous process of hazard identification, risk assessment, action to eliminate or reduce risk, monitoring, and review under rapidly changing operational event conditions [
40].
Several examples of the application of dynamic risk management in the field of safety management can be found in the literature; e.g., [
41,
42] state that the use of a dynamic risk management framework strengthens the risk-informed decisionmaking process through continuous monitoring, evaluation, and performance improvement. The use of dynamic risk management dashboards (DRMDs) has been evaluated as a proactive safety tool that complements the existing risk management [
43]. DRMDs provide support by identifying the cumulative risks of specific missions and effectively respond to unacceptable risks before a specific flight is authorized or cleared.
The authors of the study were motivated by the need of organizations operating in the automotive industry to manage the dynamics of the business environment. This has been achieved with the help of an appropriate model that, thanks to its universality, would help to ensure effective risk management in a holistic approach, thereby protecting their performance and meeting the needs of the relevant stakeholders. The strategic management process, which forms the framework of risk management in the certified organizations in the automotive industry, was used as a basic pillar of the research. Practice shows that the concept of risk management in organizations is not clearly structured. The individual elements are not linked to each other, and at the same time there is a lack of dynamism to ensure that the information is constantly updated and that the expected benefits are achieved.
Research objectives:
To analyze the current state of solving the problem of dynamic risk management.
To propose a suitable risk mapping (analysis) methodology that takes into account and strengthens the qualitative dimension of risk assessment and creates a subsequent building element of dynamic risk management in a suitable model.
To propose the structure of the dynamic risk management model for the strategic management process.
To verify the effectiveness of the proposed model in specific cases and evaluate the technical and economic benefits.
2. Materials and Methods
Recent surveys show positive trends in European companies in the integration of risk management into the decisionmaking process and companies’ management [
44,
45]. The most common objectives of risk management are to eliminate the impact of risks on the economic results (92%) and to ensure compliance with legislative requirements (91%) [
46]. The use of appropriate scenarios that include identified risks provides a qualitatively higher level to the strategic management process, more stability to the company, enables the setting of more realistic performance targets, and ultimately stimulates the growth of the company’s value [
47].
From the literature review, it is possible to use choose standardized and appropriately adapted risk management tools to manage risks and opportunities in organizations at both strategic and operational levels with an implemented quality management system, contributing to its efficiency and effectiveness and ensuring business continuity [
26,
48,
49]. The need for a holistic view of risks throughout the entire organization with an implemented quality management system according to ISO 9001:2015 or IATF 16949:2016 is a necessity in terms of the new concept of risk-based thinking, which usefully complements the existing risk management approaches in the automotive sector at the system level, e.g., with FMEA tools at the production process and product levels (IATF 16949). Only the use of appropriate tools to identify, assess, and control risks in the process of strategic management within the framework of risk-based thinking provides a suitable basis for the creation of a model of process-oriented risk management throughout the organization that ensures the achievement of the desired results while maintaining dynamisms. The synergy between risk management and process management contributes to their mutual improvement [
50].
In order to achieve the applicability of the research results in the real environment, cooperation with production organizations was established to implement and verify the benefits of the proposed model. Solving this problem helped us to answer key questions about the importance of a dynamic approach to risk management and the choice of appropriate tools given the ever-changing business environment in the automotive industry [
51]. The research was based on objective findings from statistical processing of data provided by companies in the sector. The research was carried out for the period 2015–2022. The information was collected by studying foreign and domestic literature and interviewing experts in the field. The collected data formed the starting point for the qualitative and quantitative analysis of the data. Qualitative and quantitative evaluation and processing of data comprise an approach that focuses on description, interpretation, and understanding through analysis and comparison. As part of this approach, mathematical and statistical methods were used to process the data from the questionnaire survey. The aim was to obtain accurate data on the perception of the proposed risks of the strategic management process and the proposed measures to address them.
2.1. Proposal and Implementation of a Solution
We carried out the research by gathering input information as part of the analysis of the context and stakeholder analysis with the help of a group of experts and then preparing this information for the strategic management process in the form of identified key risks and possible mitigation actions. These formed the basis for the creation of a multi-factor analysis of the selected risks identified. We then carried out a survey in the form of an online questionnaire with a sample of top management representatives of manufacturing companies operating in the automotive supply chain to assess their perception of the analysis of these risks based on the established criteria and the choice of the appropriate tool(s) for their management. The analysis obtained formed the basis for supporting decisionmaking mechanisms and developing a holistic and dynamic risk management model. Based on the data obtained, the model was created and implemented, and its usefulness was quantitatively verified in the form of a questionnaire survey and subsequent statistical analysis of the data obtained in two manufacturing companies. The process of implementation, the expected results, and the research techniques are clearly summarized (
Table 1).
2.2. Identification of Key Risks and Proposal of Measures to Manage Them
The need to identify key risks and propose actions because of the analysis of the organization and stakeholder needs is a logical outcome as the next step in the process of managing these risks by the organization to meet the organization’s objectives. We identified these through the affinity diagram and brainstorming within the expert group (
Table 2).
An affinity diagram is a tool for categorizing large amounts of scattered and complicated qualitative information—usually resulting from a brainstorming session—into small, manageable, and relevant groups [
52]. The creation of an affinity diagram is completed in a team and, mainly, intuitive thinking is applied when working on it.
2.3. Development of Risk Assessment Methodology
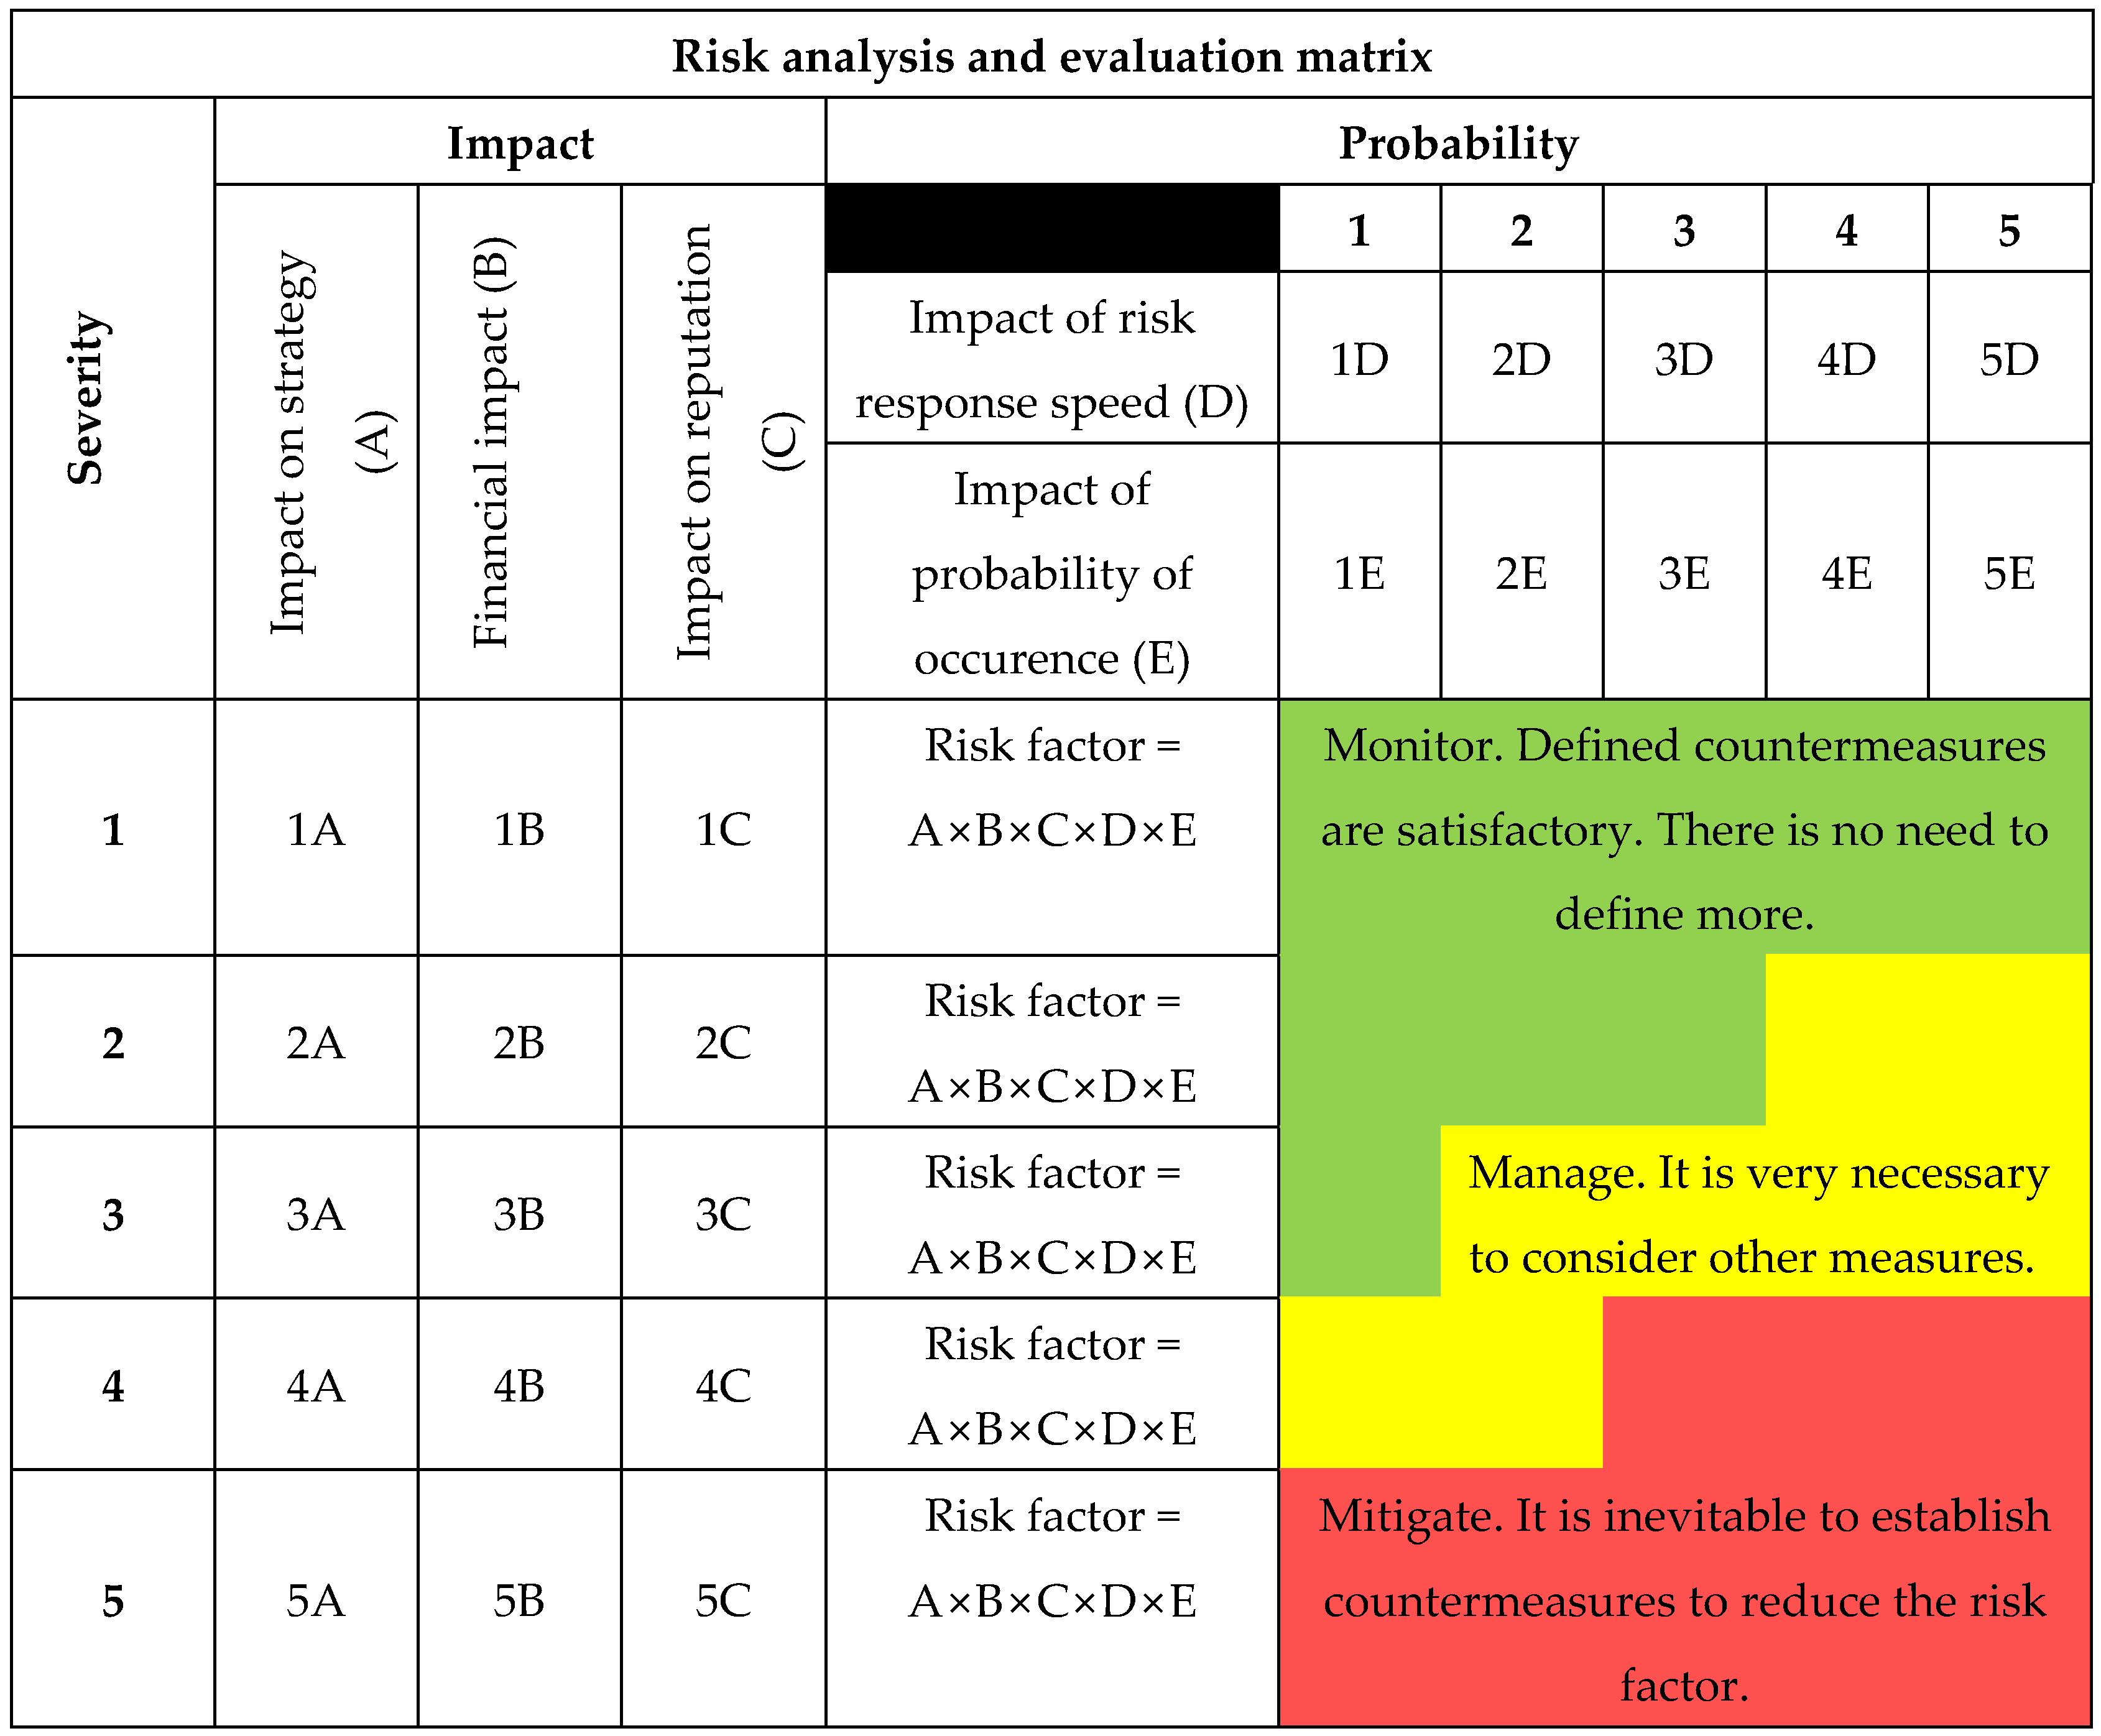
For the risk analysis, we created a rating table with a five-point scale. To provide the assessors with a broader view of the impact and probability of occurrence, we formulated additional components. In the case of impact, we selected the following components: impact on strategy, impact on reputation, and financial impact; in the case of probability, we added the component impact on speed of risk response. On the basis of the above assessment (
Table 3), we then analyzed the key strategic management risks selected by the respondents to the questionnaire survey.
In the next step of creating the risk management model, we transformed the above table into the form of a matrix, with the consequences axis consisting of three components (strategy, finance, and reputation) and the probabilities axis consisting of two components (probability and reaction speed). At the same time, we complemented the matrix with a decision field (heat map), which determines the position of the risk on the heat map based on the resulting risk factor (the product of all 5 components), namely in the areas of low (green area), medium (yellow area), and high (red area) risk value (
Figure 2). This classification of the risk then determines the expectations of how the organization should deal with the risk.
The creation of a functional methodology (mapping) of risk analysis in a complex environment with targeted simplification is a fundamental element of a dynamic risk management model. This model will significantly support the decisionmaking processes of strategic management and subsequently also the operational level of management of the individual processes. The use of multi-factorial probability method in combination with a central risk register enables a more precise dimensioning of risk assessment and makes a significant contribution to increasing the reliability of strategic management decisions.
The next step is to transfer the information on risks from the risk assessment, including proposed actions, to the proposed centralized risk register, which serves as a tool for recording the assessment and management of risks in the organization (
Figure 3). It can be used at strategic, sectoral, operational, and project levels when a large number of risks, management activities, and ways of dealing with risks need to be identified.
This register is then actively used as part of the developed model. To describe the strategic management process, we have used the SIPOC diagram as a visual representation of the process in the form of a table (
Table 4).
The SIPOC analysis is used to map the relationships between the analyzed process, its inputs and outputs, and the influence of customers and suppliers on the processes. It is the bridge between the problem definition and project scope in the project brief and the detailed process map. It helps to obtain a comprehensive picture of the mutual influences between the analyzed elements. We can also use the SIPOC to map process requirements. It is a very good tool for delimiting the area under consideration. It is a process map that covers both the supplier and the customer.
The visual SIPOC tool helps to understand the whole process, from start to finish. It provides valuable information about areas where there are major problems. The problems may be on the supplier’s side, they may be related to the input specifications, or they may be related to processes and results that do not meet the customer ‘s requirements. A SIPOC chart or diagram provides an excellent opportunity for teams, senior management, and all stakeholders to address process-related issues and develop appropriate improvement strategies accordingly. At the same time, it illustrates the continuity of this process with other QMS processes and the application of the selected tools.
The use of electronic questionnaires is on the increase. The reasons for this lie in the undeniable advantages, such as speed, cost-effectiveness, and facilitation of the entire research process. Another important factor is the rapidly growing number of people who actively use this means of communication.
The questionnaire was created using the software solution
www.survio.sk. We used the questionnaire to ensure quantitative data collection via a web form. The research sample was selected from production organizations (Tier1—direct suppliers to vehicle manufacturers up to Tier 4—level 4 contractors) operating in the automotive industry supply chain. The questionnaire was sent to 68 organizations in the automotive industry. The response rate was 100%.
The data were collected by evaluating the individual responses received. These were then analyzed using statistical methods. The responses show that the largest group of respondents included quality management representatives (60%), followed by general management representatives (22%), and the third largest group was production management representatives (9%).
The use of the best available information and the cooperation and involvement of stakeholders are essential for effective risk management. Appropriate stakeholder involvement helps to ensure that the information on which the risk assessment is based is valid and applicable, and that stakeholders understand the rationale for the decision. A cross-functional approach to risk identification and management contributes significantly to the effectiveness of the process. To test this assertion, the following research hypotheses are put forward.
2.4. Data Analysis Using the Cluster Method
The respondents’ data were analyzed using cluster analysis. Cluster analysis is a statistical method that uses computational procedures that aim to divide a data set into a number of relatively homogeneous clusters. The essence of cluster analysis is to form clusters of objects whose mutual similarity is as low as possible and at the same time the similarity of the objects within the cluster is as high as possible [
53,
54,
55]. One of the two main approaches to determining the number of significant clusters is the heuristic approach, which is one of the most widely used approaches to selecting significant clusters and represents the determination of the number of clusters based on the subjective opinion of the solver. The basic indicator of clustering quality is the comparison of intra-cluster and inter-cluster variance based on the intra-cluster variability matrix (Equation (1)):
and inter-cluster variability matrix (Equation (2)):
where
is the total vector of averages of feature values for the entire set. Clustering will be optimal if
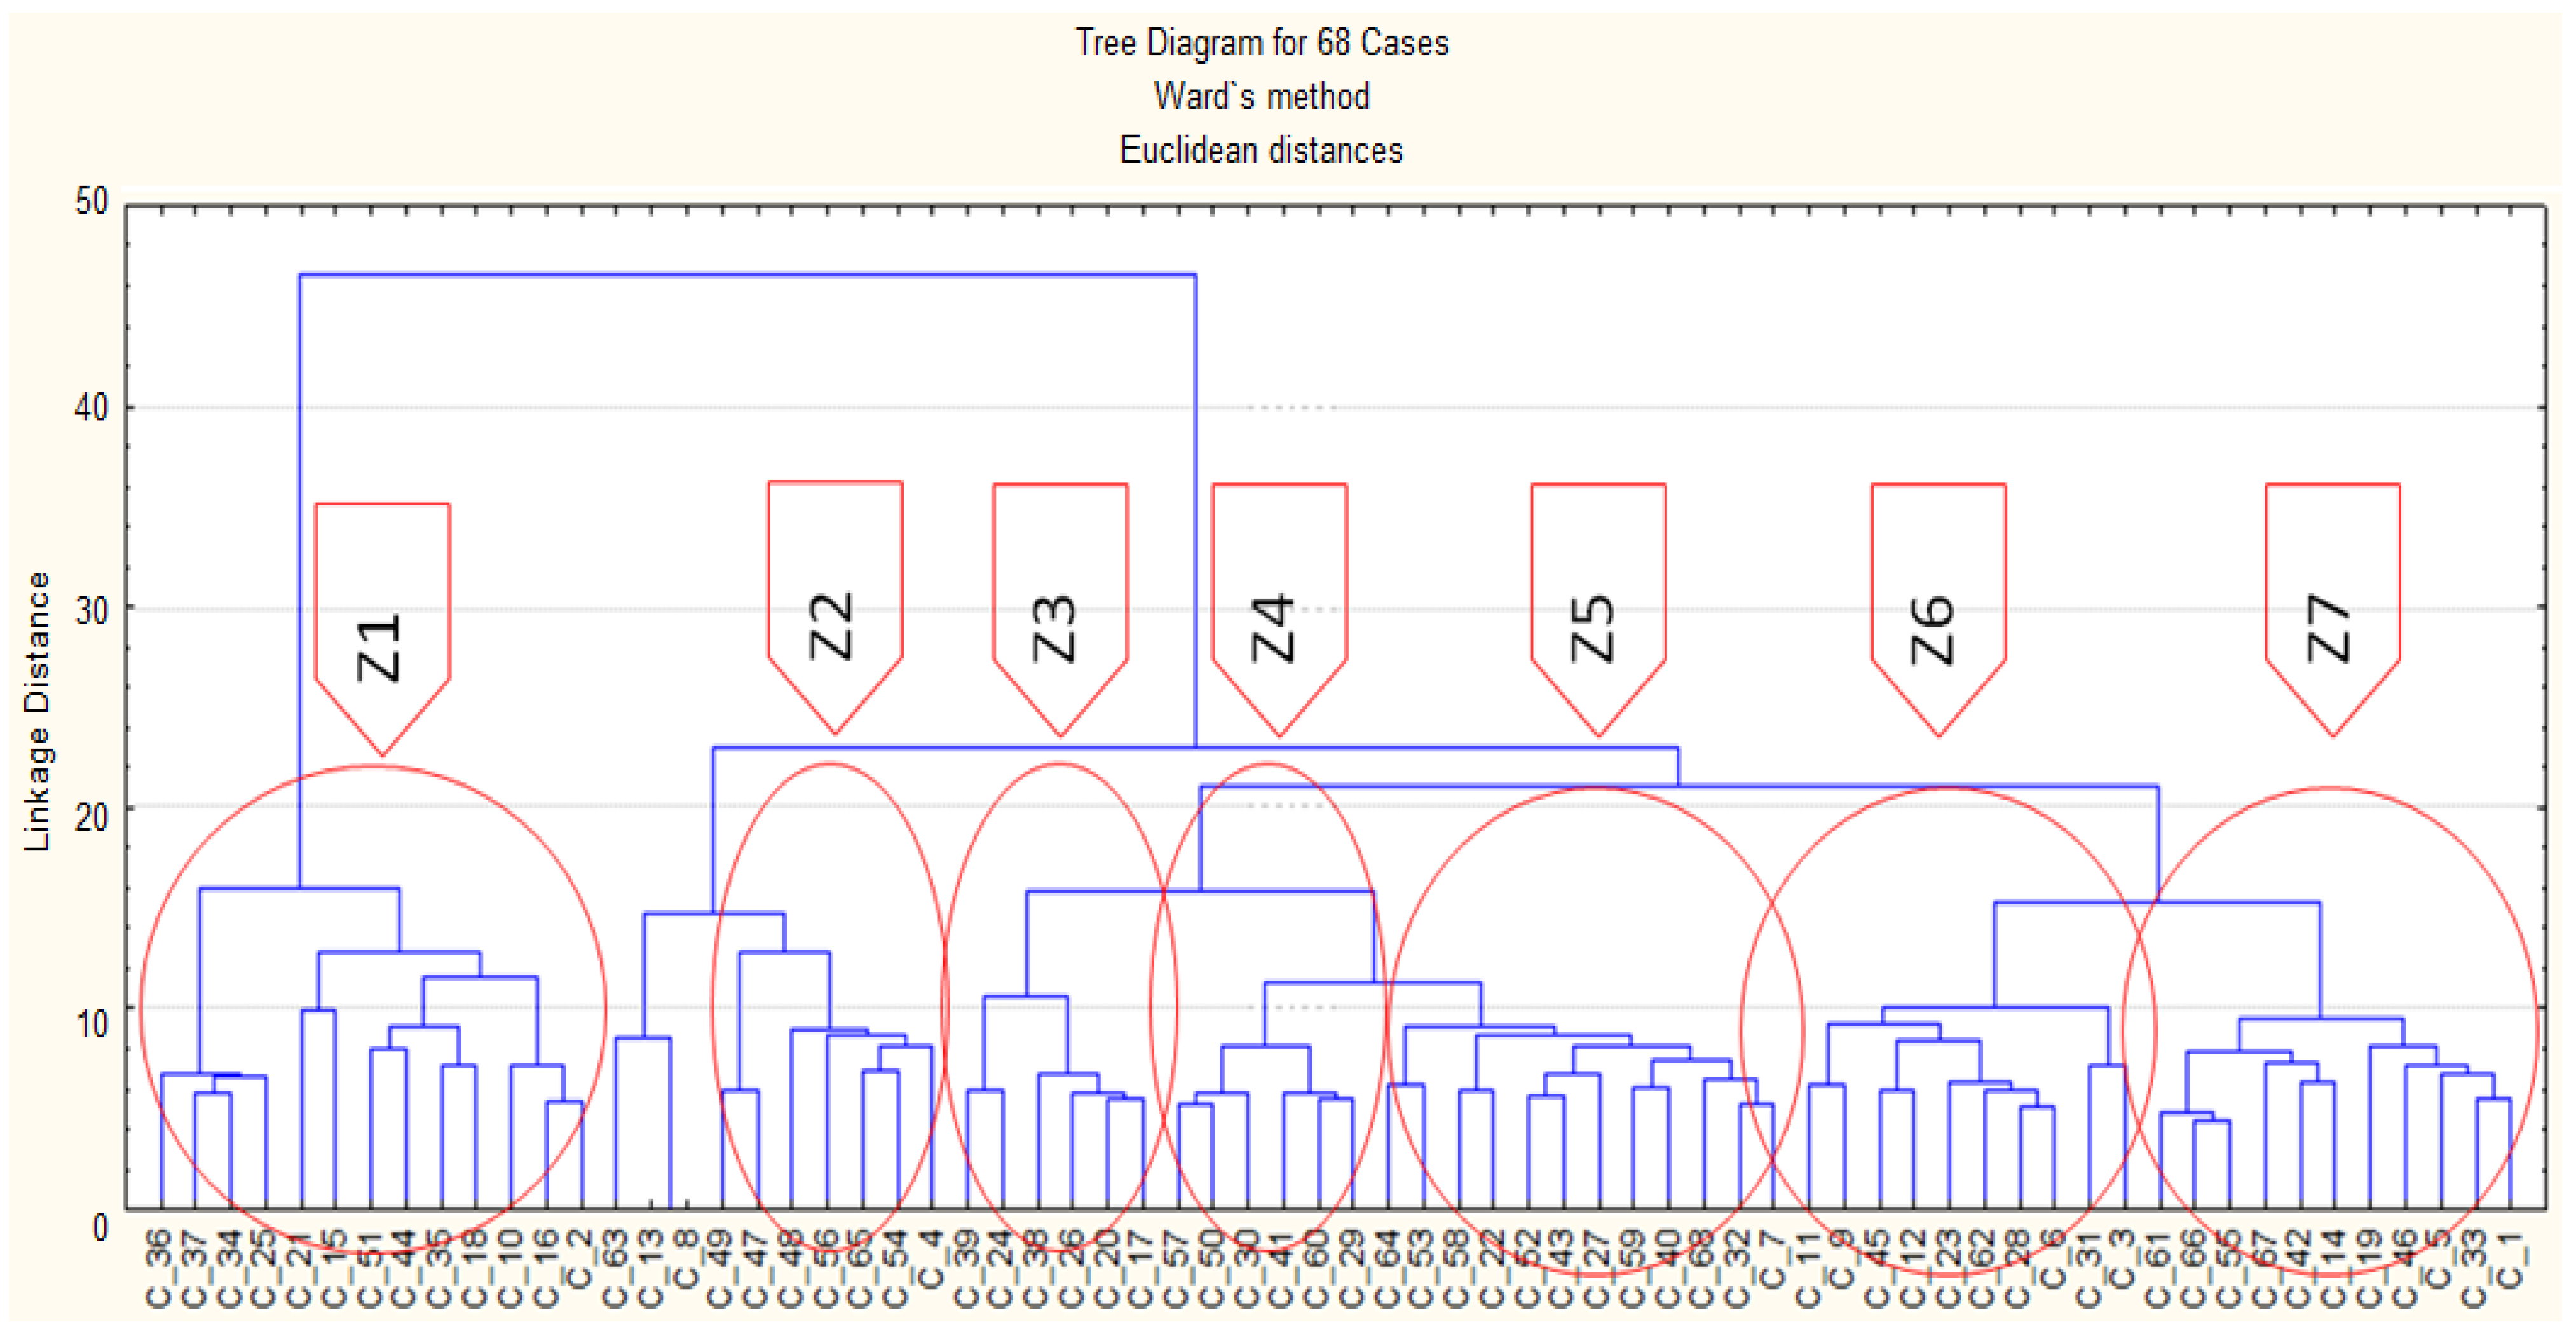
The result of the hierarchical cluster analysis is a two-dimensional diagram, a so-called dendrogram (
Figure 4 and
Figure 5), which graphically represents the clusters at different cluster levels and serves to illustrate the connections made at each stage of the analysis [
56].
H0: Respondents in the given management category have a statistically significantly common opinion on the classification of risks.
H1: Respondents in the given management category do not statistically significantly share the same opinion on the classification of risks.
The respondents who completely (100%) or statistically significantly (within the selected significance level α = 0.05) agree with the risk analysis are summarized in clusters (Z), which are shown in
Figure 4 and displayed in
Table 5.
The analysis shows that, in clusters Z2 and Z3, more than 70% of respondents are represented in the Quality Management position compared to the other clusters, which may indicate a similar view of risk analysis in the respective position (confirmation of hypothesis H0). At the same time, this indicates a different view of risk analysis compared to respondents in other positions. In cluster Z6, 50% of the respondents are in the position of General Management, which is the largest representation compared to the other clusters and could indicate a different view of risk analysis compared to respondents in other positions.
Respondents C13 (Quality Management), C8 (Quality Management), and C63 (Quality Management) represent a special case. Quality Managers C13 and C8 agreed 100% on the risk classification questions (6, 9, 12, 15, 18, 21, and 24) and were in statistically significant agreement with Quality Manager C63 on the risk classification. These quality managers tend to belong to group Z2, which is mainly composed of respondents in Quality Management positions (71%). This fact may again indicate a different view of respondents in the given position (Quality Management) compared to respondents in other positions.
H0.
Respondents in the given management category have a statistically significant common opinion on the choice of an appropriate risk management tool.
H1. Respondents in the given management category do not statistically significantly share the same opinion on the choice of an appropriate risk management tool.
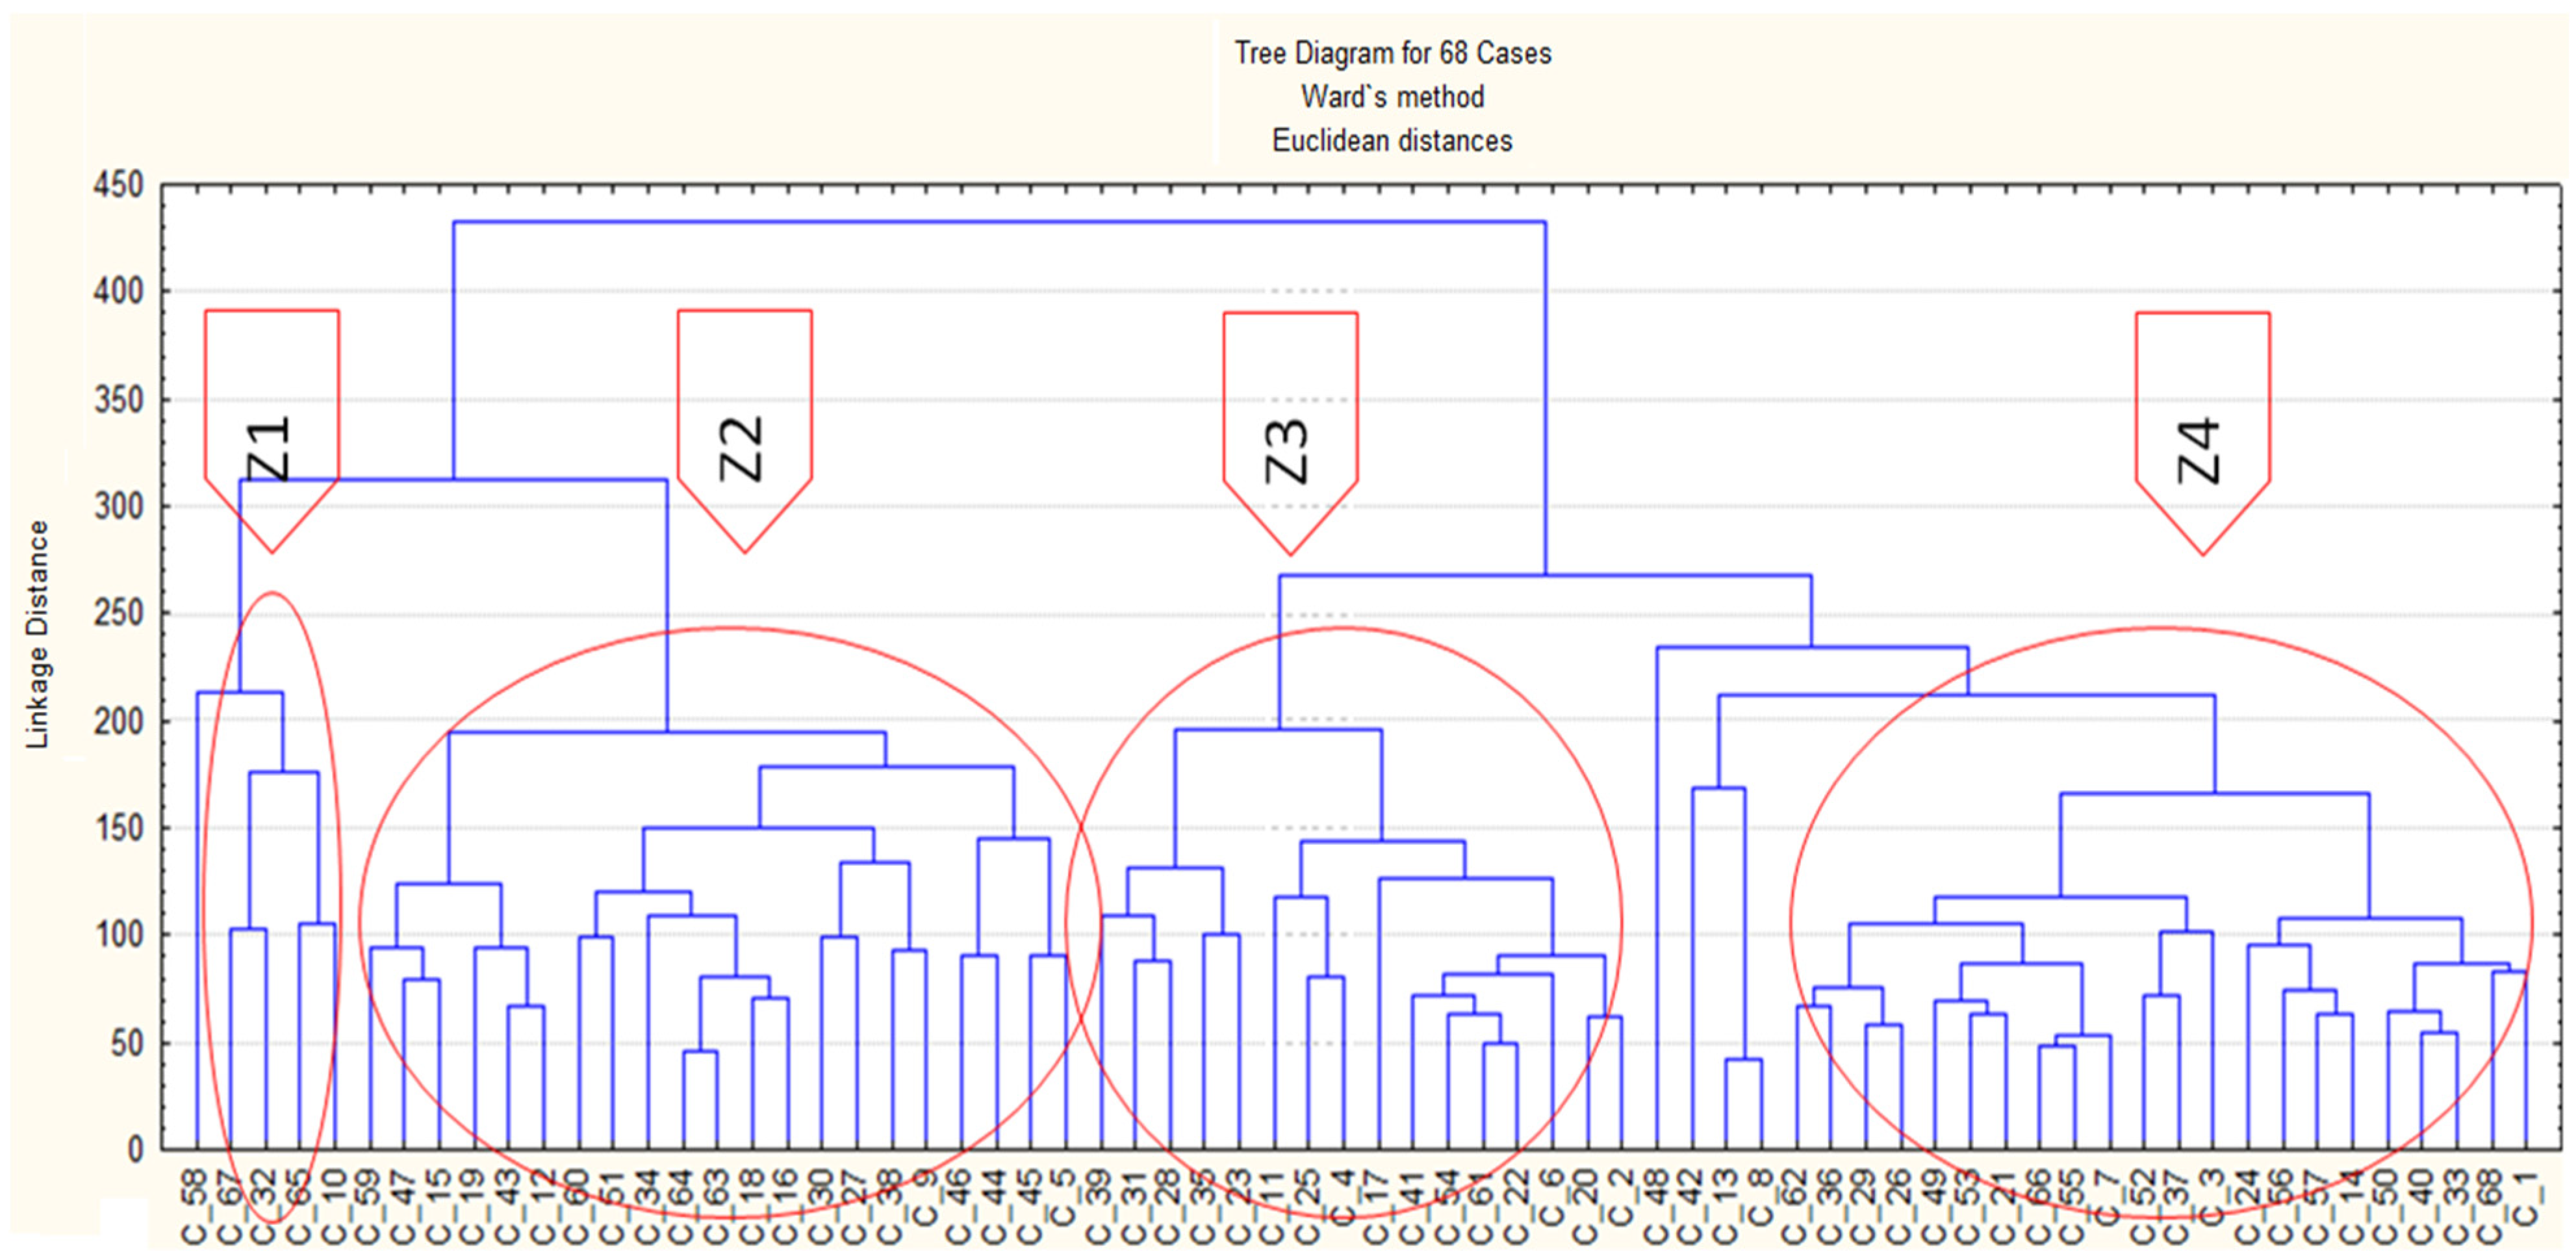
The respondents who completely (100%) or statistically significantly (within the selected significance level α = 0.05) agreed with the identification of a suitable tool for risk minimization are in the group clusters (Z), which are shown in
Figure 5 and displayed in
Table 6.
The analysis shows that, in clusters Z2 and Z4, more than 70% of the respondents are represented in the Quality Management position compared to the other clusters, which could indicate that the choice of an appropriate tool for risk minimization in a particular position is viewed in the same way (confirmation of hypothesis H0). At the same time, this suggests that the choice of an appropriate risk mitigation tool in a particular position is viewed differently than in the other positions. In cluster Z3, there are twice as many respondents in the General Management position than in the other clusters, indicating that respondents in other positions have a different view on the choice of an appropriate risk mitigation tool than respondents in other positions.
The cluster analysis confirmed the validity of the research hypothesis (H0) and confirmed the need for a cross-sectional approach to risk analysis to ensure that the views of the relevant groups of senior management are considered in the decisionmaking process.
Based on the results of the cluster analysis, it is necessary to form a cross-sectional team of experts who can select an appropriate tool that allows risks to be correctly assigned to each colored area on the temperature map (
Table 7).
2.5. Creation of a Dynamic Risk Management Model
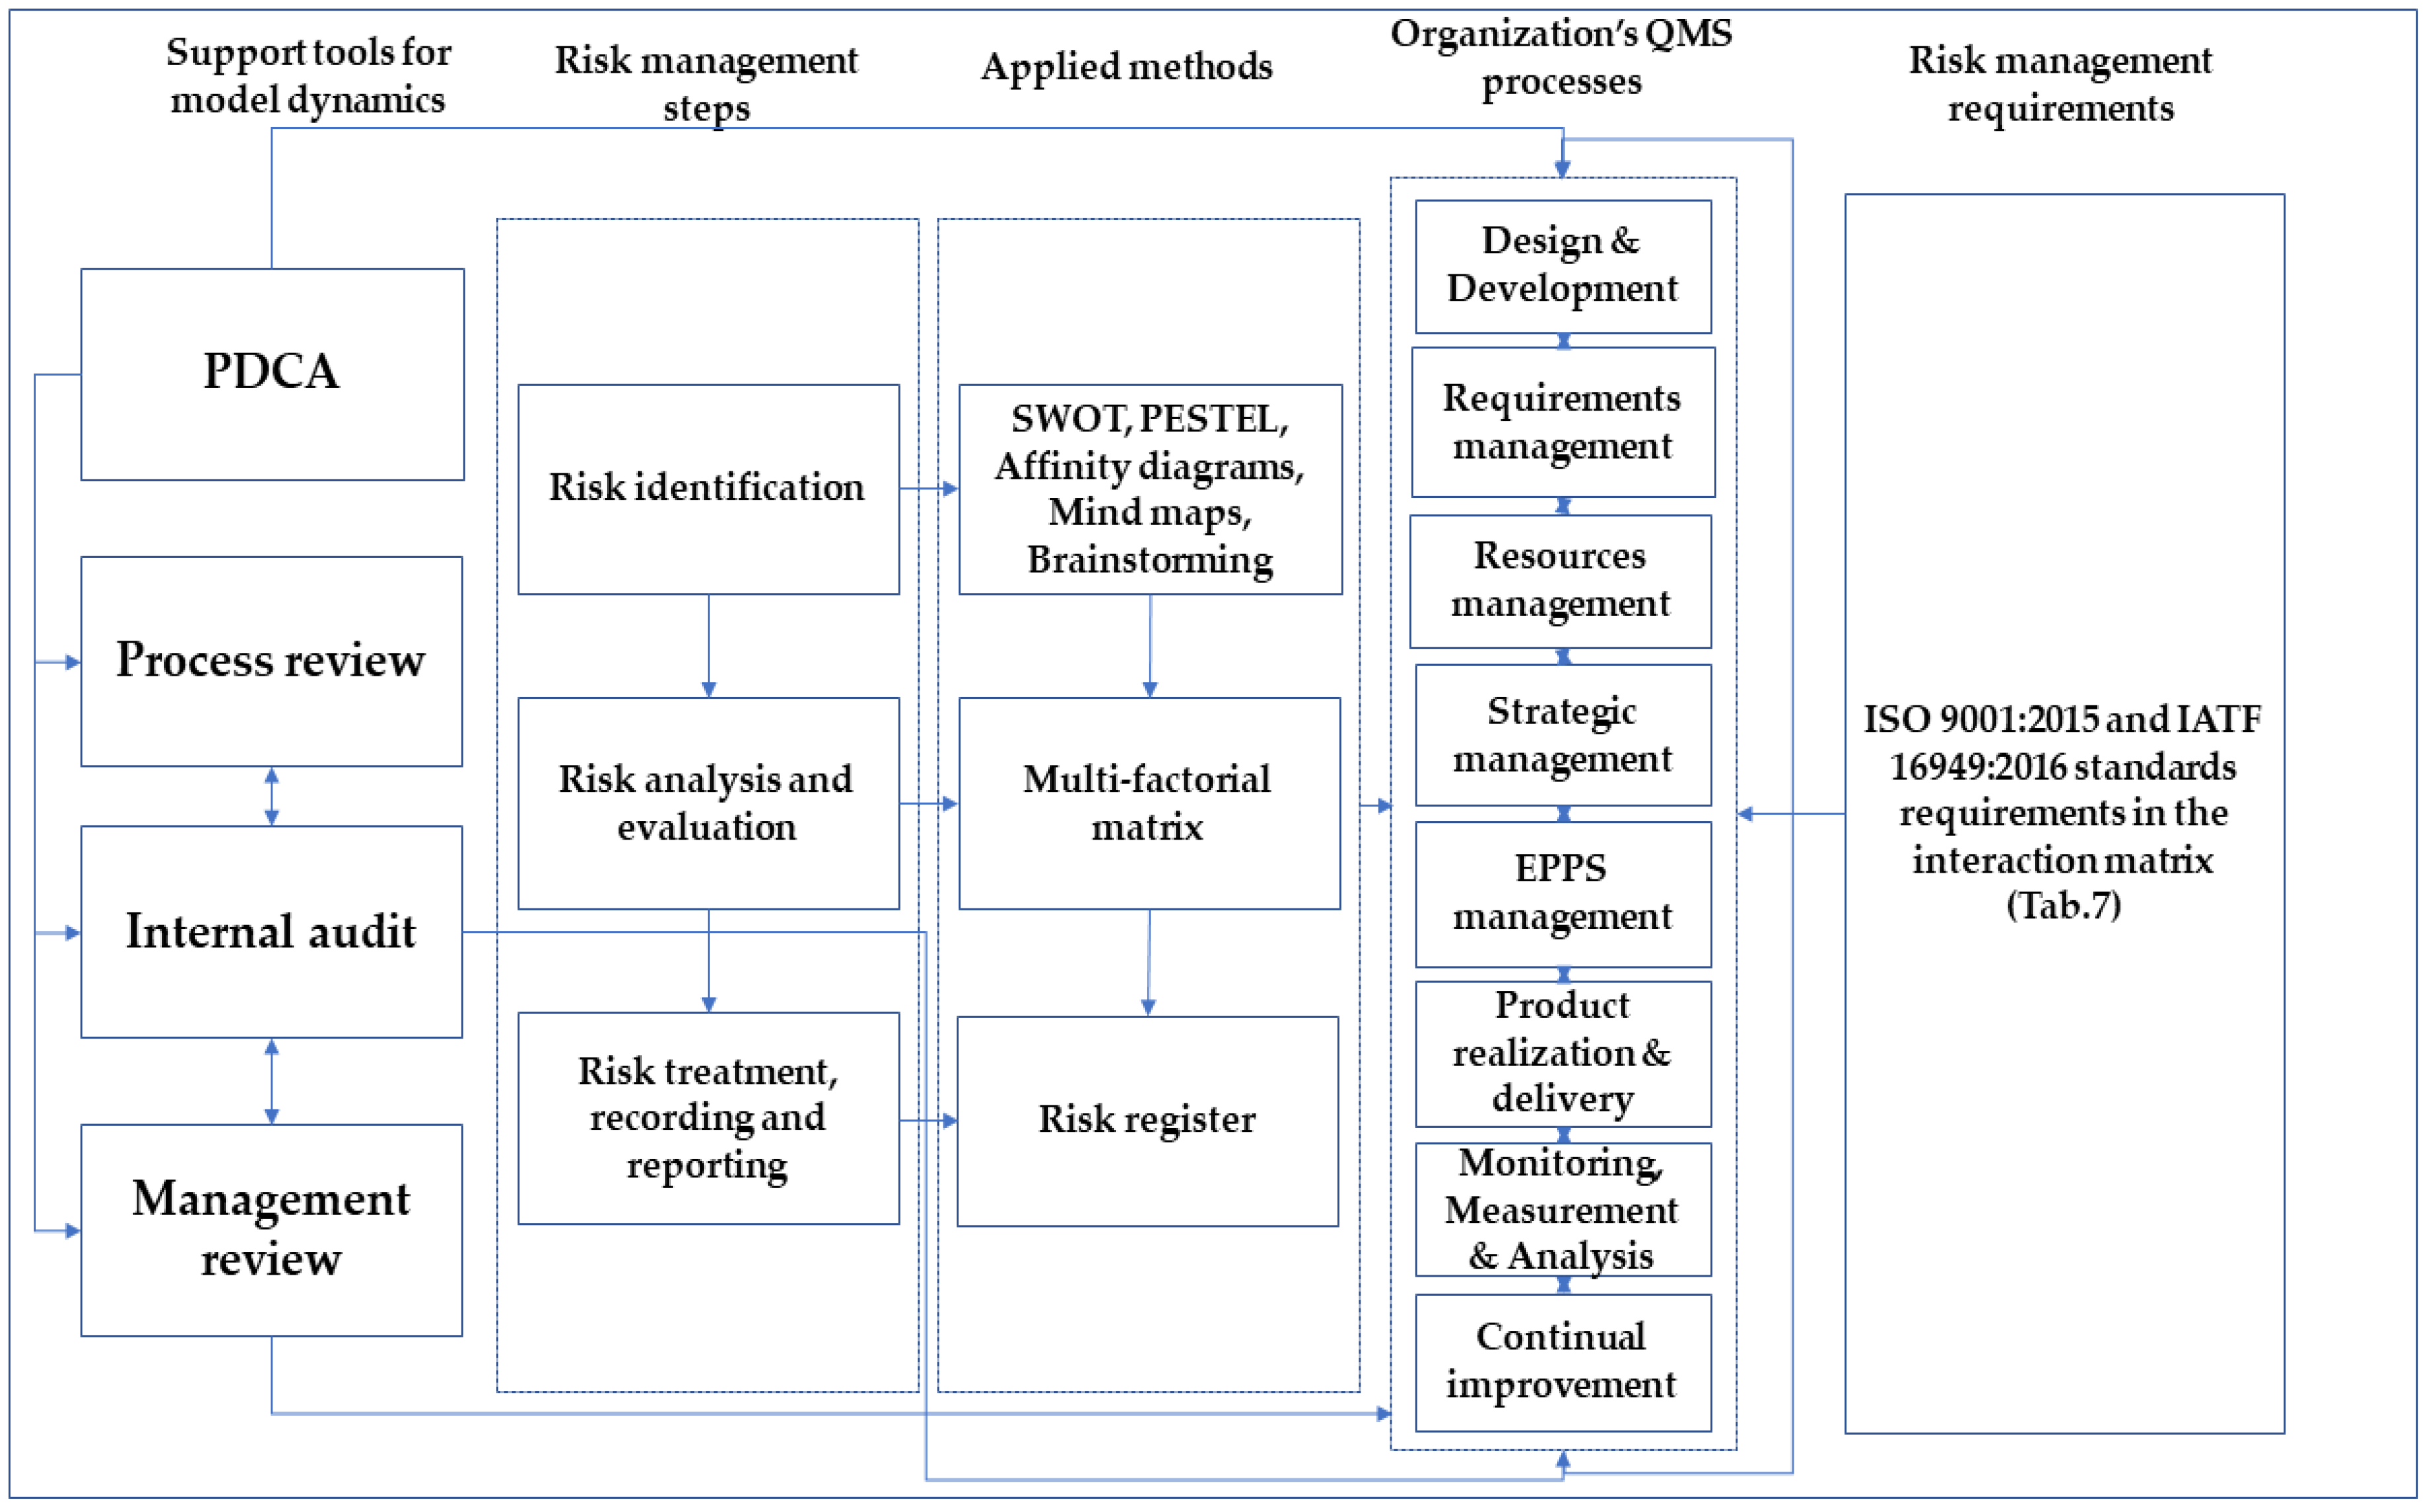
The creation of a dynamic model is based on the proposed concept of risk-based thinking using the basic structure of the requirements of the ISO 9001:2015 standard in the PDCA cycle, which allows organizations to achieve process and system management focused on risk-based thinking. The essential steps of risk management according to ISO 31000:2018 with specified tools form the introduction to managing the organization’s processes with a process approach, as well as the requirements of both standards for risk management. To support the dynamics of the created model, so that the process ensures the necessary updates and changes in relation to the changing business environment and the needs of the organization, we have proposed the appropriate tools.
Subsequently, we developed the mentioned concept in a more detailed represenation (
Figure 6). As a complement to the created model, we created the interaction matrix to show the necessary interactions between the risk management requirements of the ISO 9001 and IATF 16949 standards and the proposed processes of the organization (
Table 8), which visualizes the necessary links between the requirements and processes in detail.
3. Results
To meet the demands of the future, companies must evolve risk management from mere prevention and mitigation to dynamic strategic enablement and value creation. This requires clear objectives, such as focusing the efforts on the most significant risks, providing information on risk levels and risk appetite in a way that facilitates effective business decisions, and ensuring that the organization is prepared to manage risks and adverse events. For this reason, dynamic and integrated risk management, which includes the ability to identify risks, determine the risk appetite, and decide on actions in real time, is becoming increasingly important.
To ensure the dynamism of the proposed risk management model, we have proposed two existing QMS management processes (internal audit and management review) with enhanced attributes that support the dynamism of risk management, as well as a new process review tool. These three tools, management review, internal audit, and process review, should form a feedback loop between the strategic and operational management of the organization’s processes.
One of the fundamental characteristics of efficient and effective process management should be the regular review of processes and their interrelationships. The concept of reviewing QMS processes and linking the results of this process to the management review process appears to be an appropriate tool. As a more efficient way of carrying out this process, we have suggested that the process team should meet at least once every 4 months. All the processes listed in the process map are subject to review.
Quality audits are the most important diagnostic and feedback tool for top management. As a necessary step to support the dynamics of the model, we have proposed a framework for a holistic risk-based reasoning approach in a simplified audit cycle. This conveniently combines the overarching risk management requirements of IATF 16949:2016 at three levels: quality management system audit, production process audit, and product audit.
To support the dynamics of the model, we have proposed a matrix structure for the management review process. The individual inputs and outputs are discussed and recorded in management meetings at varying frequencies. The aim of this process is to assess the continuing suitability, adequacy, effectiveness, and alignment of the QMS with the strategic direction of the organization at the end of each review period (at least one per year). This ensures the higher added value of the analysis and evaluation for the top management. It provides more dynamism in the decisionmaking process and in the implementation of actions and is not just a formal record. As an effective tool for the proposed support techniques (process review and management review), we have used the risk register created, which combines the operational and strategic perspectives and brings together all the necessary information in one document.
3.1. Implementation and Evaluation of the Benefits of the Proposed Model
The proposed model was implemented on a sample of two selected manufacturing companies with the specified parameters (
Table 9).
For the introduction of the model, we developed a framework to ensure its effective implementation in both organizations. The implementation was carried out under the supervision of an external consultant with regular meetings on the progress of the implementation with the author of the model according to the successive steps listed below:
- 1.
interview with senior management;
- 2.
resource availability analysis;
- 3.
determination of responsibilities and method of motivation;
- 4.
analysis of the internal and external context;
- 5.
analysis and treatment of project risks;
- 6.
determining the time schedule, method of evaluation, communication, and escalation;
- 7.
training of workers;
- 8.
implementation of tasks and control of their fulfillment;
- 9.
internal audit of the quality management system + follow-up actions;
- 10.
management review + follow-up actions;
- 11.
model operation;
- 12.
model evaluation.
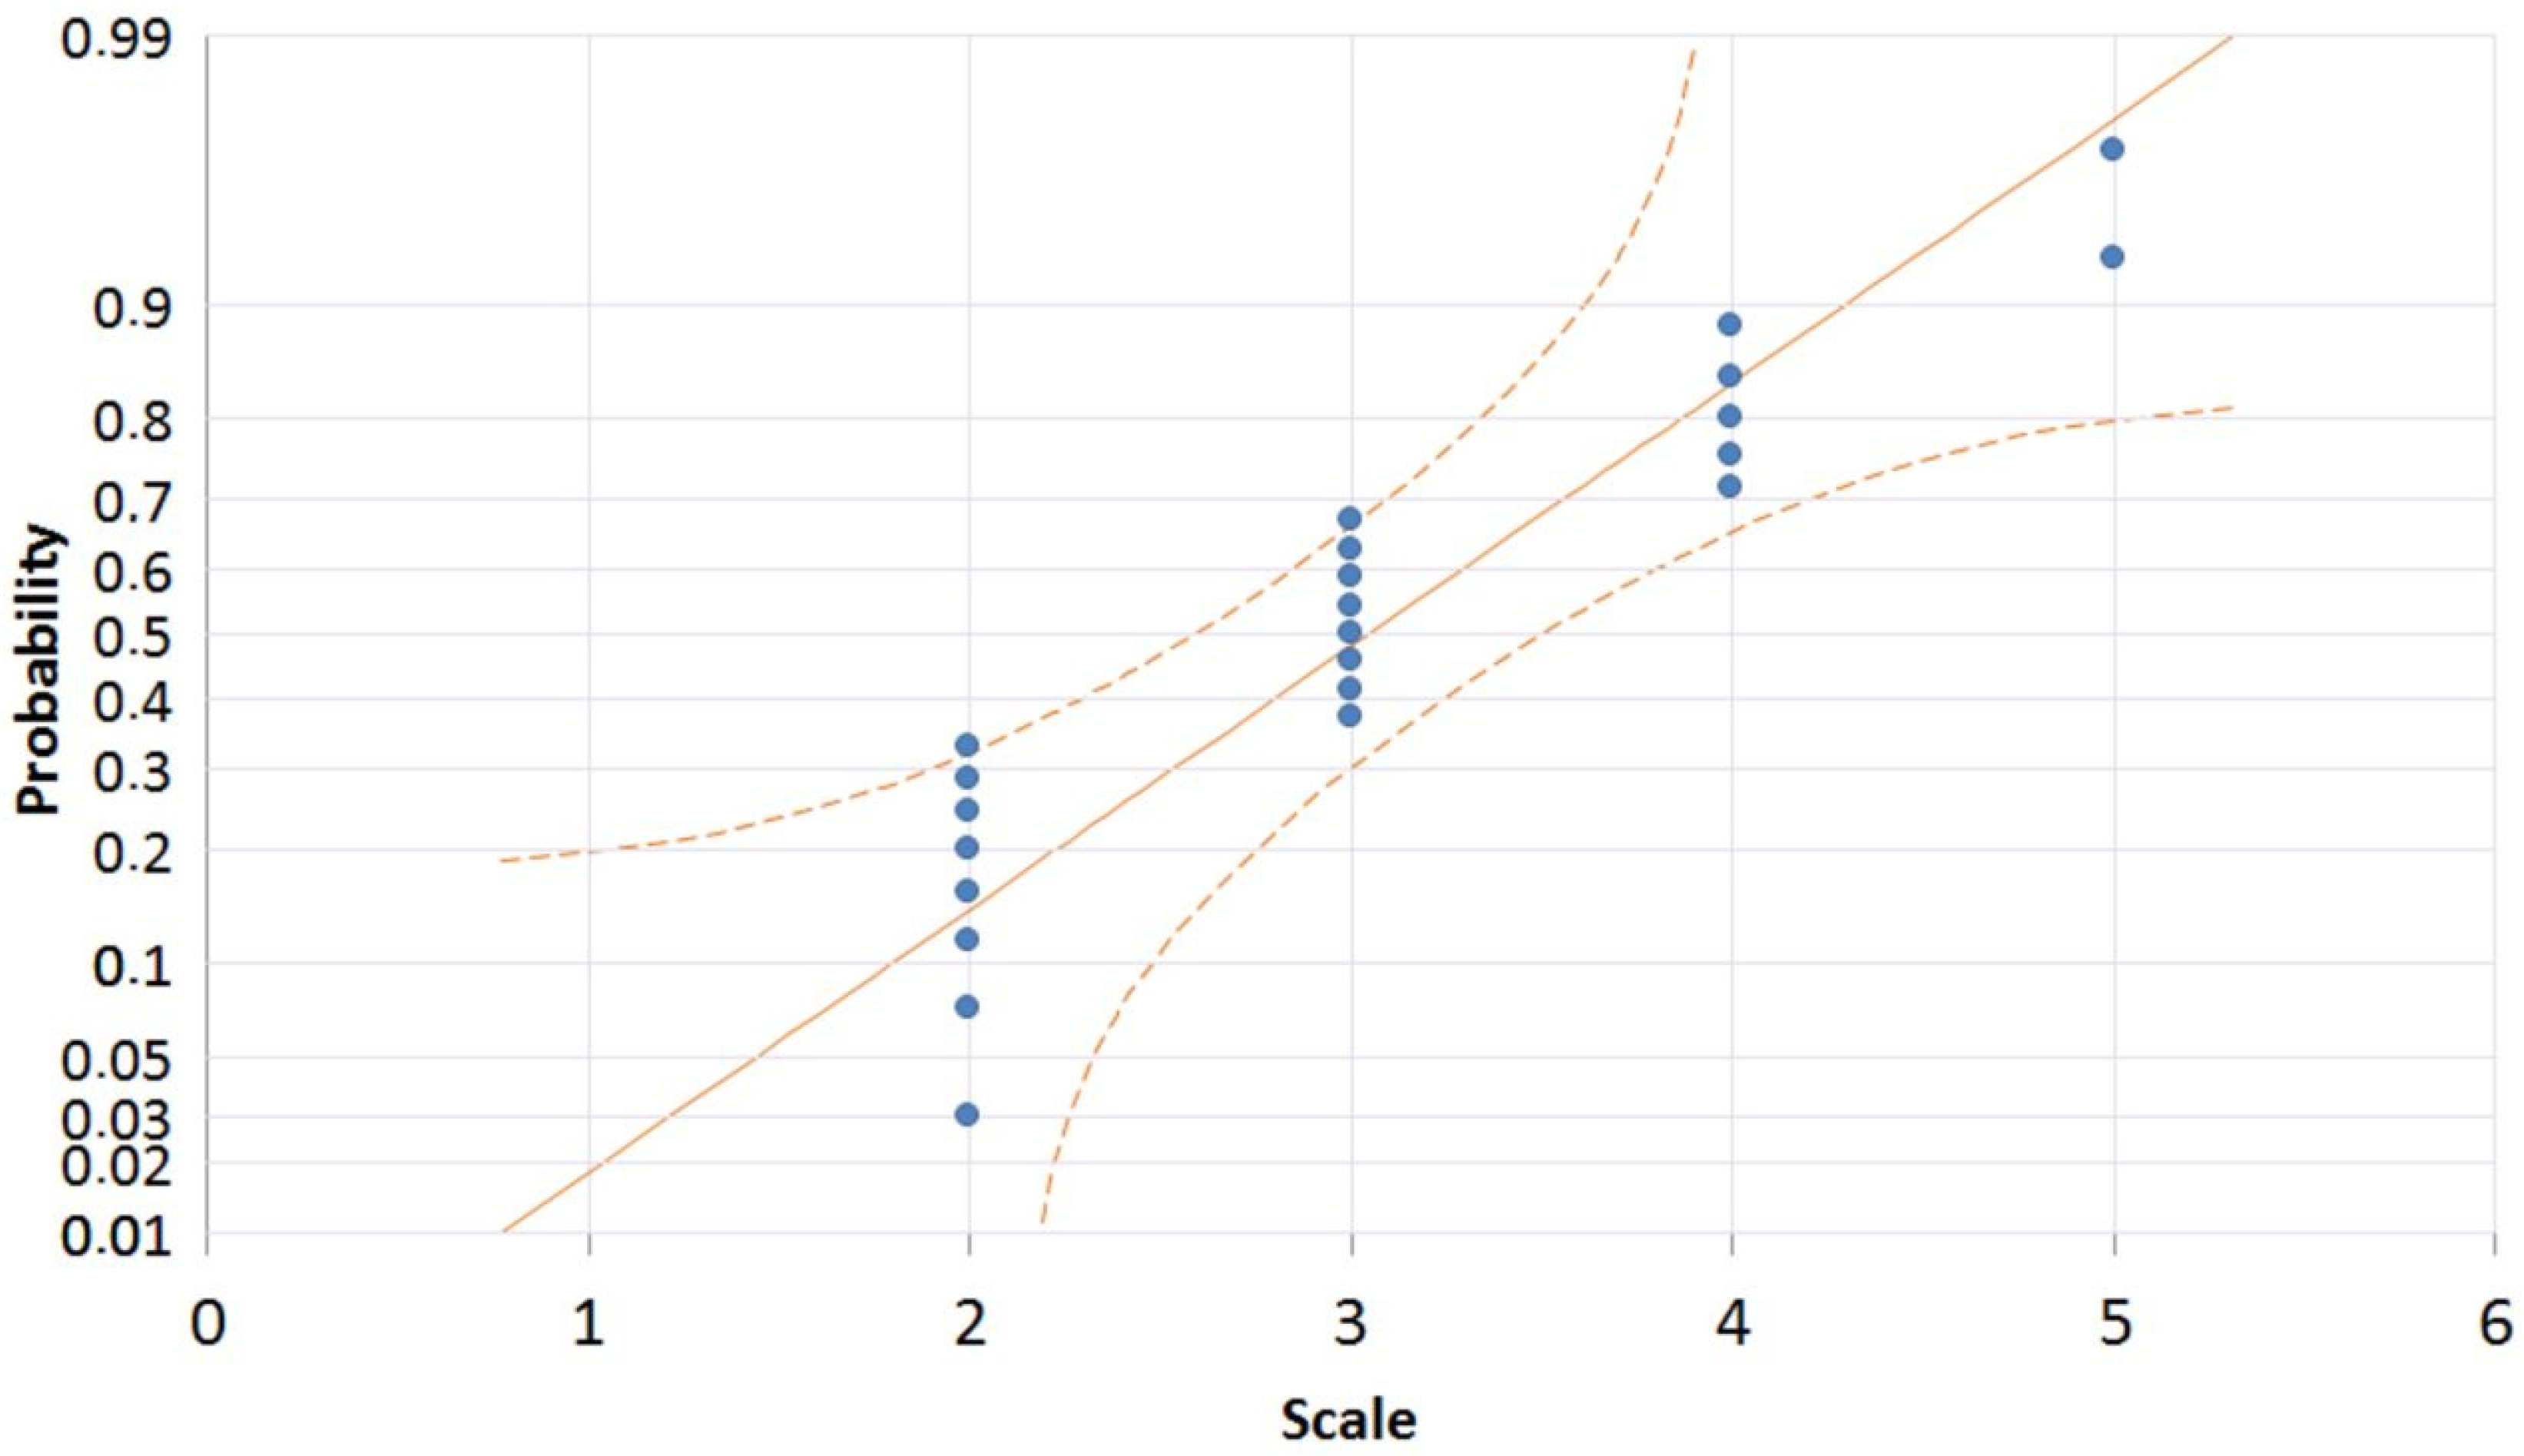
We evaluated the usefulness of the above questions with the following statistical tests using the Quantum XL software (v.5.29.1700). To assess the normality of the data (
Figure 7), we used the Anderson–Darling method.
If the p-value is less than the selected significance level α = 0.05, it means it is different than the normal distribution of values; that is, we reject the hypothesis H0.
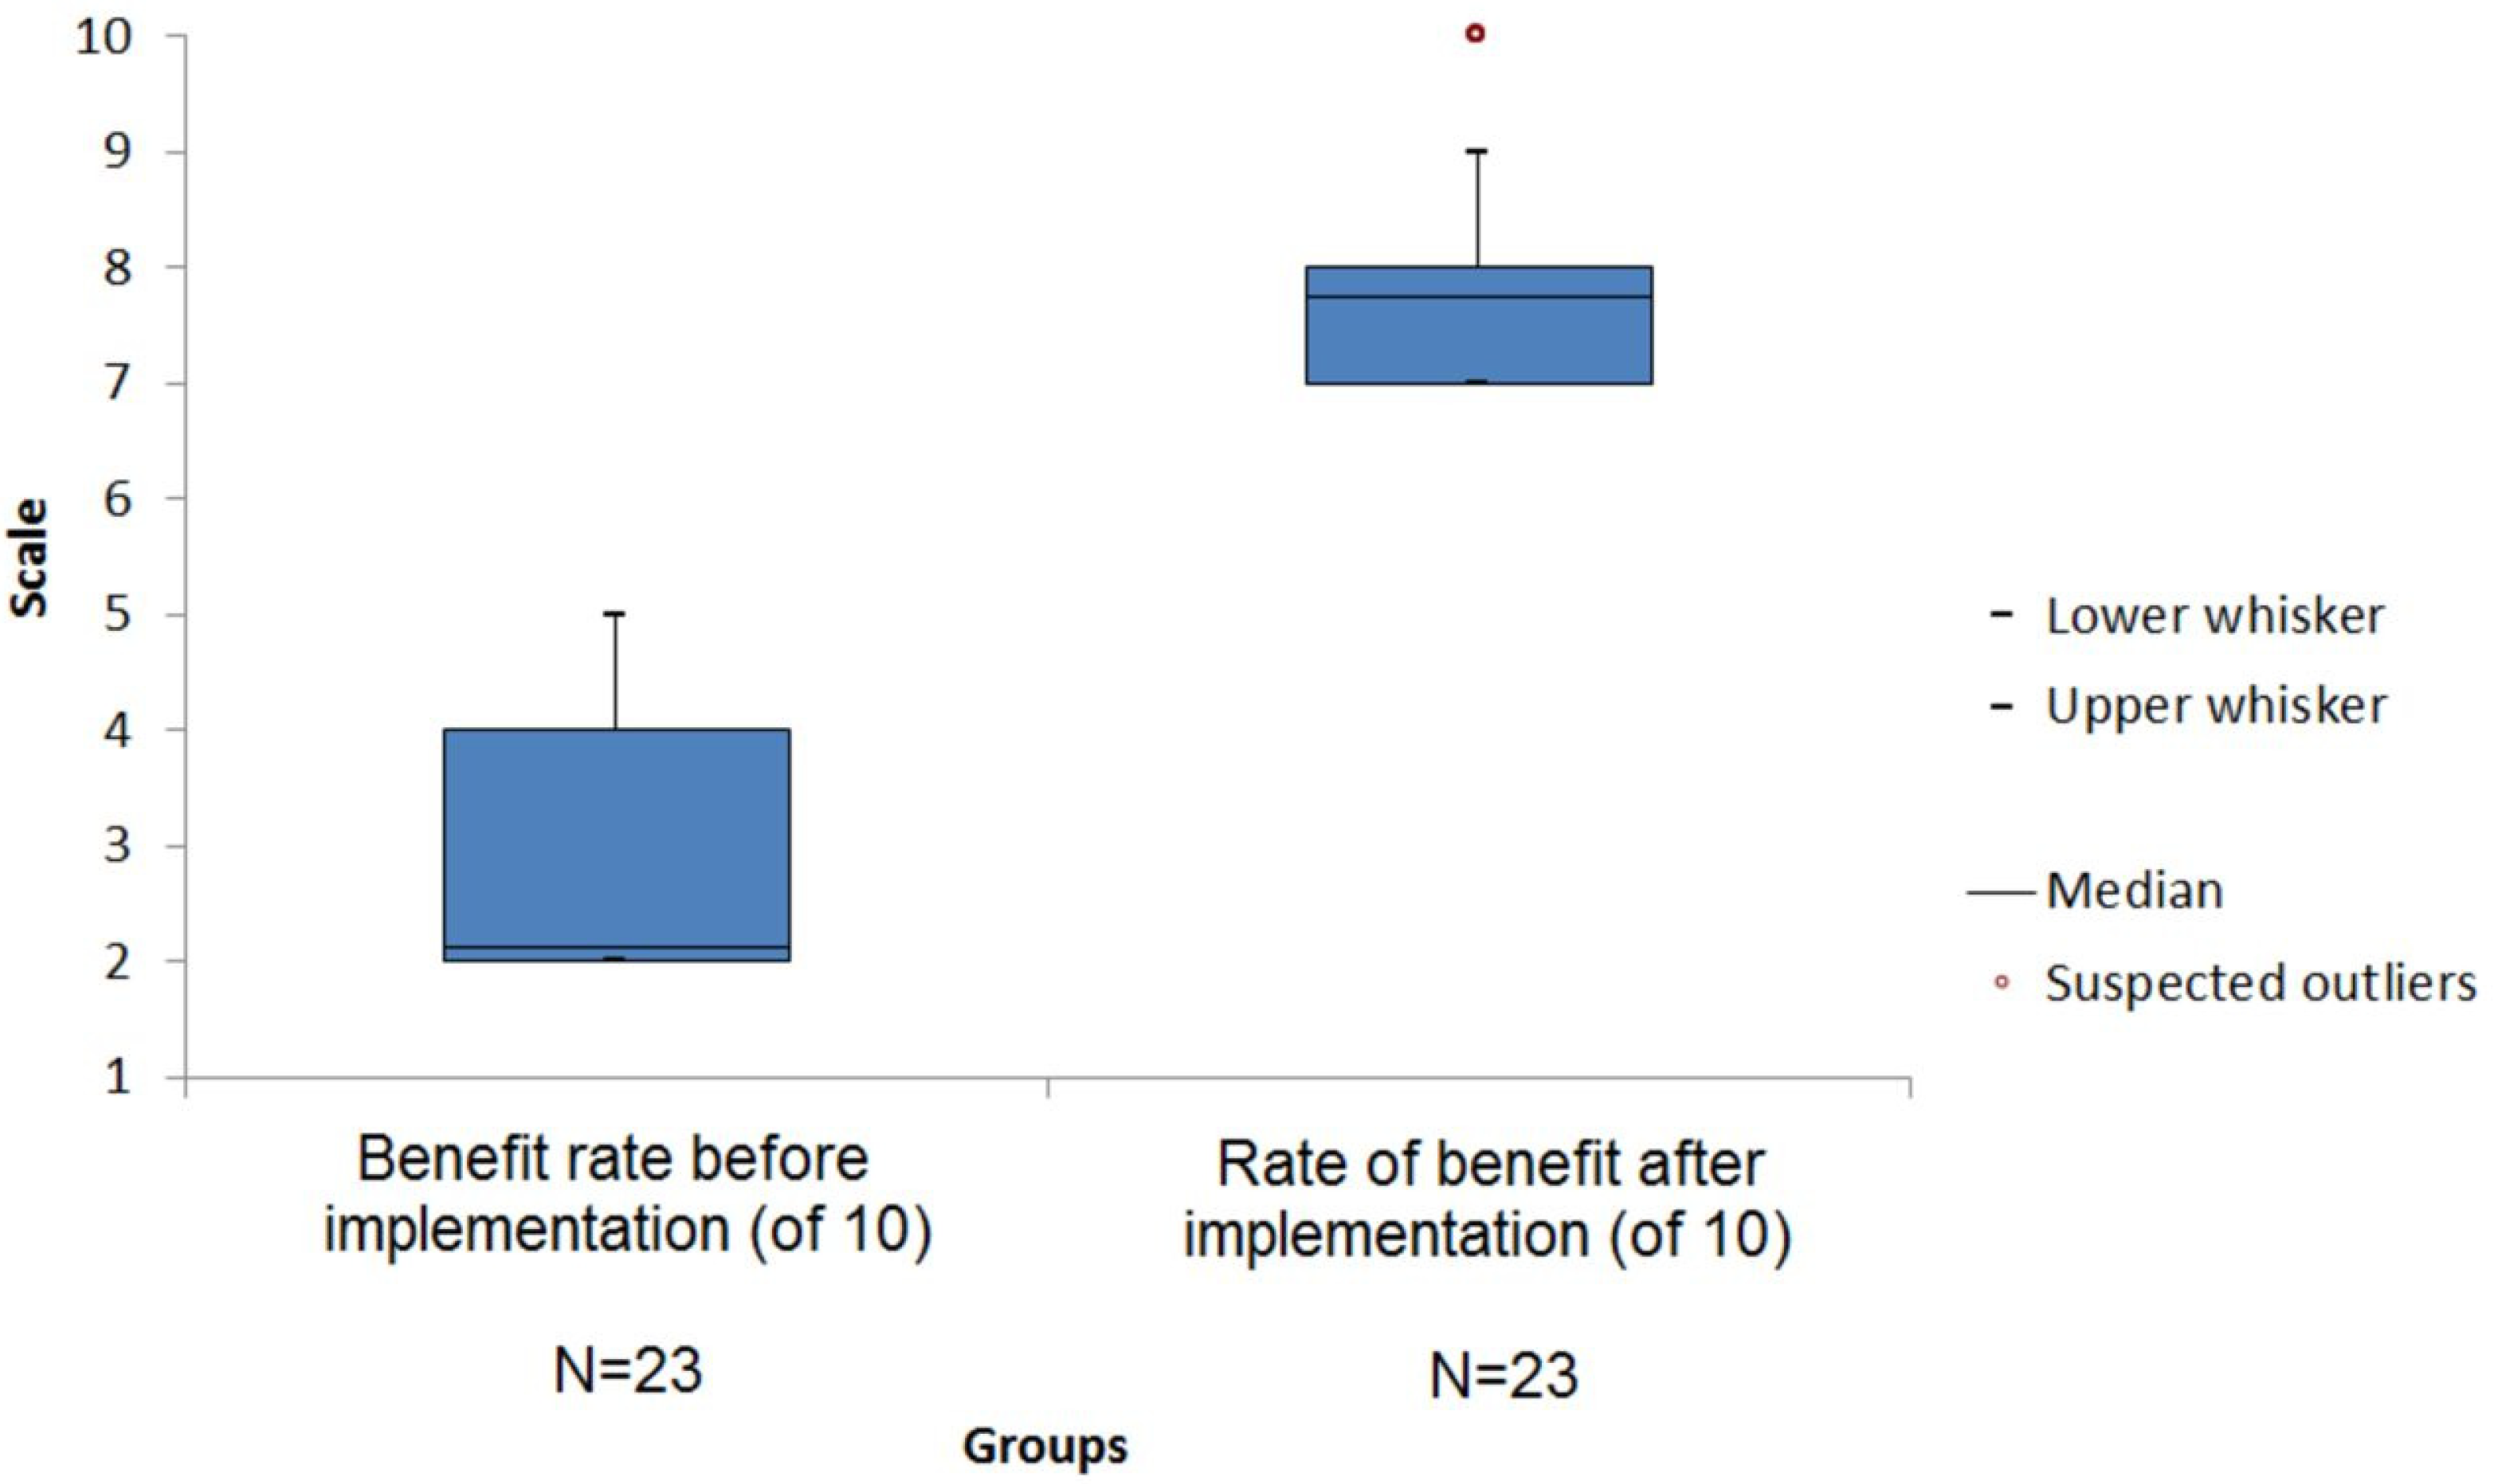
Testing the statistical significance of the benefits of the model was carried out using Dot plots (
Figure 8). To test the statistical significance of benefits before and after fitting the model, we used the non-parametric Moods median test (
Figure 9) (given the non-normal distribution of values).
Mood’s median test is a hypothesis test used to compare the medians of two or more samples like ANOVA but without the assumption of data normality. The null hypothesis is that the medians are equal. This is like one-way ANOVA but for medians instead of means [
56].
Tested hypothesis:
H0: μd = μ0
H1: μd ≠ μ0
where μd is the mean value of the differences and μ0 is the expected mean value of the differences.
Each question contains a number of values that have a non-normal distribution. A statistically significant difference between the results of the questionnaire before and after the implementation of the model was confirmed by the non-parametric median test (
Table 10).
The data analysis confirmed the statistically significant differences before and after the implementation of the model regarding all the assessed factors (overall benefits of the model, degree of model dynamics, and degree of model integration) and areas of impact on the strategy, financial performance, and reputation of the organization. Based on the above, it can be concluded that the dynamic risk management model created and implemented is, in the opinion of the respondents, meeting the objectives set and can be considered effective.
4. Discussion and Conclusions
The research was based on a literature review and confirmation that the concept of risk-based thinking is also applicable to the manufacturing organizations in the automotive industry. The research analyzed and conceptualized the steps of a structured approach to identifying, analyzing, and assessing risks using Brainstorming, PESTLE, SWOT, the multi-factor risk matrix, and risk register tools. The questionnaire survey conducted provided important information on the perceptions of risks and the tools used. The statistical analysis of the feedback confirmed the need for a cross-sectional approach to risk management and the correctness of the selection of risks evaluated within the strategic management process. The proposed dynamic risk management model takes into account management principles such as PDCA, a process approach, and the requirements of the quality management system standards according to ISO 9001:2015 and IATF16949:2016, respecting the basic steps of risk management according to ISO 31000. Three basic management tools have been designed to support this dynamic model: process control, internal audit, and management control, complemented by aspects that support the concept of risk thinking. The next step was to implement the framework of the proposed model in a selected sample of manufacturing organizations. The model was then applied to their quality management systems. Finally, the benefits of the implemented model were evaluated through a questionnaire survey among the top management representatives. The results confirmed the contribution of the model in both organizations regarding all the evaluated criteria.
Within the research objectives, the following aspects were achieved:
The available literature provides a wide range of dynamic risk management applications in various areas of activity, and the application of the risk management models in risk management systems is analyzed and evaluated in
Section 1.2. The use of these models is based exclusively on their application in organizations with implemented ISO 9001 requirements.
The output will be a multi-factor risk matrix applicable to the risk assessment process of the strategic management process and a centralized risk register serving as a source of risk information for the stakeholders, including the top management, and highlighting the particularly important risks.
The created conceptual model, together with the matrix of interactions of the risk management requirements of both quality management standards (ISO 9001:2015 and IATF 16949:2016) with the organization’s processes, including the tools to support its dynamics, were implemented in two production organizations with the aim of verifying the model’s benefits.
The proposed framework for the implementation of the dynamic model was used in the implementation of the model, and the perceptions of the benefits of its implementation were obtained through a questionnaire survey among the members of the top management of the organization and then statistically evaluated in
Section 3.1.
In terms of the research limitations, the current research does not address the use of risk management tools to manage opportunities (the positive impact of risks). For management needs, a modified multi-factor matrix can be used that takes the opportunities into account. However, a different methodology can be used for their analysis, evaluation, and resolution. Failure Modes and Effects Analysis (FMEA) risk analysis is not part of the investigation as IATF16949:2016-certified organizations must use it as a risk management tool for the manufacturing process and product. However, a prerequisite for the effective functioning of the proposed dynamic risk management model is the appropriate use of the FMEA tool.
The future research will focus on a more detailed statistical evaluation of the usefulness of the model in a larger number of organizations where this model will be implemented.
Author Contributions
Conceptualization, M.Š. and Š.M.; methodology, M.Š.; software, M.Š.; validation, Š.M. and P.B.; formal analysis, M.Š. and Š.M.; investigation, Š.M.; resources, M.Š.; data curation, Š.M.; writing—original draft preparation, P.B.; writing—review and editing, M.Š. and Š.M.; visualization, P.B.; supervision, Š.M.; project administration, P.B.; funding acquisition, M.Š. All authors have read and agreed to the published version of the manuscript.
Funding
This research received no external funding. This research has been supported by the grant of KEGA 026TUKE-4/2023 Development Knowledge Support in the field of the quality management system requirements implementation in Aviation, Space and Defense Industry.
Institutional Review Board Statement
Not applicable.
Informed Consent Statement
Not applicable.
Data Availability Statement
The original contributions presented in the study are included in the article.
Conflicts of Interest
The authors declare no conflicts of interest.
References
- Kapur, M.; Aora, P. Emerging Trends in Risk Management; KPMG: Amstelveen, The Netherlands, 2017; Available online: https://assets.kpmg/content/dam/kpmg/in/pdf/2017/03/Emerging-trends-in-risk-management.pdf (accessed on 3 January 2019).
- Jiao, J.; Wei, M.; Yuan, Y.; Zhao, T. Risk Quantification and Analysis of Coupled Factors Based on the DEMATEL Model and a Bayesian Network. Appl. Sci. 2019, 10, 317. [Google Scholar] [CrossRef]
- Dado, M.; Hnilica, R.; Kotus, M.; Kotek, L. Use of virtual reality in machinery safety education. In Proceedings of the 10th Annual International Conference of Education, Research and Innovation, Seville, Spain, 16–18 November 2017; pp. 2737–2740. [Google Scholar]
- ISO 31000; Risk Management—Guidelines. International Organization for Standardization ISO: Geneva, Switzerland, 2018.
- Majlingová, A.; Oravec, M.; Drábek, J. Teória Bezpečnostných Rizík, 1st ed.; Technická univerzita vo Zvolene: Zvolen, Slovakia, 2021; pp. 82–102. (In Slovak) [Google Scholar]
- STN EN ISO 9001; Quality Management Systems—Requirements. International Organization for Standardization ISO: Geneva, Switzerland, 2016.
- IATF 16949; Quality Management System Requirements for Automotive Production and Relevant Service Parts Organizations. International Organization for Standardization ISO: Geneva, Switzerland, 2016.
- Šolc, M.; Kliment, J. The process of identification security risks in the automotive industry, In Proceedings of the 16th International Multidisciplinary Scientific GeoConference SGEM2016, Albena, Bulgaria, 28 June 2016. [CrossRef]
- Walker, R. Winning with Risk Management; Financial Engineering and Risk Management; World Scientific: Hackensack, NJ, USA, 2013; ISBN 978-981-4383-88-2. [Google Scholar]
- Frosdick, S. The Techniques of Risk Analysis Are Insufficient in Themselves. Disaster Prev. Manag. Int. J. 1997, 6, 165–177. [Google Scholar] [CrossRef]
- Šotic, A.; Rajic, R. The Review of the Definition of Risk. Online J. Appl. Knowl. Manag. 2015, 3, 17–26. Available online: www.iiakm.org/ojakm/articles/2015/volume3_3/OJAKM_Volume3_3pp17-26.pdf (accessed on 10 April 2023). (In Slovak).
- Šimák, L. Manažment Rizík, 1st ed.; Žilinská Univerzita v Žiline: Žilina, Slovakia, 2006; pp. 50–96. Available online: http://fbiw.uniza.sk/kkm/old/publikacie/mn_rizik.pdf (accessed on 25 June 2019). (In Slovak)
- Tureková, I.; Tomková, V.; Bagalová, T. Work at Height in Safety Work Plan Management. Adv. Mater. Res. 2014, 919–921, 523–526. [Google Scholar] [CrossRef]
- Clarke, C.J.; Varma, S. Strategic Risk Management: The New Competitive Edge. Long Range Plan. 1999, 32, 414–424. [Google Scholar] [CrossRef]
- Kerimkhulle, S.; Dildebayeva, Z.; Tokhmetov, A.; Amirova, A.; Tussupov, J.; Makhazhanova, U.; Adalbek, A.; Taberkhan, R.; Zakirova, A.; Salykbayeva, A. Fuzzy Logic and Its Application in the Assessment of Information Security Risk of Industrial Internet of Things. Symmetry 2023, 15, 1958. [Google Scholar] [CrossRef]
- Šolc, M.; Blaško, P.; Girmanová, L.; Kliment, J. The Development Trend of the Occupational Health and Safety in the Context of ISO 45001:2018. Standards 2022, 2, 294–305. [Google Scholar] [CrossRef]
- Häntsch, M.; Huchzermeier, A. Identifying, Analyzing, and Assessing Risk in the Strategic Planning of a Production Network: The Practical View of a German Car Manufacturer. J. Manag. Control 2013, 24, 125–158. [Google Scholar] [CrossRef]
- Markulik, S.; Šolc, M.; Petrík, J.; Balážiková, M.; Blaško, P.; Kliment, J.; Bezák, M. Application of FTA Analysis for Calculation of the Probability of the Failure of the Pressure Leaching Process. Appl. Sci. 2021, 11, 6731. [Google Scholar] [CrossRef]
- DeFeo, J.A. (Ed.) Juran’s Quality Handbook: The Complete Guide to Performance Excellence, 7th ed.; McGraw-Hill Education: New York, NY, USA, 2017; ISBN 978-1-259-64361-3. [Google Scholar]
- Zhang, H.; Sun, Q. Risk Assessment of Shunting Derailment Based on Coupling. Symmetry 2019, 11, 1359. [Google Scholar] [CrossRef]
- Clemens, P.L.; Simmons, R.J. System Safety and Risk Management; National Institute for Occupational Safety and Health: Washington, DC, USA, 1998. Available online: https://www.cdc.gov/niosh/docs/96-37768/pdfs/96-37768.pdf (accessed on 17 April 2021).
- Ceryno, P.S.; Scavarda, F.L.; Klingebiel, K. Supply chain risk: Empirical research in the automotive industry. J. Risk Res. 2014, 18, 1145–1164. [Google Scholar] [CrossRef]
- Militaru, R.E.; Savii, G.G. Risk Management Risk Assessment Techniques applied in Automotive Industry. Qual. Access Success 2013, 14, 62–66. [Google Scholar]
- Wijnia, Y. Asset Risk Management: Issues in the Design and Use of the Risk Matrix. In Engineering Asset Management and Infrastructure Sustainability, Proceedings of the 5th World Congress on Engineering Asset Management (WCEAM 2010); Springer: London, UK, 2012; ISBN 978-0-85729-301-5. [Google Scholar]
- Nag, R.; Hambrick, D.C.; Chen, M.-J. What Is Strategic Management, Really? Inductive Derivation of a Consensus Definition of the Field. Strat. Manag. J. 2007, 28, 935–955. [Google Scholar] [CrossRef]
- Smejkal, V.; Rais, K. Řízení Rizik ve Firmách a Jiných Organizacích, 4th ed.; Grada: Praha, Czech Republic, 2013; ISBN 978-80-247-4644-9. (In Czech) [Google Scholar]
- Hill, C.W.L.; Jones, G.R. Strategic Management: An Integrated Approach, 10th ed.; South-Western, Cengage Learning: Mason, OH, USA, 2013; ISBN 978-1-111-82584-3. [Google Scholar]
- Aven, T. Risk Assessment and Risk Management: Review of Recent Advances on Their Foundation. Eur. J. Oper. Res. 2016, 253, 1–13. [Google Scholar] [CrossRef]
- Harrington, S.E.; Niehaus, G.R. Risk Management and Insurance. In The McGraw-Hill/Irwin Series in Finance, Insurance and Real Estate, 2nd ed.; McGraw-Hill: Boston, MA, USA, 2005; ISBN 978-0-07-233970-3. [Google Scholar]
- Croitoru, I. Operational risk management and monitoring. Intern. Audit. Risk Manag. 2014, 36, 21–31. Available online: https://econpapers.repec.org/article/athjournl/v_3a36_3ay_3a2014_3ai_3a1_3ap_3a21-31.htm (accessed on 19 May 2023).
- Zimmer, K.; Fröhling, M.; Breun, P.; Schultmann, F. Assessing social risks of global supply chains: A quantitative analytical approach and its application to supplier selection in the German automotive industry. J. Clean. Prod. 2017, 149, 96–109. [Google Scholar] [CrossRef]
- Petrović, D.V.; Tanasijević, M.; Stojadinović, S.; Ivaz, J.; Stojković, P. Fuzzy Model for Risk Assessment of Machinery Failures. Symmetry 2020, 12, 525. [Google Scholar] [CrossRef]
- Popa, M.D. Engineering Risk of Series Production in Automotive Industry. Manag. Syst. Prod. Eng. 2019, 27, 5–11. [Google Scholar] [CrossRef]
- Global ISO 31000 Survey. Available online: https://www.pdfdrive.com/global-iso-31000-survey-2011-iso-31000-survey-v27-e138632.html (accessed on 29 November 2022).
- Williams, C.A.; Smith, M.L.; Young, P.C.; Williams, C.A. Risk Management and Insurance, 7th ed.; McGraw-Hill: New York, NY, USA, 1995; ISBN 978-0-07-070584-5. [Google Scholar]
- Leitch, M. A New Approach to Management Control. Dynamic Management. 2002. Available online: https://web.archive.org/web/20061024064845/http://www.dynamicmanagement.me.uk/dynamic/dynamic%201_2.html (accessed on 3 December 2022).
- Macher, G.; Armengaud, E.; Brenner, E.; Kreiner, C. Threat and Risk Assessment Methodologies in the Automotive Domain. Procedia Comput. Sci. 2016, 83, 1288–1294. [Google Scholar] [CrossRef]
- Prakash, A.; Agarwal, A.; Kumar, A. Risk Assessment in Automobile Supply Chain. Mater. Today Proc. 2018, 5, 3571–3580. [Google Scholar] [CrossRef]
- Samani, M.A.; Ismail, N.; Leman, Z.; Zulkifli, N. Development of a Conceptual Model for Risk-Based Quality Management System. Total Qual. Manag. Bus. Excell. 2019, 30, 483–498. [Google Scholar] [CrossRef]
- Popova, L.; Yashina, M.; Babynina, L.; Ryzshakova, A.; Yefremova, N.; Andreev, A. The Quality Management Development Based on Risk-Based Thinking Approach According to ISO 9001. Qual. Manag. 2019, 20, 58–63. [Google Scholar]
- Khan, F.; Hashemi, S.J.; Paltrinieri, N.; Amyotte, P.; Cozzani, V.; Reniers, G. Dynamic Risk Management: A Contemporary Approach to Process Safety Management. Curr. Opin. Chem. Eng. 2016, 14, 9–17. [Google Scholar] [CrossRef]
- Mili, A.; Bassetto, S.; Siadat, A.; Tollenaere, M. Dynamic Risk Management Unveil Productivity Improvements. J. Loss Prev. Process Ind. 2009, 22, 25–34. [Google Scholar] [CrossRef]
- Panagopoulos, I.; Karanikas, N. Safety Management and the Concept of Dynamic Risk Management Dashboards. AUP Adv. 2018, 1, 58–74. [Google Scholar] [CrossRef]
- Willaert, J. FERMA 2016 Risk Management Benchmarking Survey, 8th ed.; Federation of European Risk Management Associations: Brussels, Belgium, 2016. [Google Scholar]
- Nordal, Y.A.B.; Nhh, M.-T.L. Risk management practices, decision making and corporate governance. In Proceedings of the International May Conference on Strategic Management—IMKSM2015, Bor, Serbia, 29–31 May 2015. [Google Scholar]
- CFO. Globálne Trendy v Riadení Podnikových Rizík. 2013. Available online: http://www.cfo.sk/articles/globalne-trendy-v-riadeni-podnikovych-rizik (accessed on 10 May 2023). (In Slovak).
- Zahradníčková, L.; Vacík, E. Scenarios as a Strong Support for Strategic Planning. Procedia Eng. 2014, 69, 665–669. [Google Scholar] [CrossRef]
- Ostrowska, M.; Mazur, S. Diversified Risk Management. Procedia Econ. Financ. 2015, 23, 615–621. [Google Scholar] [CrossRef]
- Kruliš, J. Jak Vítězit Nad Riziky: Aktivní Management Rizik–Nástroj Řízení Úspěšných Firem; Linde Praha: Praha, Czech Republic, 2011; pp. 520–568. (In Czech) [Google Scholar]
- Luburic, R.; Perovic, M.; Sekulovic, R. Quality management in terms of strengthening the “three lines of defence” in risk management—Process approach. Int. J. Qual. Res. 2015, 9, 243–250. [Google Scholar]
- Sütőová, A.; Šooš, Ľ.; Kóča, F. Learning Needs Determination for Industry 4.0 Maturity Development in Automotive Organisations in Slovakia. Qual. Innov. Prosper. 2020, 24, 122–139. [Google Scholar] [CrossRef]
- Christensen, E.H.; Coombes-Betz, K.M.; Stein, M.S. The Certified Quality Process Analyst Handbook, 1st ed.; ASQ Quality Press: Milwaukee, WI, USA, 2007; ISBN 978-0873897099. [Google Scholar]
- Halčinová, J. Využitie wardovej metódy zhlukovej analýzy v dotazníkovom prieskume. In Proceedings of the 14th International Scientific Conference: Trends and Innovative Approaches in Business Processes, Košice, Slovakia, 23–25 May 2011. (In Slovak). [Google Scholar]
- Petrík, J.; Blaško, P.; Domovcová, L.; Sedlák, R.; Guzanová, A.; Ťavodová, M.; Pribulová, A.; Futaš, P. Influence of Testers on the ISE Effect. Mater. Test. 2022, 64, 550–562. [Google Scholar] [CrossRef]
- Petrík, J.; Burdzová, Ľ.; Legemza, J.; Blaško, P. The Development of the Blast Furnace Metallurgy of the Iron in Slovakia. Acta Montan. Slovaca 2022, 635–650. [Google Scholar] [CrossRef]
- Halčinová, J.; Trebuňa, P. Grafická interpretácia zhlukovej analýzy a výber počtu významných zhlukov. In Proceedings of the 14th International Scientific Conference: Trends and Innovative Approaches in Business Processes, Košice, Slovakia, 23–25 May 2011. (In Slovak). [Google Scholar]
| Disclaimer/Publisher’s Note: The statements, opinions and data contained in all publications are solely those of the individual author(s) and contributor(s) and not of MDPI and/or the editor(s). MDPI and/or the editor(s) disclaim responsibility for any injury to people or property resulting from any ideas, methods, instructions or products referred to in the content. |
© 2024 by the authors. Licensee MDPI, Basel, Switzerland. This article is an open access article distributed under the terms and conditions of the Creative Commons Attribution (CC BY) license (https://creativecommons.org/licenses/by/4.0/).


