Article

Geomechanical Response Characteristics of Different Sedimentary Hydrodynamic Cycles—Exampled by Xujiahe Formation of Upper Triassic, Western Sichuan Basin

1
Institute of Sedimentary Geology, Chengdu University of Technology, Chengdu 610059, China
2
School of Resources and Geosciences, China University of Mining and Technology, Xuzhou 221018, China
3
College of Energy, Chengdu University of Technology, Chengdu 610059, China
4
State Key Laboratory of Oil and Gas Reservoir Geology and Exploitation, Chengdu University of Technology, Chengdu 610059, China
*
Authors to whom correspondence should be addressed.
Sustainability 2024, 16(10), 4304; https://doi.org/10.3390/su16104304
Submission received: 30 March 2024 / Revised: 8 May 2024 / Accepted: 14 May 2024 / Published: 20 May 2024
(This article belongs to the Special Issue Basin Tectonic Analysis and Geoenergy Exploration)

Abstract

:
This study delves into the geomechanical responses of different sedimentary hydrodynamic cycles in deep tight sandstone formations. Employing core observation and thin section analysis, we quantitatively identified and characterized bedding planes, sedimentary microfacies, and tectonic fractures. Then, the intricate relationships between various architectural interfaces and geomechanical parameters were elucidated. Subsequently, utilizing finite element numerical simulation software, in situ stress and fracture parameters were derived. By identifying a fracture facies zone correlated with the sedimentary hydrodynamic cycle and production data, our findings unveil several key insights: (1) Geomechanical parameters (Young’s modulus, Poisson’s ratio, brittleness index) exhibited noteworthy variations within the T3x2−5 sand group, indicative of weak elasticity and robust plasticity. (2) The effective distance, influenced by diverse reservoir architecture interfaces, displayed variability, with each transition between peak-valley-peak or valley-peak-valley pinpointed as a distinct sedimentary hydrodynamic cycle. (3) In environments characterized by strong sedimentary hydrodynamics (between two level 3 architecture interfaces), fractures with larger strike angles and lower dip angles were observed to be more prevalent. (4) Three significant fracture faces—level I, level II, and level III—were discerned within the study area. Notably, reservoirs associated with level III exhibited characteristics suggestive of medium porosity and permeability, indicative of a gas layer. By thoroughly understanding the geomechanical response characteristics of formations such as the Xujiahe Formation, it is possible to guide the exploration and development of energy resources such as oil and natural gas. This helps to improve the efficiency and safety of resource extraction, promoting the sustainable utilization of energy.

1. Introduction

Constrained by the continuous development of conventional reservoirs, there is an urgent imperative to explore new oil and gas territories to meet the escalating energy demand. Deep-ultra-deep tight sandstone has emerged as a focal point for oil and gas exploration globally [1,2,3,4]. The advancement of pivotal core technologies has played a pivotal role in propelling breakthroughs in deep and ultra-deep oil and gas exploration, furnishing substantial support for ensuring national energy security. Particularly, the extent of fracture development has been a significant determinant in governing stable and high yields in deep and ultra-deep tight sandstone reservoirs [5,6,7,8]. Hence, scrutinizing the characteristics and genetic mechanism of structural fractures bears great significance in enhancing drilling success rates and expanding exploration areas in deep-ultra-deep tight sandstone gas reservoirs [4,6,9,10,11,12,13]. The geological resources of tight sandstone gas in the Xujiahe Formation of the Sinopec exploration area in the Sichuan Basin are estimated to be 40,481.84 × 108 m3, with proved reserves of 2691.32 × 108 m3, resulting in a proved rate of 6.6%. This underscores the significant potential for exploration and development [14,15,16]. Bedding planes, which are mechanically weak surfaces formed during the sedimentary process, are widely prevalent in tight sandstone in major sedimentary basins, indicating variations in sedimentary hydrodynamic conditions [17,18,19,20]. The characteristics of bedding planes, hydrodynamic cycles, and geomechanics exert a significant influence on the enrichment of tight sandstone oil and gas and the efficient exploration of oil and gas resources [21,22].
Constrained by the presence of diverse bedding types and varied assemblage modes, the geomechanical characteristics of different sedimentary hydrodynamic conditions were significantly influenced by weak bedding planes [5,23,24]. Consequently, under the influence of a singular stress environment, shear fractures, tensile fractures, and tensile-shear fractures could be generated, resulting in a myriad of structural fracture combinations. Subsequently, the development and distribution characteristics of fractures exhibited highly intricate patterns [19,20,25]. The attributes of bedding surfaces, encompassing their composition, dip angle, and combination mode, can signify different sedimentary hydrodynamic conditions, consequently leading to diverse response characteristics (mechanical properties, in situ stress, and fractures) in geomechanics [26,27]. Consequently, the development characteristics of in situ stress and tectonic fractures were exceedingly intricate, especially concerning stress mechanisms, fracture types, geometry, formation and evolution, and distribution patterns [28,29,30]. Essentially, considering the sedimentary structural characteristics, four significant bedding planes were identified in deep tight sandstones, namely massive bedding, horizontal bedding, parallel bedding, and cross-bedding, respectively. Through discerning the discrepancies and alterations in mineral composition, structure, and color of the rock, these bedding planes could be distinguished. The diversity of bedding planes underscores the complexity of sedimentary hydrodynamic conditions, which result in varied distributions of tectonic fractures and stress characteristics [31,32,33,34,35]. To facilitate the analysis and prognosis of the development characteristics of in situ stress and fractures, a deeper comprehension of the geomechanical response characteristics of reservoir architecture interfaces and sedimentary hydrodynamic conditions is imperative. Such insights will offer guidance for the exploration and development of tight sandstone gas reservoirs.
In this study, we employed finite element numerical simulation to analyze the geomechanical response of deep tight sandstone to various sedimentary hydrodynamic cycles. Through core observation and microscopic thin section analysis, we quantified bedding planes, sedimentary microfacies, and tectonic fractures. Subsequently, we determined the rock’s mechanical properties and in situ stress parameters. Then, three distinct reservoir architecture interfaces (II, III, and IV) based on sedimentary hydrodynamics were identified. By integrating data from core samples, logging interpretation, and geochemical testing, we established correlations between these interfaces and geomechanical parameters. Using ANSYS 15.0 software, in situ stress and fracture parameters for a single well were derived, discerning fracture zones linked to sedimentary hydrodynamics and production data. The findings offer theoretical guidance and practical insights for the exploration and development of similar deep tight sandstone reservoirs worldwide.

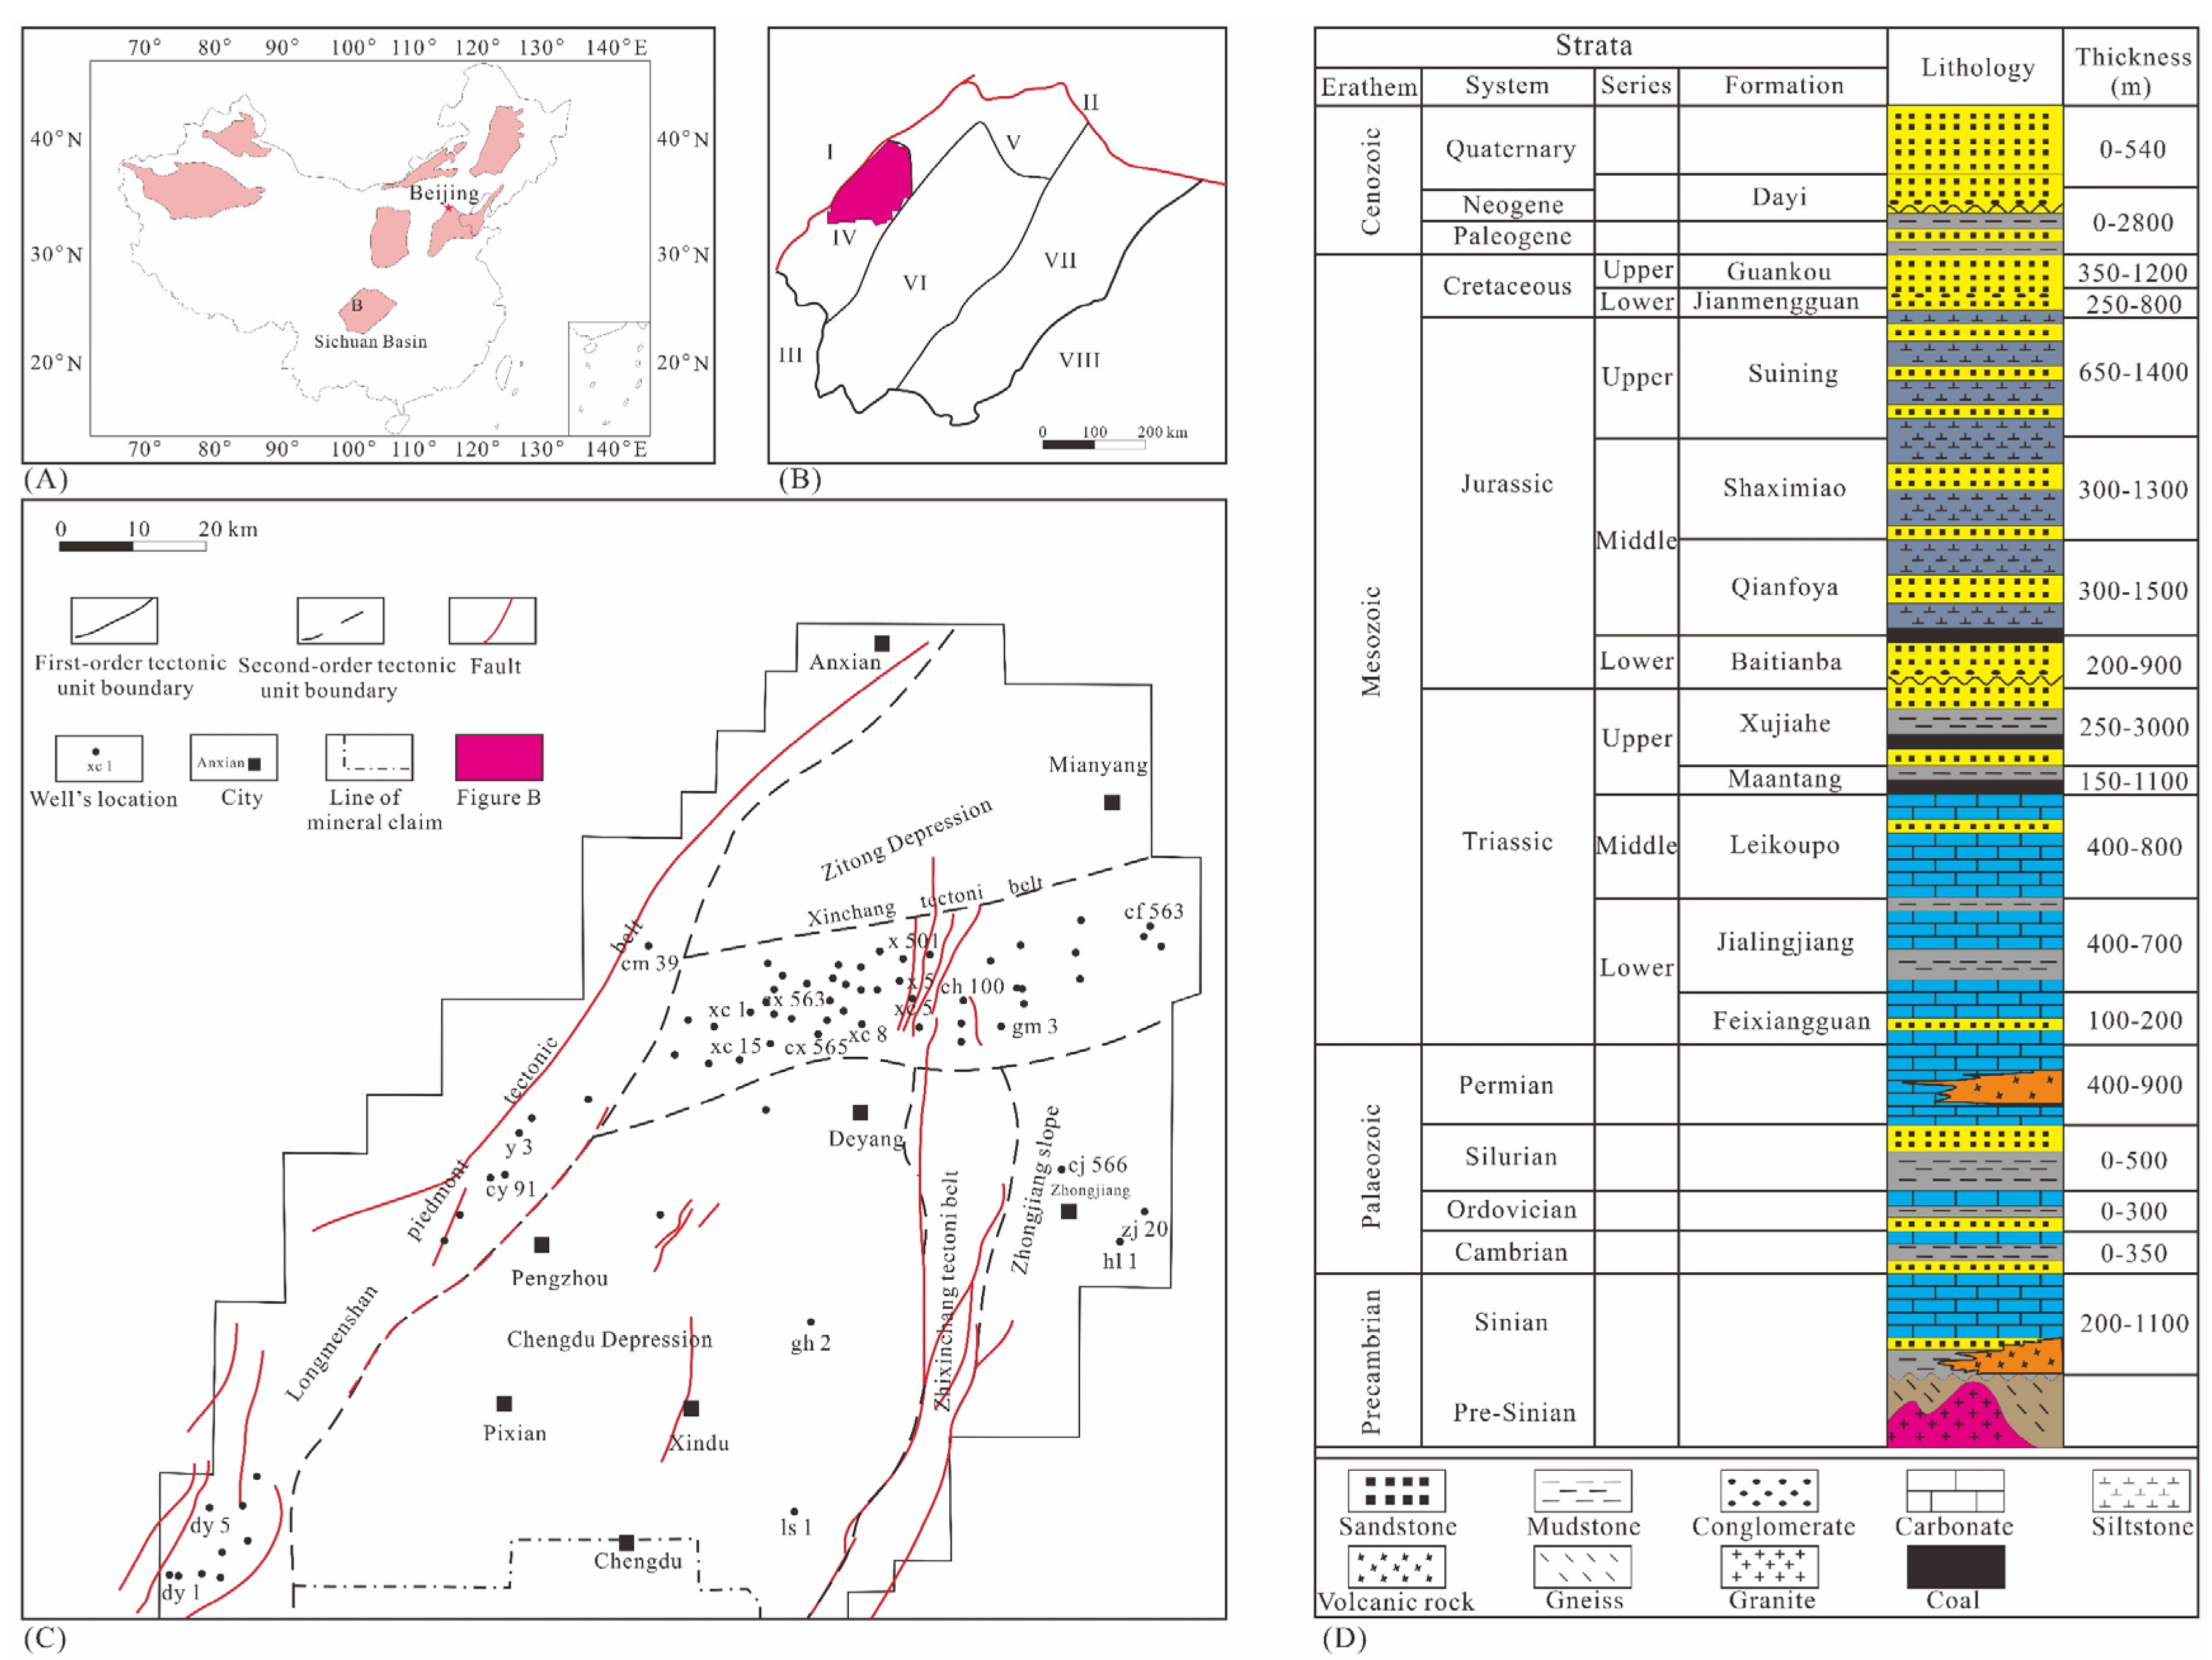
2. Geological Setting

Tectonically, the Sichuan Basin, situated in the western part of the Yangtze Block, is a large composite superimposed basin with both gas- and oil-bearing characteristics (Figure 1A) [16,36]. It is bounded by the Longmenshan thrust belt and Longquanshan uplift belt. Within the basin lies the Western Sichuan Depression in its western part (Figure 1B) [37,38]. This depression comprises six significant sub-tectonic units: three uplifts (Longmenshan piedmont tectonic belt, Xinchang tectonic belt, and Zhixinchang tectonic belt), two depressions (Chengdu depression and Zitong Depression), and one slope (Zhongjiang Slope) (Figure 1C). The Xinchang gas field is situated in the NEE-trending Xinchang tectonic belt, which lies in the middle part of the Western Sichuan Depression. This region has experienced multiple stages of tectonic movements since the Late Triassic (Figure 1C) [39]. The Sichuan Basin has witnessed three significant tectonic movements: the Indosinian, the Yanshanian, and the Himalayan orogeny [36]. Throughout the Proterozoic-Cenozoic period, the basin experienced the deposition of thick two-phase strata comprising marine and continental lithologies. During the Late Triassic, the Xujiahe Formation represented a transitional and early continental facies. The Western Sichuan Depression, situated in the subsidence and depositional center of the front depression zone of the Longmenshan foreland basin, received sediment from three main provenances: the Longmenshan mountains in the west, the central Sichuan paleo-uplift in the east, and the Micang-Daba mountain orogenic belt in the north. Consequently, these varied sedimentary sources led to the presence of multiple sedimentary hydrodynamic conditions and bedding planes within the region.
Vertically, the Xujiahe Formation can be delineated into five sections, with the Xu 2 section being the primary oil- and gas-bearing stratum [40]. During the early and middle stages of the second member of the Xujiahe Formation (T3x2 Formation), delta-lacustrine sedimentary systems prevailed, transitioning to a more prominent river channel in the later period. This led to the formation of extensive braided river delta deposits, contributing to the substantial thickness (560–660 m) of the second member (Figure 1D) [37]. The lithology predominantly comprises thick layers of fine-grained lithic sandstone in the middle and upper strata, with individual sand body layers averaging up to 70 m in thickness. The lower part mainly consists of interbedded sandstone and mudstone, occasionally featuring argillaceous bands and coal seams within the sand bodies. The T3x2 Formation exhibits tight physical properties, with porosity ranging from 2.5% to 4.5% and matrix permeability of less than 0.1 × 10⁻³ µm2. Some cores display locally higher porosity and permeability, reaching 9% and 0.2 × 10⁻³ µm2, respectively [41]. Influenced by multiple tectonic movements, fractures have developed within the T3x2 Formation sandstone, displaying various types and complexities in the in situ stress environment [38,42]. Fractures with lower angles tend to have higher linear density but smaller aperture, showing secondary calcite and quartz filling characteristics. Conversely, fractures with higher angles exhibit lower linear density but larger aperture, indicating partially filled or unfilled characteristics. Geomechanical parameters in different sedimentary conditions within the T3x2 Formation are intricate, particularly regarding the interplay among bedding planes, microfacies, rock mechanical properties, in situ stress, and fracture parameters, necessitating urgent investigation into the geomechanical response characteristics of various sedimentary hydrodynamic cycles within the formation in the western Sichuan Basin.

3. Methods and Techniques

3.1. Core Observation and Sampling

To accurately assess the developmental characteristics of sedimentary hydrodynamic conditions and tectonic fractures, core observation methods were utilized to analyze lithology, bedding planes, and fractures. Twelve representative wells were selected for core observation and sampling, providing over 500 m of cumulative core length. During this process, the location, thickness, and types of bedding planes, along with the developmental characteristics of tectonic fractures, were identified and documented through photography. To account for variations in sedimentary hydrodynamic conditions and geomechanical characteristics, including tectonic fractures and mechanical properties, over 30 specimens were meticulously sampled from the T3x2 Formation within the study area. These specimens underwent thin section and scanning electron microscope testing to characterize the microscopic sedimentary-structural bedding and fractures. The observed results from these analyses constitute crucial foundational data for reservoir architecture studies and analysis of geomechanical response characteristics.

3.2. Reservoir Architecture Division

In this manuscript, our aim was to quantitatively analyze sedimentary hydrodynamic conditions through reservoir architecture division. Following reservoir architecture theory principles [43,44,45,46,47] and incorporating cycle constraint and hierarchical anatomy concepts, we identified five significant reservoir architecture interfaces in the T3x2 Formation within our study area, labeled as level 0 to level 4 architecture interfaces. For instance, the laminar interface was classified as level 0, while the hierarchical interface corresponded to level 1. Additionally, we categorized the interface of a hierarchy group as level 2, identifiable through core observation. Moreover, the interlayer and accretive body interfaces within channel sand bodies were identified as level 3, and the interface of a single sand body and interbank interface between channel cores as level 4. Notably, these interfaces are closely linked to sedimentary hydrodynamic conditions. The reservoir architecture in 10 representative wells was examined, focusing on quantifying three significant architecture interfaces (level 2, 3, and 4). By combining this analysis with logging interpretation, we identified sedimentary facies and architecture interfaces in these typical wells. We summarized the developmental characteristics of different hierarchy groups (level 2 architecture interfaces) across various wells and conducted an analysis of diverse sedimentary hydrodynamic conditions, leading to the determination of corresponding sedimentary hydrodynamic cycles. These findings can effectively guide the study of geomechanical response characteristics.

3.3. Quantitative Calculation of Geomechanical Parameters

Well logging data and stress calculation models are widely recognized as rapid and effective methods for obtaining in situ stress and rock mechanical properties, with accuracy levels surpassing 90%. In this study, we selected six representative wells to acquire geomechanical parameters. Initially, using shear-wave and portrait-wave data, we determined the rock’s Young’s modulus and Poisson’s ratio (Equations (1) and (2)). Subsequently, an optimized computational model (Equations (3)–(5)) was employed to calculate in situ stress for each well. Equation (3) was used to compute the horizontal maximum principal stress, considering Poisson’s ratio and rock pore pressure, while Equation (4) determined the horizontal minimum principal stress. Additionally, Equation (5), along with the rock’s density and depth, facilitated the calculation of vertical principal stress. The rock’s brittleness index was derived using Equation (6), which incorporated Young’s modulus and Poisson’s ratio. As a result, we obtained distribution characteristics of rock mechanical parameters, in situ stress, and brittleness index. Furthermore, various geomechanical characteristics across different lithologies and sedimentary structures were computed. These calculated results provide reliable mechanical parameters and in situ stress magnitudes for finite element numerical simulations, enabling quantitative characterization of fracture parameters. They serve as valuable guidelines for researching geomechanical response characteristics across diverse sedimentary hydrodynamic cycles.
E = ρ 3 Δ t s 2 4 Δ t p 2 Δ t s 2 Δ t s 2 Δ t p 2
μ = 0.5 Δ t s 2 Δ t p 2 Δ t s 2 Δ t p 2
where E shows the rock’s Young’s modulus, MPa; μ is the rock’s Poisson’s ratio, dimensionless; ρ refers to the rock’s density, kg/m3; Δ t s and Δ t p indicate the time differences of shear wave and portrait wave, respectively, μs/ft.
S H = 1 2 ξ 2 E 1 μ + 2 μ 1 μ S V α P P + ξ 2 E 1 + μ + α P P
S h = 1 2 ξ 1 E 1 μ + 2 μ 1 μ S V α P P + ξ 1 E 1 + μ + α P P
S V = 0 H ρ h g d h
where SH, Sh, and SV show the horizontal maximum, horizontal minimum, and vertical principal stress, respectively, MPa; ξ1 and ξ2 refer to the horizontal tectonic stress coefficient, dimensionless; α shows the Boit coefficient, dimensionless; E refers to the rock’s Young’s modulus, MPa; μ is the rock’s Poisson’s ratio, dimensionless; PP shows the pore pressure, MPa; H is the depth, m; ρ(h) refers to the density of the overlying strata (a function related to the depth h), g/cm3; g is the gravitational acceleration, m/s2. During model calculation, the horizontal tectonic stress coefficient and the Boit coefficient were obtained by the correction and reverse calculation with the measured results of in situ stress.
B I = E E m i n E m a x E m i n μ m a x μ μ m a x μ m i n 2
where BI is the rock’s brittleness index, dimensionless; E shows the rock’s Young’s modulus, MPa; μ is the rock’s Poisson’s ratio, dimensionless; Emax and Emin refer to the maximum and minimum value of Young’s modulus, respectively, MPa; μmax and μmin refer to the maximum and minimum value of Poisson’s ratio, respectively, dimensionless.

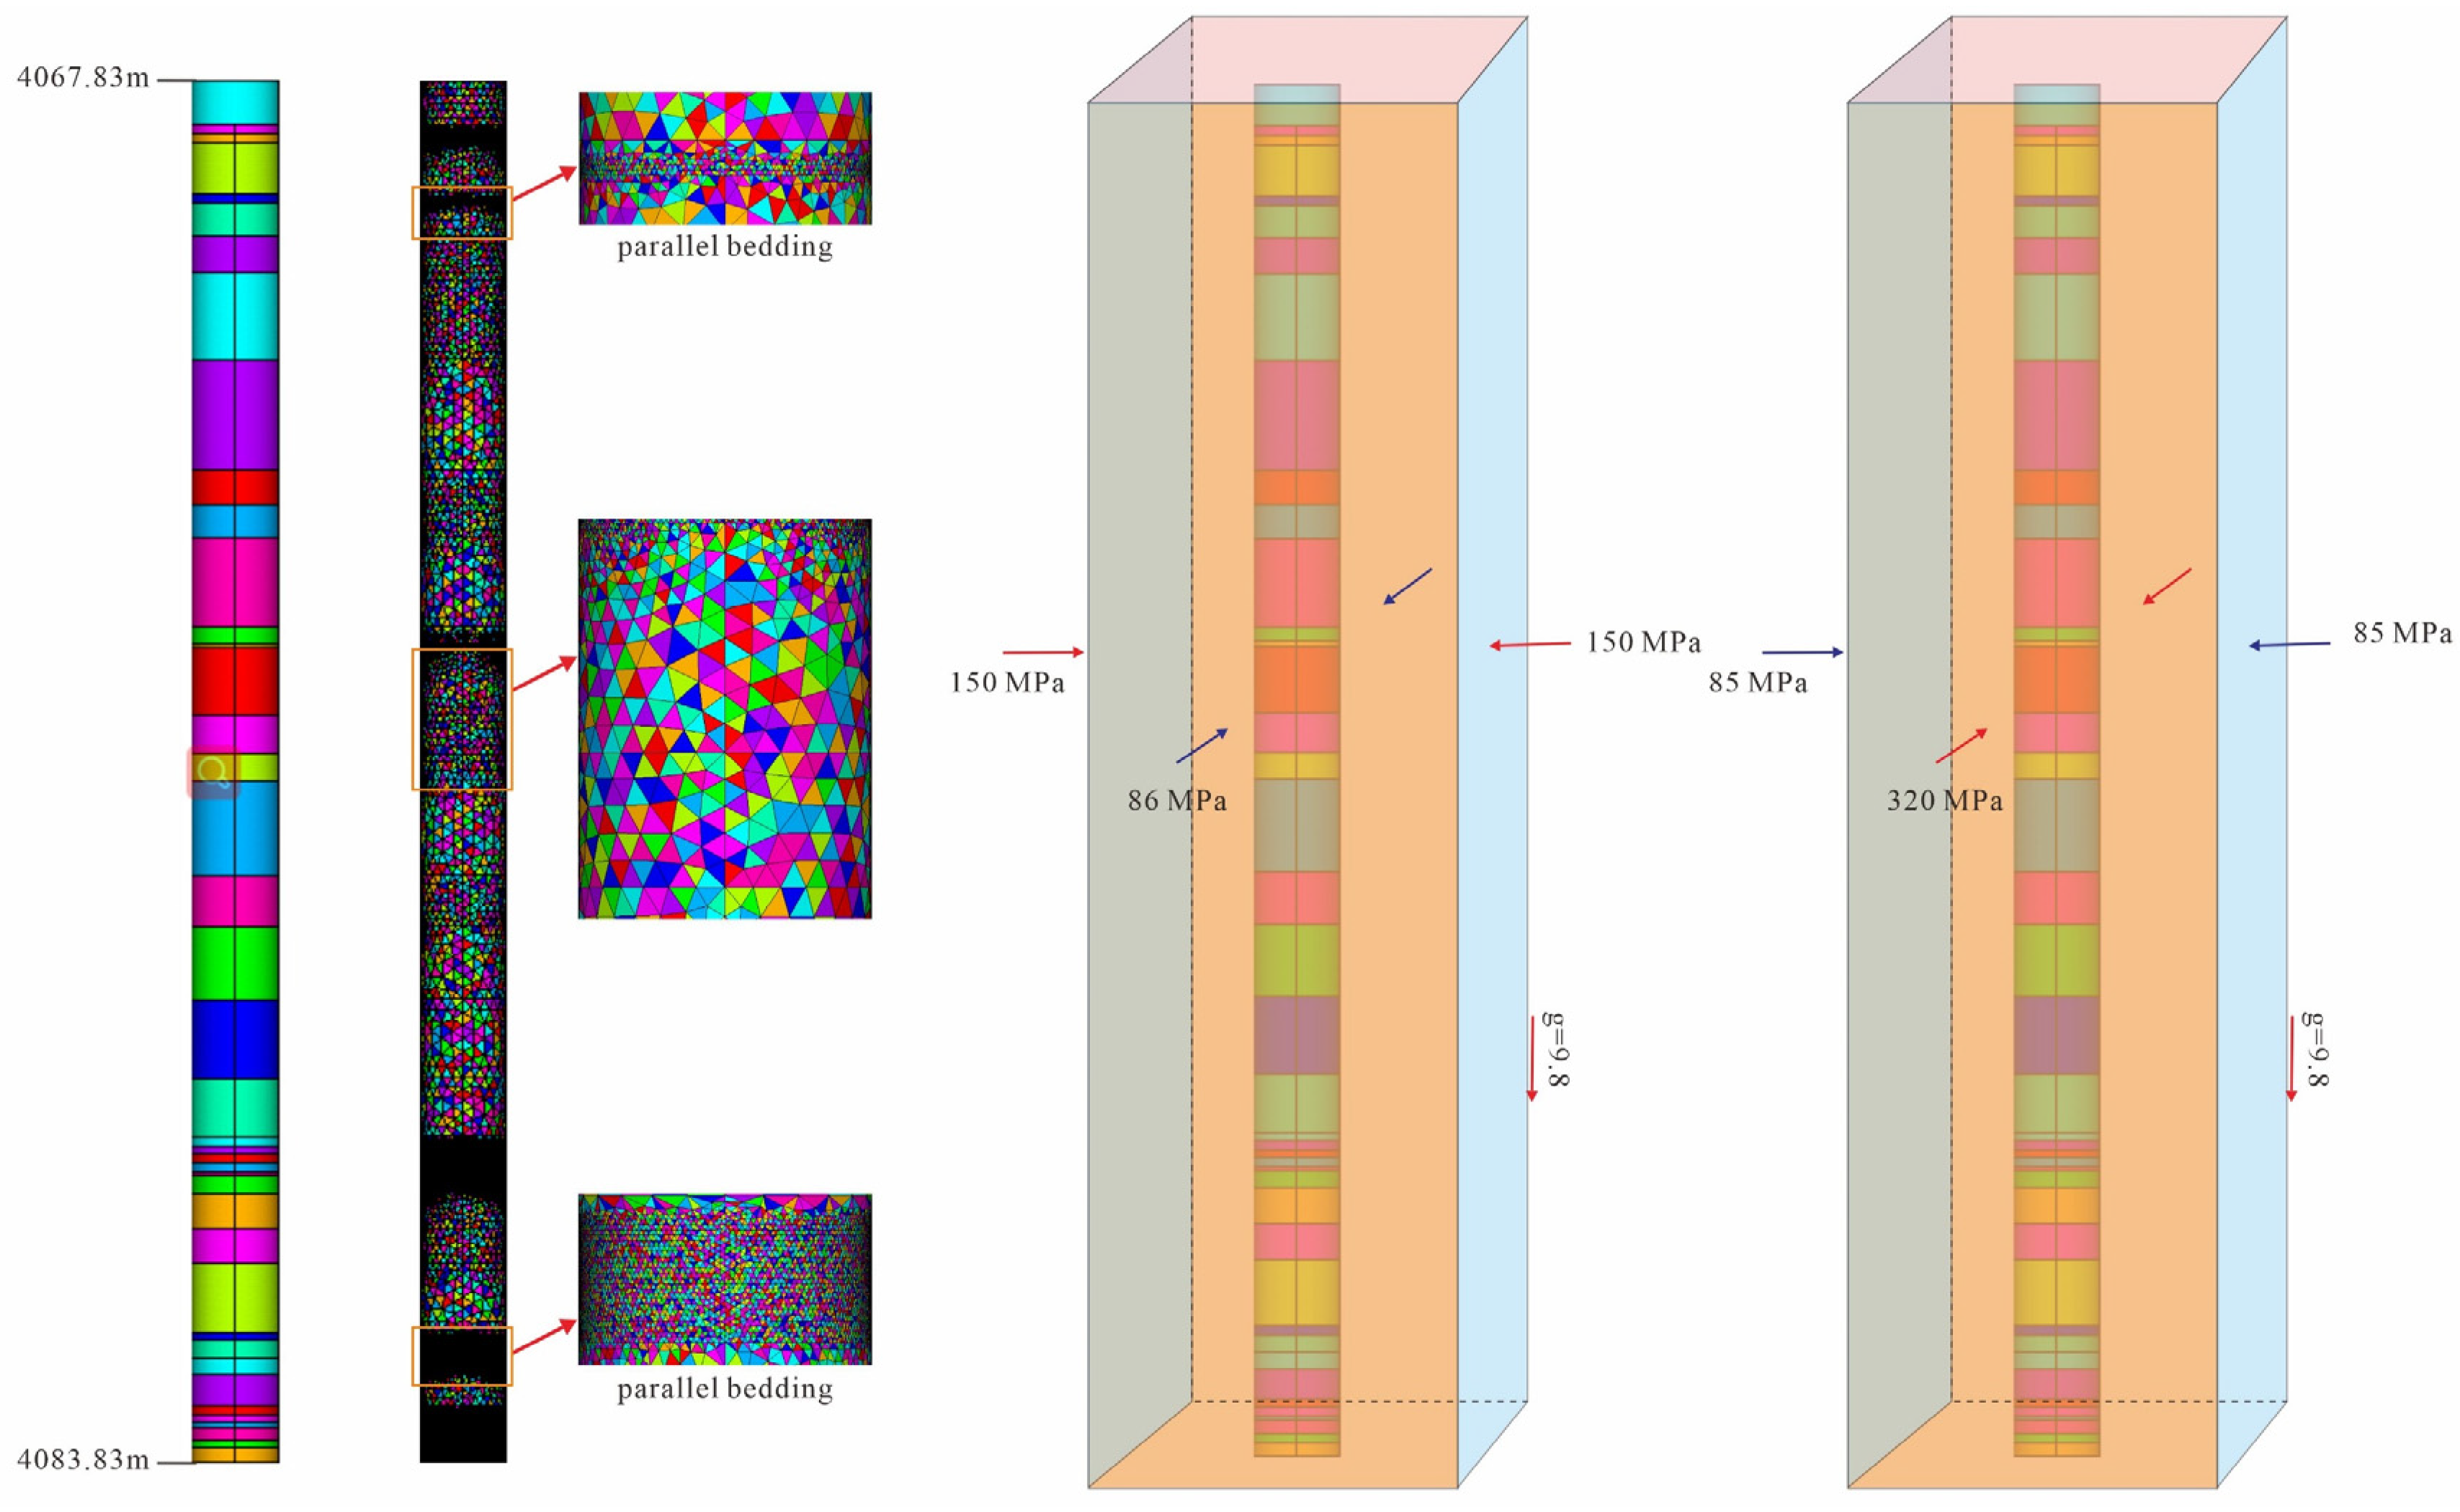
3.4. Finite Element Numerical Simulation of In Situ Stress

The FENS approach discretizes a continuous geological body into finite elements, enabling numerical solutions [48,49]. These elements, interconnected by nodes, are assigned actual rock mechanical parameters, considering three key variables: displacement, stress, and strain. Equations, based on equilibrium conditions and boundary stress at nodes, are solved to incorporate node displacement (unknown) and stiffness matrix coefficients. Utilizing interpolation functions, node displacement is determined, enabling the calculation of internal stress and strain. By combining these units, the in situ stress distribution across the geological body is calculated, with simulation accuracy tied to the fidelity of the geological model. The FENS process involves four main steps: (I) establishing the geological model, (II) generating the mesh model, (III) constructing the mechanical model, and (IV) determining boundary loading conditions. Step I involves determining the vertical model size and lithological combinations based on bedding plane, lithology, and sedimentary structure. In Step II, the continuous geological model is discretized into elements and nodes, with rock mechanical parameters assigned based on logging interpretation and testing (Table 1). The model comprises 274,986 nodes and 1,574,649 elements. Step IV sets boundary load conditions, including loading stress and displacement, according to loading methods and fracture direction. Two vertical models are established to explore the relationship among sedimentary hydrodynamic conditions, in situ stress, and fracture parameters (Figure 2). These models incorporate different lithological combinations and architecture interfaces, achieving high accuracy. For instance, a 16 m section in the zj 20 well is divided into 41 lithologies and architectures. Loading stress is applied to boundaries, and gravitational acceleration is considered. This approach yields the distribution of in situ stress in the study area’s selected section. The loading stress on the north–south boundary of the current geological model was 150 MPa, and on the east-western boundary was 86 MPa. In the ancient geological model, the loading stress on the north-south boundary was 320 MPa, and on the east–west boundary was 85 MPa. The bottom of the model was constrained in the z-direction, and gravitational acceleration was applied to the model. Consequently, the distribution of in situ stress in the selected typical section of the study area was obtained.

3.5. Quantitative Characterization of Fracture Parameters

In this study, the objective was to quantitatively characterize the developmental characteristics of fracture parameters using rock rupture criteria and mathematical calculations. The three-dimensional stress condition was analyzed, and two significant criteria, namely the Coulomb–Mohr criterion and Griffith rupture criterion, were selected to assess rock rupture in the sandstone. Equations linking in situ stress, strain, and fracture parameters were established based on elasticity theory. By considering the principal strain and corresponding principal stress, the strain energy per unit volume was calculated, providing a measure of the magnitude of elastic strain energy within the entire rock mass [48,49]. These calculations allowed for the quantitative characterization of fracture parameters, enabling a better understanding of their developmental characteristics in the study area.
The established rupture criterion was listed as follows:
(1)
Where σ3 > 0, the Coulomb–Mohr criterion was used, then the fracture’s volume density and linear density could be determined by Equations (8) and (9):
D v f = 1 2 E J 0 + σ 3 b σ 1 2 + σ 2 2 + σ 3 2 2 μ σ 1 σ 2 + σ 2 σ 3 + σ 1 σ 3 0.85 2 σ p 2 + 2 μ σ 2 + σ 3 σ p      
D l f = 2 D v f L 1 L 3 sin θ cos θ L 1 sin θ L 3 cos θ L 1 2 sin 2 θ + L 3 2 cos 2 θ
where Dvf is the volume density of fracture, m2/m3; J0 refers to the required surface energy without pressure, J/m2; E shows the rock’s Young’s modulus, MPa; μ refers to the rock’s Poisson’s ratio, dimensionless; σ1, σ2, σ3 are the minimum, medium, and maximum principal stresses, respectively, MPa; b refers to the fracture aperture, m; σp is the rock rupture stress, MPa; Dlf shows the fracture linear density, /m; L1 and L3 show the characterized unit lengths along the σ1 and σ3 orientations, m; and θ is the rock rupture angle, °.
(2)
Where σ3 < 0, the Griffith criterion was used, which could be divided into two situations:
  • σ1 + 3σ3 > 0; the criterion is shown as follows:
    D v f = 1 2 J 0 + σ 3 b σ 1 2 + σ 2 2 + σ 3 2 2 μ σ 1 σ 2 + σ 2 σ 3 + σ 1 σ 3 σ t 2
    D l f c = D l f = 2 D v f L 1 L 3 sin θ cos θ L 1 sin θ L 3 cos θ L 1 2 sin 2 θ + L 3 2 cos 2 θ
    where Dlfc shows the calculated fracture linear density, /m; σt refers to the rock’s tensile strength, MPa.
  • σ1 + 3σ3 ≤ 0; according to Equation (11), the fracture volume density and linear density could be obtained.
D l f c = D v f = 1 2 J 0 + σ 3 b σ 1 2 + σ 2 2 + σ 3 2 2 μ σ 1 σ 2 + σ 2 σ 3 + σ 1 σ 3 σ t 2
The fracture aperture could be calculated through Equation (12):
b = ε 3 ε 0 D l f
where ε0 shows the maximum elastic strain of rock affordability.
By employing Equations (7)–(12), the linear density, aperture, and volume density of fractures in the typical section were quantitatively determined. These calculations provide reliable and valuable insights into the study of geomechanical response characteristics under various sedimentary hydrodynamic conditions. The obtained results serve as a reliable and effective support for further analysis in this field of research.

4. Results

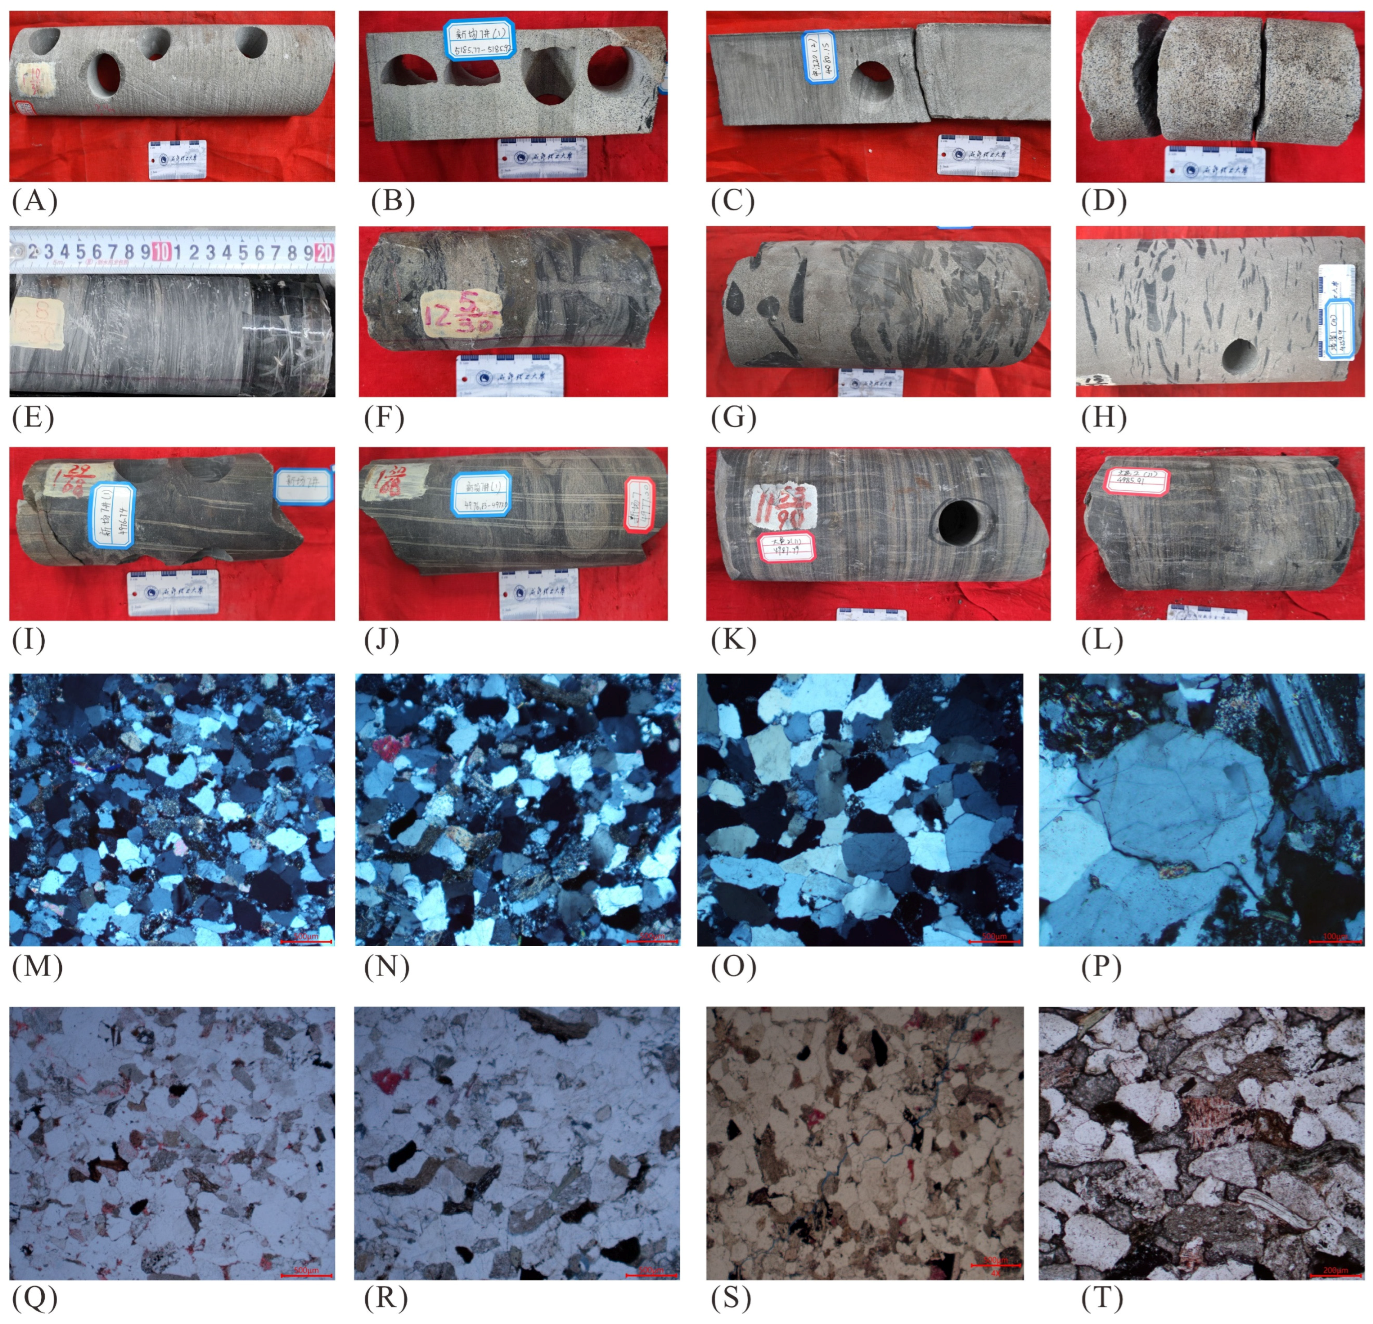
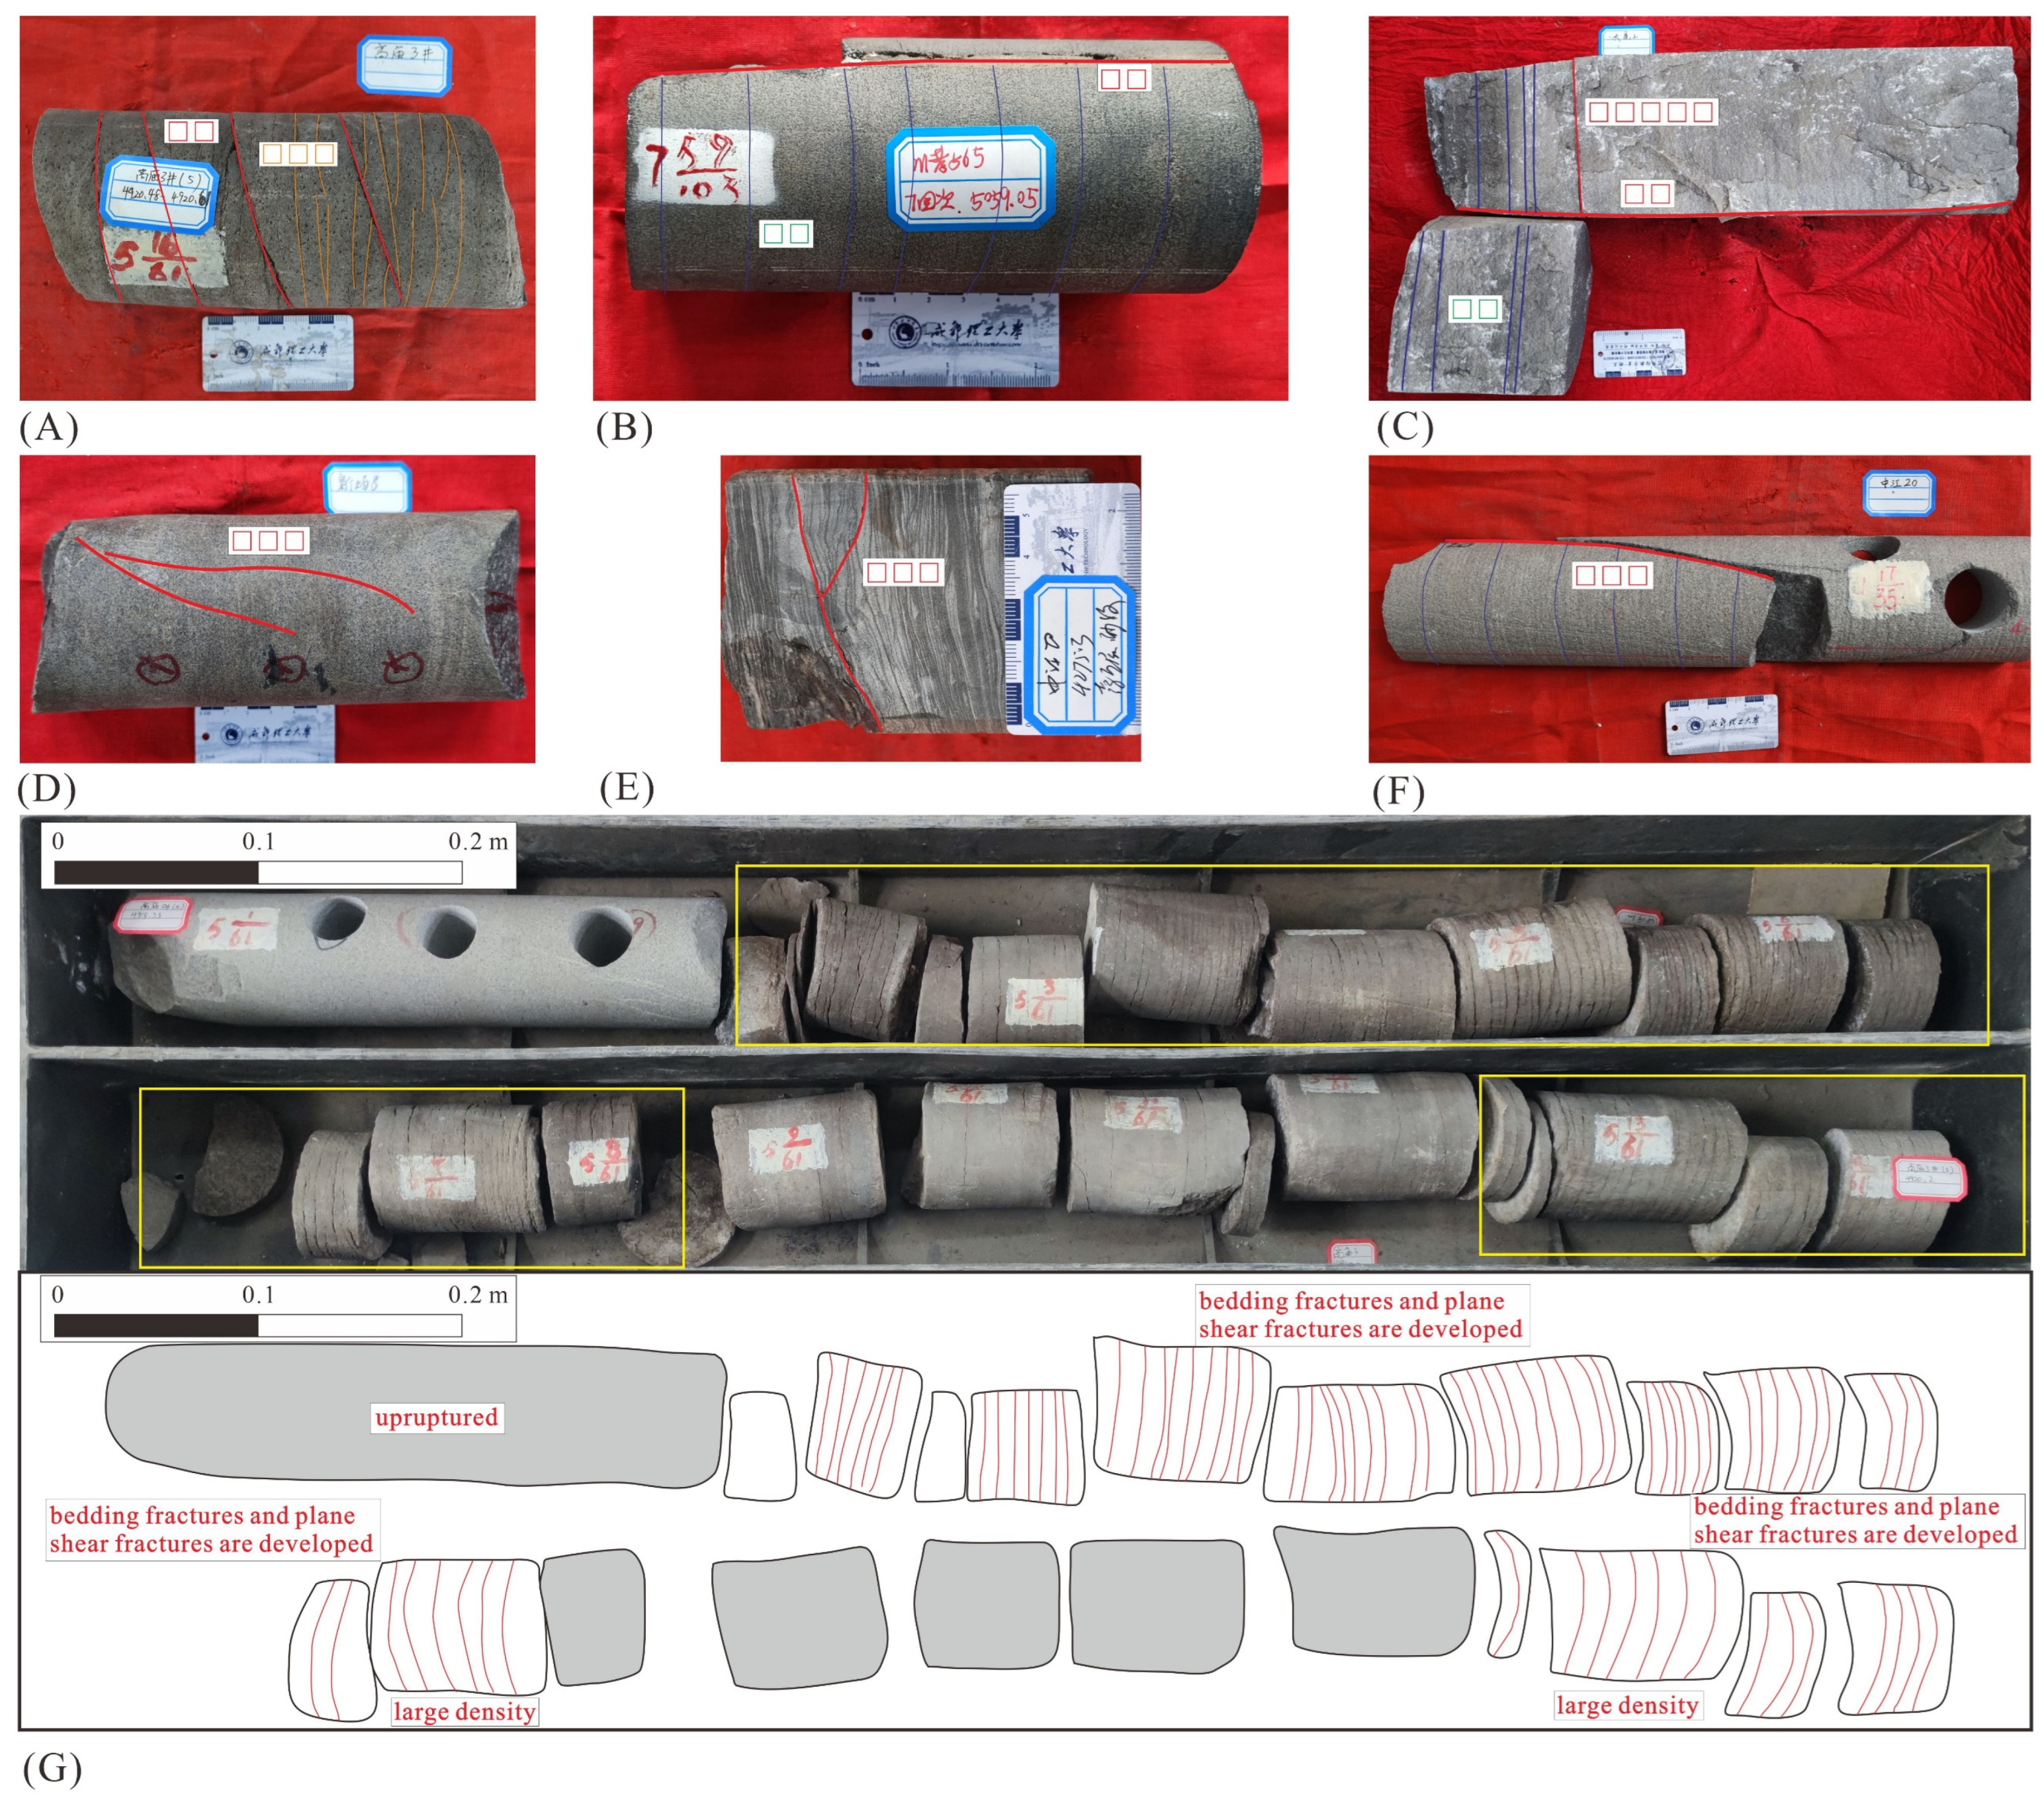
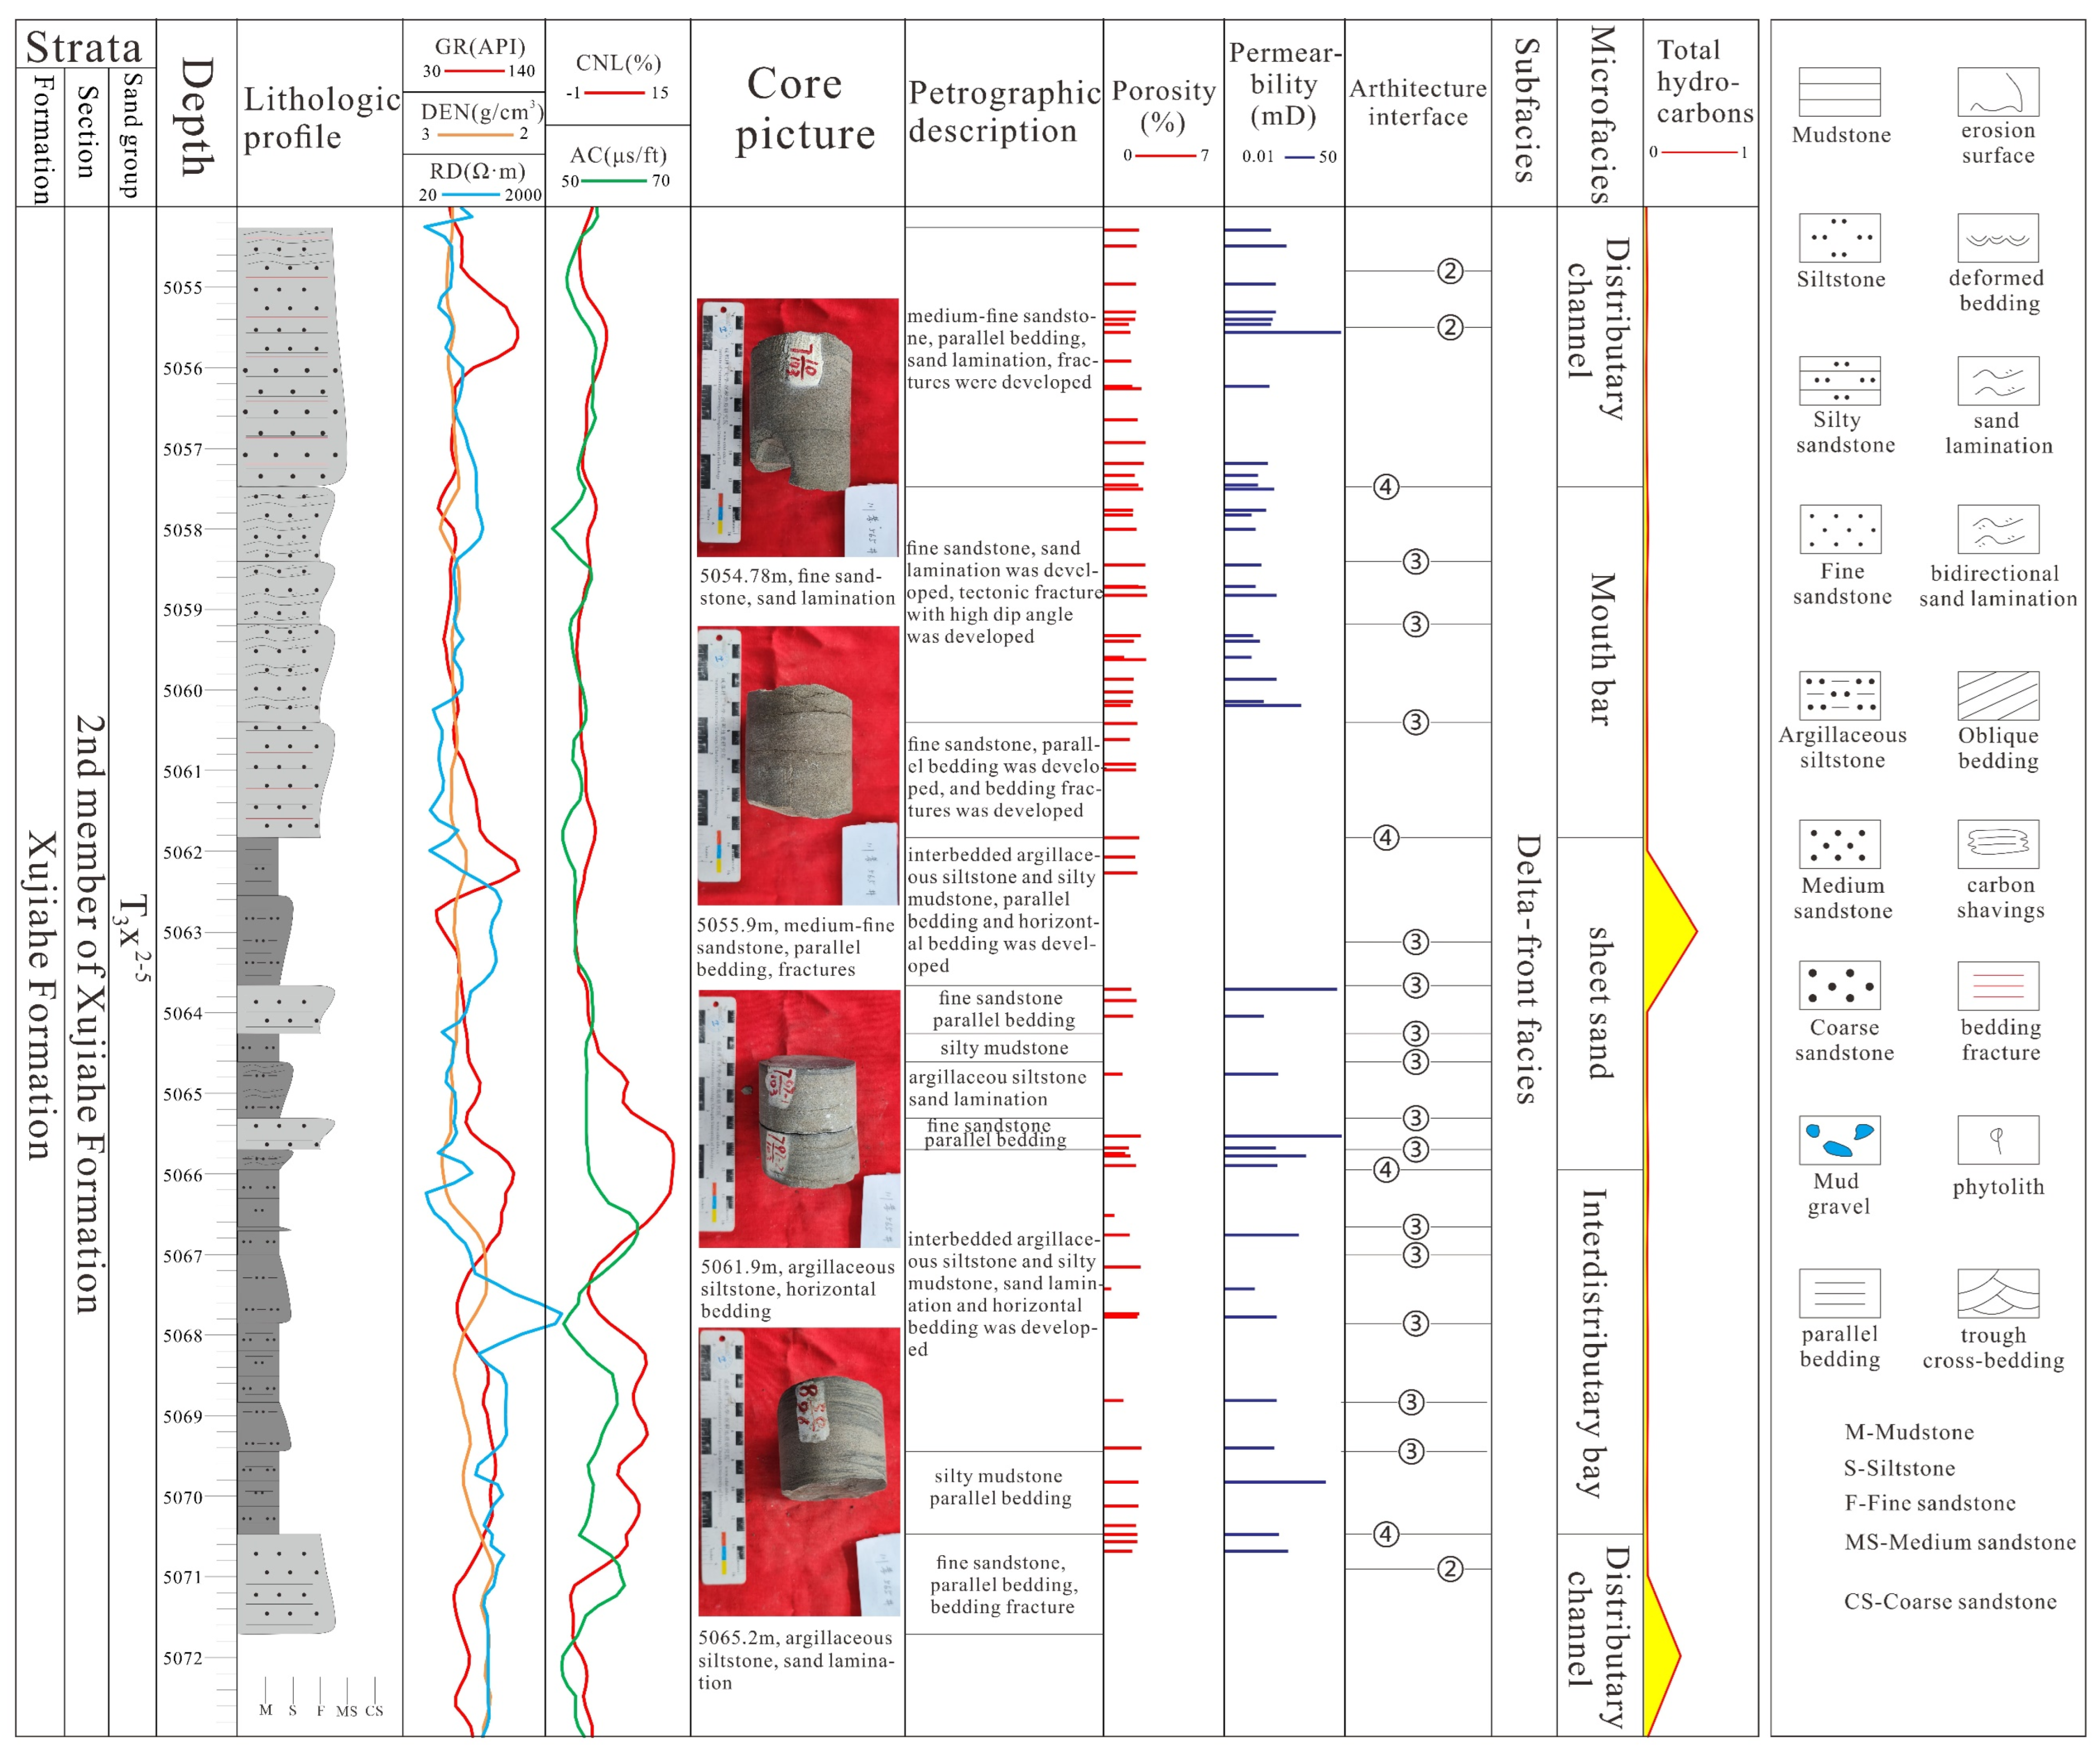
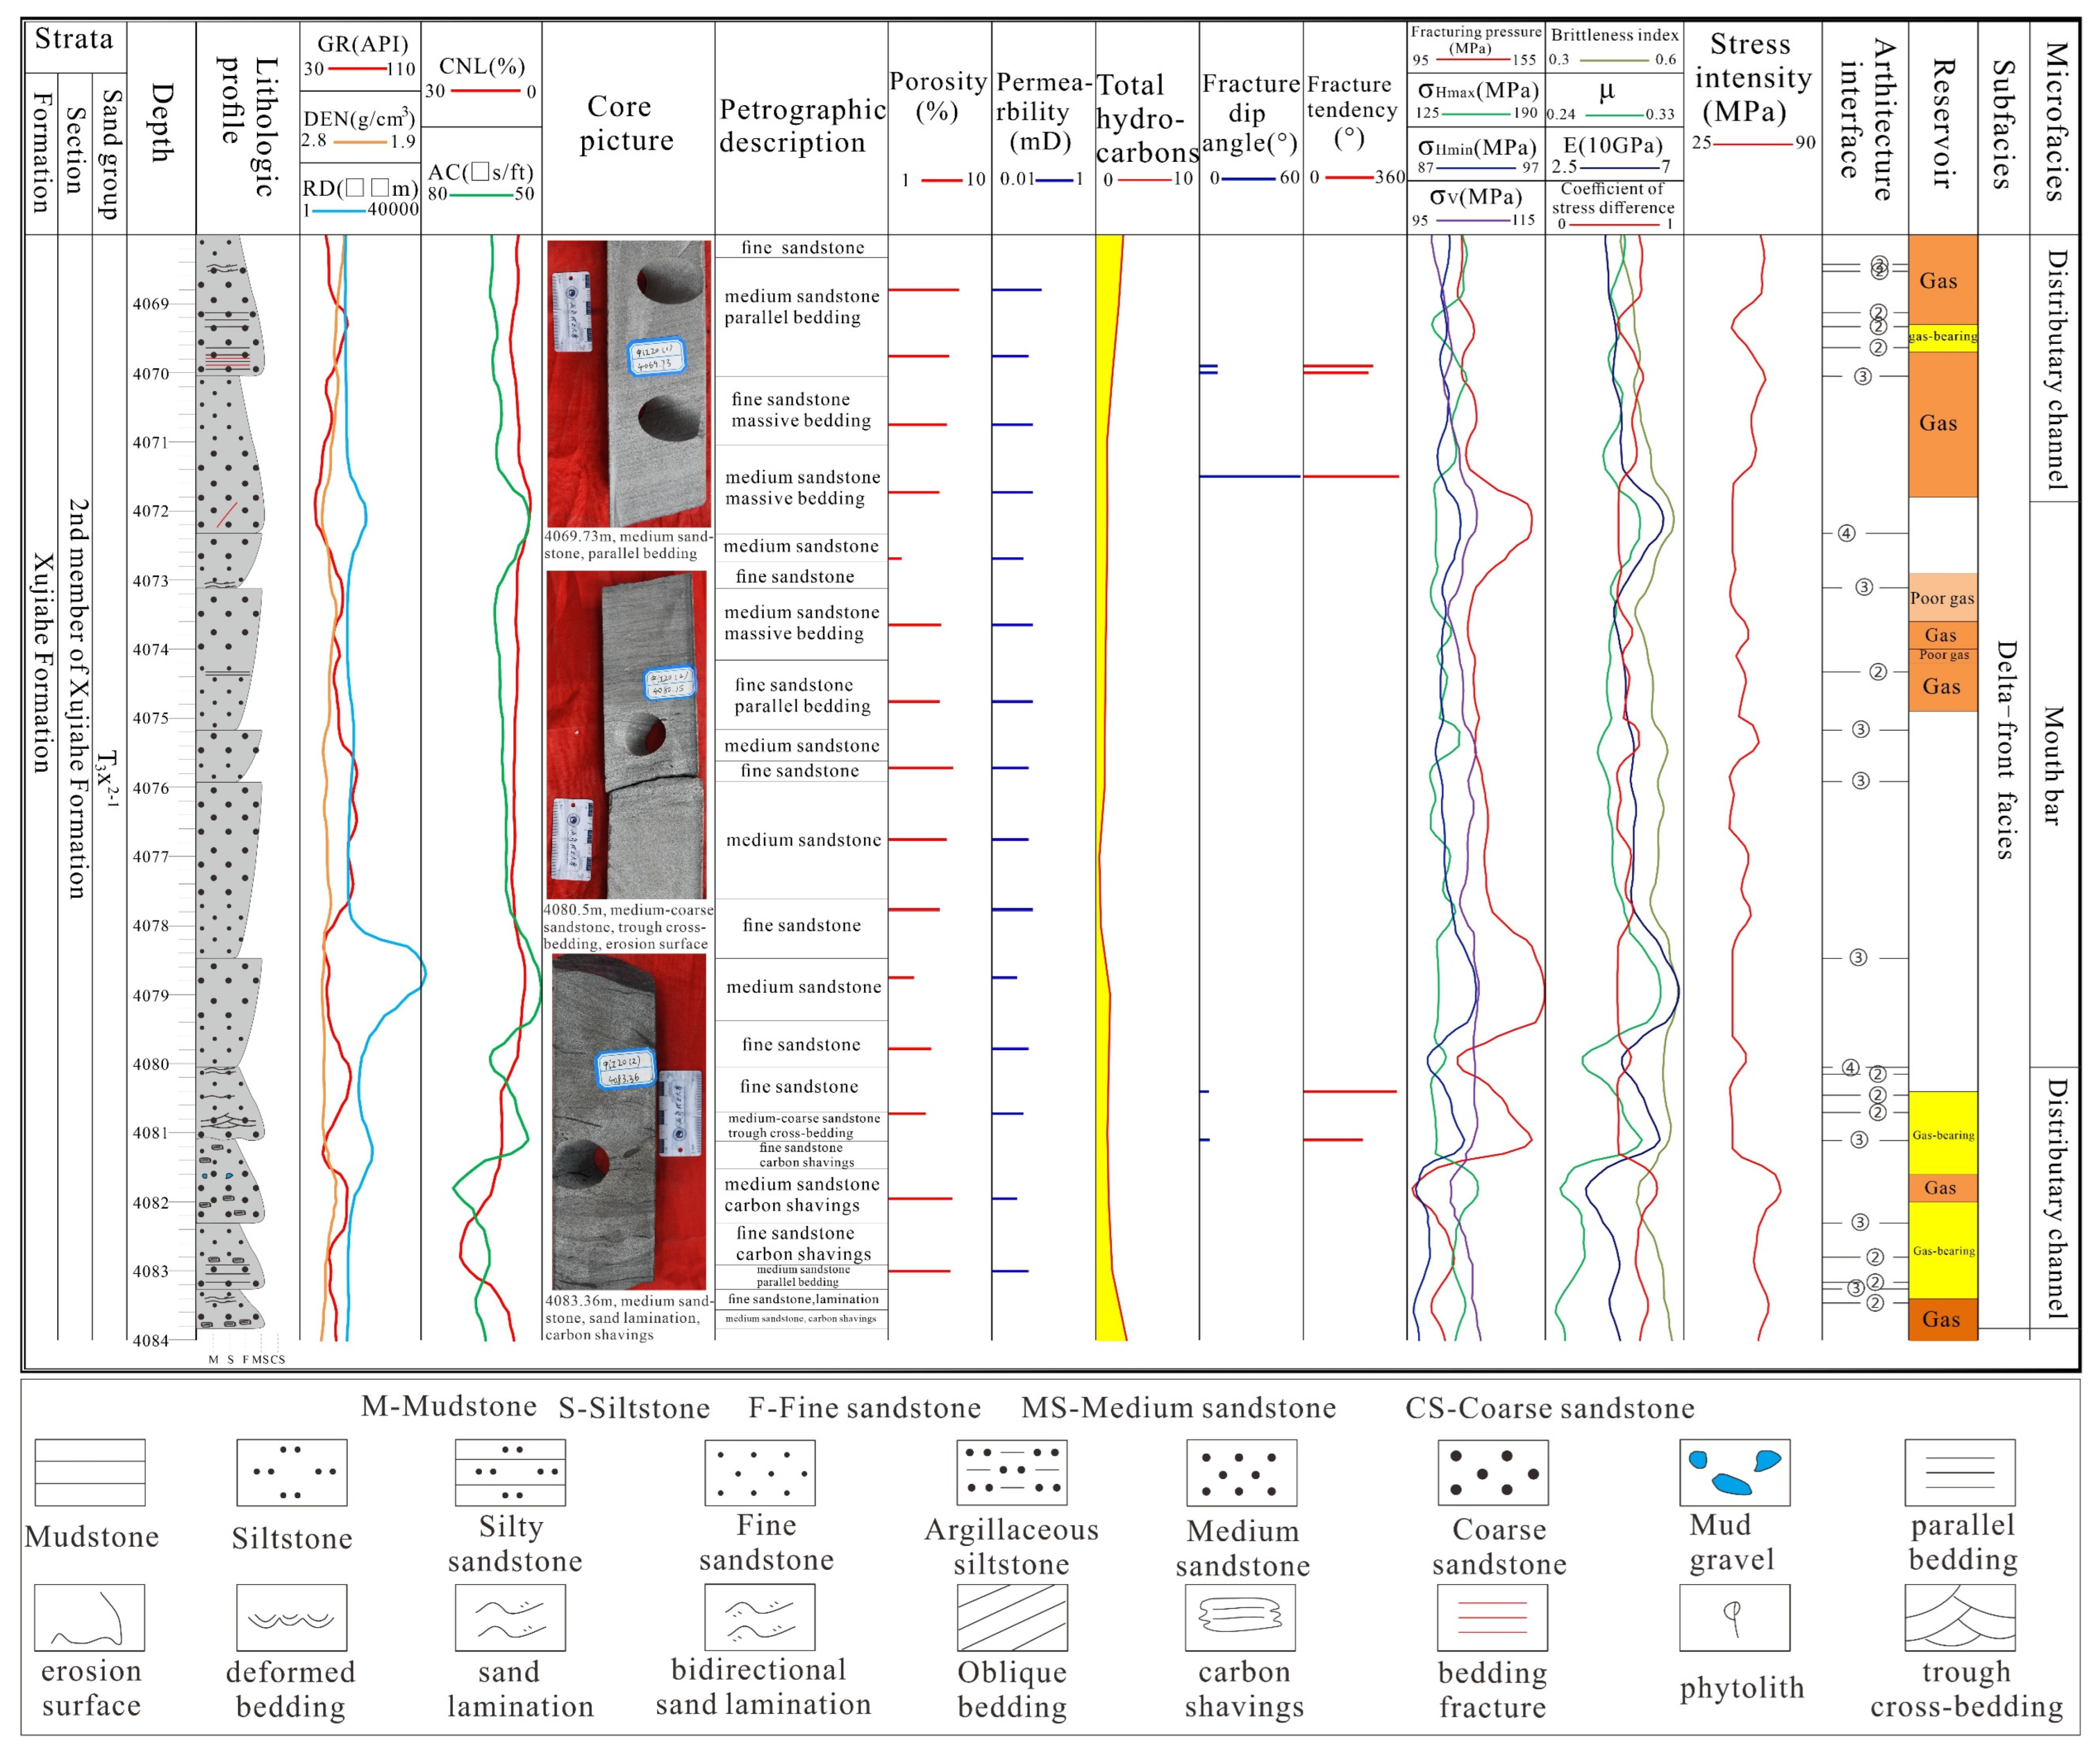
4.1. Developmental Characteristics of Bedding Plane and Structural Fractures

In this study, we investigated the developmental characteristics of sedimentary microfacies, bedding planes, and structural fractures using core observation and thin section identification methods. Six distinct sedimentary microfacies were identified within the T3x2 Formation based on observed results and considering grain size, lithology, and sedimentary structural characteristics (Figure 3). The underwater distributary channel microfacies displayed normal grading and well-developed bedding planes, indicating strong hydrodynamic conditions (Figure 3A,B). Conversely, the mouth bar microfacies exhibited inverse grading and trough cross-bedding, indicating relatively strong hydrodynamic conditions (Figure 3C,D). The interdistributary bay microfacies showed well-developed silty mudstone, suggesting a weak hydrodynamic environment (Figure 3E,F). The sandy debris flow microfacies was characterized by massive sandstone at the bottom and abundant mud gravel at the top, representing a weak hydrodynamic condition (Figure 3G,H). The inshore shallow lake microfacies consisted of black shale, indicating a weak sedimentary hydrodynamic environment (Figure 3I,J). Finally, the natural levee microfacies exhibited interbedded sandstone and mudstone, suggesting a relatively weak hydrodynamic condition (Figure 3K,L). Thin section analysis (Figure 3M,N) revealed that the sandstone was primarily composed of quartz, with medium compaction action observed. Carbonate and clay cementation were the dominant cement types, and the reservoir space mainly consisted of secondary pores, primarily formed by feldspar dissolution (Figure 3O–R). Metasomatism of cement to clastic particles was also observed within the T3x2 Formation (Figure 3S,T).
Based on observed developmental characteristics within the T3x2 Formation (Figure 4), four types of bedding planes were identified: sand lamination, horizontal bedding, parallel bedding, and trough cross-bedding (Figure 4A–E,G–I). Additionally, three significant types of structural fractures were distinguished: bedding-plane shear fractures, shear fractures with medium-high dip angles, and tensile-shear fractures with high dip angles (Figure 4A,B,E–H). Bedding-plane shear fractures with low angles exhibited slipping and rupturing along horizontal or low-angle parallel bedding, influenced by shear stress, evidenced by scratches, mirror surfaces, and small steps (Figure 4A,E,H). Two categories of shear fractures with medium-high dip angles were identified: one followed weak bedding planes at medium-high angles, while the other penetrated through weak bedding planes due to strong tectonic stress (Figure 4B,E,G). Conjugate shear fractures with high dip angles and multiple fracture sets were primarily developed in tight sandstone with well-developed horizontal bedding planes (Figure 4A). Tensile fractures displayed a slightly curved form, indicating the combined action of shear and derived tensile stress, influenced by mechanical heterogeneity of bedding planes (Figure 4F). These developmental characteristics indicate significant differences in tight sandstone with various bedding planes (level 2 architecture interface), profoundly influenced by sedimentary hydrodynamic conditions. These observations offer valuable insights and guidance for analyzing geomechanical responses across different sedimentary hydrodynamic conditions.

4.2. Distribution Characteristics of Reservoir Architecture

To elucidate the distribution characteristics of reservoir architecture, we analyzed 10 representative wells, focusing on wells cx 563 (5054–5072 m) and zj 20 (4067.83–4083.83 m) to present our findings (Figure 5 and Figure 6). By correlating core samples with the logging gamma curve, we accurately described the vertical developmental characteristics of lithology, bedding planes, and fractures. In well cx 563, we identified three significant architecture interfaces: level 2, level 3, and level 4 (Figure 5). Each sedimentary hydrodynamic cycle represented a continuous change in hydrodynamic conditions (e.g., 5057.45–5058.39 m). The reservoir exhibited low physical properties, with porosity ranging from 1 to 3% and permeability from 10 to 50 mD. The lithology mainly comprised fine sandstone, medium-fine sandstone, argillaceous siltstone, and silty mudstone. We distinguished three bedding planes within the T3x2 Formation: parallel bedding, sand lamination, and horizontal bedding planes, which contributed to determining the reservoir architecture interfaces of level 2. Moreover, we identified four significant microfacies in the delta-front facies of well cx 563: distributary channel, mouth bar, sheet sand, and interdistributary bay. Overall, the well exhibited three reservoir architecture interfaces of level 2, 15 of level 3, and four of level 4 (Figure 5), each corresponding to changes in sedimentary hydrodynamic conditions. Notably, within two level 4 interfaces, we identified a continuous sedimentary sand body between two level 3 interfaces. Similarly, within two level 3 interfaces, the level 2 interface indicated a relatively weak change in sedimentary hydrodynamic conditions.
In well zj 20 (Figure 6), we distinguished three reservoir architecture interfaces: level 2, level 3, and level 4. In total, we identified 15 level 2 interfaces, eight level 3 interfaces, and two level 4 interfaces. The lithology mainly comprised fine sandstone, medium sandstone, and medium-coarse sandstone, with four distinct bedding planes observed: parallel bedding, sand lamination, trough cross-bedding, and massive bedding planes. Porosity and permeability of the reservoir were primarily distributed in the range of 2–10% and 0.1–1 mD, respectively, indicating poor reservoir properties. Two significant microfacies were identified in the delta-front facies of well zj 20: the distributary channel and the mouth bar. Combining gas production yield, reservoir pressure, porosity, and permeability, we distinguished three types of reservoirs: gas reservoir, gas-bearing reservoir, and poor gas layer. For example, in the sedimentary environment of the mouth bar, a continuous sand body was observed between two level 3 interfaces, indicating a stable sedimentary hydrodynamic cycle. Interestingly, integration of porosity, permeability, total hydrocarbon content, fracture dip angle, and fracture tendency revealed a positive correlation between higher porosity and permeability magnitudes with reservoir architecture interfaces. Areas with higher total hydrocarbon content were primarily located near regions with level 3 interfaces. However, due to the limited number of fractures, the relationship between fracture parameters and reservoir architecture interfaces remained unclear. Overall, different reservoir architecture interfaces reflected varying sedimentary hydrodynamic conditions, leading to different geomechanical response characteristics, necessitating further analysis of geomechanical parameters’ developmental characteristics.

4.3. Characteristics of Geomechanical Parameters

Eleven geomechanical parameters are depicted in Figure 6, including fracturing pressure, horizontal maximum principal stress, horizontal minimum principal stress, vertical principal stress, brittleness index, Poisson’s ratio, Young’s modulus, coefficient of stress difference, stress intensity, fracture dip angle, and fracture tendency. Fracturing pressure ranged primarily between 95 and 155 MPa, with an average of 123.45 MPa. The horizontal maximum principal stress varied from 125 to 190 MPa, averaging 138.19 MPa, while the horizontal minimum principal stress ranged mainly between 87 and 97 MPa, averaging 94.93 MPa. The vertical principal stress ranged from 95 to 115 MPa, averaging 102.98 MPa. Brittleness index showed a range of 0.3 to 0.6, averaging 0.39, and Poisson’s ratio varied between 0.24 and 0.33, with a mean of 0.31. Young’s modulus ranged from 7.1 to 65 GPa, with an average of 38.11. The coefficient of stress difference ranged from 0.293 to 0.944, averaging 0.458, and stress intensity varied from 25 to 90 MPa, averaging 47.76 MPa. Fracture dip angle was primarily between 0 and 60°, with an average of 12.19°. Furthermore, the current in situ stress state was determined by analyzing the relationship among horizontal maximum principal stress, horizontal minimum principal stress, and vertical principal stress (Figure 7). Three significant stress mechanisms were identified: Type I (subdivided into Ia and Ib), Type II (thrust fault stress mechanism), and Type III (strike-slip fault stress mechanism). In the T3x2 Formation, strike-slip stress was observed at depths of 4050–4238 m and 4263–4425 m, while thrust fault stress was determined at a depth of 4238–4263 m.
The analysis revealed significant insights into the geomechanical parameters across different sand groups. Fracture strike patterns varied notably among wells. For instance, in well zj 20, fracture strikes were prevalent in ranges of 0−20°, 50−60°, 90−110°, and 170−180° (Figure 8A), while well gm 3 exhibited concentrated strikes in the ranges of 60–80° and 150−160° (Figure 8B). Similarly, in well xc 8, strikes were mainly in the ranges of 100−110° and 170−180° (Figure 8C), and in well xc 5, they clustered around 70−90° and 120−130° (Figure 8D). Regarding sedimentary structures, massive bedding was most developed in well zj 20, followed by trough cross-bedding and parallel bedding, while sand lamination was least prominent. Similar trends were observed in other wells, with variations in the dominance of specific bedding structures (Figure 8E–H). Analysis of Young’s modulus across sand groups indicated values predominantly between 20 and 55 GPa, with the T3x2–5 sand group exhibiting a lower value (23 GPa) (Figure 8I). Poisson’s ratio ranged mostly between 0.28 and 0.34, with T3x2−5 showing a higher value (0.335) (Figure 8J). The brittleness index and coefficient of stress difference were primarily distributed in the ranges of 0.24−0.53 and 0.30−0.51, respectively, with T3x2−5 demonstrating relatively lower values (Figure 8K,L). This suggests that the rock in the T3x2−5 sand group exhibited weaker elasticity and stronger plasticity. Overall, these findings offer crucial insights and guidance for understanding the geomechanical response across diverse sedimentary hydrodynamic conditions.

5. Discussion

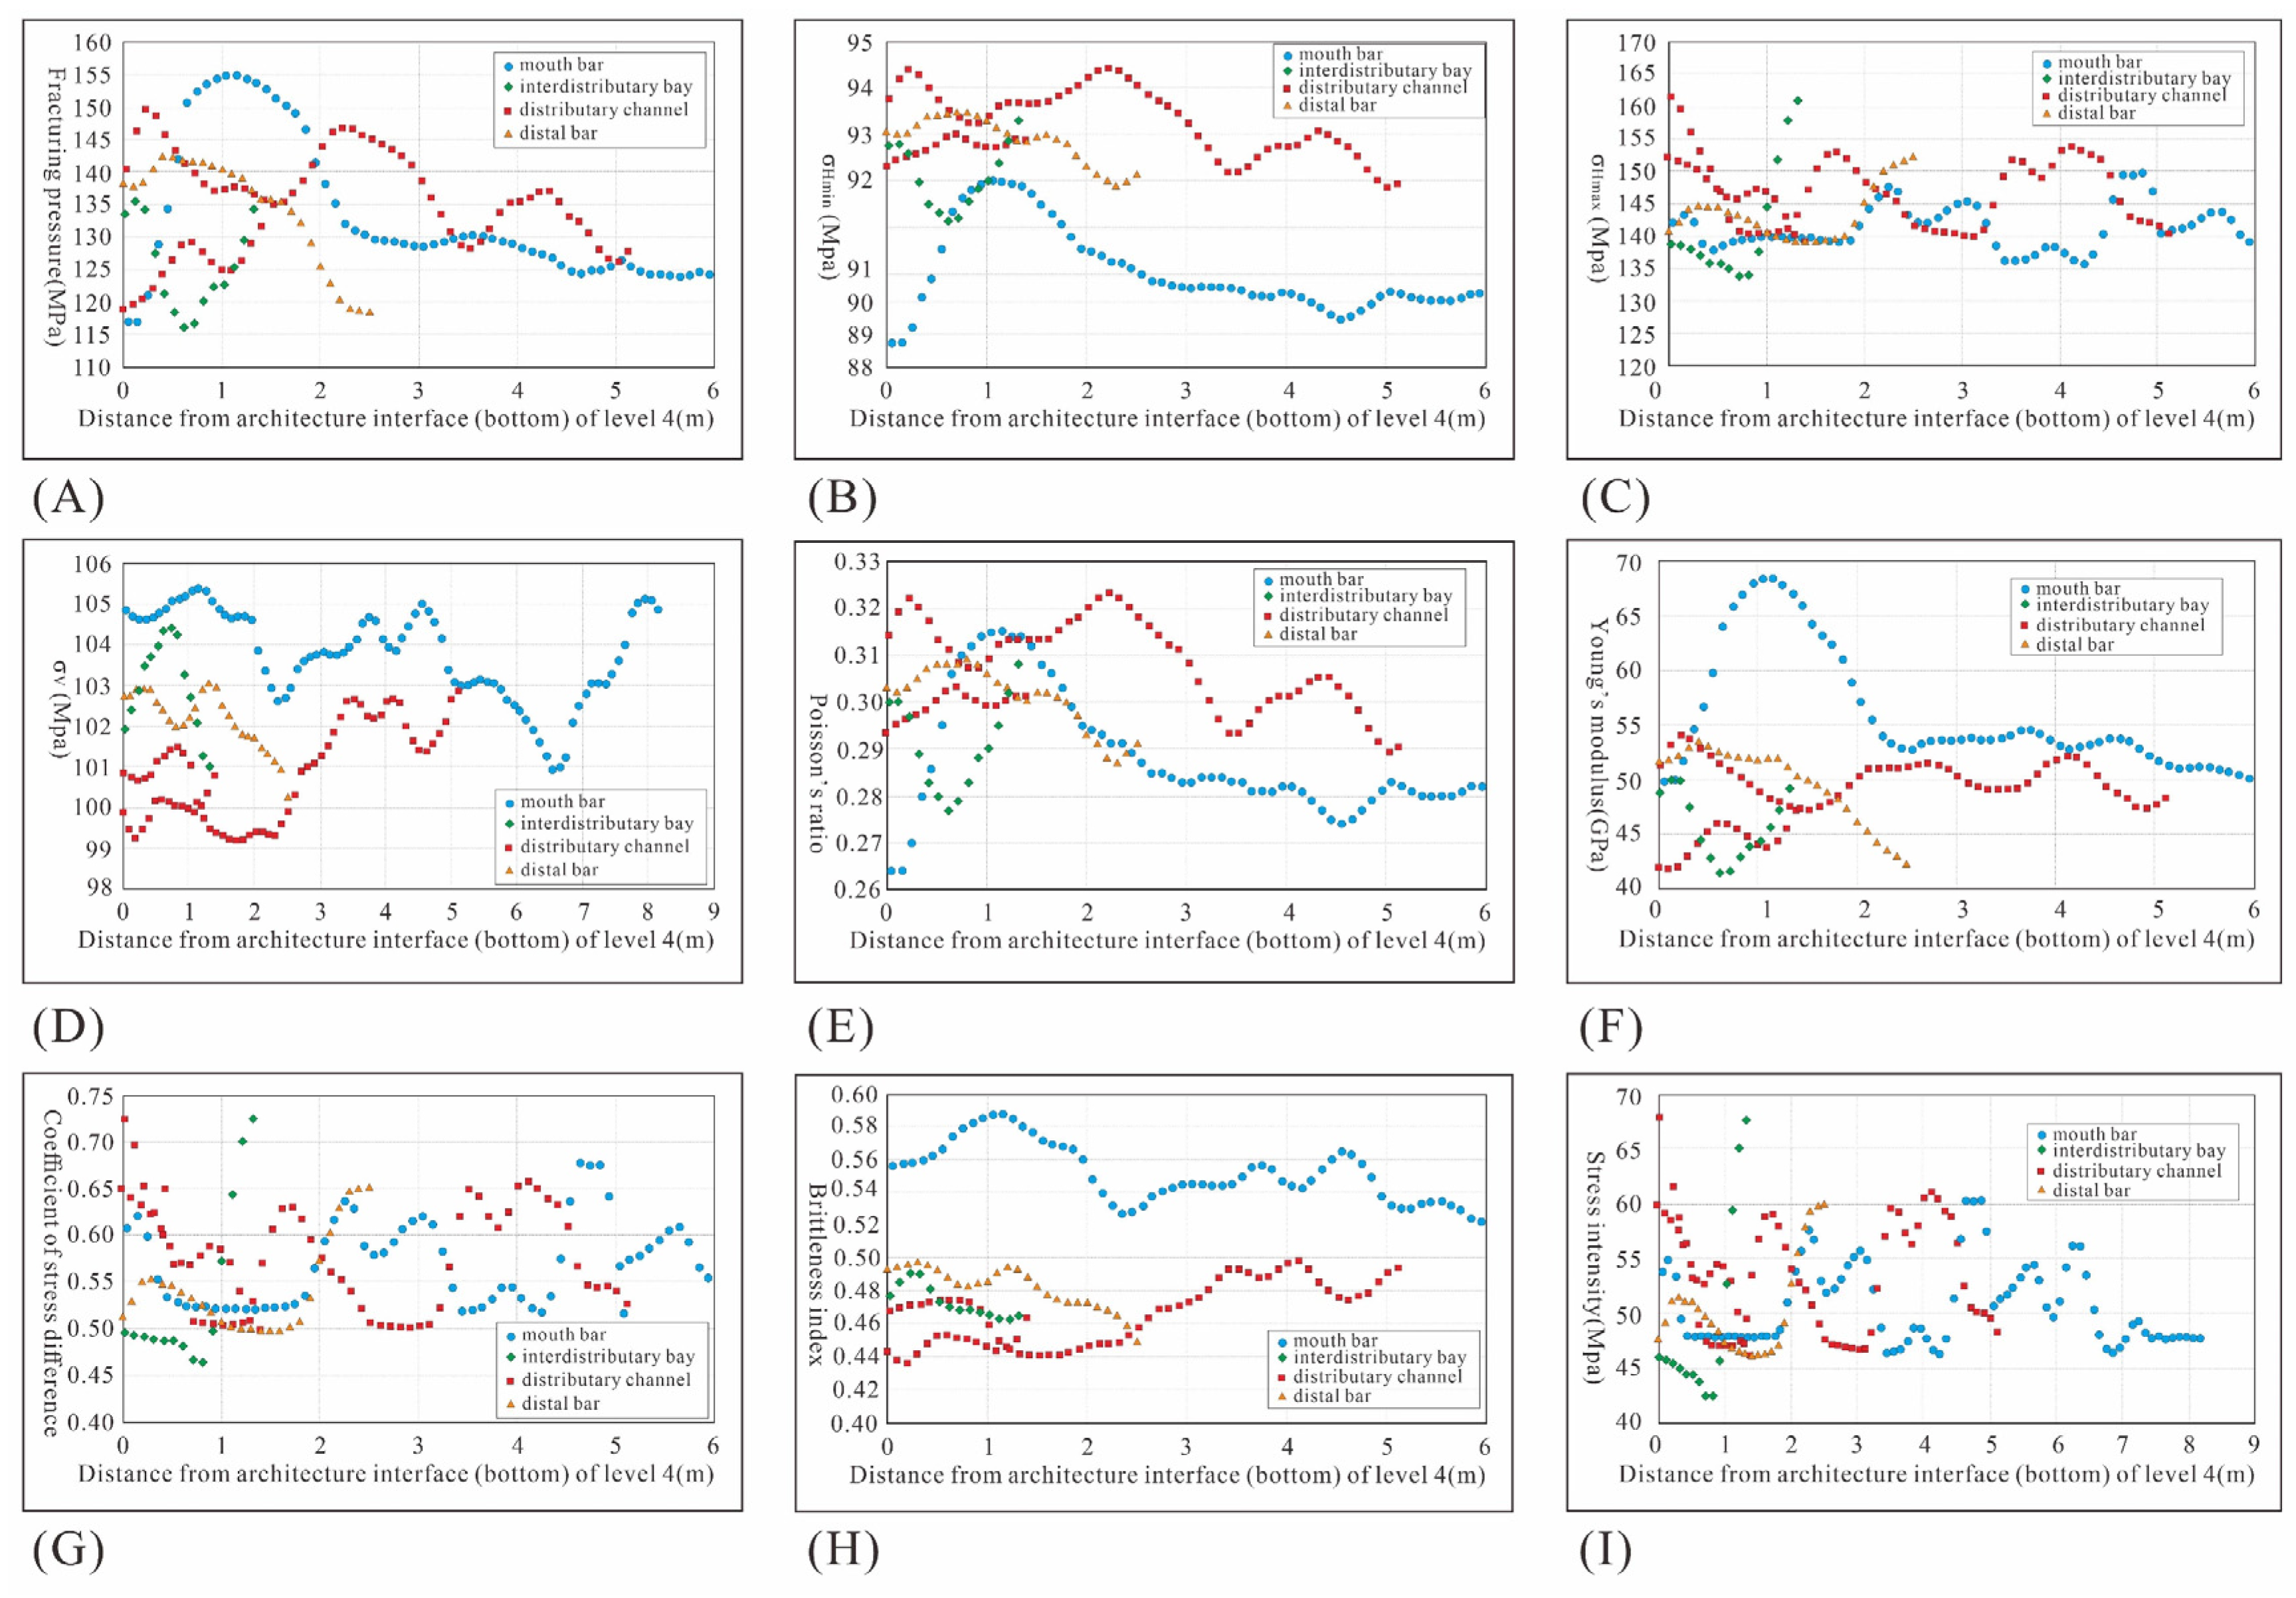
5.1. Geomechanical Response Characteristics on Reservoir Architecture Interface of Level 4

To scrutinize the geomechanical responses at the level 4 reservoir architecture interface, we examined the correlations between various parameters and the distance from this interface. Parameters included fracturing pressure, horizontal and vertical principal stresses, Poisson’s ratio, Young’s modulus, stress intensity, and more. Constrained by the bottom reservoir architecture interface, we observed fluctuations in these parameters over the sedimentary process. Fracturing pressure, for example, exhibited sinusoidal patterns concerning distance from the interface (Figure 9A). In distributary channels, the effective distance was 5 m, with pressure peaking at 0.3, 2.3, and 4.3 m, and valleys at 1.5, 3.5, and 5.0 m. Contrasting patterns were observed in interdistributary bays and mouth bars. The horizontal minimum principal stress mirrored fracturing pressure trends, with distributary channels showing higher magnitudes (92–95 MPa) than mouth bars (88–92 MPa) (Figure 9B). Horizontal maximum principal stress varied with distance; for example, in mouth bars and distributary channels, the effective distance was 5 m, while in interdistributary bays and distal bars, it was 2.5 m (Figure 9C).
Additionally, vertical principal stress, Poisson’s ratio, and Young’s modulus showed similar trends concerning their relationship with distance from the architecture interface (Figure 9D–F). In distributary channels, Poisson’s ratio ranged from 0.29 to 0.33, higher than in mouth bars (0.26–0.315), while Young’s modulus was higher in mouth bars (50–70 GPa) compared to distributary channels (40–55 GPa). Effective distances varied with sedimentary environments, critical for understanding fracture behavior. For instance, in interdistributary bays, it was 1.5 m, while in distal bays, it was 2.5 m. In contrast, in mouth bars and distributary channels, it extended to 5.0 m, indicating prolonged influence on fracture behavior. Similar response patterns were observed at the level 4 architecture interface (Figure 9G–I). The brittleness index in mouth bar environments (0.50–0.60) exceeded that of distributary channels (0.42–0.50), indicating stronger elasticity in mouth bars. Considering these parameters’ responses, different sedimentary microfacies represented varying hydrodynamic environments. For example, interdistributary bay environments showed significant control by the architecture interface at 1.5 m, with hydrodynamic changes at 0.7 m. In distal bars, it was 2.5 m, revealing changes at 0.3, 0.7, and 1.5 m. In distributary channels, it was 5.0 m, with changes at 0.3, 1.5, 2.3, 3.5, 4.3, and 5.0 m. In mouth bars, it was 5.0 m, with changes at 1.1, 2.3, 4.5, and 5.0 m. Peaks and valleys in geomechanical responses corresponded to level 2 or level 3 interfaces, indicating hydrodynamic cycle changes.

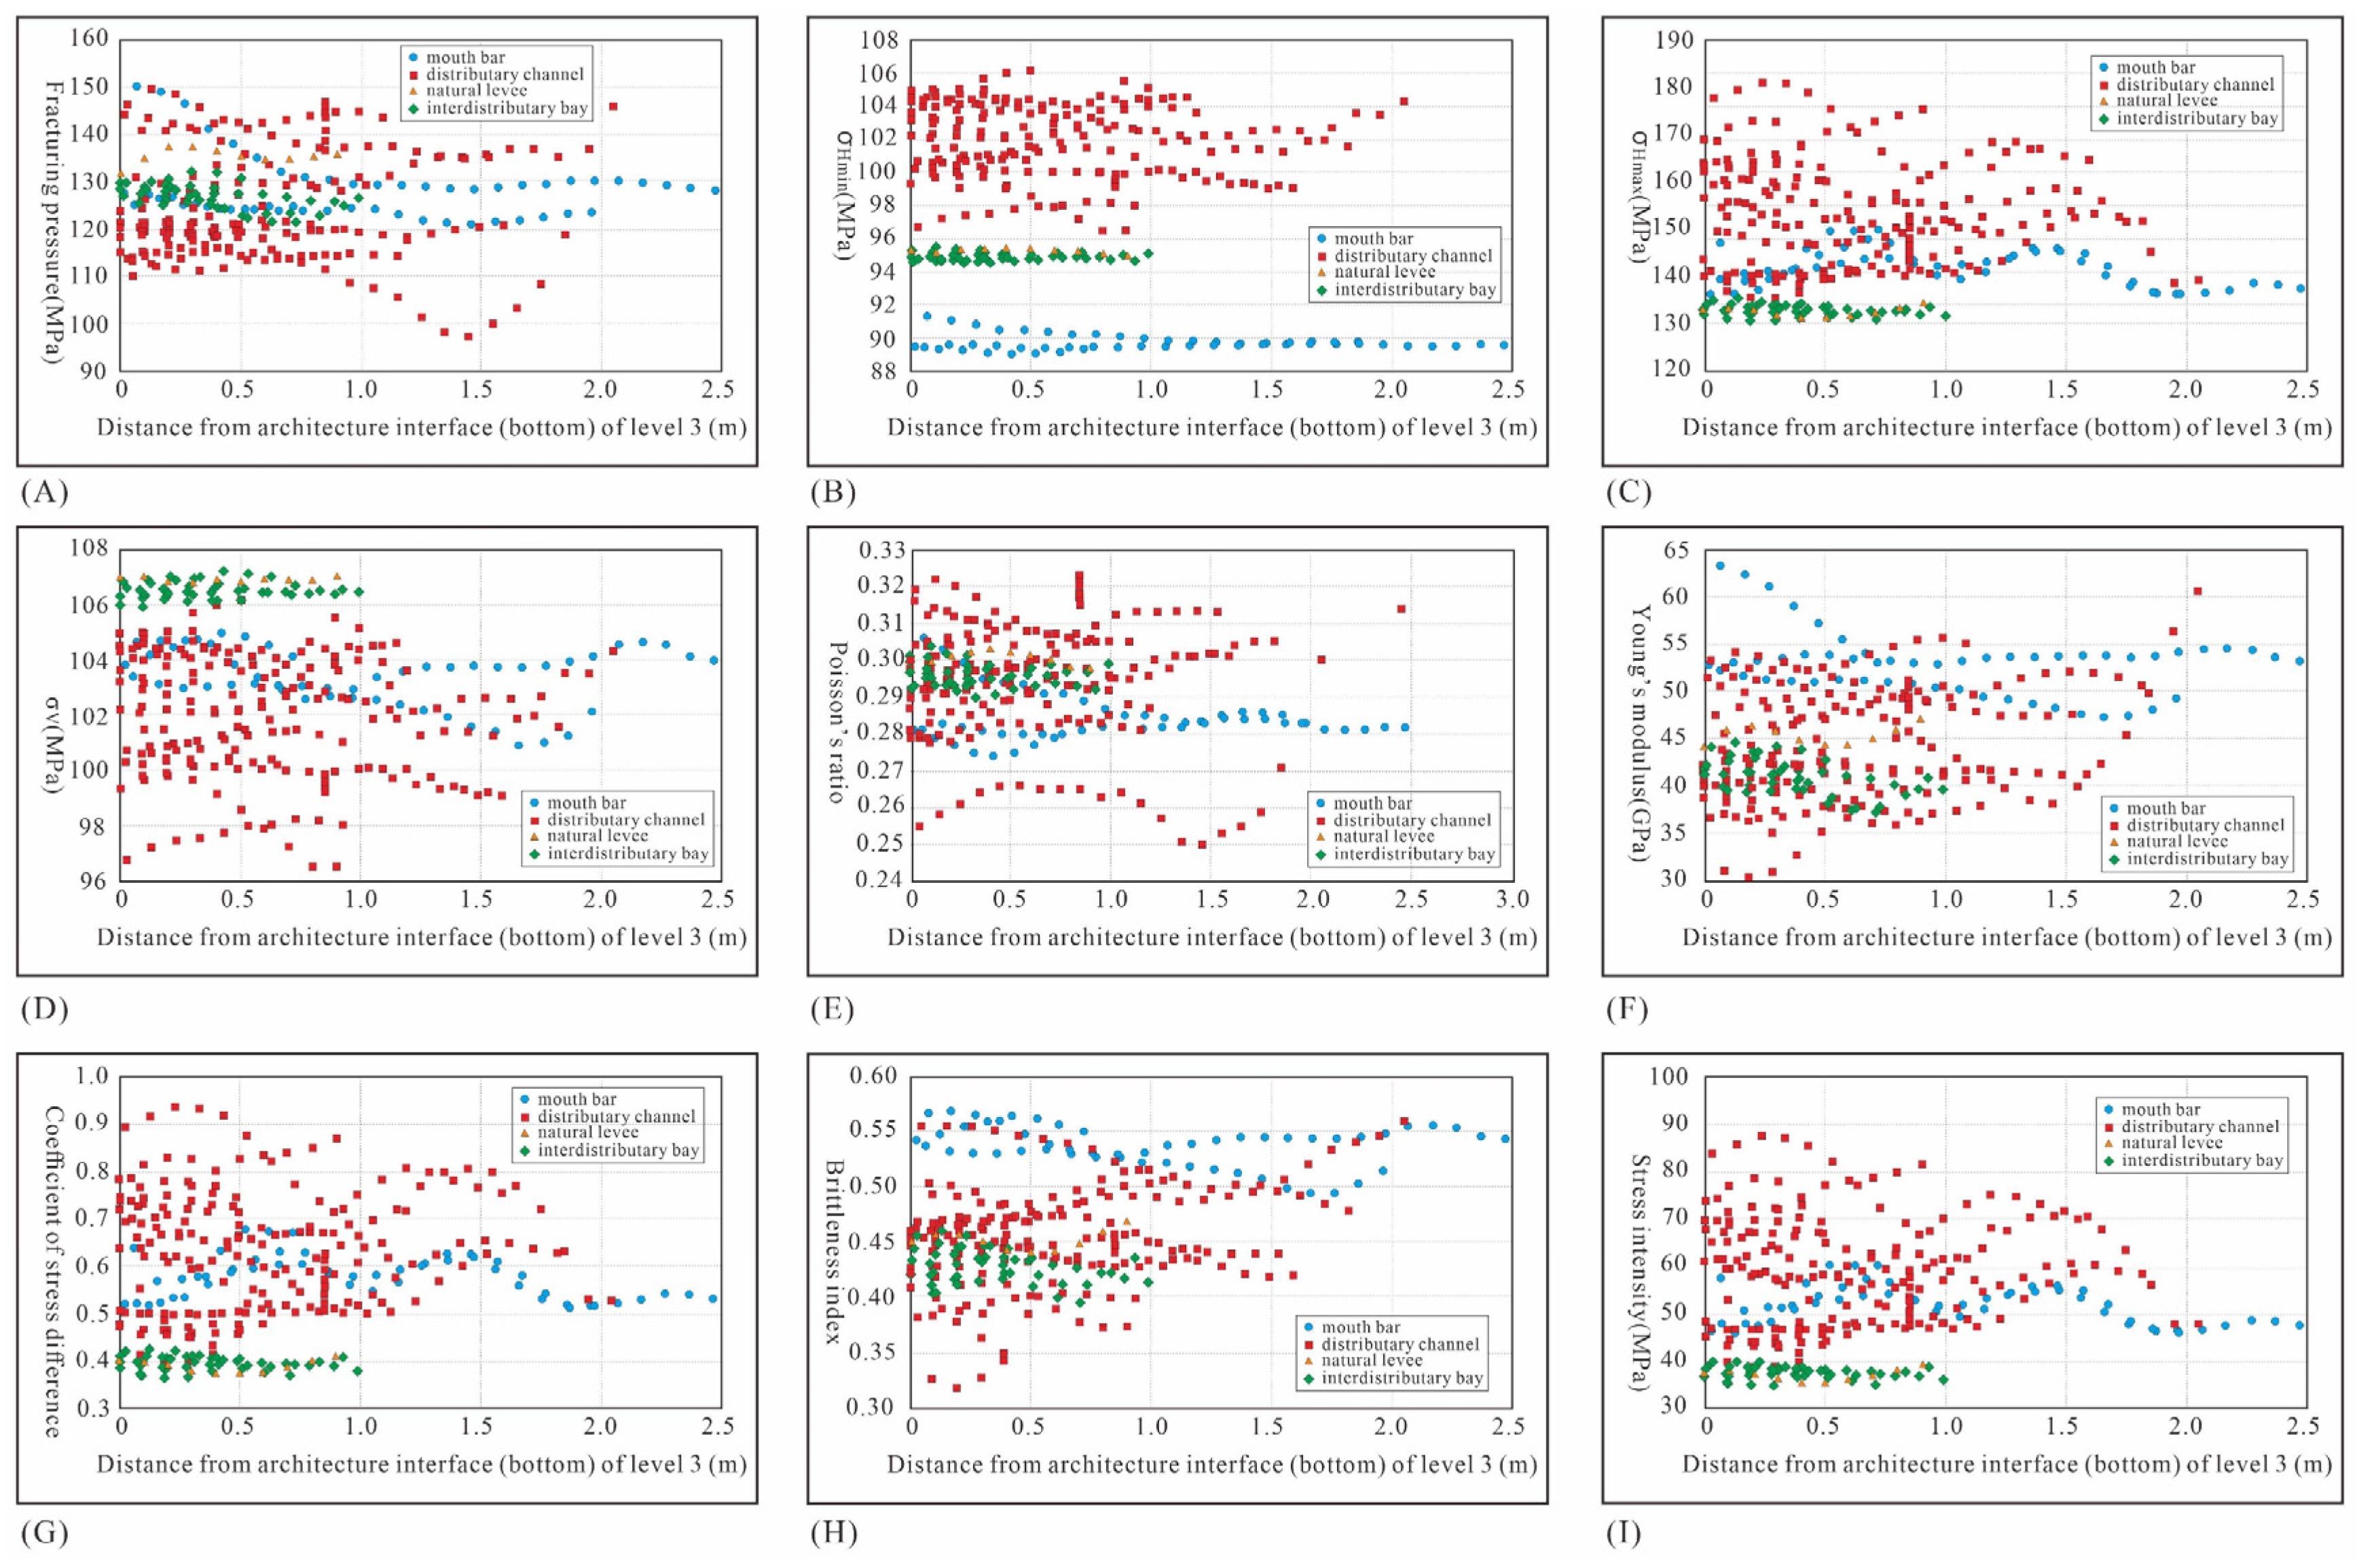
5.2. Geomechanical Response Characteristics on Reservoir Architecture Interface of Level 3

The relationship between fracturing pressure and distance from the level 3 architecture interface (Figure 10A) showed a notable negative correlation. In mouth bars and distributary channels, fracturing pressure initially decreased (0–1.5 m), then increased (1.5–2.0 m) with distance. For interdistributary bays and natural levees, the effective distance influenced by the level 3 interface was 1.0 m. Statistical analysis of horizontal minimum principal stress revealed higher values in distributary channels (96–108 MPa) than in interdistributary bays (94–96 MPa) and natural levees, with mouth bars having the lowest (88–92 MPa) (Figure 10B). Horizontal minimum principal stress showed a weak correlation with distance from the level 3 interface. The relationship between horizontal maximum principal stress and distance (Figure 10C) revealed higher values in distributary channels (135–180 MPa), followed by mouth bars (130–150 MPa), and lower values in interdistributary bays and natural levees (125–135 MPa). Overall, horizontal maximum principal stress showed a negative relationship with distance, indicating two peaks and valleys (0.5 m, 0.8 m, 1.3 m, and 2.0 m) in mouth bars and distributary channels.
When analyzing the relationships among vertical principal stress, Poisson’s ratio, and Young’s modulus with distance from the architecture interface (Figure 10D–F), an overall negative correlation emerged. Vertical principal stress was higher in the interdistributary bay and natural levee (105–108 MPa), contrasting with the lower values in the distributary channel (96–105 MPa) (Figure 10D). Poisson’s ratio displayed a heterogeneous distribution, mainly ranging from 0.25 to 0.33 in the distributary channel, reflecting strong heterogeneity and turbulent hydrodynamics. Conversely, for the interdistributary bay and natural levee, Poisson’s ratio concentrated in the range of 0.285–0.305, indicative of a relatively stable hydrodynamic condition (Figure 10E). Young’s modulus varied, with mouth bars showing higher elasticity (46–65 GPa) compared to a broader range (30–65 GPa) in the distributary channel, suggesting greater heterogeneity and hydrodynamic variability (Figure 10F). Regarding the coefficient of stress difference, brittleness index, and stress intensity (Figure 10G–I), the coefficient mainly ranged from 0.35 to 0.45 in the interdistributary bay and natural levee, suggesting stability. In the mouth bar and distributary channel, distinct peaks and valleys (0.5 m, 1.0 m, 1.4 m, and 2.0 m) indicated two hydrodynamic cycles (Figure 10G). Brittleness index values (0.50–0.60) in mouth bars signified high elasticity. Stress intensity mirrored the coefficient of stress difference, indicating changing hydrodynamics in mouth bars and distributary channels. Overall, horizontal maximum principal stress, Poisson’s ratio, Young’s modulus, coefficient of stress difference, brittleness index, and stress intensity highlighted sedimentary hydrodynamic changes. The effective distance influenced by the level 3 interface was 1.0 m, with distinct peaks and valleys identifying sedimentary hydrodynamic cycles.

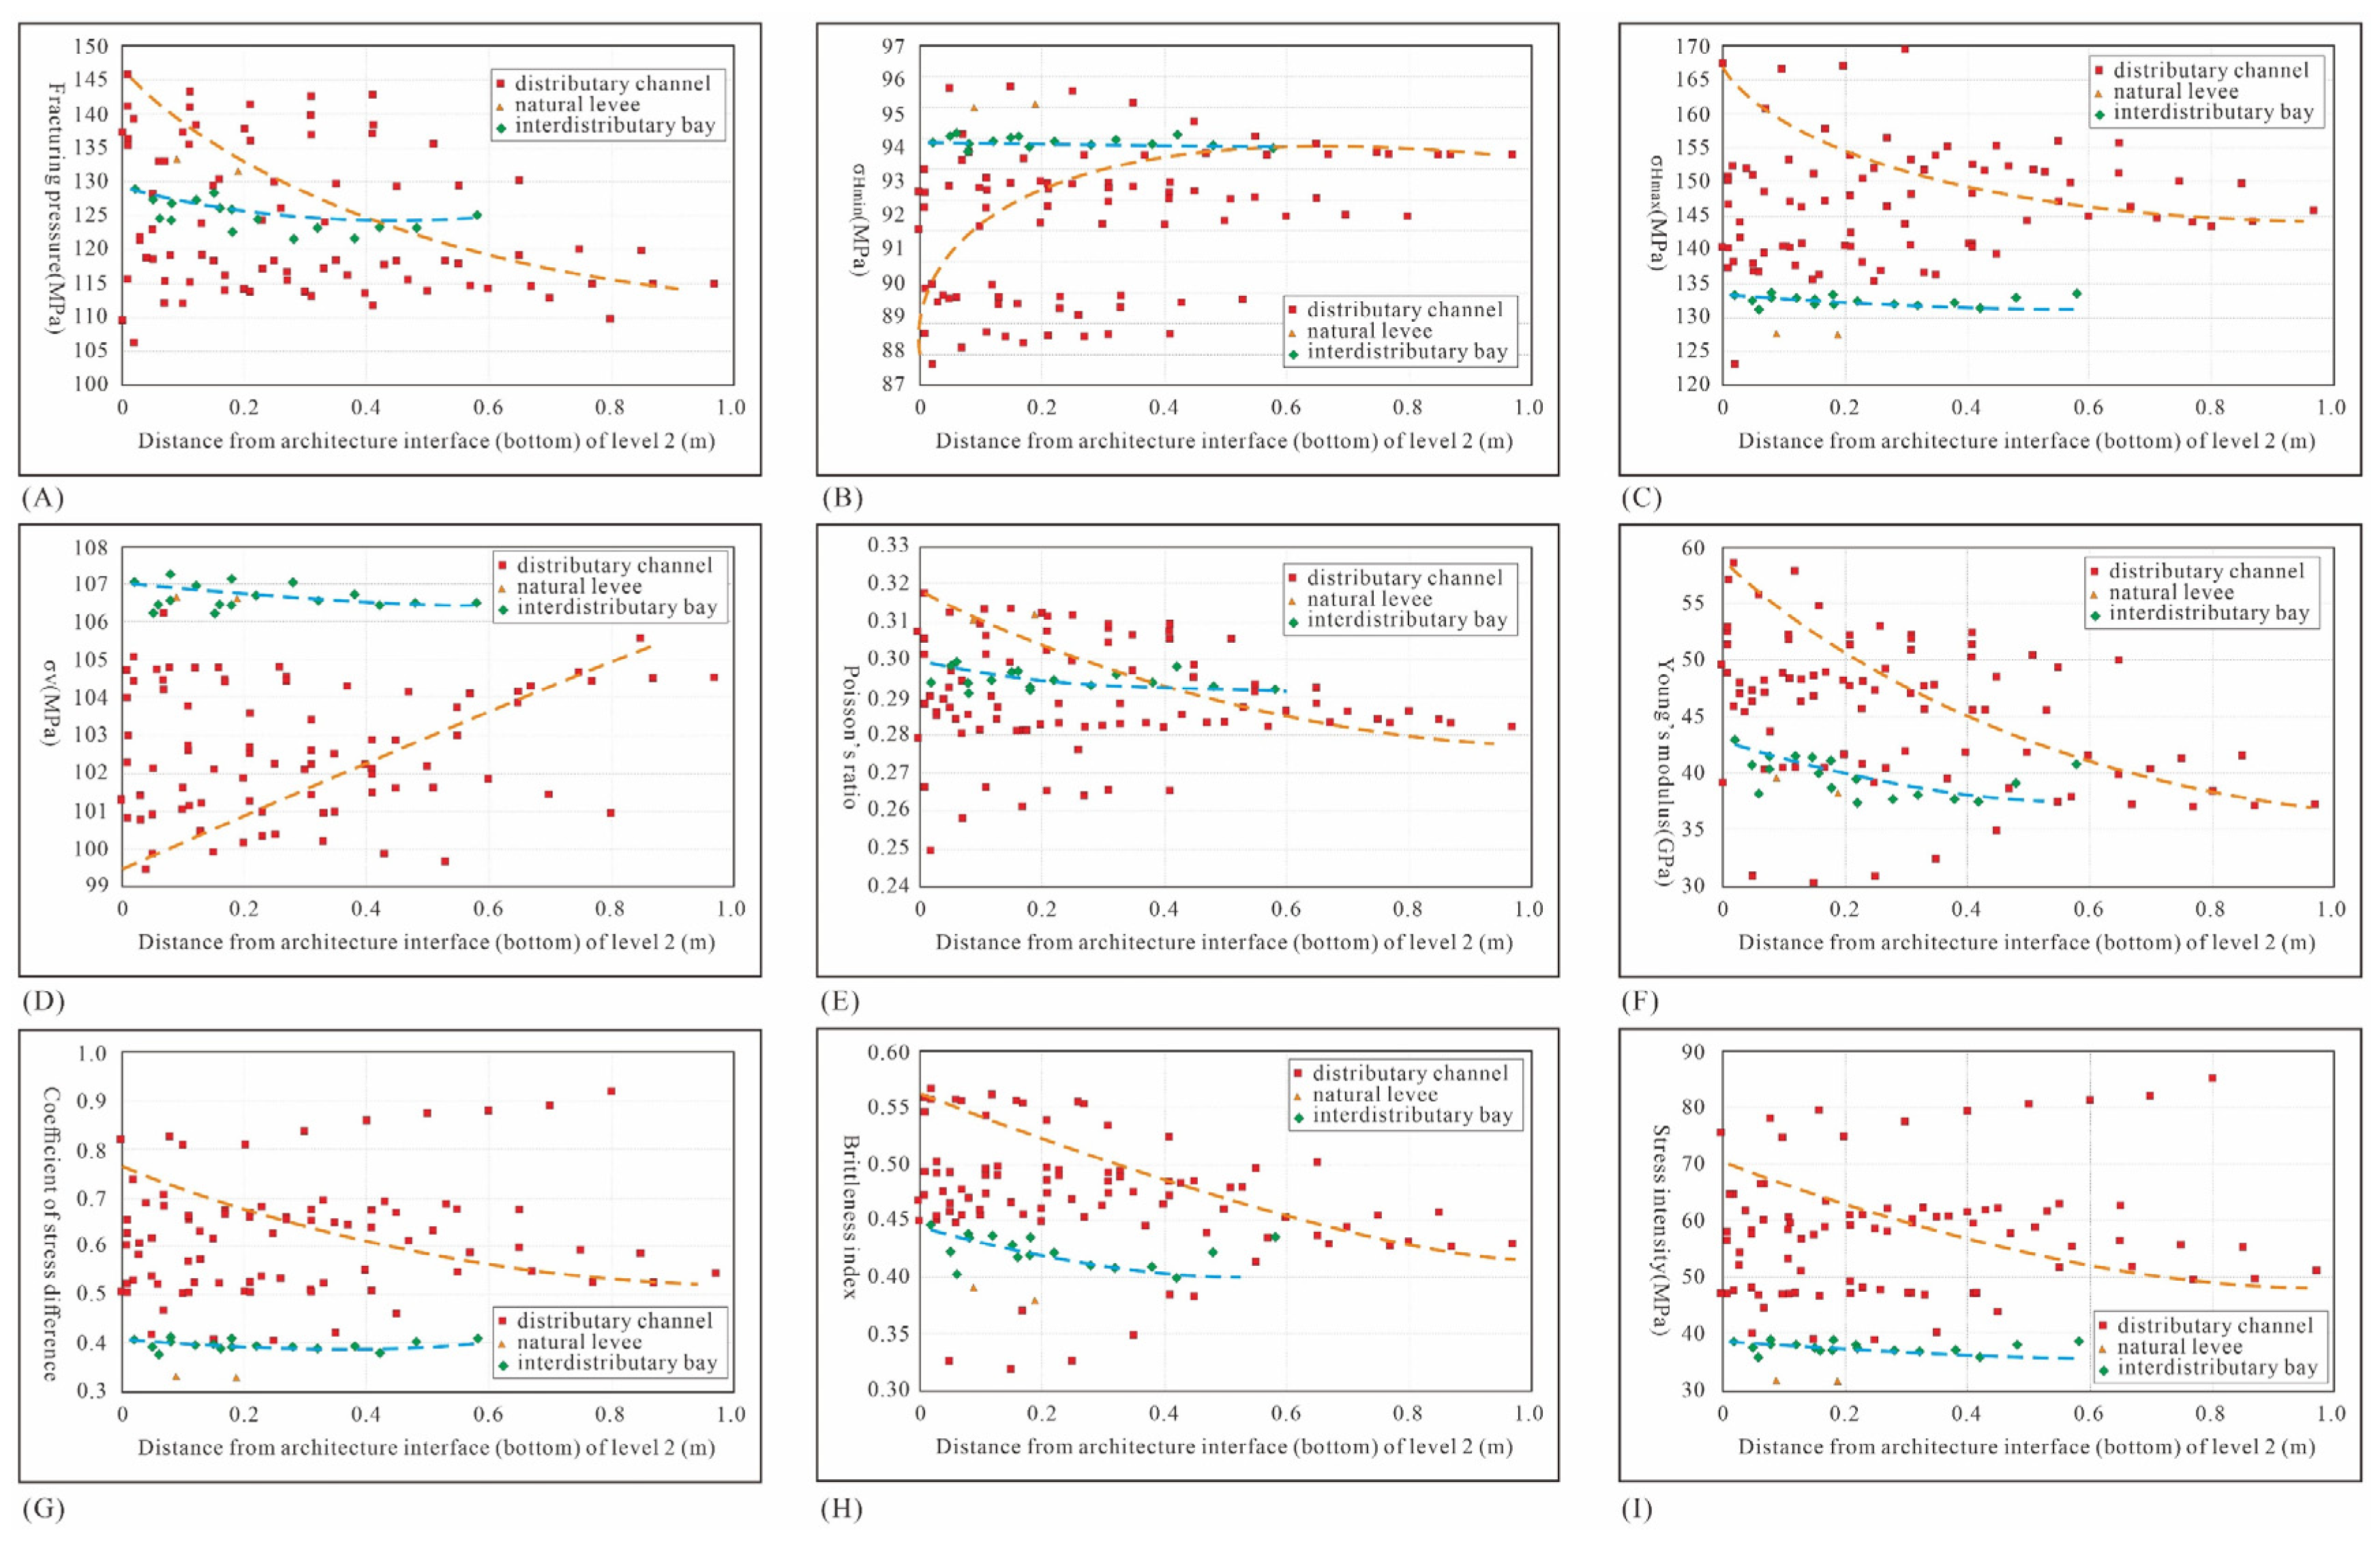
5.3. Geomechanical Response Characteristics on Reservoir Architecture Interface of Level 2

The relationships among fracturing pressure, horizontal minimum principal stress, and horizontal maximum principal stress with distance (Figure 11A–C) showed a weak negative correlation across distributary channels, interdistributary bays, and natural levees. For instance, in the distributary channel microfacies (Figure 11C), as distance from the level 2 interface increased, horizontal maximum principal stress decreased from 170 MPa to 145 MPa. The correlation between vertical principal stress and distance varied with hydrodynamic environments (Figure 11D). Poisson’s ratio displayed a clear negative trend with distance (Figure 11E), primarily ranging between 0.25 and 0.32 in distributary channels, indicating decreasing values with distance and strong heterogeneity. In contrast, during interdistributary bays, Poisson’s ratio was more stable, mainly between 0.28 and 0.30, indicating a relatively consistent hydrodynamic environment. Similarly, Young’s modulus declined from 60 GPa to 35 GPa over 1.0 m in distributary channels, reflecting changing mechanical properties (Figure 11F), while in interdistributary bays, Young’s modulus remained relatively constant at 38–42 GPa, indicating more uniform petrophysical characteristics.
Considering the relationship between the coefficient of stress difference and distance from the architecture interface (Figure 11G), after filtering out anomalies, the coefficient of stress difference was notably higher in distributary channels (0.40–0.80) compared to interdistributary bays (0.35–0.40). The effective distance influenced by the level 2 interface was within 1 m, indicating a stable hydrodynamic condition within a cycle. Analyzing the brittleness index, a clear negative correlation was evident (Figure 11H). As distance increased (0–1.0 m) in distributary channels, the index decreased from 0.60 to 0.45, suggesting greater elasticity. In interdistributary bays, the index ranged mainly between 0.40 and 0.45, reflecting similar petrophysical properties. Examining the stress intensity’s relationship with distance from the level 2 interface (Figure 11I), as distance increased, intensity decreased. In distributary channels, it ranged from 40 to 90 MPa, indicating higher rupture susceptibility, while in interdistributary bays, it was mostly between 35 and 40 MPa. These six key geomechanical parameters (fracturing pressure, horizontal maximum principal stress, Poisson’s ratio, Young’s modulus, brittleness index, and stress intensity) showed a strong relationship with distance from the level 2 interface. The effective distance influenced by the interface in distributary channels was within 1 m, while in interdistributary bays, it was 0.6 m. Generally, as distance increased from the level 2 interface, these parameters decreased.

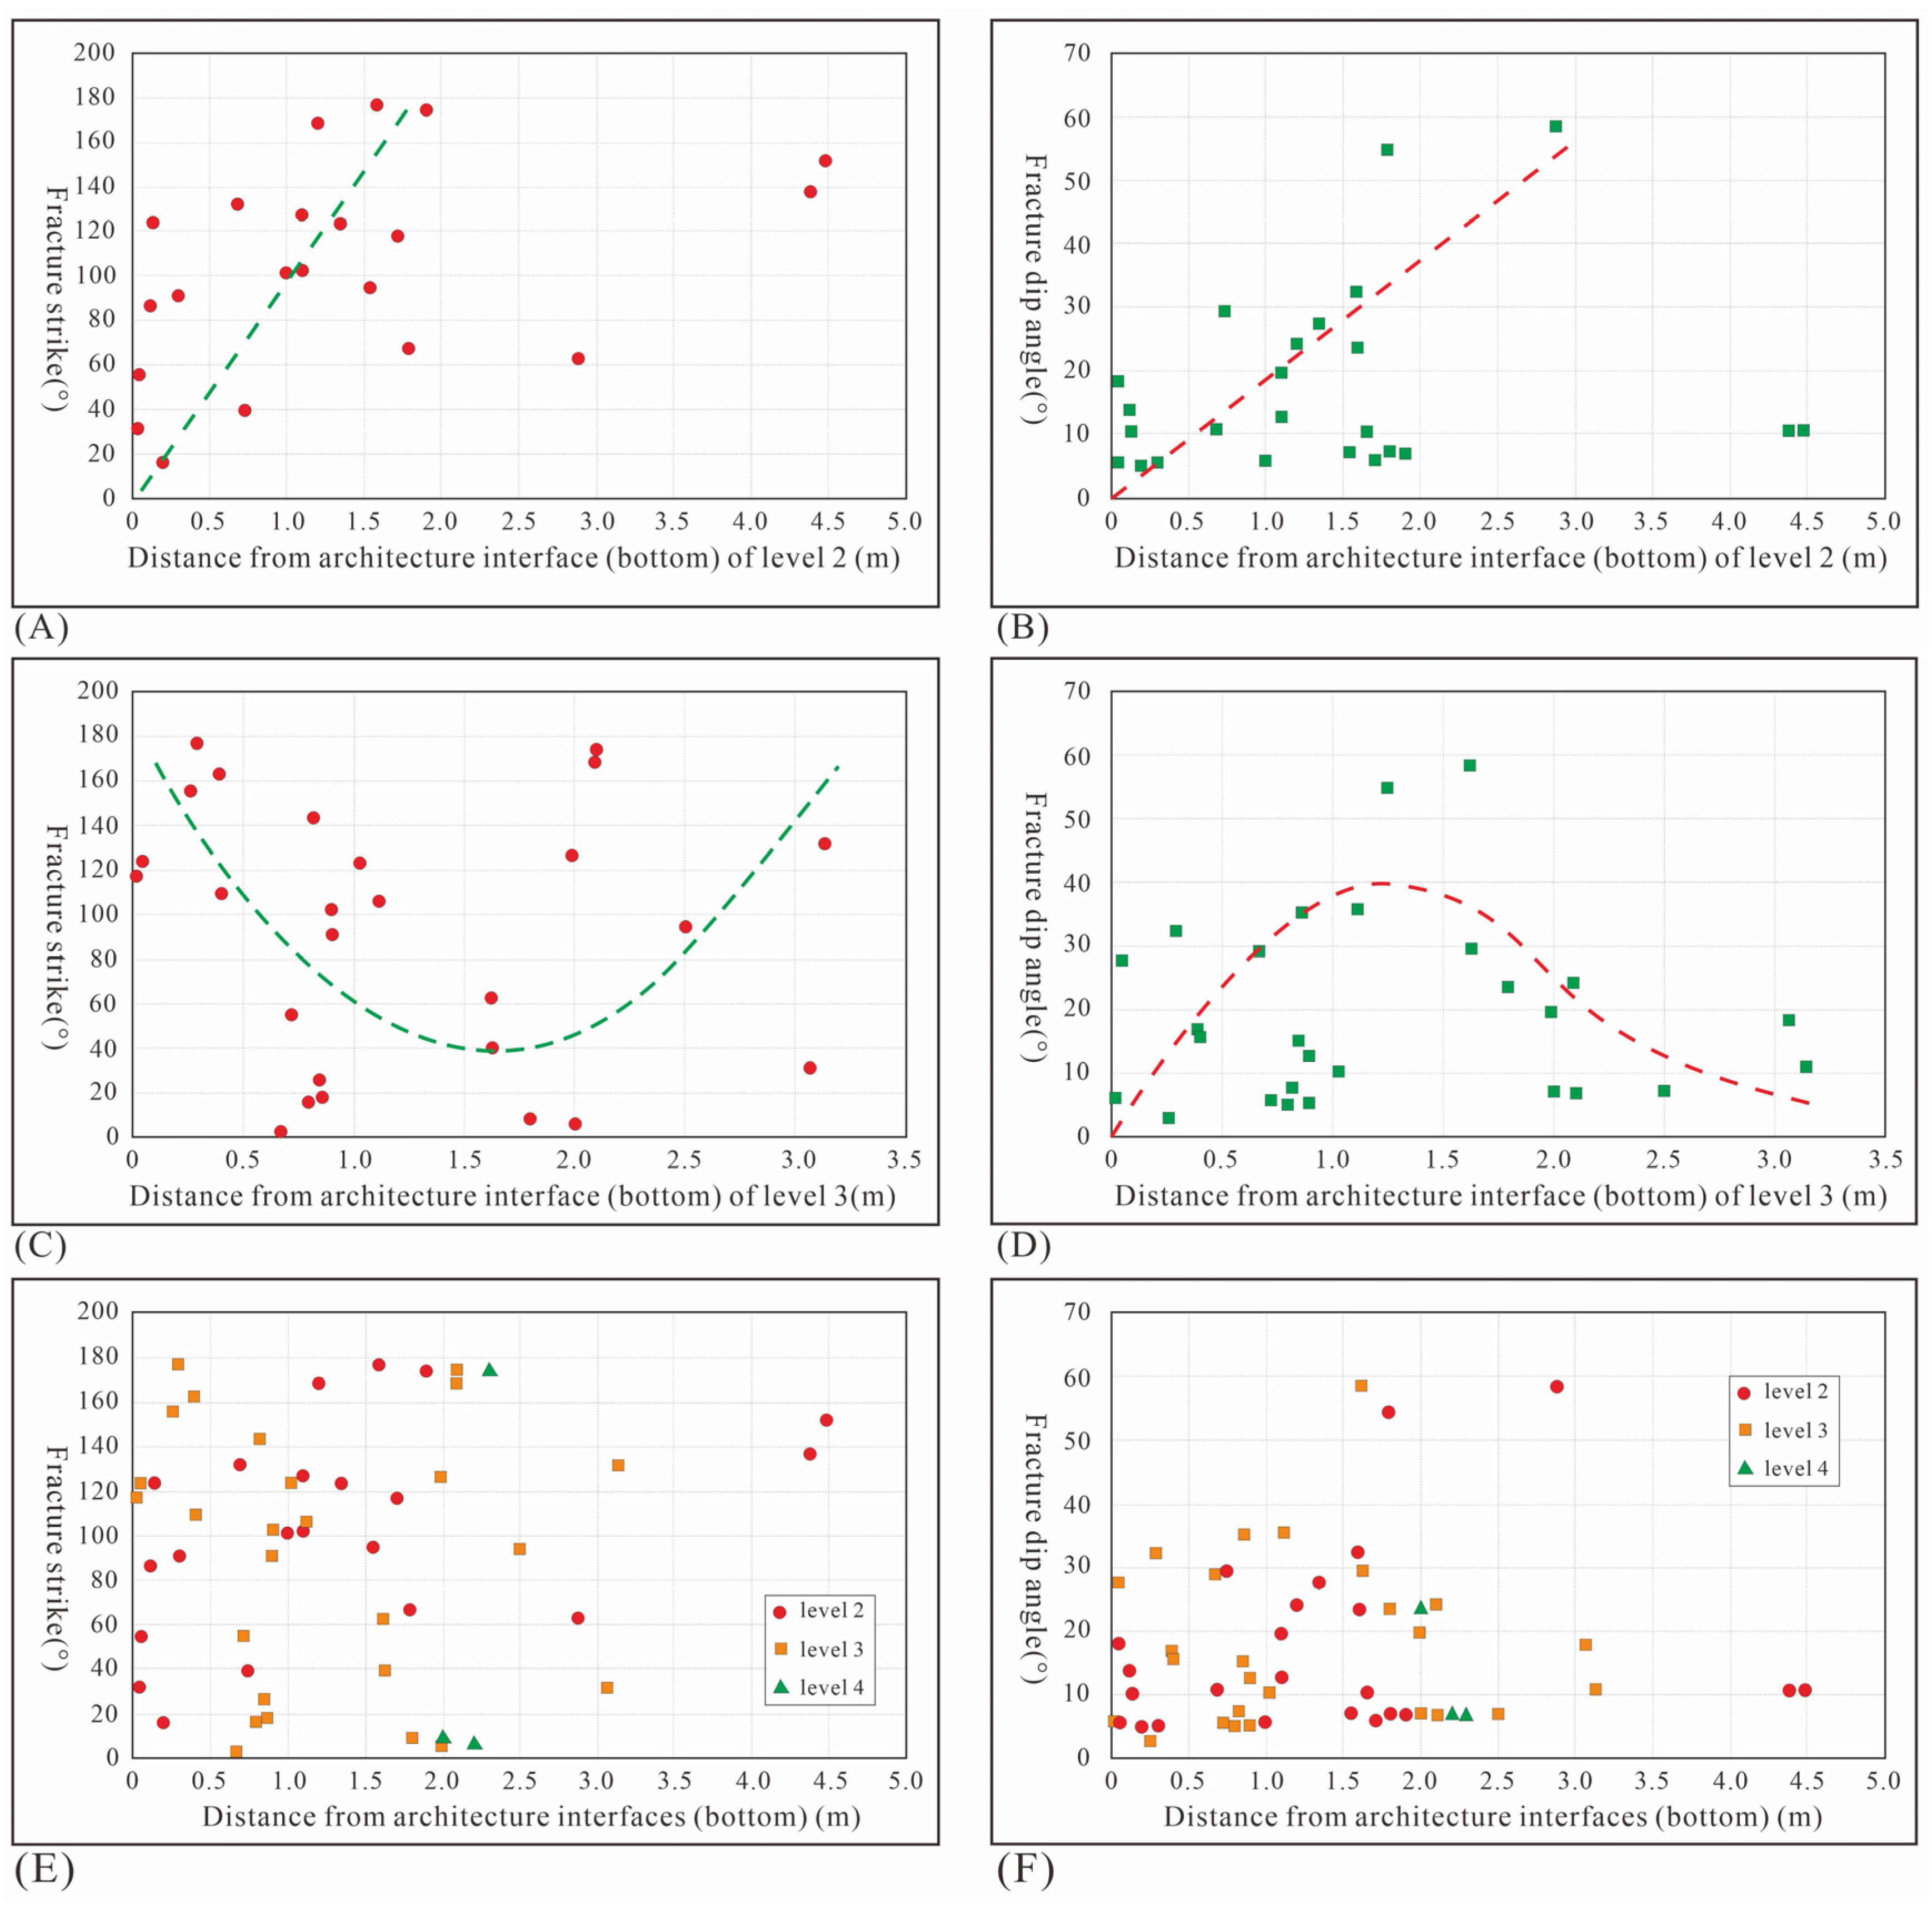
5.4. Response Characteristics of Fracture Parameters on Various Architecture Interfaces

Similarly, to analyze fracture parameter responses across various architecture interfaces, we focused on fracture strike and dip angle (Figure 12). However, given the unique complexity of structural fractures and reservoir architecture, data points were limited. Examining the relationships between fracture strike, dip angle, and distance from the architecture interface (Figure 12A,B), we found the effective distance influenced by the level 2 interface was under 2.0 m. Fracture strike showed a strong positive correlation with distance, while dip angle exhibited a weaker positive correlation. As distance from the level 2 reservoir interface increased, strike ranged from 10 to 180°, and dip angle from 5 to 60°. Analyzing the statistical results of the fracture strike’s relationship with distance from the level 2 interface (Figure 12C), we observed an initial decrease (0–1.7 m), followed by an increase (1.7–3.2 m) to 40–140°. Similarly, examining the fracture dip angle’s relationship with the level 2 interface (Figure 12D), we noted an initial rise (0–1.3 m), succeeded by a gradual decline (1.3–3.2 m). The effective distance controlled by the level 3 interface was 3.2 m, indicating a hydrodynamic shift around 1.5 m (±0.2 m).
Considering the relationships among fracture strike, dip angle, and different reservoir architecture interfaces (Figure 12E,F), the effective distance influenced by the level 2 interface was 2.0 m. Points near this interface showed lower strike values (0–40°) and dip angles (0–10°). Likewise, the effective distance controlled by the level 3 interface was 3.2 m, indicating a significant change around 1.5 m. Near this interface, points displayed higher strike values (120–180°) and lower dip angles (0–10°). At approximately 1.5 m from the level 3 interface, fractures showed medium strike values (40–80°) and dip angles (20–50°). Due to limited level 4 interface data, understanding fracture parameter responses was challenging. Strong sedimentary hydrodynamic conditions (between two level 3 interfaces) favored fractures with higher strike values and lower dip angles. Conversely, weak sedimentary hydrodynamics (between two level 2 interfaces) favored fractures with lower to medium strike values and dip angles.

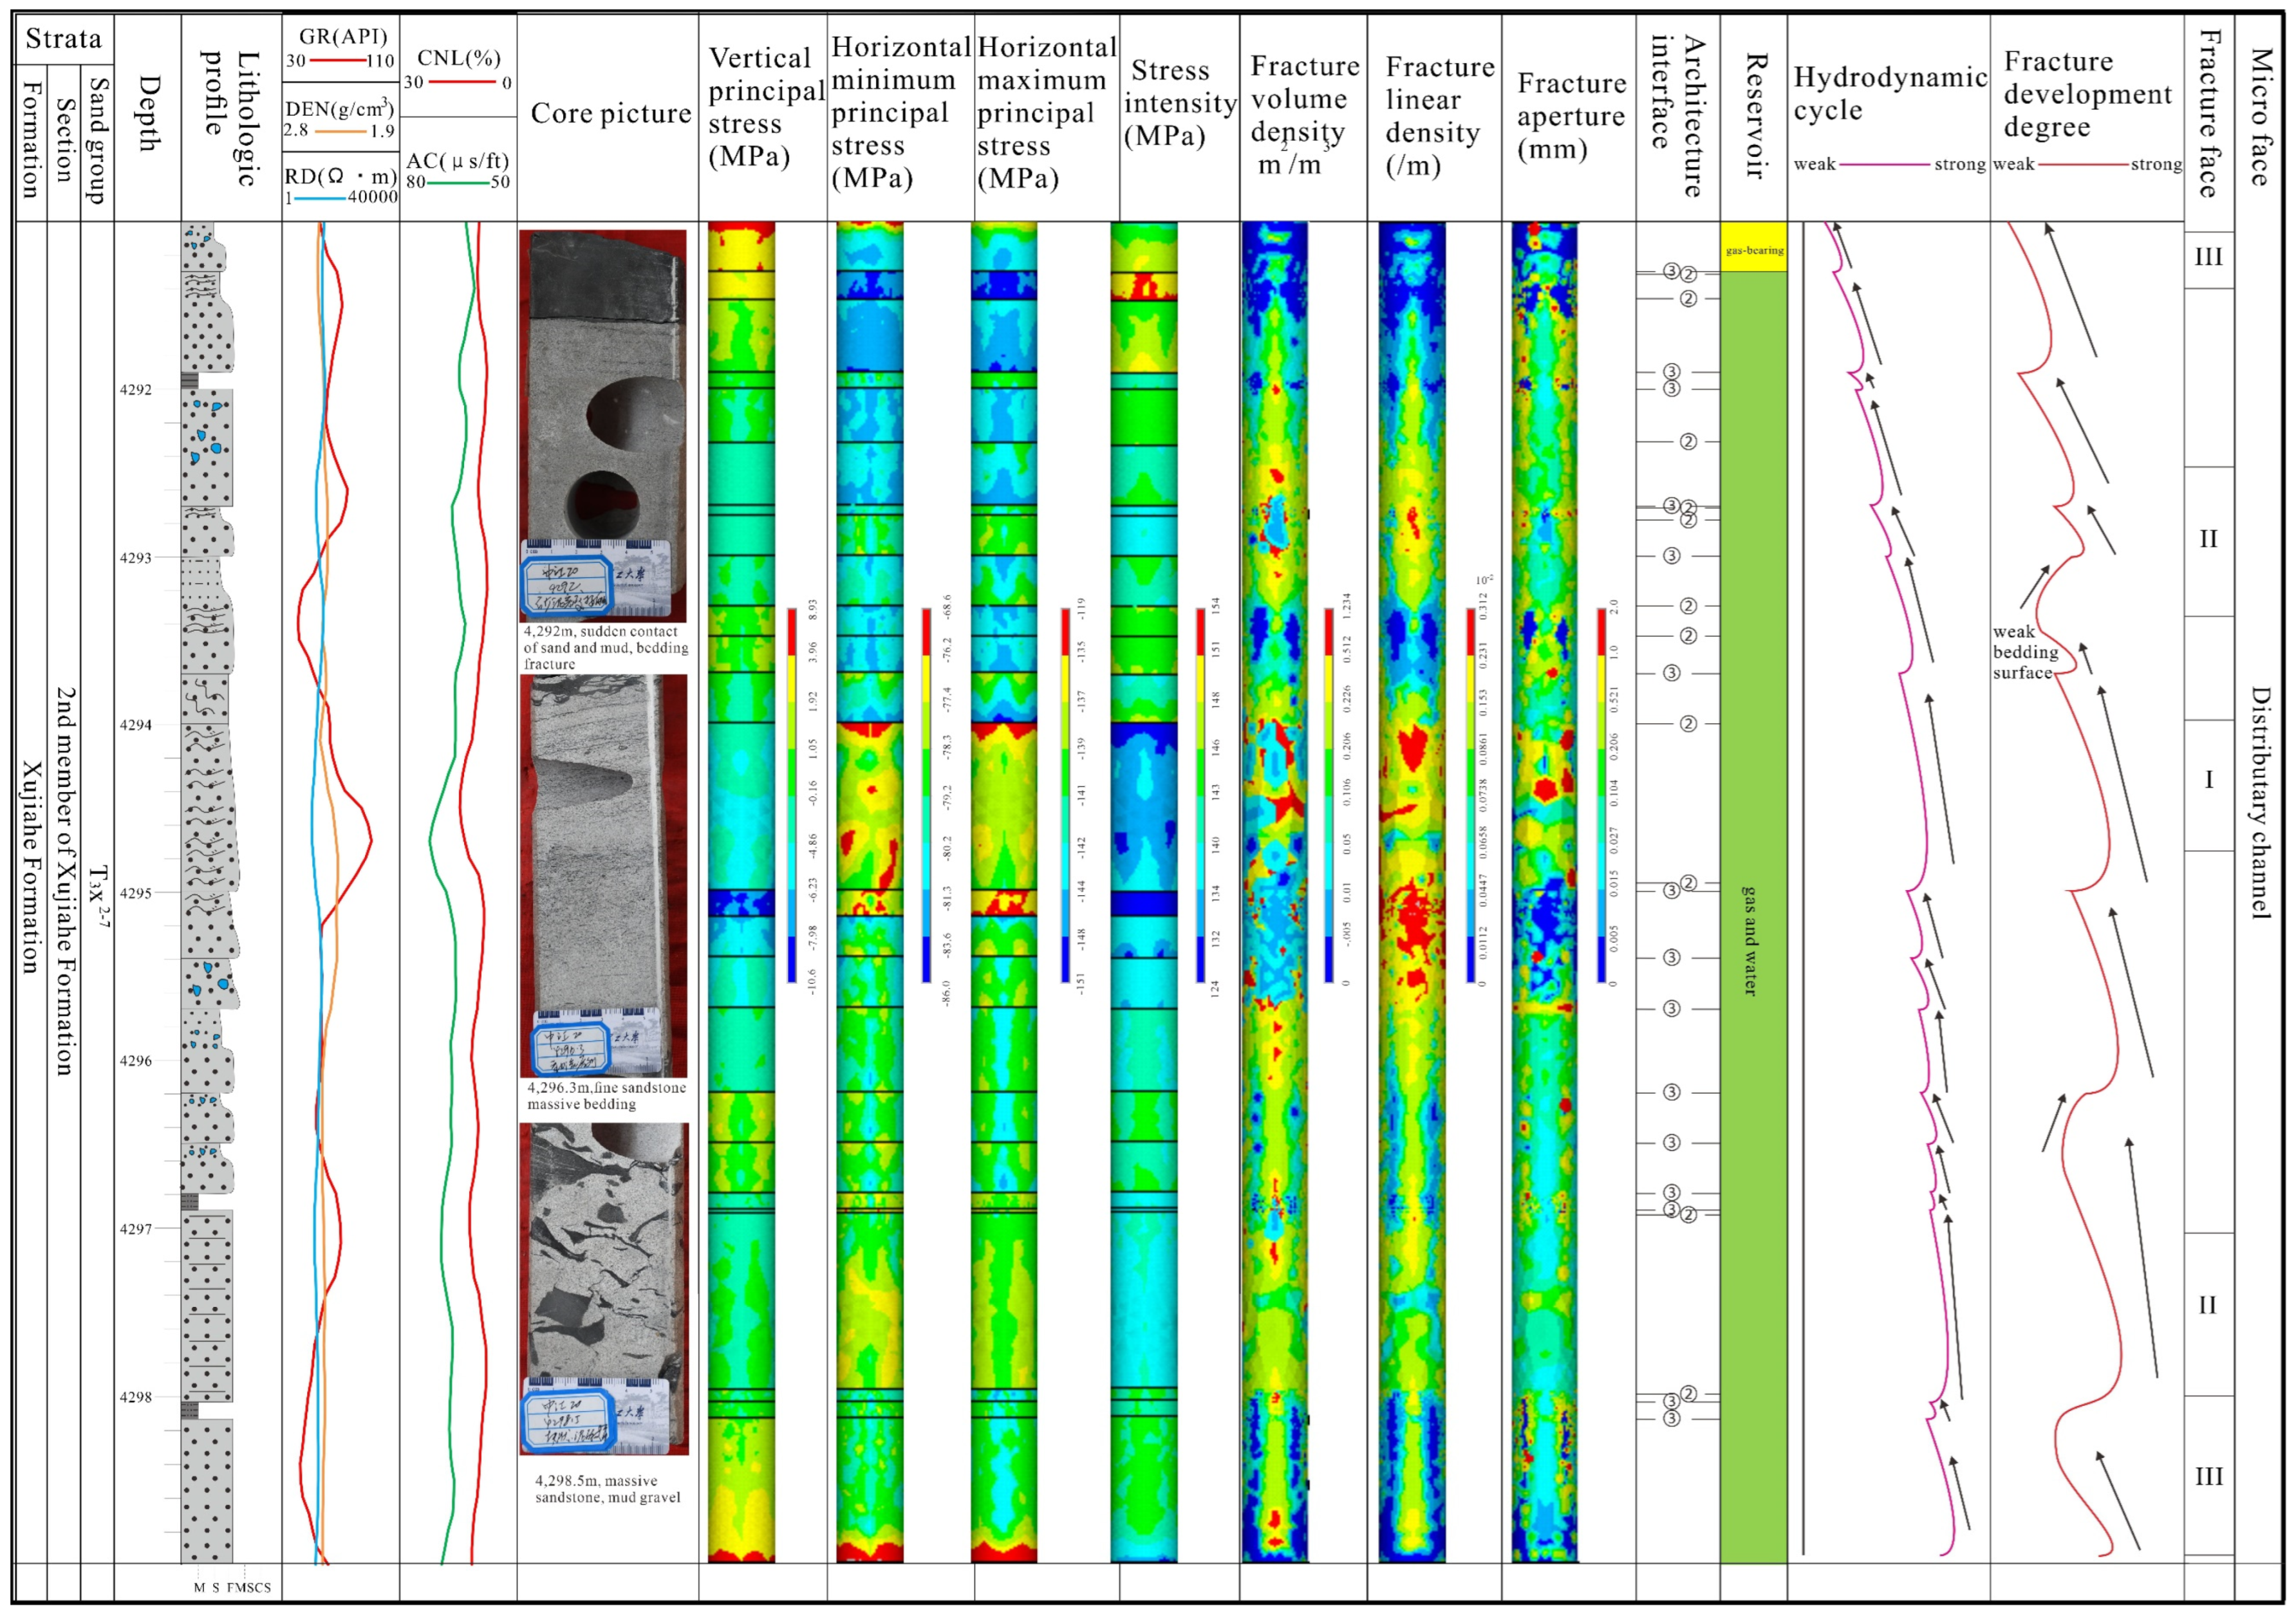
5.5. The Coupling Simulation among In Situ Stress, Fracture’s Parameter, and Reservoir Architecture Interfaces

To investigate the interplay between in situ stress, fracture parameters, and sedimentary hydrodynamics, we conducted finite element simulations and fracture calculations in the zj 20 well, focusing on depths between 4067.83 and 4083.83 m and between 4291 and 4299 m. The coupling simulation results (Figure 13) illustrated that reservoir architecture interfaces and lithologic combinations significantly influenced in situ stress distribution. It is worth noting that in our ANSYS simulations, negative values indicated compressive environments, while positive values indicated extensional stress, a departure from conventional structural geology but consistent for analysis purposes. Vertical principal stress magnitude correlated strongly with rock density and burial depth. Horizontal minimum principal stress ranged from 67.2 to 90.7 MPa, lower (67.2–81.7 MPa) in strong hydrodynamic conditions (4081.5–4083.83 m) and higher (88.9–99.7 MPa) in weak hydrodynamic conditions (4078.5–4079.3 m). Similarly, horizontal maximum principal stress ranged from 121 to 169 MPa, lower (121–142 MPa) in strong hydrodynamic conditions and higher (153–169 MPa) in weak hydrodynamic conditions. Stress intensity varied between 121 and 165 MPa, with higher values (145–165 MPa) indicating strong hydrodynamic environments around 4278.5 to 4279.3 m. Fracture parameters like volume density, linear density, and aperture closely correlated with sedimentary hydrodynamics. In distributary channel microfacies, as hydrodynamics transitioned from strong to weak, fracture development weakened accordingly. Mouth bar microfacies showed consistent fracture development characteristics with changing hydrodynamic conditions (Figure 13).
Based on simulated data from a typical well in zj 20 (4291–4299 m), the horizontal minimum principal stress ranged from 68.6 to 86.0 MPa, indicating lower values (68.6–78.3 MPa) in strong hydrodynamic conditions (4294–4295 m) and higher values (81.3–86.0 MPa) in weak hydrodynamic conditions (4291.3–4291.4 m). Similarly, the horizontal maximum principal stress ranged from 119 to 151 MPa, with lower values (119–139 MPa) in strong hydrodynamic conditions and higher values (144–151 MPa) in weak hydrodynamic conditions. Stress intensity mirrored these trends, ranging between 124 and 154 MPa, aligning with changing hydrodynamic conditions. Fracture parameters such as volume density, linear density, and aperture were notably influenced by sedimentary hydrodynamics. In the distributary channel microfacies, fracture development consistently reflected changes in the hydrodynamic environment (Figure 14).
Overall, coupling in situ stress, fracture distribution, reservoir architecture interfaces, and gas production delineated three distinct fracture levels: I, II, and III (Figure 13 and Figure 14). In level I, the reservoir exhibited high fracture linear density (0.1031–0.356 × 10⁻²/m), volume density (0.226–1.134 m2/m3), aperture (0.2–1.5 mm), and stress intensity (135–150 MPa). Total hydrocarbon content was high, indicating good porosity and permeability (gas-bearing layer). For level II, fracture linear density (0.0177–0.1235 × 10⁻²/m) and volume density (0.106–0.512 m2/m3) were medium, with high aperture (0.2–1.5 mm) and stress intensity (135–160 MPa). Total hydrocarbon content was moderate, indicating poor porosity and permeability (poor gas layer). Level III showed low fracture linear density (0–0.1031 × 10⁻²/m), volume density (0–0.106 m2/m3), and aperture (0–0.1 mm), with stress intensity between 140 and 165 MPa. Total hydrocarbon content was moderate, suggesting medium porosity and permeability (gas layer).

6. Results and Conclusions

To explore how different sedimentary hydrodynamic cycles affect deep tight sandstone, we conducted core observations, thin section analyses, and log calculations to assess parameters like Young’s modulus, Poisson’s ratio, brittleness index, and in situ stress. Finite element numerical simulations were then employed to determine in situ stress and fracture parameters.
(1)
Young’s modulus ranged from 20 to 55 GPa, with lower values seen in specific sand groups. Poisson’s ratio was mainly between 0.28 and 0.34, with higher values observed in certain sand groups. The brittleness index varied from 0.24 to 0.53, indicating different elasticity and plasticity levels.
(2)
Effective distances controlled by level 4 architecture interfaces varied, affecting sedimentary hydrodynamic environments differently. Peaks and valleys shifted in geomechanical responses corresponded to changes in hydrodynamic cycles. Distances influenced by different architecture interfaces ranged from 0.6 to 2.5 m, highlighting varied environmental impacts. The Young’s modulus, Poisson’s ratio, coefficient of stress difference, brittle index, and stress intensity were key parameters in the sedimentary hydrodynamic environment.
(3)
Fracture characteristics were influenced by architecture interfaces, with distinct patterns seen at different levels. Fracture strike and dip angles varied based on proximity to specific interfaces, indicating strong or weak sedimentary hydrodynamic conditions. The loading stress, Young’s modulus, and Poisson’s ratio played significant roles for fracture dip and strike.
(4)
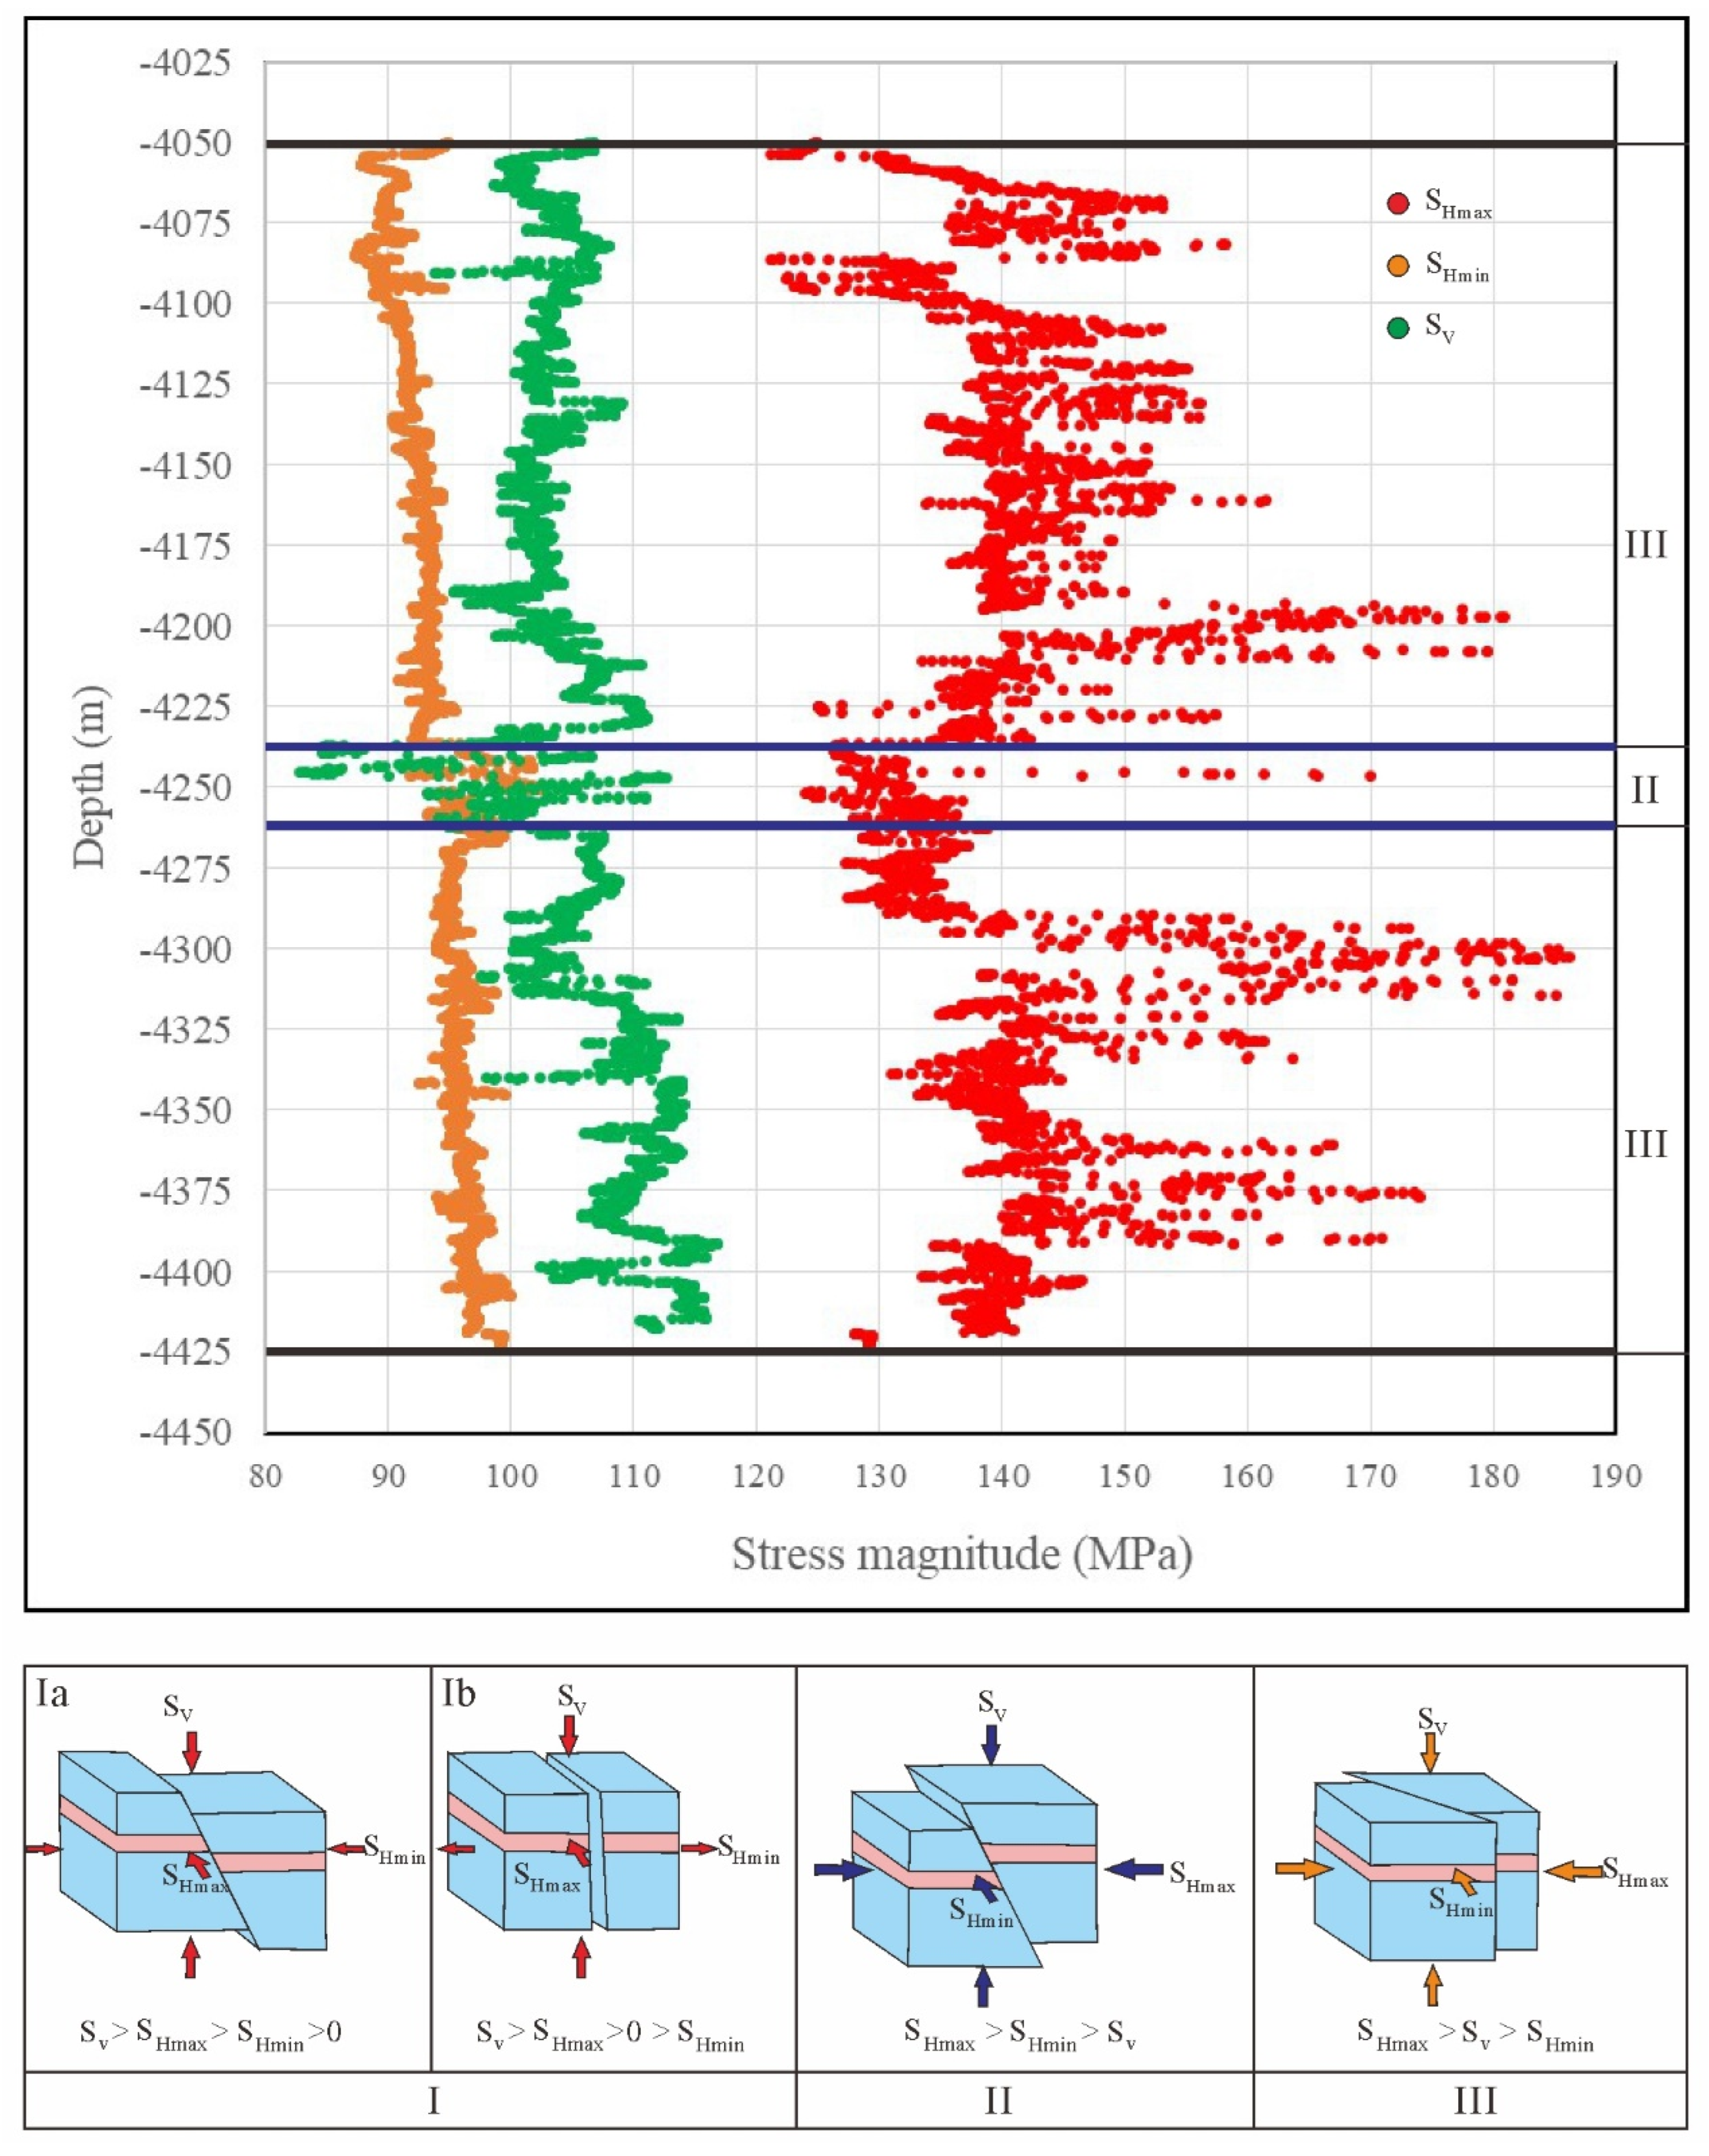
Three fracture face levels (I, II, III) were identified, each associated with different reservoir characteristics. Level I showed high fracture density and stress intensity, indicating good gas-bearing properties. Level II exhibited moderate fracture characteristics, while Level III displayed lower density and stress intensity, suggesting moderate gas potential.
This research provides new theories and methods for the geomechanical response of sedimentary hydrodynamic cycles, promoting research and technological innovation in the field of geology. This contributes to the advancement of disciplines related to geology, providing more scientific and technological support for sustainable development. In-depth research on the geomechanical response characteristics of different sedimentary hydrodynamic cycles can provide a scientific basis and technological support for resource development, environmental protection, and infrastructure development, promoting the development of Earth sciences and facilitating the realization of sustainable development.

Author Contributions

Conceptualization, Q.R.; Methodology, L.C., M.L. and X.W.; Software, Q.R. and M.L.; Investigation, L.L.; Data curation, L.L.; Writing—original draft, Q.R.; Writing—review & editing, Q.R.; Supervision, J.F. All authors have read and agreed to the published version of the manuscript.

Funding

This research was supported by the Major Scientific and Technological Projects of CNPC under grant ZD2019-183-006 and the National Natural Science Foundation of China (42072234).

Informed Consent Statement

Informed consent was obtained from all subjects involved in the study.

Data Availability Statement

Data are contained within the article.

Acknowledgments

The authors would like to express their gratitude to all the individuals who contributed to data collection, testing, and analysis. Special thanks are extended to the anonymous reviewers whose insightful comments have greatly contributed to improving the quality of this manuscript.

Conflicts of Interest

The authors declare no conflict of interest.

References

  1. Jia, C.; Zheng, M.; Zhang, Y. Unconventional hydrocarbon resources in China and the prospect of exploration and development. Pet. Explor. Dev. 2012, 39, 129–136. [Google Scholar] [CrossRef]
  2. Zou, C.; Yang, Z.; Zhu, R.; Zhang, G.; Hou, L.; Wu, S.; Tao, S.; Yuan, X.; Dong, D.; Wang, Y.; et al. Progress in China’s unconventional oil & gas exploration and development and theoretical technologies. Acta Geol. Sin.-Engl. Ed. 2015, 89, 938–971. [Google Scholar]
  3. Guo, Y.; Pang, X.; Chen, D.; Jiang, F.; Tang, G. Progress of research on hydrocarbon accumulation of tight sand gas and several issues for concerns. Oil Gas Geol. 2013, 34, 717–724. [Google Scholar]
  4. Yang, H.; Zhang, R.; Yang, X.; Wang, K.; Wang, J.; Tang, Y.; Zhou, L. Characteristics and reservoir improvement effect of structural fracture in ultra-deep tight sandstone reservoir: A case study of Keshen Gasfield, Kuqa Depression, Tarim Basin. Nat. Gas Geosci. 2018, 29, 942–950. [Google Scholar]
  5. Olson, J.E.; Laubach, S.E.; Lander, R.H. Natural fracture characterization in tight gas sandstones: Integrating mechanics and diagenesis. AAPG Bull. 2009, 93, 1535–1549. [Google Scholar] [CrossRef]
  6. Ding, W.; Yin, S.; Wang, X.; Zhang, M.; Cao, X.; Liu, J. Progress in tight sandstone reservoir fractures research. Adv. Earth Sci. 2015, 30, 737–750. [Google Scholar]
  7. He, D.; Li, D.; Tong, X.; Wu, X. Integrated 3D hydrocarbon exploration in sedimentary basins of China. Oil Gas Geol. 2021, 42, 265–284. [Google Scholar]
  8. Li, W.; Liu, Z.; Hu, Z.; Jin, W.; Li, M.; Liu, J.; Xu, S.; Ma, A. Characteristics of and main factors controlling the tight sandstone reservoir fractures in the 2nd member of Xujiahe Formation in Xinchang area, Western Sichuan Depression, Sichuan Basin. Oil Gas Geol. 2021, 42, 884–897. [Google Scholar]
  9. Del Greco, O.; Ferrero, A.M.; Oggeri, C. Experimental and Analytical Interpretation of the Behaviour of Laboratory Tests on Composite Specimens. Int. J. Rock Mech. Min. Sci. 1993, 30, 1539–1543. [Google Scholar] [CrossRef]
  10. Gale, J.F.W.; Feed, R.M.; Holder, J. Natural fractures in the Barnett shale and their importance for hydraulic fracture treatments. AAPG Bull. 2007, 91, 603–622. [Google Scholar] [CrossRef]
  11. Dai, J.; Ni, Y.; Wu, X. Tight gas in China and its significance in exploration and exploitation. Pet. Explor. Dev. 2012, 39, 277–284. [Google Scholar] [CrossRef]
  12. Laubach, S.E.; Lander, R.H.; Criscenti, L.J.; Anovitz, L.M.; Urai, J.L.; Pollyea, R.M.; Hooker, J.N.; Narr, W.; Evans, M.A.; Kerisit, S.N.; et al. The role of chemistry in fracture pattern development and opportunities to advance interpretations of geological materials. Rev. Geophys. 2019, 57, 1065–1111. [Google Scholar] [CrossRef]
  13. Feng, J.; Zhao, L.; Wang, Y. Controlling factors for productivity of ultra-deep tight reservoirs in Keshen gas field, Kuqa depression. Acta Pet. Sin. 2020, 41, 478. [Google Scholar]
  14. Zhao, Z.; Tang, D.; Wang, X.; Chen, S. Discussion on main controlling factors of natural gas enrichment and high yield in tight sandstone gas reservoirs: Case study of Xujiahe Formation in Sichuan Basin. Nat. Gas Geosci. 2019, 30, 963–972. [Google Scholar]
  15. Long, S.; Cheng, Z.; Xu, H.; Chen, Q. Exploration domains and technological breakthrough directions of natural gas in SINOPEC exploratory areas, Sichuan Basin. Nat. Gas Geosci. 2020, 31, 1195–1203. [Google Scholar] [CrossRef]
  16. Zheng, H.; Liu, Z.; Xu, S.; Liu, Z.; Liu, J.; Huang, Z.; Huang, Y.; Shi, Z.; Wu, Q.; Fan, L.; et al. Progress and key research direction of tight gas exploration and development in Xujiahe Formation, Sinopec exploration areas, Sichuan Basin. Oil Gas Geol. 2021, 42, 765–783. [Google Scholar]
  17. Nelson, R.A. Geologic Analysis of Naturally Fractured Reservoirs; Gulf Publish Company: Houston, TX, USA, 1985. [Google Scholar]
  18. Gale, J.F.W.; Lander, R.H.; Reed, R.M.; Laubach, S.E. Modeling fractur porosity evolution in dolostone. J. Struct. Geol. 2010, 32, 1201–1211. [Google Scholar] [CrossRef]
  19. Ju, W.; You, Y.; Feng, S.; Xu, H.; Zhang, X.; Wang, S. Characteristics and genesis of bedding-parallel fractures in tight sandstone reservoirs of Chang 7 oil layer, Ordos Basin. Oil Gas Geol. 2020, 41, 596–605. [Google Scholar]
  20. Zeng, L.; Lyu, W.; Xu, X.; Tian, H.; Lu, S.; Zhang, M. Development characteristics, formation mechanism and hydrocarbon significance of bedding fractures in typical tight sandstone and shale. Acta Pet. Sin. 2022, 43, 180. [Google Scholar]
  21. Gong, L.; Su, X.; Gao, S.; Fu, X.; Jabbari, H.; Wang, X.; Liu, B.; Yue, W.; Wang, Z.; Gao, A. Characteristics and formation mechanism of natural fractures in the tight gas sandstones of Jiulongshan gas field, China. J. Pet. Sci. Eng. 2019, 175, 1112–1121. [Google Scholar] [CrossRef]
  22. Zeng, L.; Gong, L.; Guan, C.; Zhang, B.; Wang, Q.; Zeng, Q.; Lyu, W. Natural fractures and their contribution to tight gas conglomerate reservoirs: A case study in the northwestern Sichuan Basin, China. J. Pet. Sci. Eng. 2022, 210, 110028. [Google Scholar] [CrossRef]
  23. Laubach, S.E.; Eichhubl, P.; Hilgers, C.; Lander, R.H. Structural diagenesis. J. Struct. Geol. 2010, 93, 1413–1426. [Google Scholar] [CrossRef]
  24. Lyu, W.; Zeng, L.; Zhang, B.; Miao, F.; Lyu, P.; Dong, S. Influence of natural fractures on gas accumulation in the Upper Triassic tight gas sandstones in the northwestern Sichuan Basin, China. Mar. Pet. Geol. 2017, 83, 60–72. [Google Scholar] [CrossRef]
  25. Liu, G.; Zeng, L.; Zhu, R.; Gong, L.; Ostadhassan, M.; Mao, Z. Effective fractures and their contribution to the reservoirs in deep tight sandstones in the Kupa Depression, Tarim Basin, China. Mar. Pet. Geol. 2021, 124, 104824. [Google Scholar] [CrossRef]
  26. Swanson, S.K. Lithostratigraphic controls on bedding-plane fractures and the potential for discrete groundwater flow through a siliciclastic sandstone aquifer, southern Wisconsin. Sediment. Geol. 2007, 197, 65–78. [Google Scholar] [CrossRef]
  27. Smart, K.J.; Ofoegbu, G.I.; Morris, A.P.; McGinnis, R.N.; Ferrill, D.A. Geomechanical modeling of hydraulic fracturing: Why mechanical stratigraphy, stress state, and pre-existing structure matter. AAPG Bull. 2014, 98, 2237–2261. [Google Scholar] [CrossRef]
  28. Guo, X.; Hu, D.; Wei, X.; Li, Y. Main controlling factors on shale fractures and their influences on production capacity in Jiaoshiba area, the Sichuan Basin. Oil Gas Geol. 2016, 37, 799–808. [Google Scholar]
  29. Liu, D.; Zhang, C.; Luo, Q.; Zhang, Y.; Gao, Y.; Zhang, Y.; Zhu, D.; Wang, J. Development characteristics and controlling factors of natural fractures in Permian Lucaogou Formation tight reservoir in Jimsar sag, Junggar Basin. China Pet. Explor. 2017, 22, 36. [Google Scholar]
  30. Huang, D.; Li, B.; Ma, W.; Cen, D.; Song, Y. Effects of bedding planes on fracture behavior of sandstone under semi-circular bending test. Theor. Appl. Fract. Mech. 2020, 108, 102625. [Google Scholar] [CrossRef]
  31. Ismat, Z. Evolution of fracture porosity and permeability during folding by cataclastic flow: Implications for syntectonic fluid flow. Rocky Mt. Geol. 2012, 47, 133–155. [Google Scholar] [CrossRef]
  32. Chandler, M.R.; Meredith, P.G.; Brantut, N.; Crawford, B.R. Fracture toughness anisotropy in shale. J. Geophys. Res. Solid Earth 2016, 121, 1706–1729. [Google Scholar] [CrossRef]
  33. Zhang, C.; Zhu, D.; Luo, Q.; Liu, L.; Liu, D.; Yan, L.; Zhang, Y. Major factors controlling fracture development in the Middle Permian Lucaogou Formation tight oil reservoir, Junggar Basin, NW China. J. Asian Earth Sci. 2017, 146, 279–295. [Google Scholar] [CrossRef]
  34. Zhou, T.; Wang, H.; Li, F.; Li, Y.; Zou, Y.; Zhang, C. Numerical simulation of hydraulic fracture propagation in laminated shale reservoirs. Pet. Explor. Dev. 2020, 47, 1117–1130. [Google Scholar] [CrossRef]
  35. Cui, X.; Radwan, A. Coupling relationship between current in-situ stress and natural fractures of continental tight sandstone oil reservoirs. Interpretation 2022, 10, SF9–SF21. [Google Scholar] [CrossRef]
  36. Zhang, Y.; Zeng, L.; Lyu, W.; Sun, D.; Chen, S.; Guan, C.; Tang, L.; Shi, J.; Zhang, J. Natural fractures in tight gas sandstones: A case study of the Upper Triassic Xujiahe Formation in Xinchang gas field, Western Sichuan Basin, China. Geol. Mag. 2021, 158, 1543–1560. [Google Scholar] [CrossRef]
  37. Liu, Z.; Li, H.; Wu, Q.; Nan, Z.; Su, J.; Jin, W. Characteristics and application effect of logging-based fracture identification in tight sandstones: A case study of the Upper Triassic Xu 2 Member in Western Sichuan Depression, Sichuan Basin. Oil Gas Geol. 2021, 42, 981–991. [Google Scholar]
  38. Li, Y.; Deng, H.; He, J.; Ma, R. Reconstruction of paleo stress field after the depositional period of Leikoupo Formation in Pengzhou area, western Sichuan and its oil and gas geological significance. Acta Geol. Sin. 2022, 96, 2023007. [Google Scholar]
  39. Yin, J.; Gu, Z.; Li, Q. Characteristics of deep-rooted faults and their geological significances in Dachuanzhong area, Sichuan Basin. Oil Gas Geol. 2013, 34, 376–382. [Google Scholar]
  40. Qin, S.; Zhang, Y.; Zhao, C.; Zhou, Z. Geochemical evidence for in situ accumulation of tight gas in the Xujiahe Formation coal measures in the central Sichuan Basin, China. Int. J. Coal Geol. 2018, 196, 173–184. [Google Scholar] [CrossRef]
  41. Wang, Q.; Chen, D.; Gao, X.; Wang, F.; Li, J.; Liao, W.; Wang, Z.; Xie, G. Microscopic pore structures of tight sandstone reservoirs and their diagenetic controls: A case study of the Upper Triassic Xujiahe Formation of the Western Sichuan Depression, China. Mar. Pet. Geol. 2020, 113, 104119. [Google Scholar] [CrossRef]
  42. Kang, D.; Tan, X.; Wang, X.; Liang, J.; Tu, L.; Wu, C. Tight gas accumulation elements and favorable zone evaluation of Xujiahe Formation in Sichuan Basin. Spec. Oil Gas Reserv. 2020, 27, 40–46. [Google Scholar]
  43. Miall, A.D. Architectural-element analysis: A new method of facies analysis applied to fluvial deposits. Earth-Sci. Rev. 1985, 22, 261–308. [Google Scholar] [CrossRef]
  44. Miall, A.D. Reconstructing the architecture and sequence stratigraphy of the preserved fluvial record as a tool for reservoir development: A reality check. AAPG Bull. 2006, 90, 989–1002. [Google Scholar] [CrossRef]
  45. Zhu, W.; Wu, S.; Yin, Z.; Han, T.; Wu, Y.; Liu, Y.; Feng, W.; Luo, Y.; Cao, C. Braided river delta outcrop architecture: A case study of Triassic Huangshanjie Formation in Kuche Depression, Tarim Basin, NW China. Pet. Explor. Dev. 2016, 43, 482–489. [Google Scholar] [CrossRef]
  46. Shi, C.; Li, Y.; Yuan, W.; Jiang, J.; Xie, Y.; Zhang, R.; Zhou, S.; Lou, H.; Wang, Z.; Zhang, H.; et al. Characteristics on reservoir architecture and quality of tight sandstone reservoirs: Taking Jurassic Ahe formation in Dibei area of Kuqa foreland basin as an example. J. China Univ. Min. Technol. 2021, 50, 877–892. [Google Scholar]
  47. Jiang, Y.; Li, M.; Wang, L.; Liu, J.; Zeng, T.; Zhao, C. Characteristics and controlling factors of tight sandstone reservoir fractures of the Xujiahe Formation in the Bazhong-Tongnanba area, Northeast Sichuan. Acta Geol. Sin. 2020, 94, 1525–1537. [Google Scholar]
  48. Ren, Q.; Jin, Q.; Feng, J.; Li, M. Simulation of stress fields and quantitative prediction of fractures distribution in upper Ordovician biological limestone formation within Hetianhe field, Tarim Basin, NW China. J. Pet. Sci. Eng. 2019, 173, 1236–1253. [Google Scholar] [CrossRef]
  49. Ren, Q.; Feng, J.; Johnston, S.; Du, H. The influence of argillaceous content in carbonate rocks on the 3D modeling and characterization of tectonic fracture parameters—Example from the Carboniferous and Ordovician formations in the Hetianhe gas field, Tarim Basin, NW China. J. Pet. Sci. Eng. 2021, 203, 108668. [Google Scholar] [CrossRef]
Figure 1. Structural characteristics of northern part of the Western Sichuan Depression. (A) is the structural schematic diagram of China; (B) shows the structural schematic diagram of Sichuan Basin; (C) refers to the structural characteristics of the study area; (D) shows the stratigraphic characteristics in the study area. I—Longmenshan Fault; II—Micang-Daba Mountain thrust belt; III—Kangtien ancient land; IV—Western Sichuan Depression; V—Northern Sichuan Depression; VI—Low moderate structural belt in central Sichuan; VII—Eastern Sichuan fault-fold belt; VIII—ancient uplift.
Sustainability 16 04304 g001
Figure 2. The established geomechanical model and boundary loading conditions.
Sustainability 16 04304 g002
Figure 3. The observed sedimentary characteristics of core and thin section. (A) well zj 20, 4069.73 m, medium sandstone, parallel bedding; (B) well xc 7, 5185.77 m, fine-medium sandstone, normal grading; (C) well zj 20, 4080.15 m, medium-coarse sandstone, trough cross-bedding; (D) well cf 563, 4436.13 m, medium sandstone; (E) well cf 563, 4922.53 m, silty mudstone; (F) well cf 563, 4845.12 m, silty mudstone, visible carbon shavings; (G) well ls 1, 4248.79 m, medium sandstone, mud gravel were developed; (H) well ls 1, 4259.5 m, medium sandstone, visible developed mud gravel; (I) well xc 7, 4976.74 m, black shale; (J) well xc 7, 4976.83 m, black shale; (K) well dy 2, interbedded sandstone and mudstone; (L) well dy 2, 4985.91 m, interbedded sandstone and mudstone; (M) well xc 12, 4767.28 m; (N) well gm3, 4880.01 m; (O) well cx 563, 4899.70 m, line contact between particles; (P) well gm3, 4880.00 m, secondary enlargement of quartz; (Q) well xc 12, 4767.28 m, secondary dissolution pore and feldspar debris dissolution pore; (R) well gm 3, 4880.01 m, few pores and poor development of roar channels; (S) well zj 20, 4200.3 m, dissolution is developed along the edge of micro fracture; (T) well xc 12, 4812.24 m, calcite metasomatism of feldspar; where specimens in (A,B) belonged to sedimentary environment of the distributary channel; samples in (C,D) were in the sedimentary condition of the mouth bar; specimens in (E,F) belonged to sedimentary environment of the interdistributary bay; samples in (G,H) were in the sedimentary condition of the sandy debris flow; specimens in (I,J) belonged to sedimentary environment of the inshore shallow lake; samples in (K,L) were in the sedimentary condition of the natural levee.
Sustainability 16 04304 g003
Figure 4. Developmental characteristics of bedding plane and structural fractures in the study area. (A) well gm 3, 4920.61 m, trough cross-bedding, bedding fractures and plane shear fractures; (B) well cx 565, 5059.05 m, structural fracture with high dip angle, penetrated the parallel beddings, fully filled with calcite; (C) well dy 2, 4938.54 m, structural fracture with high dip angle, penetrated the parallel beddings; (D) well xc 8, 5169.2 m, tensile-shear fracture; (E) well zj 20, sand lamination developed, structural fractures were developed along the weak bedding planes; (F) well zj 20, 4071.67 m, structural fracture with high dip angle, penetrated the parallel beddings; (G) well gm 3, 4918.33–4920.2 m, rock’s rupture were highly related to the bedding planes.
Sustainability 16 04304 g004
Figure 5. The reservoir architecture division of the T3x2 Formation in well cx 563 (5054–5072 m).
Sustainability 16 04304 g005
Figure 6. The reservoir architecture division and geomechanical characteristics of the T3x2 Formation in well zj 20 (4067.83–4083.83 m).
Sustainability 16 04304 g006
Figure 7. The characteristics of stress mechanism in the T3x2 Formation in well zj 20.
Sustainability 16 04304 g007
Figure 8. The developmental characteristics of geomechanical parameters in the T3x2 Formation in the study area. (AD) shows the rose diagram of fracture strike in well zj 20, gm 3, xc, 8, and xc 5, respectively; red color shows the distribution interval of fracture strike; (EH) refers to the pie chart of four different reservoir architecture interfaces of level 2 in well zj 20, gm 3, xc 8, and cf 563, respectively; (I) indicates the Young’s modulus; (J) shows the Poisson’s ratio; (K) refers to the brittleness index; (L) is the coefficient of stress difference.
Sustainability 16 04304 g008
Figure 9. Geomechanical response characteristics on reservoir architecture interface of level 4. (A) is the relationship between fracturing pressure and distance from architecture interface (bottom) of level 4; (B) shows the relationship between σHmin and distance from architecture interface (bottom) of level 4; (C) refers to the relationship between σHmax and distance from architecture interface (bottom) of level 4; (D) indicates the relationship between σV and distance from architecture interface (bottom) of level 4; (E) shows the relationship between the Poisson’s ratio and distance from architecture interface (bottom) of level 4; (F) is the relationship between the Young’s modulus and distance from architecture interface (bottom) of level 4; (G) refers to the relationship between the coefficient of stress difference and distance from architecture interface (bottom) of level 4; (H) shows the relationship between the brittleness index and distance from architecture interface (bottom) of level 4; (I) refers to the relationship between the stress intensity and distance from architecture interface (bottom) of level 4; where σHmin shows the horizontal minimum principal stress, MPa; σHmax refers to the horizontal maximum principal stress, MPa; σV is the vertical principal stress, MPa.
Sustainability 16 04304 g009
Figure 10. Geomechanical response characteristics on reservoir architecture interface of level 3. (A) is the relationship between fracturing pressure and distance from architecture interface (bottom) of level 3; (B) shows the relationship between σHmin and distance from architecture interface (bottom) of level 3; (C) refers to the relationship between σHmax and distance from architecture interface (bottom) of level 3; (D) indicates the relationship between σV and distance from architecture interface (bottom) of level 3; (E) shows the relationship between the Poisson’s ratio and distance from architecture interface (bottom) of level 3; (F) is the relationship between the Young’s modulus and distance from architecture interface (bottom) of level 3; (G) refers to the relationship between the coefficient of stress difference and distance from architecture interface (bottom) of level 3; (H) shows the relationship between the brittleness index and distance from architecture interface (bottom) of level 3; (I) refers to the relationship between the stress intensity and distance from architecture interface (bottom) of level 3; where σHmin shows the horizontal minimum principal stress, MPa; σHmax refers to the horizontal maximum principal stress, MPa; σV is the vertical principal stress, MPa.
Sustainability 16 04304 g010
Figure 11. Geomechanical response characteristics on reservoir architecture interface of level 2. (A) is the relationship between fracturing pressure and distance from architecture interface (bottom) of level 2; (B) shows the relationship between σHmin and distance from architecture interface (bottom) of level 2; (C) refers to the relationship between σHmax and distance from architecture interface (bottom) of level 2; (D) indicates the relationship between σV and distance from architecture interface (bottom) of level 2; (E) shows the relationship between the Poisson’s ratio and distance from architecture interface (bottom) of level 2; (F) is the relationship between the Young’s modulus and distance from architecture interface (bottom) of level 2; (G) refers to the relationship between the coefficient of stress difference and distance from architecture interface (bottom) of level 2; (H) shows the relationship between the brittleness index and distance from architecture interface (bottom) of level 2; (I) refers to the relationship between the stress intensity and distance from architecture interface (bottom) of level 2; where σHmin shows the horizontal minimum principal stress, MPa; σHmax refers to the horizontal maximum principal stress, MPa; σV is the vertical principal stress, MPa.
Sustainability 16 04304 g011
Figure 12. Response characteristics of fracture parameters on various reservoir architecture interfaces. (A) is the relationship between the fracture strike and distance from reservoir architecture interface (bottom) of level 2; (B) shows the relationship between the fracture dip angle and distance from reservoir architecture interface (bottom) of level 2; (C) refers to the relationship between the fracture strike and distance from reservoir architecture interface (bottom) of level 3; (D) is the relationship between the fracture dip angle and distance from reservoir architecture interface (bottom) of level 3; (E) shows the relationship between fracture strike and distance from various reservoir architecture interfaces; (F) indicates the relationship between fracture dip angle and distance from various reservoir architecture interfaces.
Sustainability 16 04304 g012
Figure 13. The coupling simulation results of in situ stress and fracture parameters in different microfacies in typical well of zj 20 (4067.83–4083.83 m).
Sustainability 16 04304 g013
Figure 14. The coupling simulation results of in situ stress and fracture parameters in same microfacies in typical well of zj 20 (4291–4299 m).
Sustainability 16 04304 g014
Table 1. The mechanical parameters in different lithologies/architectures.
Top Depth/mBottom Depth/mThicknessLithology/ArchitectureE/GPaµDensity/kg/m3
4067.834068.330.5fine sandstone44.750.2912476
4068.334068.430.1medium sandstone45.140.2902485
4068.434068.540.11sand wave lamination45.360.2892494
4068.544069.130.59medium sandstone45.880.2852513
4069.134069.250.12parallel bedding47.290.2872530
4069.254069.630.38medium sandstone47.920.2872536
4069.634070.050.42parallel bedding47.300.2822537
4070.054071.051.00fine sandstone49.000.2872536
4071.054072.331.28medium sandstone56.500.2902604
4072.334072.730.40medium sandstone58.210.2982593
4072.734073.120.39fine sandstone52.400.2872577
4073.124074.161.04medium sandstone48.530.2842548
4074.164074.330.17fine sandstone50.590.2822575
4074.334074.380.05parallel bedding50.740.2812578
4074.384075.160.78fine sandstone51.290.2812582
4075.164075.620.46medium sandstone53.480.2762621
4075.624075.920.30fine sandstone52.950.2792608
4075.924077.021.10medium sandstone53.840.2832606
4077.024077.620.60medium sandstone53.280.2862587
4077.624078.470.85fine sandstone58.180.2972601
4078.474079.370.90medium sandstone66.980.3132630
4079.374080.050.68fine sandstone55.200.2812620
4080.054080.150.10fine sandstone50.600.2682622
4080.154080.250.10medium sandstone52.910.2762621
4080.254080.350.10fine sandstone54.570.2812620
4080.354080.450.10medium sandstone55.540.2742618
4080.454080.500.05sand wave lamination56.920.2882618
4080.504080.700.20fine sandstone57.730.2892621
4080.704081.120.42medium sandstone60.550.2962625
4081.124081.520.40fine sandstone52.850.2812588
4081.524082.310.79medium sandstone40.800.2572542
4082.314082.410.10fine sandstone45.560.2652571
4082.414082.610.20medium sandstone47.290.2652586
4082.614082.810.20fine sandstone48.540.2662596
4082.814083.170.36parallel bedding48.690.2612610
4083.174083.260.09medium sandstone47.330.2552610
4083.264083.360.10fine sandstone46.570.2522610
4083.364083.410.05sand wave lamination45.850.2492609
4083.414083.560.15medium sandstone45.880.2472618
4083.564083.660.10fine sandstone46.330.2472624
4083.664083.830.17medium sandstone47.630.2512628
Where E shows the rock’s Young’s modulus, MPa; μ is the rock’s Poisson’s ratio, dimensionless.
Disclaimer/Publisher’s Note: The statements, opinions and data contained in all publications are solely those of the individual author(s) and contributor(s) and not of MDPI and/or the editor(s). MDPI and/or the editor(s) disclaim responsibility for any injury to people or property resulting from any ideas, methods, instructions or products referred to in the content.

