Article

Integrating the Living Wall with Mechanical Ventilation to Improve Indoor Thermal Environment in the Transition Season

Innovation Institute for Sustainable Maritime Architecture Research and Technology (ISMART), Qingdao University of Technology, Qingdao 266033, China
*
Author to whom correspondence should be addressed.
Sustainability 2024, 16(10), 4300; https://doi.org/10.3390/su16104300
Submission received: 6 April 2024 / Revised: 6 May 2024 / Accepted: 16 May 2024 / Published: 20 May 2024

Abstract

:
A living wall, when integrated with a mechanical ventilation system, can effectively improve the indoor thermal environment and reduce indoor CO2 concentration during the transition season. In this study, a control experiment was conducted to analyze the effect of a living wall integrated with mechanical ventilation (LW-V) on indoor air quality. During the experiment, indoor air temperature, relative humidity, indoor air speed, and CO2 concentration were measured, while the skin temperature was monitored and subjective questionnaires were administered to 60 subjects. The results show that the indoor environment was effectively improved by employing the LW-V system, with the average indoor temperature decreasing by 1.45 °C, while relative humidity increased by 19.1%. Due to the plant photosynthesis, CO2 concentrations were reduced by 13.83 ppm. Meanwhile, the mean skin temperature was reduced by 0.18 °C and was closer to the neutral mean skin temperature. Questionnaire analysis reveals the LW-V system improved overall air freshness sensation and thermal comfort level by 1.09 and 0.53, respectively. The LW-V system improved the indoor thermal environment as well as air quality during the transition season significantly.

1. Introduction

With the acceleration of urbanization, a series of urban problems has emerged, including excessive energy consumption [1,2], increasingly serious urban environmental pollution, intensified heat island effect, scarce land resources, and reduced urban green space. Severe environmental pollution and poor air quality are global problems [3].
Indoor air temperature and relative humidity are key factors affecting indoor air quality as well as thermal comfort in indoor environments [4]. Generally, the thermal comfort of the human body can only be ensured when the temperature and relative humidity of the indoor environment are maintained within a certain range, and if the temperature and humidity are higher or lower, it will have a negative impact on human health. Especially in the winter environment, the opening of heating equipment leads to indoor air dryness and uneven distribution of indoor temperature and other problems, with the indoor temperature and humidity unable to meet the basic needs of people for indoor thermal comfort. Low humidity and low temperatures can lead to impaired skin barrier function [5]. Some studies suggest that low indoor relative humidity can lead to symptoms of dryness, affecting the mucous membranes of the eyes and respiratory tract. Conversely, humidification of buildings has been shown to alleviate the incidence of symptoms such as dry throat and cough [6]. In addition, discomfort in indoor environments has been found to contribute to dissatisfaction among individuals with their office settings, potentially impacting their work efficiency. Conversely, conducive environments have been associated with increased productivity [7,8].
Green plants and a living wall can improve the indoor thermal environment through the photosynthesis and transpiration of plants [9,10]. As confirmed by Fernández-Cañero et al. [11] the living wall had a cooling effect and the results of the study showed that the indoor temperature could be reduced by an average of 4 °C, with a maximum of 6 °C under warmer room conditions. In addition, temperatures were reduced by 0.8–4.8 °C at different horizontal distances and heights from the green plant wall [12]. Meng et al. [13] combined the living wall with the air conditioning system to significantly improve the indoor thermal comfort level, and the experimental results showed that the indoor relative humidity was reduced by 2.6%. Smith et al. [14] investigated the effect of office plants on indoor environments and found that the relative humidity in the room increased after the introduction of plants into the room. As confirmed by Ding et al. [15], the system integrating an ILW (indoor living wall) with an SAC (split air conditioners) significantly improved the indoor thermal environment in winter, and the relative humidity was increased by 10.8%. During the study by Rodgers et al. [16], the average relative humidity increased by about 7% in the presence of plants, and due to the generally drier indoor air in winter as compared to summer, classrooms with greenery had greater relative humidity and higher comfort levels.
Plants can reduce the concentration of CO2 indoors through photosynthesis, and in a study by Tudiwer et al. [17], the CO2 concentration in classrooms with green plants decreased faster, plants were the only cause of the difference in CO2 concentration, and when the initial concentration of CO2 indoors was the same, the concentration of CO2 in classrooms with a living wall system decreased 3.5% faster than that in classrooms without plants. Torpy et al. [18] investigated the CO2 removal potential of eight common indoor plants and showed that the photosynthetic capacity of different plants varied at indoor light levels, that there were significant differences in the CO2 removal rates of different plants, that higher increases in CO2 removal rates were detected only at levels higher than indoor light, and that appropriate light could optimize CO2 uptake by plants. Vegetables were grown vertically to increase the net photosynthetic rate in a study by Shao et al. [19]. In an office with one to three staff and an area of 30 m2, 100 plants grown vertically reduced indoor CO2 concentrations by 25.7–34.3% compared with no planting. As confirmed by Ding et al. [15], a living wall system reduced CO2 concentrations by 49 ppm in air-conditioned offices. Meng et al. [13] combined a living wall system with an air-conditioning system and achieved a CO2 reduction of about 10% in an unoccupied environment compared to the room referred to, suggesting that in a real space the potential of living walls to reduce indoor CO2 concentration would be improved.
The benefits of plants were not only reflected in the repair of indoor environmental quality and an improvement in indoor thermal comfort. Many studies have shown that exposure to nature has a positive impact on people’s psychological as well as physiological aspects, which can help to improve people’s emotional state, attention restoration, mental state, behavior, and health [20,21]. Plants can alleviate physiological stress [22] and negative psychological symptoms [23,24], and through horticultural therapy can improve or treat some mental health problems and have a positive effect on the recovery of patients with clinical depression [24,25,26].
As confirmed by Oh et al. [27], plants can alleviate visual fatigue and improve students’ concentration. As confirmed by Van Den Berg et al. [28], a living wall helped to improve the classroom atmosphere and increase students’ concentration. As confirmed by Han [20], indoor plants had a positive impact on students’ perceptions, enhancing students’ comfort and friendliness, reducing students’ sick leave time, and reducing penalties for misbehavior. Danielski et al. [29] also showed that nature experiences contribute significantly to children’s perceived comfort and satisfaction in learning, attention, and concentration levels, as well as their sense of social connectedness within the school environment. Lohr et al. [30] demonstrated that indoor plants can reduce the stress of workers, especially when placed in work environments that require concentration and quick reaction, and can effectively increase employee productivity. Hähn et al. [31] experimentally assessed the effect of indoor plants on the office environments, and through physiological measurements and a questionnaire study, the results proved that plants can affect the mood of the occupants and increase satisfaction with the work environment and work participation enthusiasm. In addition, Yıldırım et al. [32] showed that indoor plants have a positive effect on people’s moods and can make them feel more peaceful, calm, warm, and happy. Kim et al. [33] found that plants can improve basement environments and help to alleviate negative feelings about the underground environment.
In addition, indoor plants may have adverse effects on indoor environment. When introduced indoors, plants, especially those with scented leaves or flowers, may release biogenic volatile organic compounds (VOCs) and contribute to indoor environmental pollution [34]. The emission of these VOCs can result in a deterioration of indoor air quality, thereby exerting detrimental effects on human health. Consequently, when incorporating indoor plants, meticulous selection of plant species is imperative to mitigate the impact of VOCs.
In summary, plants can contribute to the enhancement of indoor thermal conditions. In the aforementioned studies, many focus on either winter or summer seasons, with limited research on transitional seasons. In this study, a living wall was integrated with a ventilation system (LW-V system) to investigate its specific impact on the indoor thermal environment during the transition season from summer to winter, as well as its potential for improving indoor CO2 concentration. Additionally, the subjective perceptions and expectations of indoor environments were assessed by conducting a questionnaire survey in conjunction with measuring skin temperatures at eight locations for 60 subjects.

2. Materials and Methods

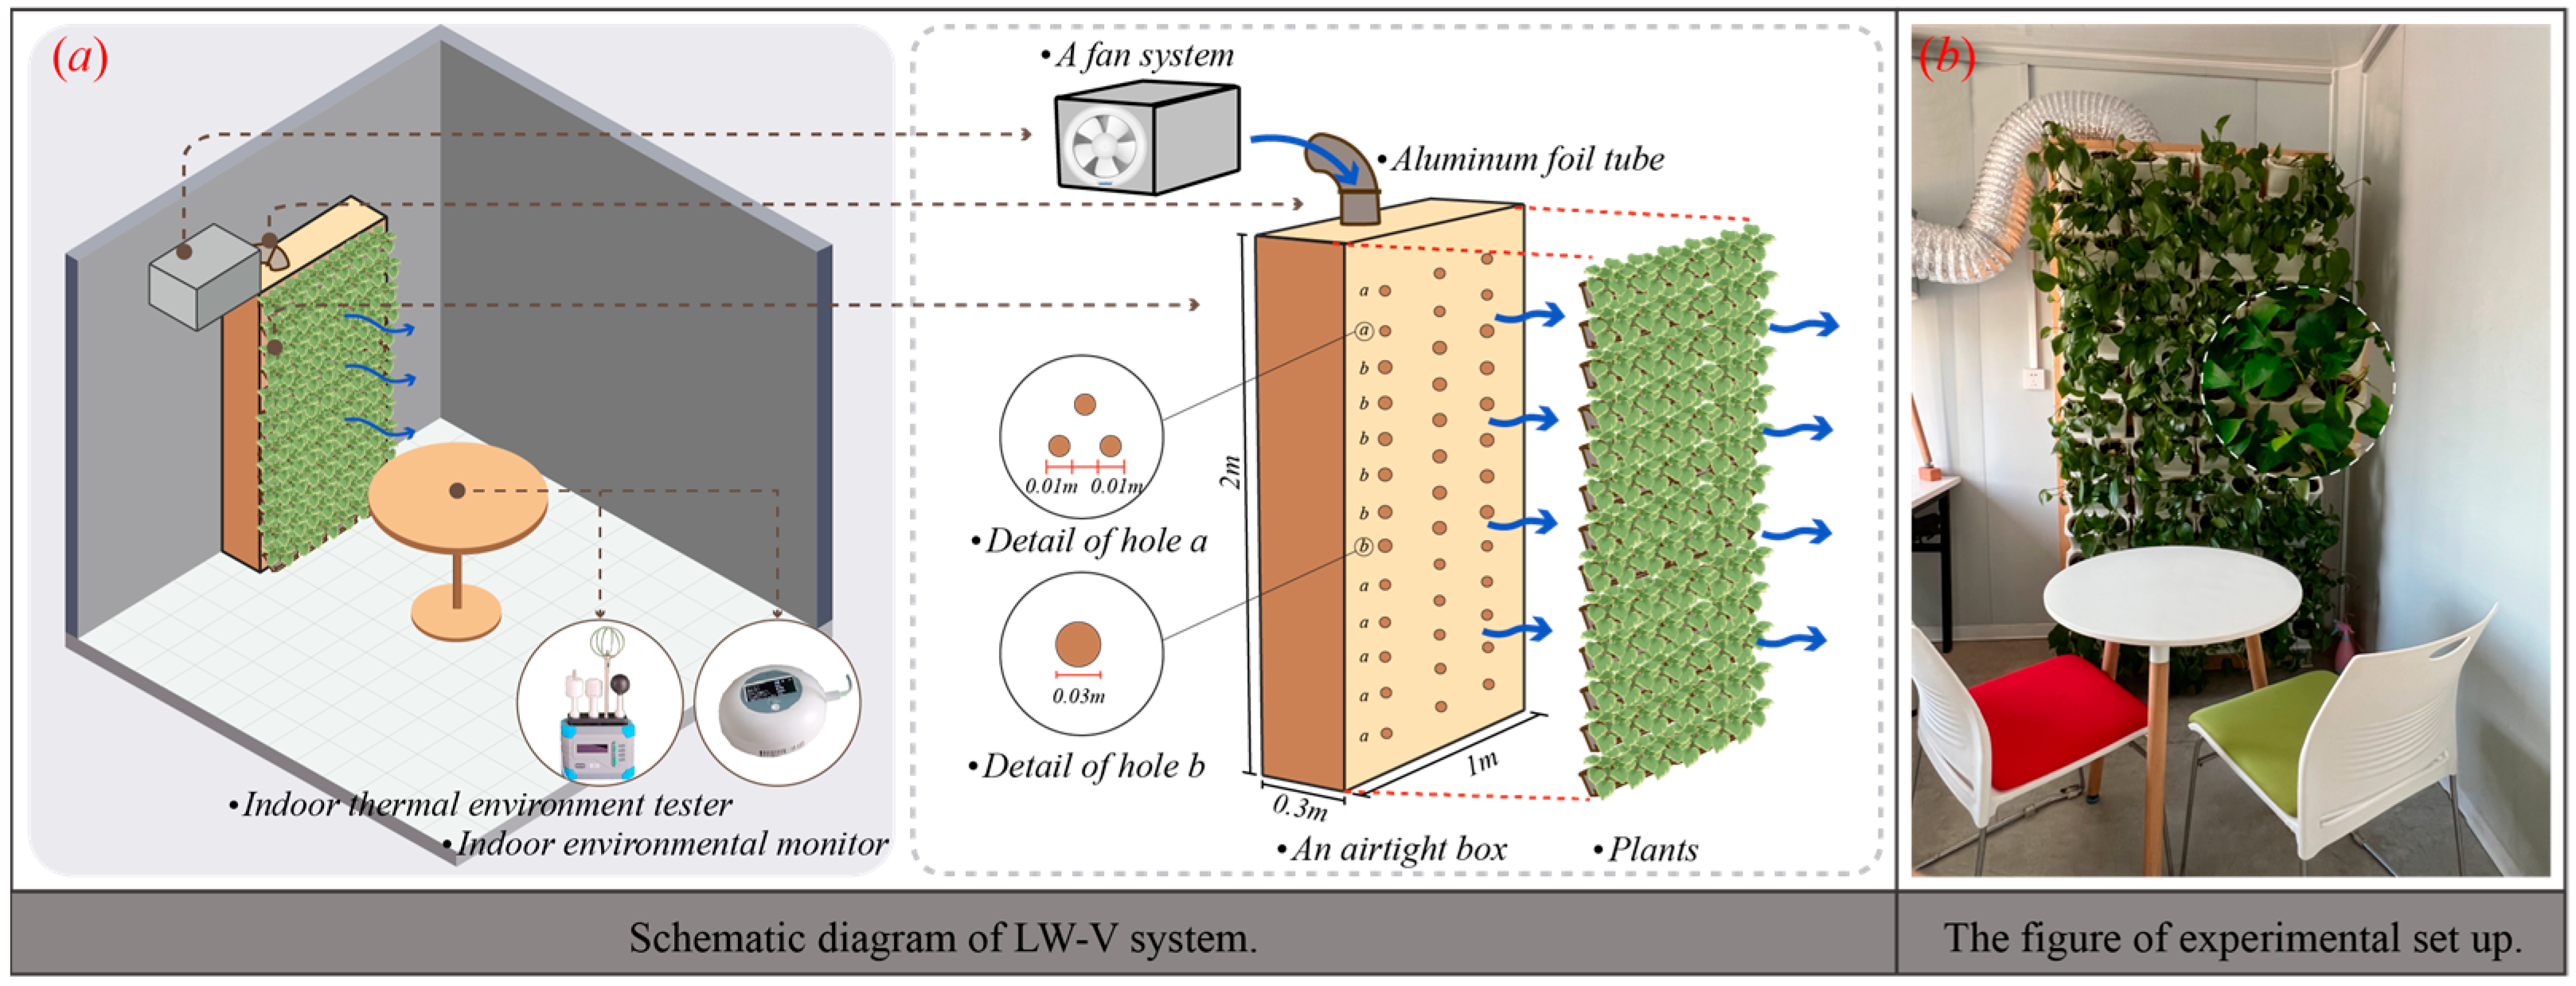
2.1. Description of the LW-V System

Figure 1 shows a diagram of the experimental system, which mainly consists of three parts: a fan system (ST-200D-19DP), a wooden box, and green plants (Epipremnum aureum) with a size of 1000 mm (length), 300 mm (width), and 2000 mm (height). The ST-200D-19DP is a low-noise air supply fan system featuring dimensions of 650 mm in length, 470 mm in width, and 360 mm in height. It offers dual power settings of 155/120 W, an air volume of 690/560 m3/h, and pressure outputs of 200/190 Pa, and operates at a low noise level of 33/29 dB(A) while requiring 220 V voltage. The culture substrate was selected from the sterile nutrient soil, which is a mixture of coconut barn, garden soil, vermiculite, and perlite. This soil was loose and breathable and had good drainage, and it was more suitable for the plant’s growth. A green plant was selected from Epipremnum aureum, which demonstrated tenacious vitality.
An automatic watering device regulated the soil moisture level between 30% and 50%, ensuring optimal conditions for natural plant growth and room comfort. The study by Ding et al. [35] showed that Epipremnum aureum were the most suitable plants to be grown indoors, either under sufficient or insufficient light conditions. In this study, a total of 104 pots of Epipremnum aureum with an average height of about 25 cm were used to ensure their proper distribution and layout on vertical walls. In addition, the fan system passed through the aluminum foil tube, the airtight box, and the surface of plants, and then sent the air out. Because of the repair and transpiration of plants, it can play a role in filtering and improving the indoor thermal environment.

2.2. Description of Experimental Platform

The study was conducted in Qingdao, China. Figure 2 shows a schematic diagram of the laboratory layout. Two south-facing laboratories with the same layout and the same size of 3000 mm (length) × 3000 mm (width) × 2800 mm (height) were selected. The laboratories are steel framed, with walls and roofs consisting of a 2.5 mm steel layer, 90 mm insulation (rock wool), and a 2.5 mm steel layer. Room B with the LW-V system was chosen as the experimental subject, and Room A without the LW-V system was determined as the control. Everything else between Rooms A and B is exactly the same, so the difference between Room A and Room B can be attributed to the addition of the LW-V system. Before the experiment, the windows and other parts of the laboratory were sealed with rubber seals to prevent the penetration of air or water vapor from affecting the results of the experiment.

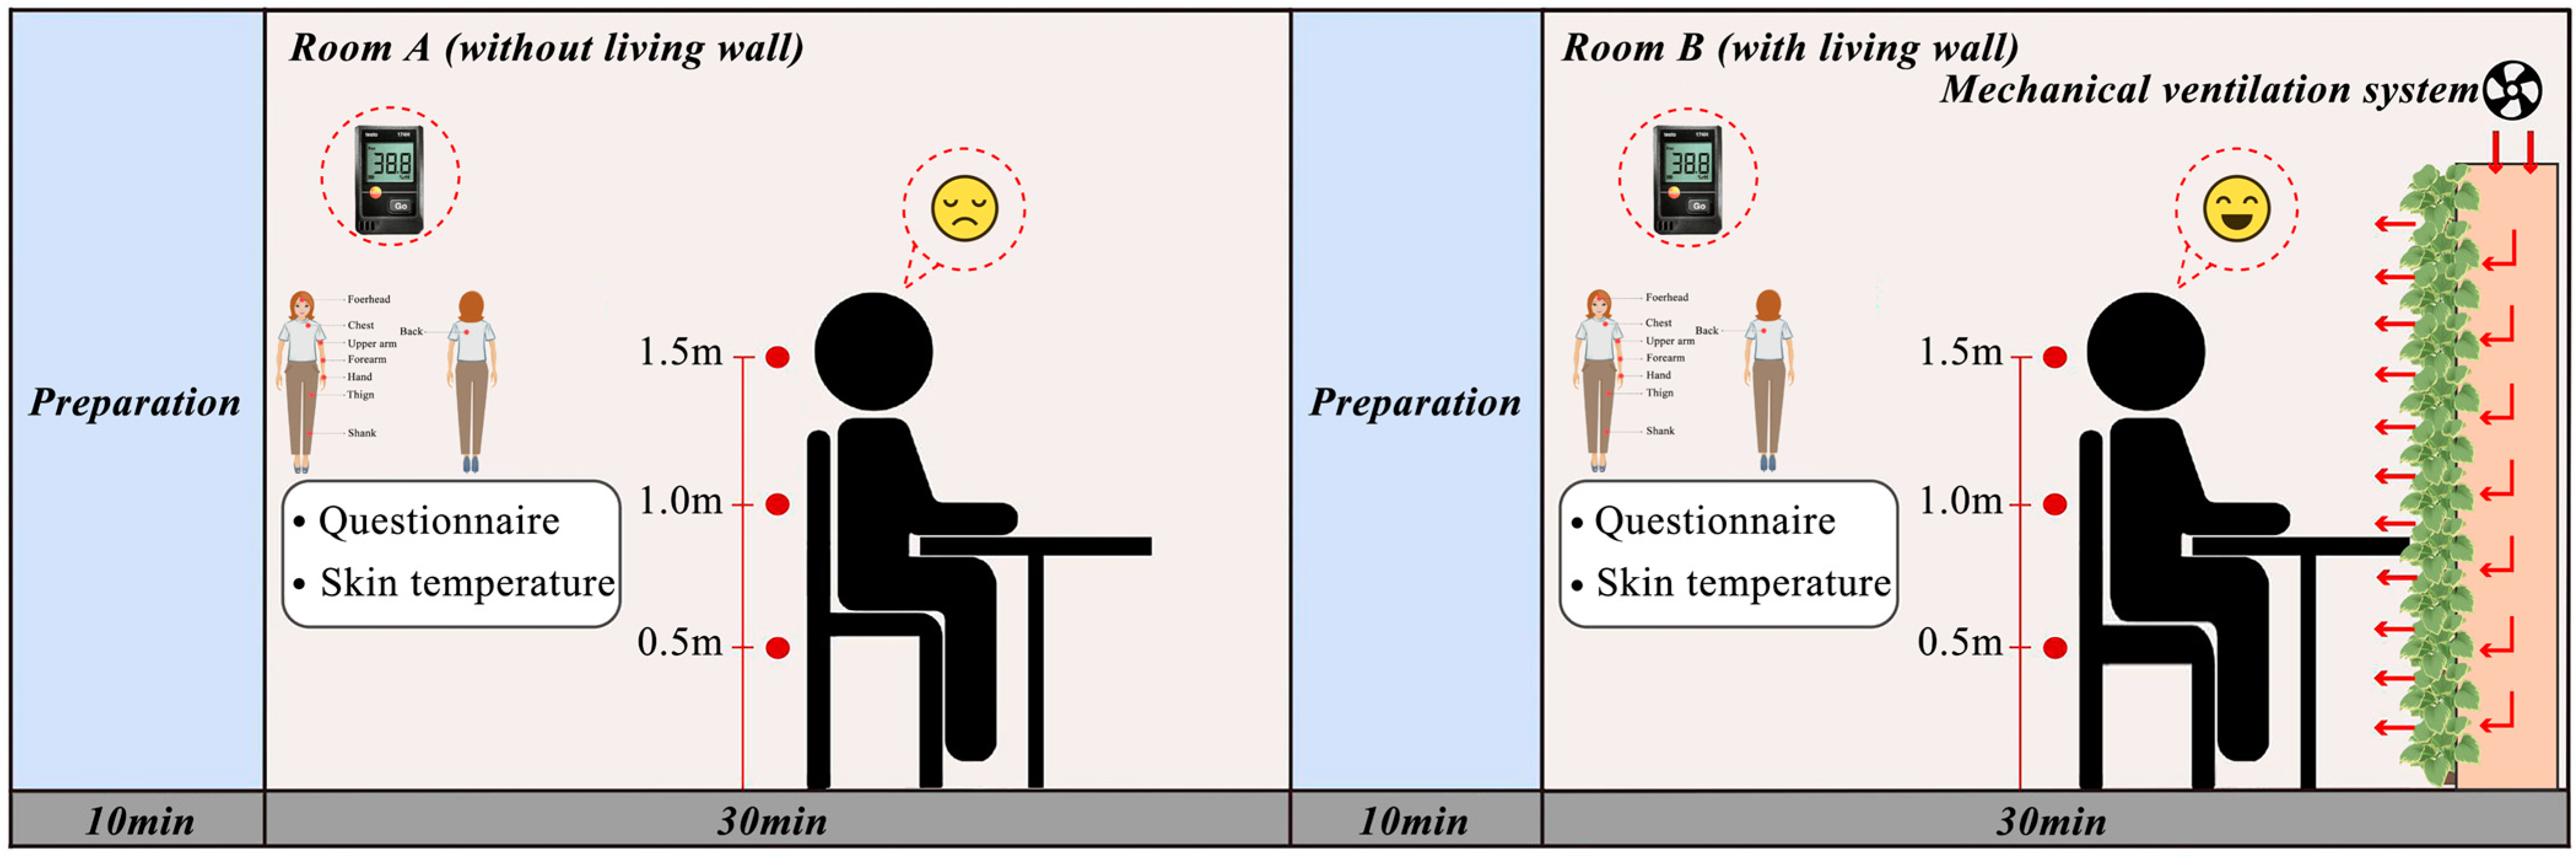
2.3. Description of Experimental Test Methods

In order to investigate the effect of the LW-V system on the indoor thermal environment and comfort during the transition season, objective measurements and subjective questionnaires from the subjects were used in the experiment. The indoor environmental parameters of both rooms were monitored during the comparison experiment, including four parameters: indoor temperature, relative humidity, air speed, and CO2 concentration. Subjective questionnaires collected participants’ personal feelings and evaluations. In this study, the environment and the subjective questionnaire were studied separately for mainly the following reasons: (1) Environmental monitoring and subjective questionnaires are two different methods of data acquisition. They are conducted separately to ensure the independence of objective and subjective data and to avoid interference between them. (2) The separation of environmental monitoring and subjective questionnaires simplifies the research design and implementation process, making each stage more independent and controllable in operation. This helps ensure the accuracy and reliability of data while enhancing the scientific rigor of the study. The instruments were all placed on a round table in the center of the room, and the data were recorded through the instruments, with the time interval set to 5 min/time.
The experiment was conducted from 17 to 30 September 2023. During the experiment, the time period of 08:30–17:30 was selected based on the office hours. The temperature, relative humidity, air speed, and CO2 concentration of the indoor environment were measured and analyzed by the four environmental variables that affect human thermal comfort. The photosynthetic light source of the living wall was derived from natural sunlight entering through the south-facing windows. The light intensity in both rooms ranged from 500 to 1500 lx, which satisfied the requisite level for plant photosynthesis. The questionnaire survey was conducted at 09:00–10:20, 10:40–12:00, 13:00–14:20, and 14:40–16:00 between 5 and 12 October 2023. Considering the airtightness of the two rooms, both rooms were kept closed during the experimental period to avoid interference with the experimental data.
During the experiment, the subjects’ subjective feelings on the indoor environment were recorded through a questionnaire survey. Meanwhile, the skin temperature was monitored by a skin temperature monitor on eight body parts, namely, forehead, chest, back, upper arm, forearm, hand, thigh, and shank. The time interval of the instrument for recording data was set to 5 s/time. The schematic distribution of human skin temperature measurement points is shown in Figure 3. During the experiment, breathable medical tape was used to attach the body surface temperature probe to the surface of human skin, which helped avoid local discomfort of the skin due to the adhesive tape, and also strengthened the contact between the temperature probe and the skin to avoid the situation of the probe falling off. Table 1 shows the measuring range and accuracy of the instrument used in this experiment.
The experimental process lasted for 80 min, with two people in each group. During this period, no one was allowed to enter or leave the laboratory except the researchers and subjects. The experimental procedure consisted of the following detailed steps, which are shown in Figure 4.
  • Before the survey, the subjects were required to arrive at the experimental site in advance and spend 10 min outdoors for relaxation. During this time, the subjects received a comprehensive introduction to the experimental process and related precautions, completed basic personal information forms, and then underwent random assignment to either Room A or Room B.
  • Prior to commencing the experiment, skin temperature monitor probes were affixed onto each subject’s skin surface.
  • The subjects remained in a state of tranquility within either Room B or Room A for a duration of 30 min. The subjects’ skin temperature was continuously monitored, and they were instructed to complete the questionnaire at 10 min intervals. Throughout this period, the subjects were allowed to engage in activities such as reading and using mobile phones and other electronic devices.

2.4. Description of Questionnaire Research Method

Some studies have shown that there are individual differences between people, and that different individuals respond differently to thermal environments, even in the same environment. Based on individual differences, a questionnaire survey is essential for recording the subjects’ feelings in real time. It was an indispensable method of evaluating the indoor thermal environment, alongside the measurement of physiological indicators such as environmental parameters and skin temperature. A total of 60 subjects were recruited for this experiment, including 30 males and 30 females, and all of them were healthy school students. The basic information about the subjects is shown in Figure 5, which mainly includes the subjects’ gender, age, body mass index (BMI), and other questions.
In the questionnaire survey, three main aspects were included: the basic information of the subjects, the indoor environment assessment, and the acceptability of the LW-V system. The indoor environment assessment mainly covered the aspects of thermal sensation, humid sensation, air speed sensation, air freshness, and thermal comfort in the room. As shown in Table 2, according to ASHRAE standards [36], the thermal sensation, humid sensation, and thermal comfort level were based on a seven-point scale. The indoor air freshness and acceptance level was based on a five-point scale. The air speed sensation was based on a four-point scale. This method allows for direct understanding of the subjects’ thermal sensation and comfort level at that time.

3. Results

To investigate the effect of the LW-V system on the indoor thermal environment, the indoor air temperature, relative humidity, air speed, and CO2 concentration were monitored during the mechanical ventilation process in the transition. As a reference, Figure 6 displays the temperature and relative humidity of weather station data for the corresponding five days. The weather station is located in the experimental area near the laboratory.

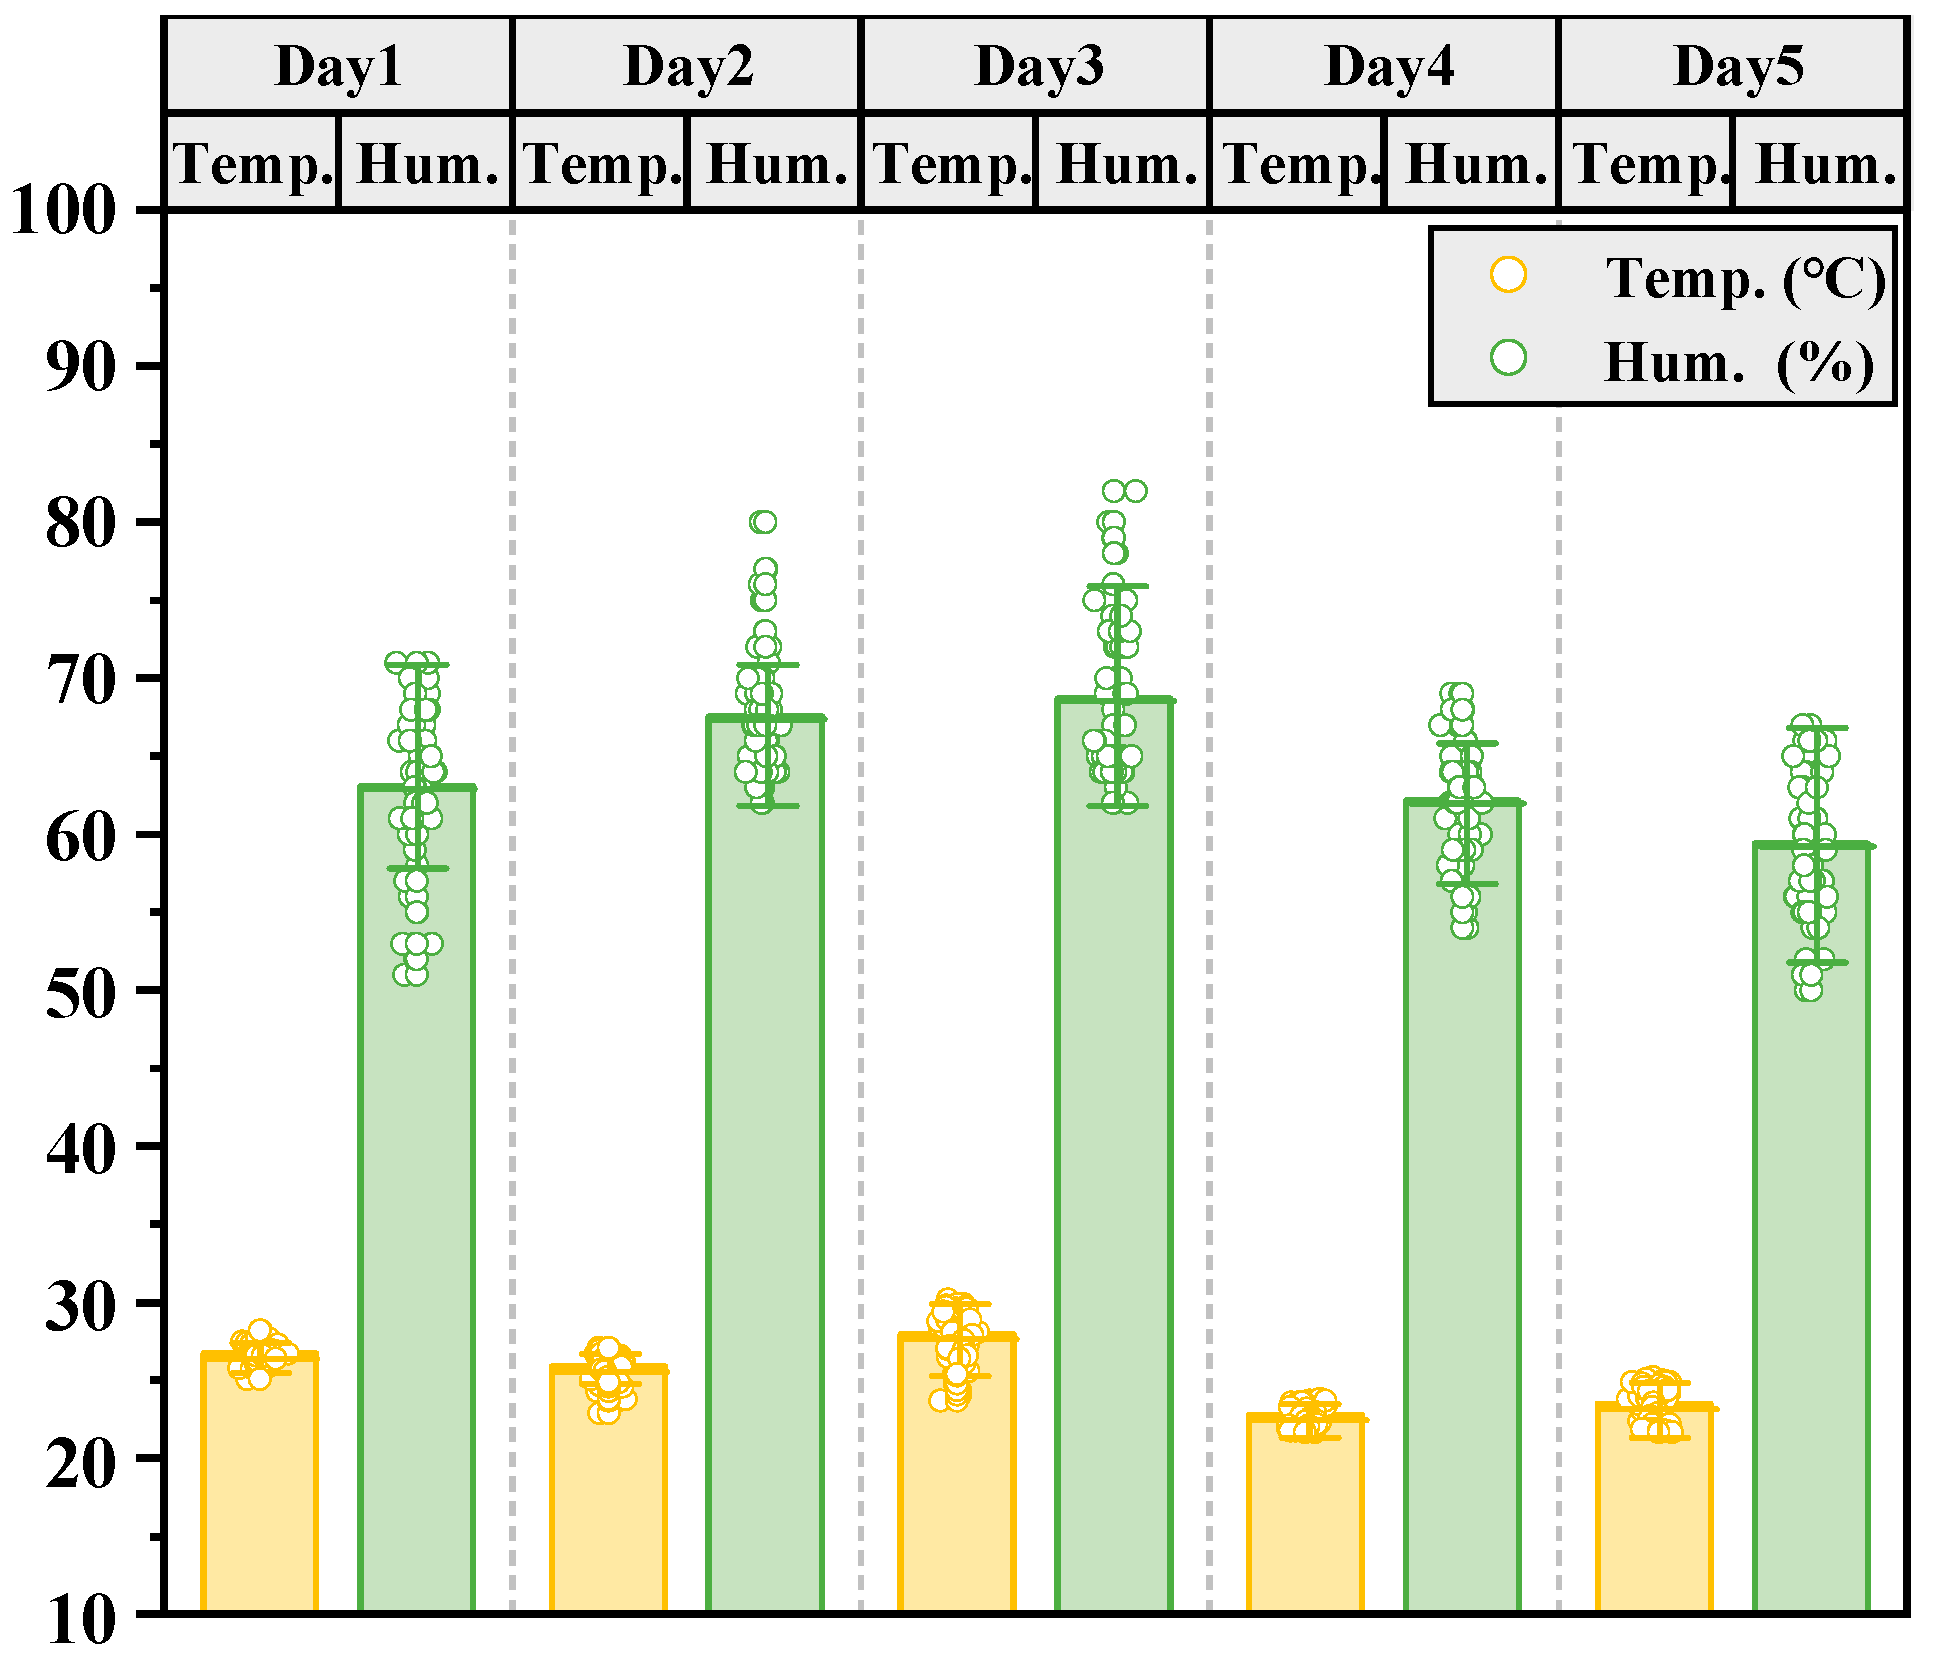
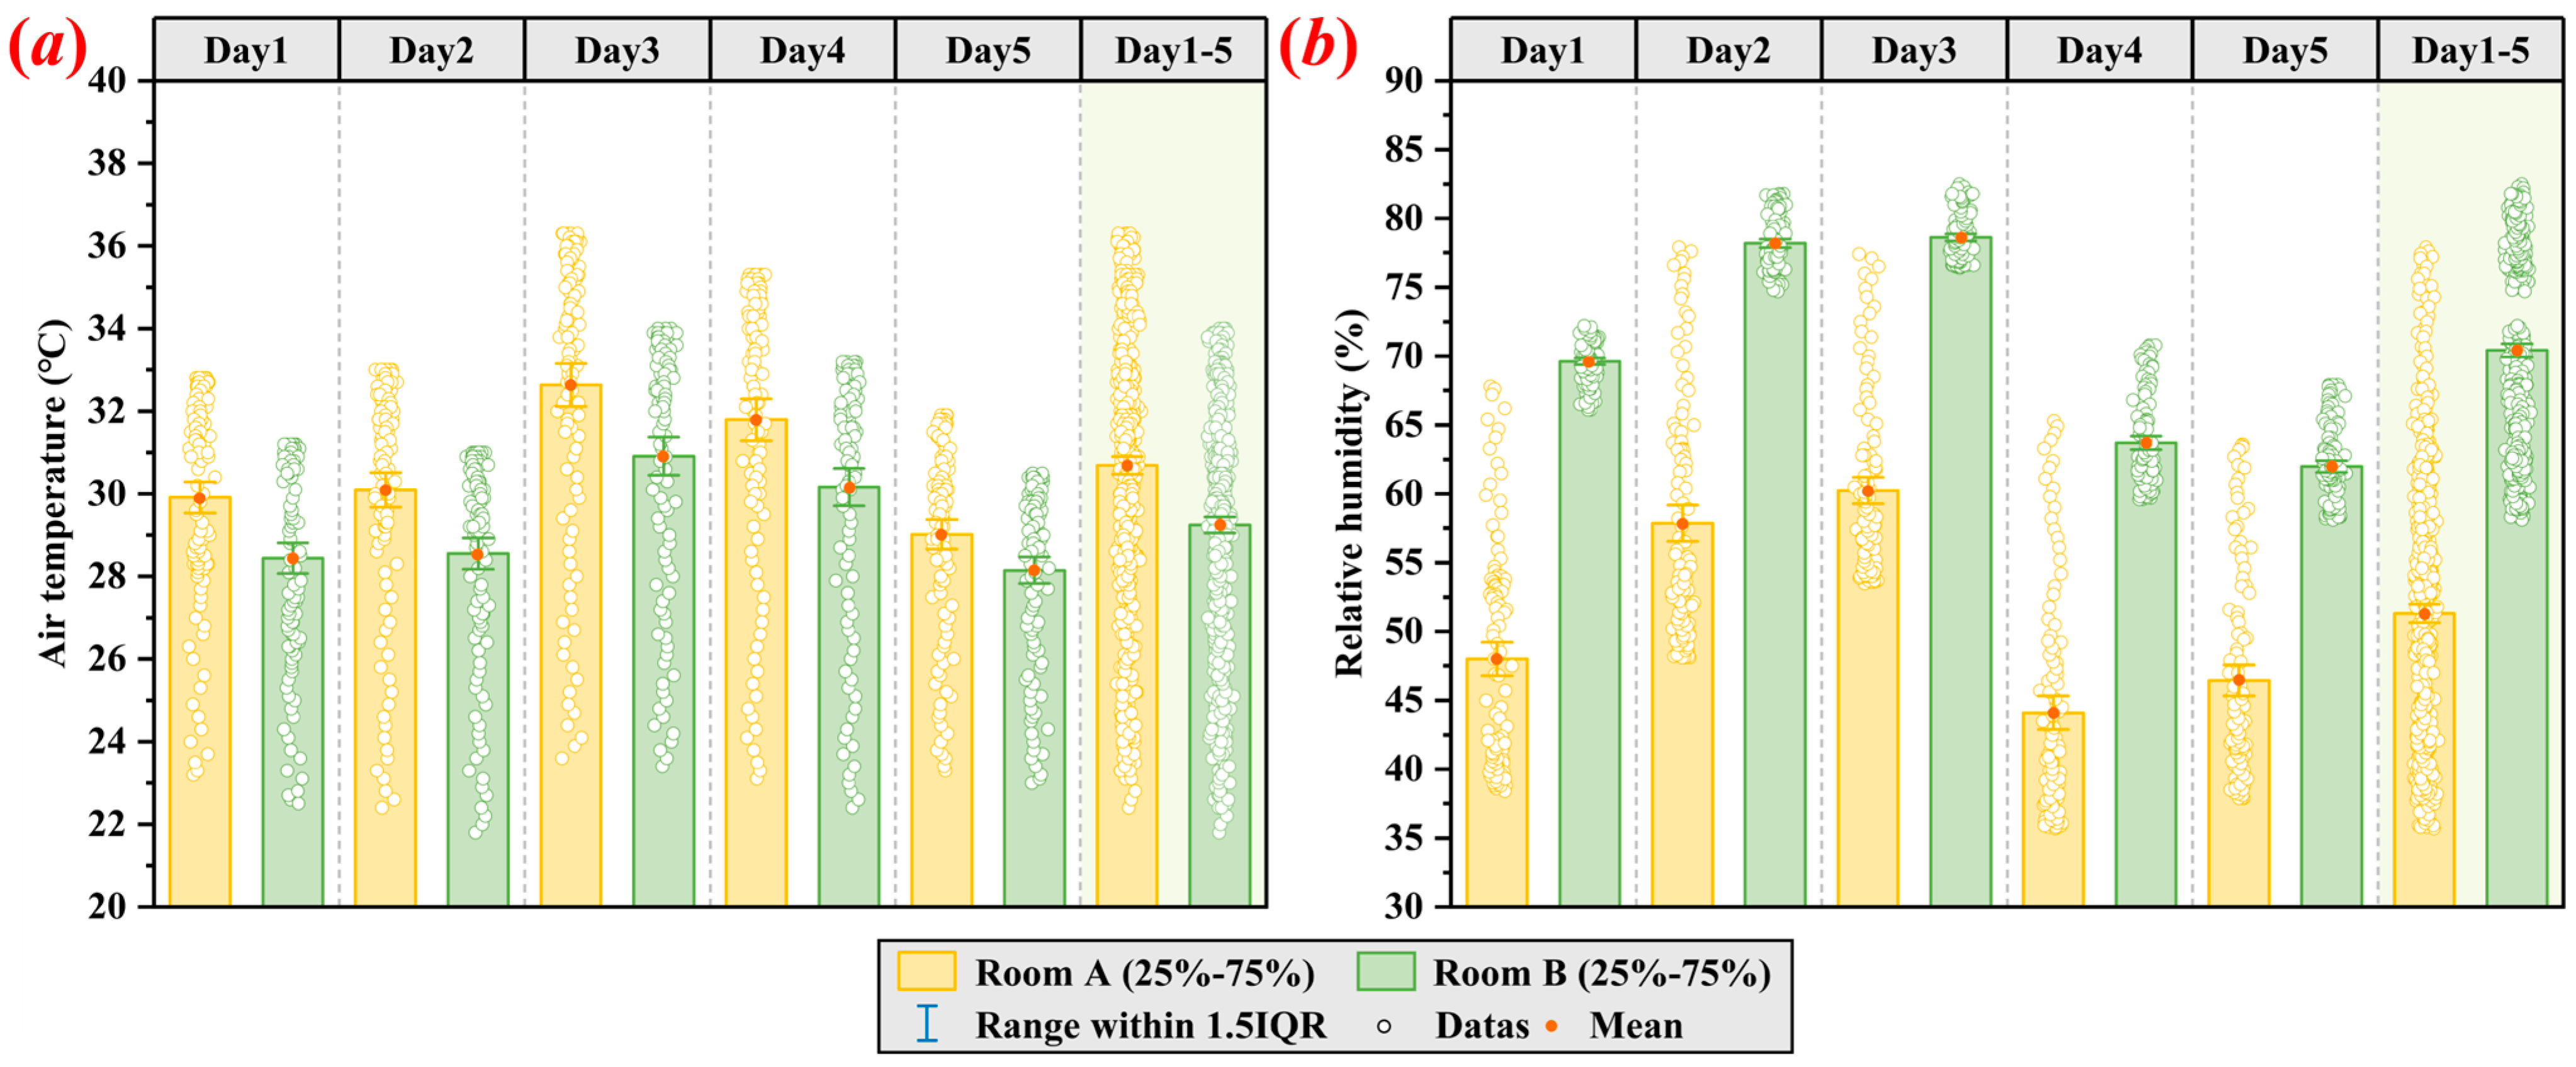
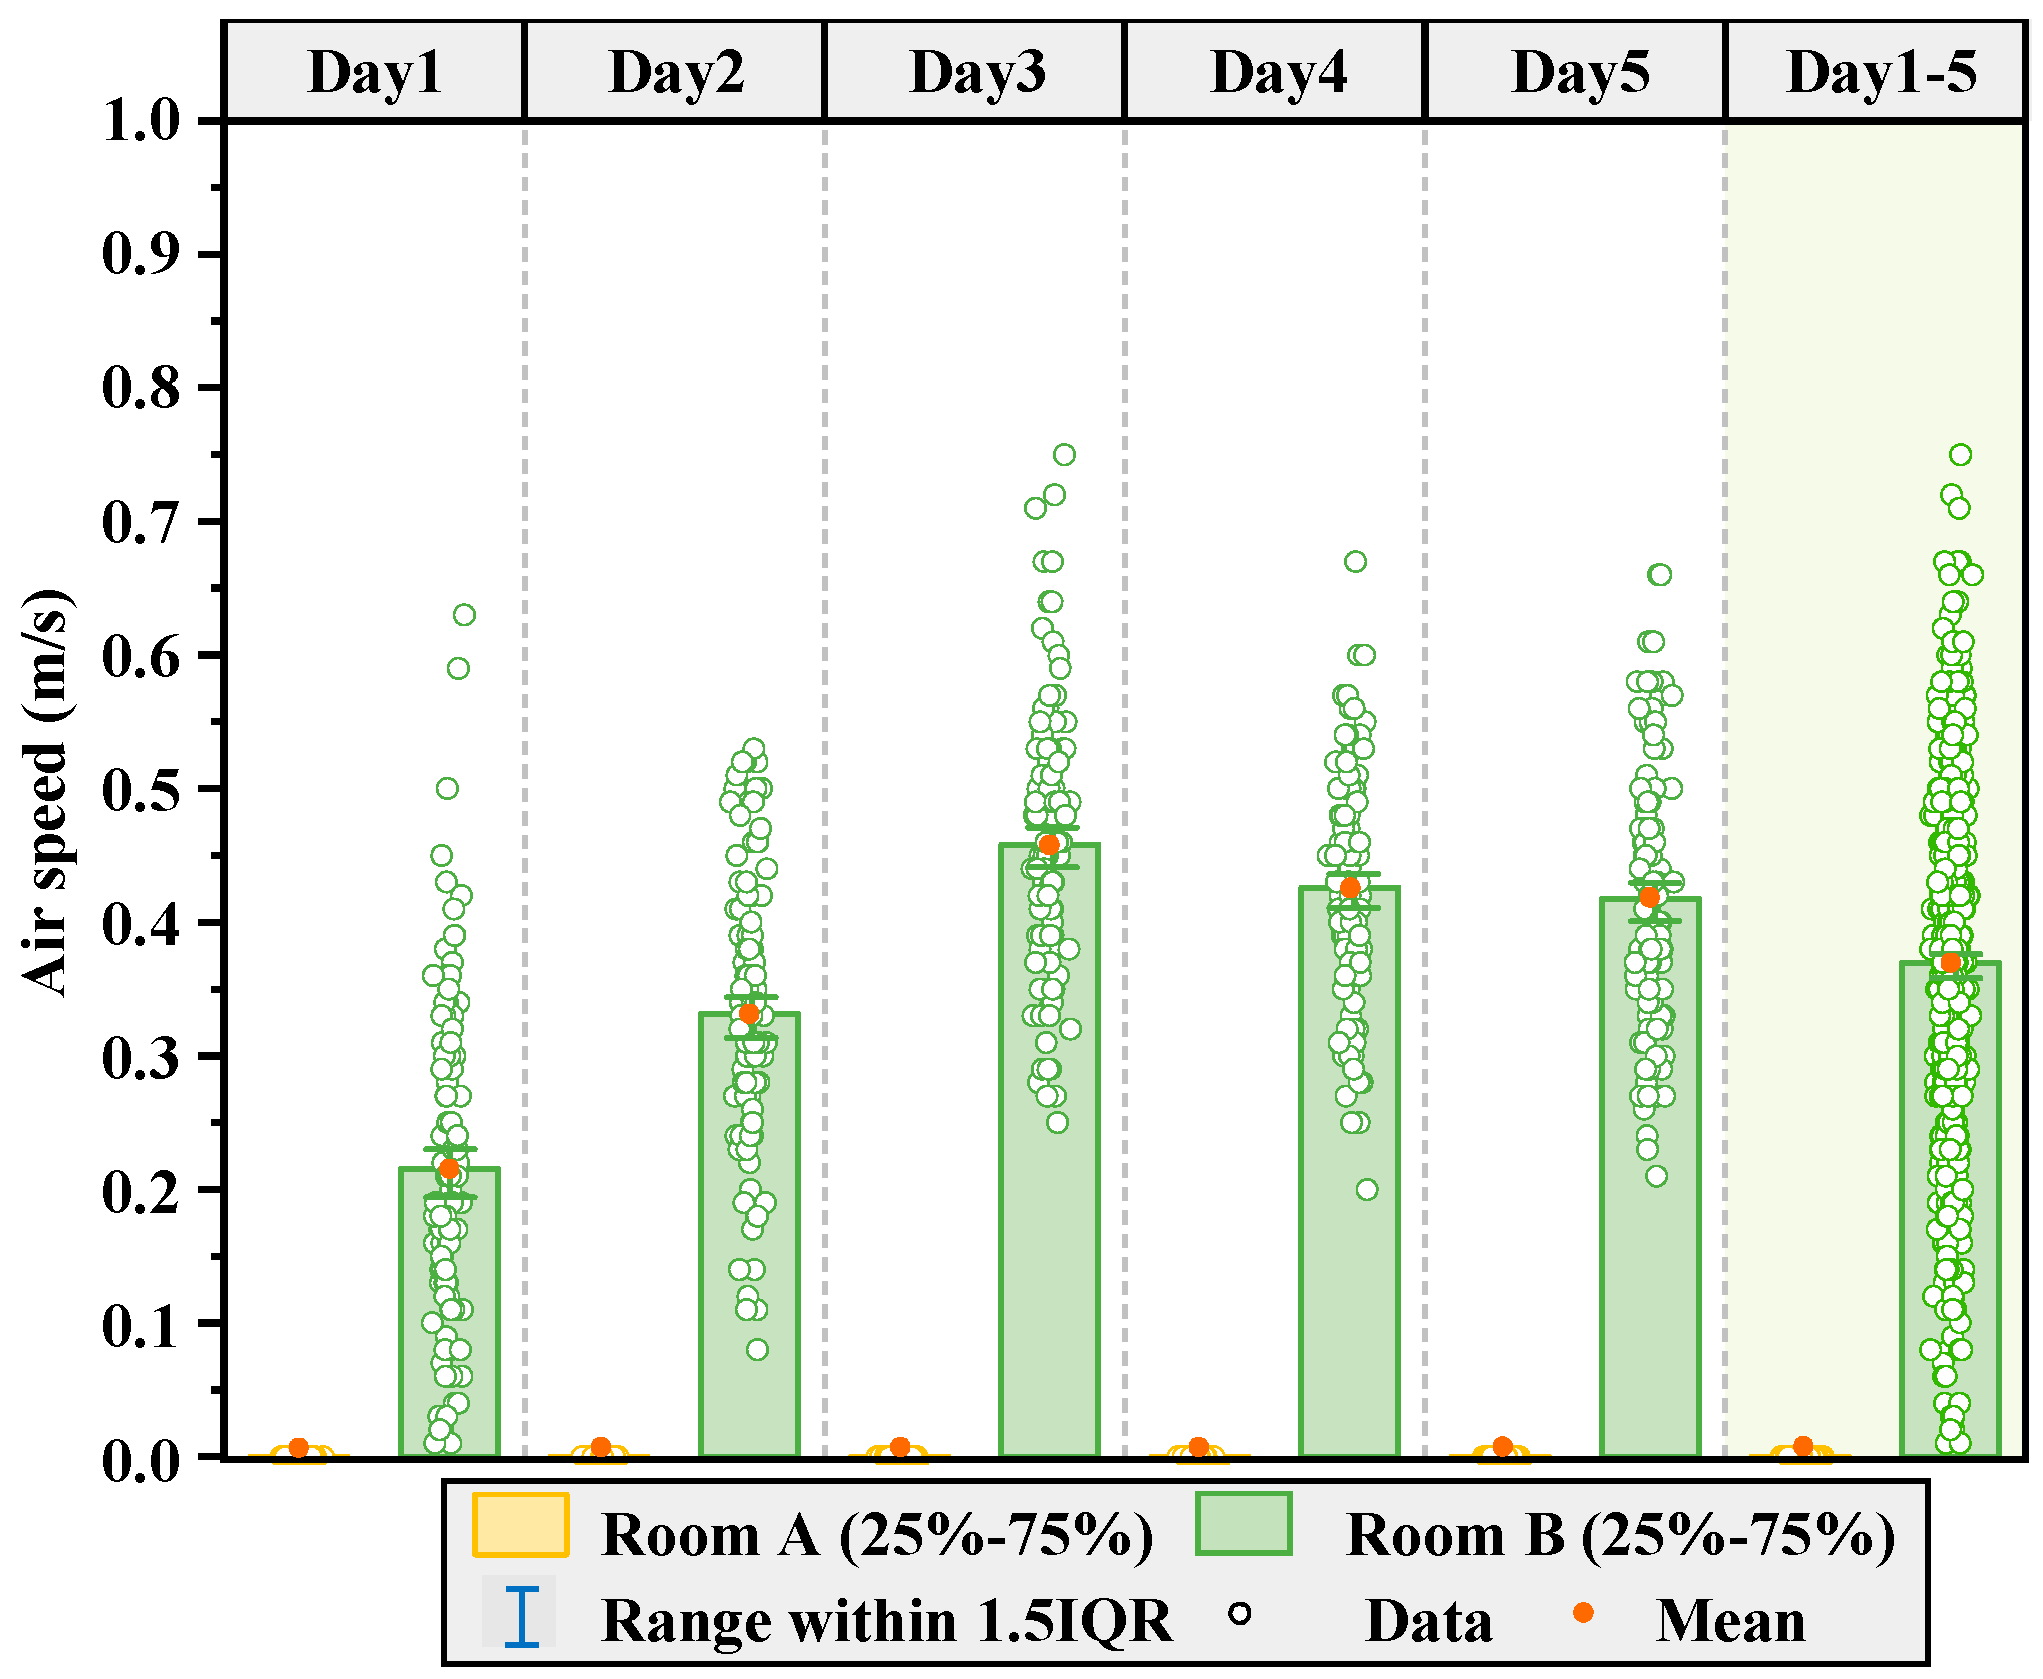
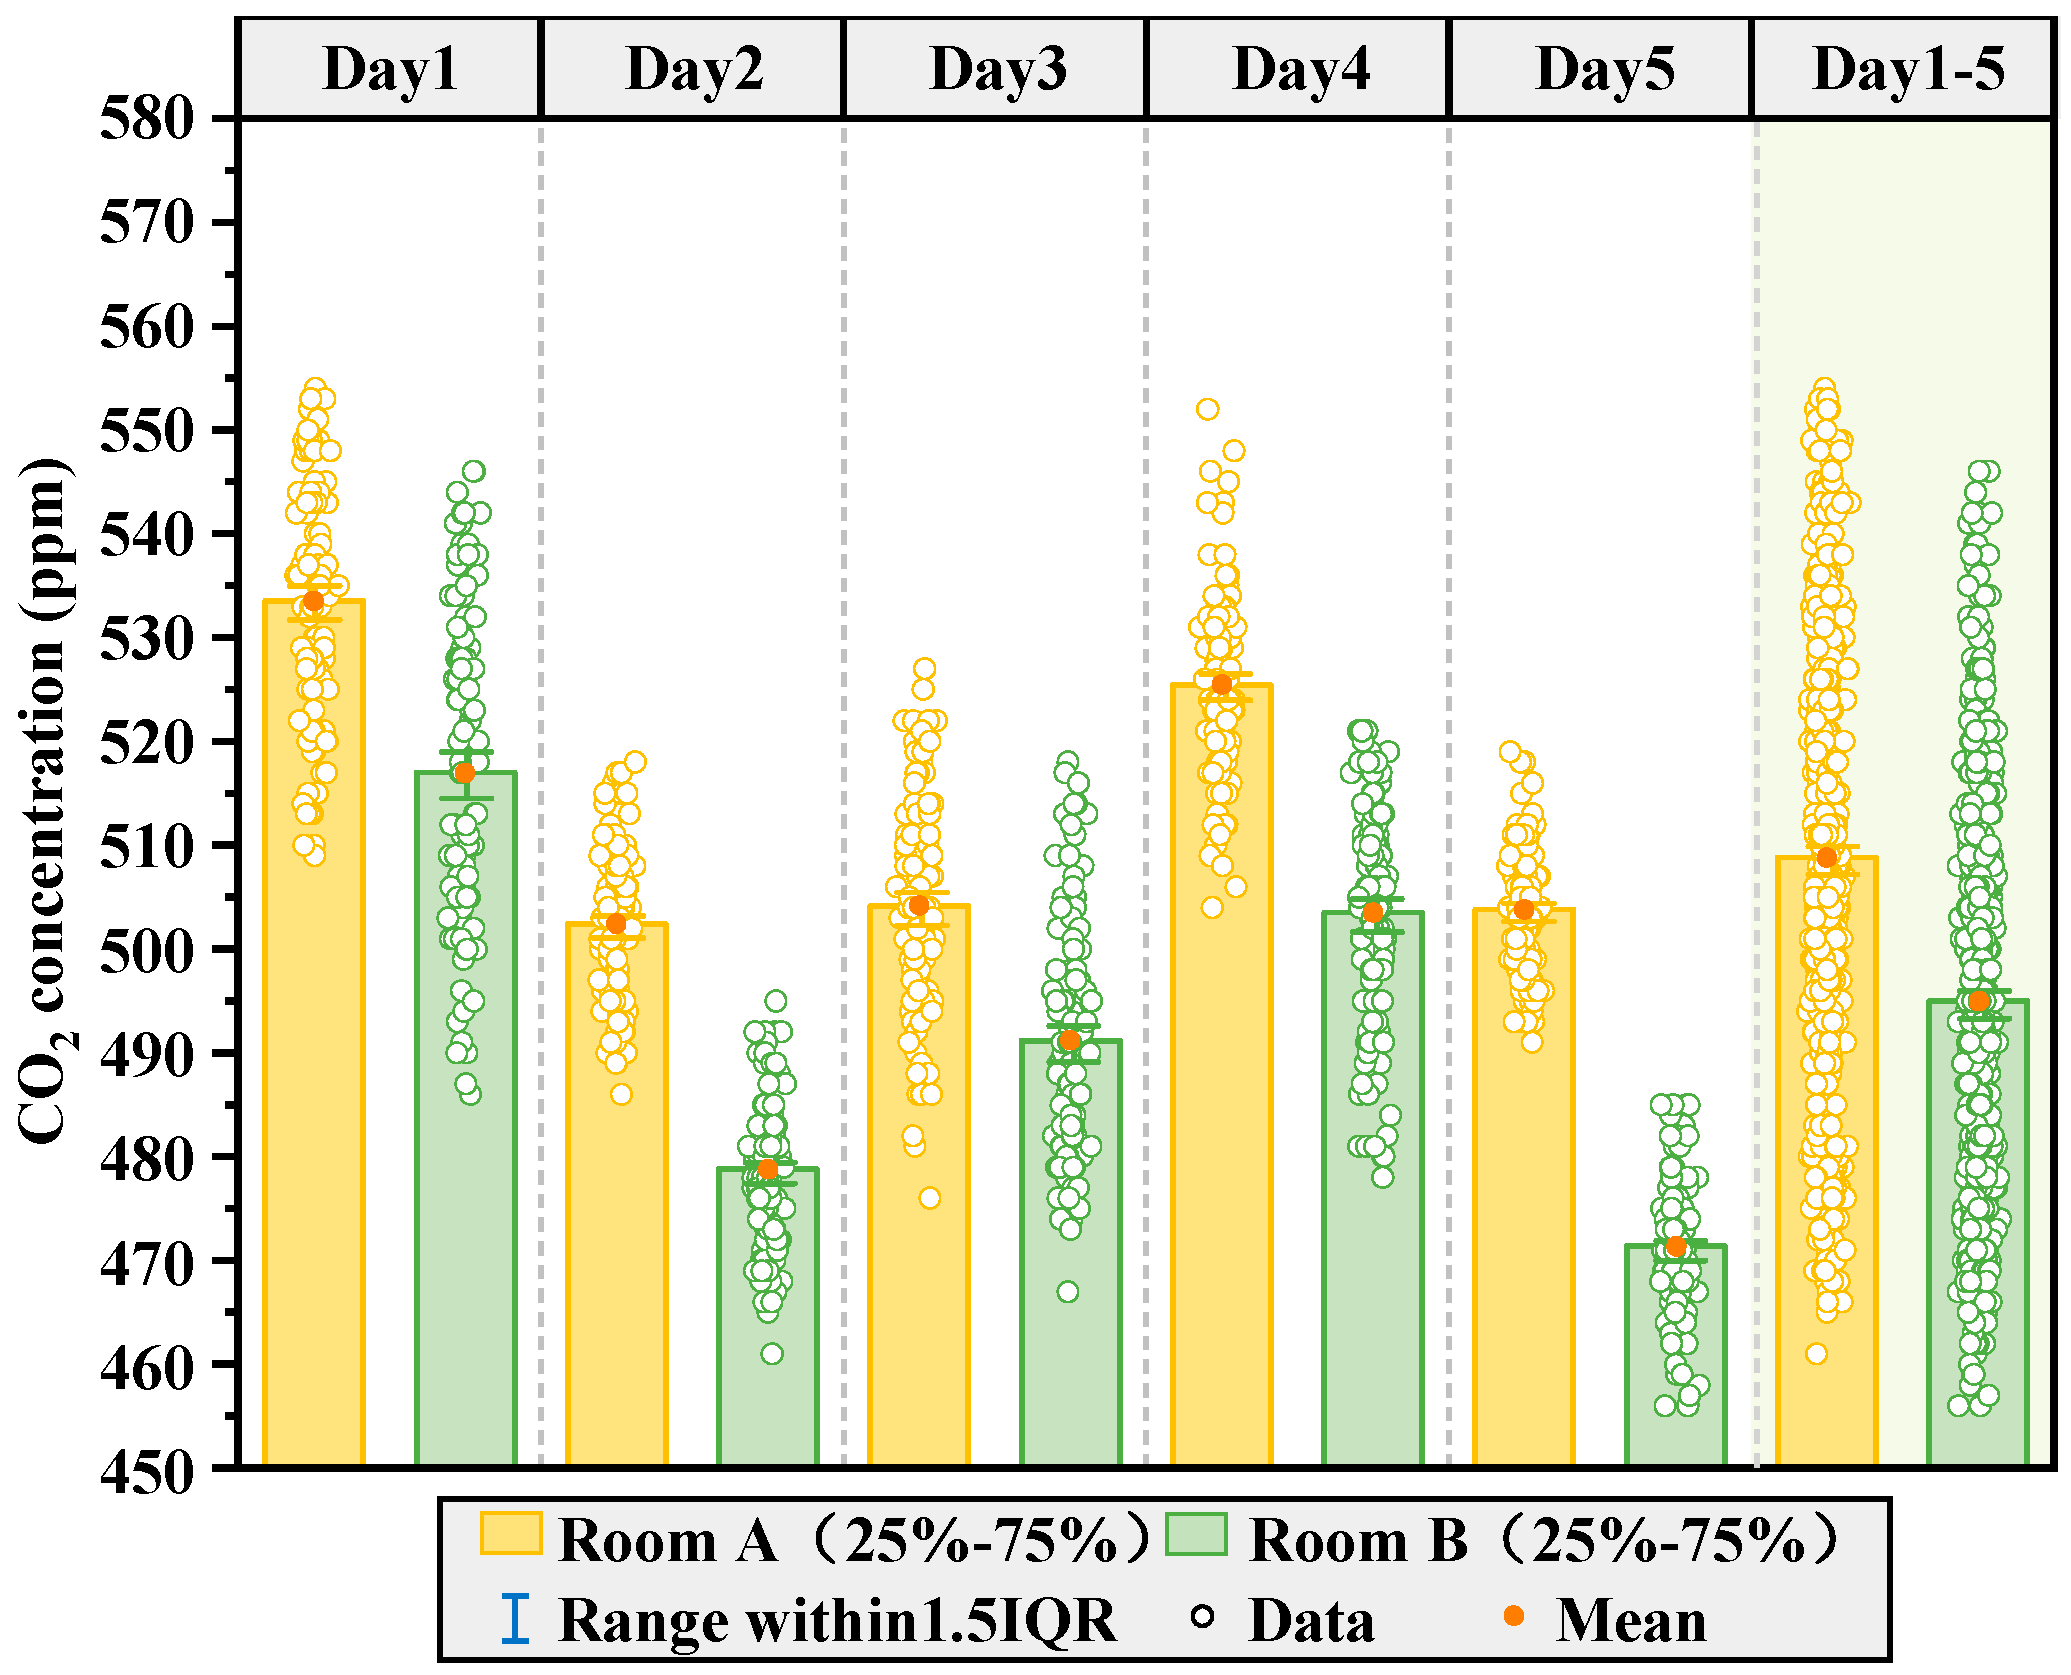
3.1. Analysis of Indoor Environment Monitoring Results

Indoor temperature and relative humidity were both important indicators of the thermal environment in the evaluation room and important factors affecting indoor thermal comfort. Figure 7 shows the comparison of temperature and relative humidity in Room A and Room B during the transition season. From the temperature perspective, the indoor temperature in Room A ranged from 22 °C to 37 °C, with an average value of 30.69 °C. The indoor temperature in Room B ranged from 21 °C to 34 °C, with an average value of 29.24 °C. It showed that the LW-V system lowered the indoor air temperature by 1.45 °C, which was due to the removal of heat from the air by plant transpiration. In addition, the use of mechanical ventilation not only enhances air circulation but also facilitates convective heat transfer and promotes evaporation, thereby effectively reducing indoor temperature and enhancing overall comfort.
As shown in Figure 7b, the LW-V system obviously increased the indoor relative humidity. In Room A, the indoor relative humidity was maintained within the range of 35% to 77%, with an average of 51.32%. Similarly, in Room B, the relative humidity ranged from 56% to 84%, with an average of 70.42%. The average relative humidity in Room B was approximately 19.1% higher than that in Room A, mainly due to the transpiration of plants in the living wall and water evaporation processes. These natural mechanisms effectively augment air moisture content and consequently elevate relative humidity levels. In summary, the LW-V system exhibited a notable capacity for regulating humidity in the experiment. Meng et al. had findings contrary to those of this study in their research combining a living wall with air-conditioning. The average relative humidity in Room A was 86%, which was 2.6% higher than Room B’s 84.3%. This difference can be attributed to the higher atmospheric humidity levels during summer in Qingdao. By utilizing the strong vitality of plants and reducing watering frequency, indoor air can naturally absorb moisture and alleviate indoor humidity.
In addition to indoor temperature and relative humidity, indoor air speed is also one of the factors affecting indoor thermal comfort. Figure 8 compares the indoor air speed of Room A and Room B during the experiment. It can be seen from the figure that there was no fresh air volume in Room A, while the air speed in Room B was maintained at 0.2–0.65 m/s. The average air speed in Room B was 0.37 m/s. This is due to mechanical ventilation, which speeds up the indoor air flow. Proper airflow can play a role in accelerating the indoor air circulation and renewing the indoor air, thus creating a more comfortable indoor environment.
CO2 concentration level is an important indicator of indoor air quality, and a high CO2 concentration can affect the occurrence of sick building syndrome, thus affecting people’s health. An LW-V system can absorb CO2 and release O2 from the photosynthesis of plants and play a role in renewing indoor air. Figure 9 compares the indoor CO2 concentration in Room A and Room B during the experiment. As shown, the CO2 concentration in Room A was maintained between 465.09 ppm and 555.32 ppm, with an average CO2 concentration of 508.81 ppm. The CO2 concentration in Room B was maintained between 455.23 ppm and 545.12 ppm, with an average CO2 concentration of 494.98 ppm. The average CO2 in Room B was 13.83 ppm lower than the average CO2 concentration in Room A. This is because the plants in Room A photosynthesized and absorbed CO2 from the room. The photosynthetic efficiency of plants is related to the indoor CO2 concentration. In a real indoor space, human respiration leads to an increase in CO2 levels. Therefore, it can be inferred that the CO2 absorption rate of the LW-V system would be elevated, which shows that Room B had the potential to effectively enhance and improve indoor air quality through plant-mediated photosynthetic processes.

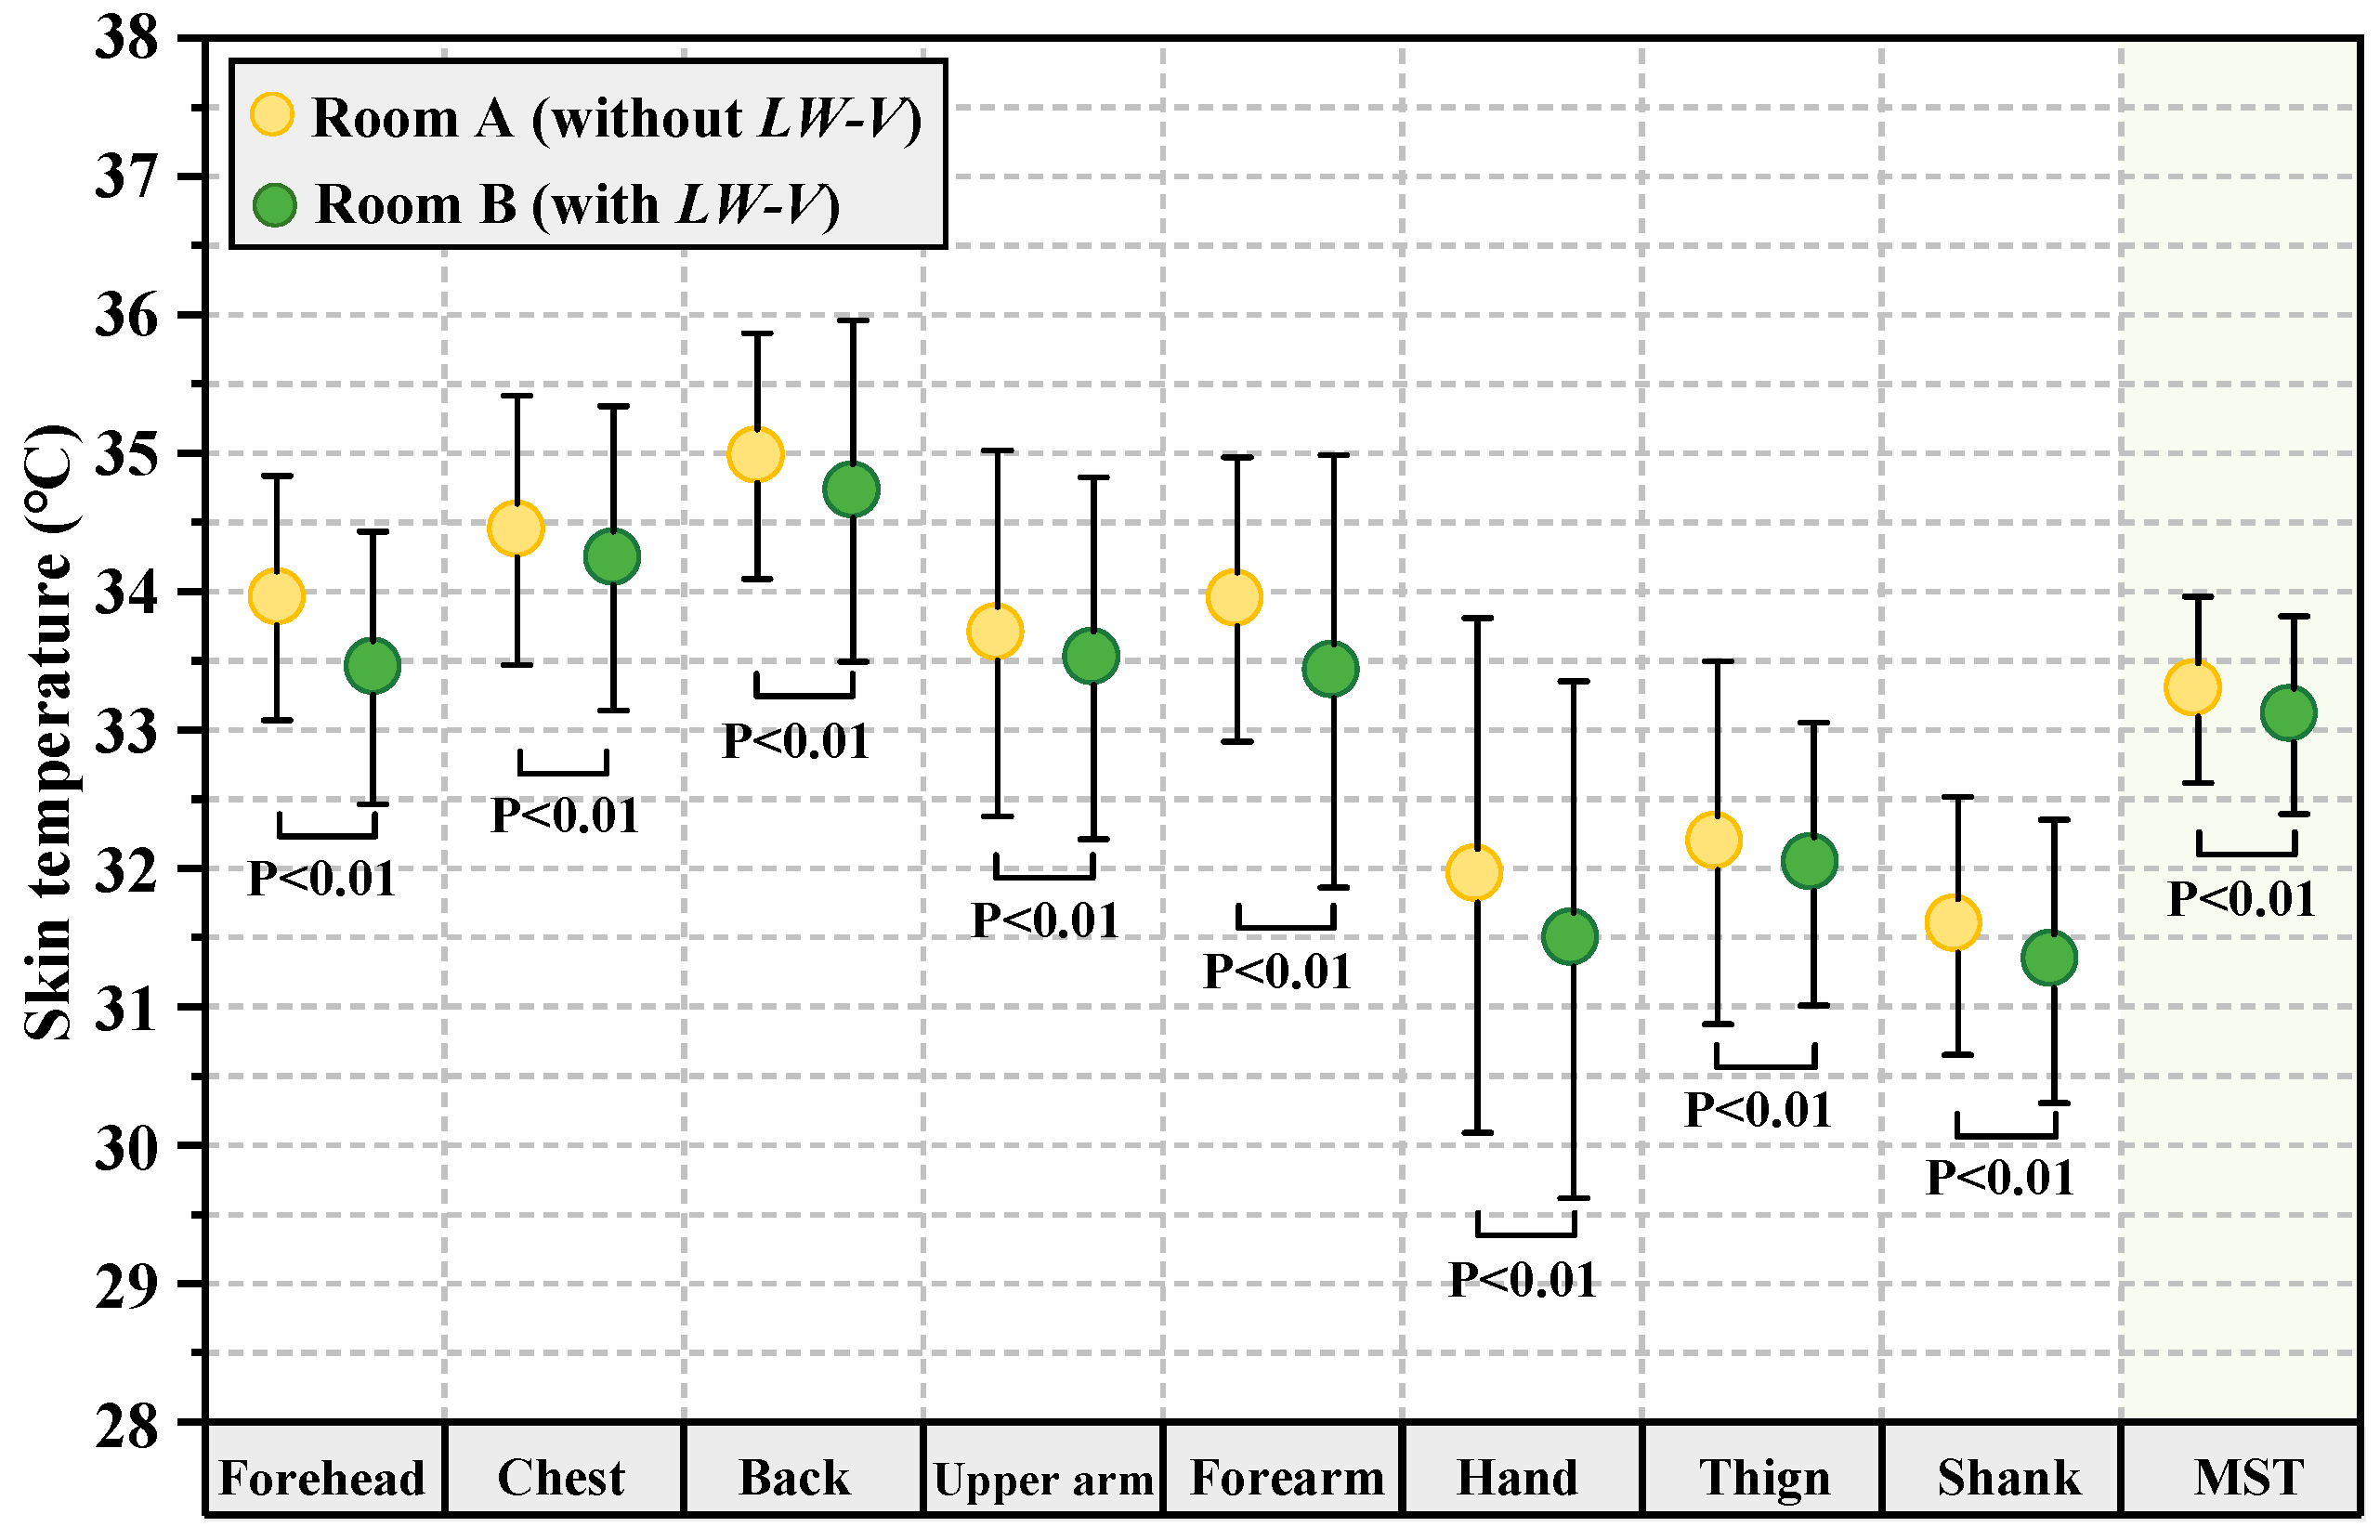
3.2. Analysis of Skin Temperature Monitoring Results

Human thermal sensation is related to human skin temperature, and it is an important physiological indicator to characterize the thermal physiological response of the human body. Therefore, the skin temperature of the subjects was monitored in this experiment. Considering the operability of the experiment, an eight-point test method was adopted [37], and the measurement sites were forehead, chest, back, upper arm, forearm, hand, thigh, and shank, in that order. Then, the mean skin temperature was obtained by the weighted average of the skin temperature of each part, and the weighted calculation formula was as follows:
Tsk = 0.07T1 + 0.175T2 + 0.175T3 + 0.07T4 + 0.07T5 + 0.05T6 + 0.19T7 + 0.2T8
In the formula, Tsk denotes mean skin temperature (MST) in °C, and the body parts represented by T1, T2, T3, T4, T5, T6, T7, and T8 are forehead, chest, back, upper arm, forearm, hand, thigh, and shank, respectively.
Calculated by the formula, the MST of the subjects in Room A was 33.31 °C, and that of the subjects in Room B was 33.13 °C. That of the subjects in Room B was 0.18 °C lower than that in the subjects in Room A, as shown in Figure 10. The experimental results show that the MST of the subjects in Room B was closer to the neutral MST of 33.2 °C. A clear linear correlation exists between skin temperature and thermal sensation, with the term “neutral skin temperature” referring to the specific skin temperature at which thermal sensation is perceived as neutral [38]. The experimental results demonstrate that the LW-V system effectively regulated the thermal comfort of the room during the transitional season.

3.3. Analysis of Subjective Questionnaire Survey Results

A questionnaire survey can directly reflect individuals’ responsiveness to the environment and can reflect individual needs. Figure 11 compares the subjective voting on indoor thermal sensation and thermal preference in Room A and Room B. As shown, the thermal sensation and thermal preference voting results of the two rooms were quite different. The overall thermal sensation vote for Room A was 0.7, which was close to “Slightly warm (+1)”. The voting gradually deviated from “Neutral (0)” and moved closer to “Slightly warm (+1)” as the duration of time the subjects spent inside the room increased. The overall thermal sensation of Room B was −0.51, which was between “Neutral (0)” and “Slightly cool (−1)”. With the passage of time during the experiment, the voting result was gradually closer to “Neutral (0)”. In comparison, Room B exhibited a more favorable trend in thermal sensation rating, which shows that the LW-V system had the potential to improve the room temperature. From the temperature preference, the overall voting result of Room B was −0.4, which was between ‘‘Unchanged (0)” and “Cooler (−1)”, while the overall voting result for temperature preference of Room A was 0.23, which was between “Unchanged (0)” and “Warmer (+1)”. This indicates that the temperature of Room B was more satisfying to the subjects, which is consistent with the indoor thermal sensation of the subjects in Figure 11a.
Figure 12 compares the subjects’ vote on the indoor humid sensation and indoor humidity preference in Room A and Room B during the transitional season. As shown, the humid sensation and humidity preference voting results of the two rooms were quite different. For indoor humid sensation, the overall humid sensation vote of Room A was 0.65, which was close to “Slightly dry (+1)”. The overall humid sensation vote in Room B was −0.18, which was close to “Neutral (0)”. With the passage of time during the experiment, Room B’s voting result was gradually closer to “Neutral (0)”. The subjects of the humid sensation evaluation in Room B rated the humidity as significantly higher than the subjects in Room A, which is consistent with the results of the test of the indoor relative humidity in Figure 7b, thus indicating that the LW-V system had the potential to enhance indoor relative humidity. For indoor humidity preference, the overall vote in Room A was −0.45, which was between “Unchanged (0)” and “Humid (−1)”. The overall vote for humidity preference in Room B was −0.04, which was close to “Unchanged (0)”, and as the length of time subjects stay in the room increased, the voting score was always close to “Unchanged (0)”. According to the voting results, the humidity level of Room B was more popular and better met people’s demand for humidity, which reflects the positive adjustment effect of the LW-V system on indoor humidity.
Figure 13 compares the subjects’ vote about the indoor air speed sensation in Room A and Room B during the transitional season. As shown, the subjects’ subjective feelings of the air speed sensation in the two rooms varied greatly. The overall voting result of Room A was 0.03, closed to “Still air speed (0)”, and that of Room B was 1.31, closed to “Low air speed (+1)”. The LW-V system significantly increased indoor air speed.
Figure 14 compares the subjects’ vote on air freshness in Room A and Room B. As shown, the voting result for Room A was −0.29, which was between “Neutral (0)” and “Stale fresh (−1)”. During the experimental period, the voting result decreased from −0.1 (close to “Neutral (0)”) to −0.53 (between “Neutral (0)” and “Stale fresh (−1)”). The voting result for Room B was 0.8, close to “Fresh (+1)”. The evaluation result of the subjects in Room B was obviously higher than that of the subjects in Room A, which indicates that the LW-V system had the effect of repairing and purifying the indoor air, as well as an effect on human psychology, thus improving the experience of the subjects.
Figure 15 compares the indoor thermal comfort vote of the subjects in Room A and Room B. As shown, the thermal comfort vote for Room B was significantly higher than that for Room A, and there was a significant difference in comfort after 20 min. The overall thermal comfort vote for Room A was −0.23, which was in the range between “Neutral (0)” and “Slightly uncomfortable (−1)”, while the overall thermal comfort vote for Room B was 0.3, which was in the range between “Neutral (0)” and “Slightly comfortable (+1)”. With the passage of time during the experiment, the LW-V system was able to increase the comfort rating in Room B from 0.13 (closed to “Neutral (0)”) to 0.5 (between “Neutral (0)” and “Slightly comfortable (+1)”). In addition, there was a significant difference in indoor thermal comfort level after only 20 min. The combination of Figure 11 and Figure 12 shows that the LW-V system effectively improved the indoor thermal and humidity environment during the transition season through the transpiration of plants, thereby increasing the comfort level of the subjects.
Figure 16 compares the voting results of the subjects’ willingness to stay in Room A and Room B for a long time and their willingness to introduce the LW-V system into the room during the transition season. As shown, 60% of subjects in Room A said they were not willing to accept it, and 40% of subjects were willing to accept it. In Room B, 72% of subjects said they were willing to accept it, and 28% of subjects said they were not willing. The acceptance degree of the subjects in Room B was significantly higher than that of the subjects in Room A, which indicates that the subjects liked Room B more.
People’s subjective willingness must be taken into account when introducing an LW-V system into an indoor environment. From the acceptability voting results, 81.6% of the subjects indicated that they were “Willing (+1)” or “Very willing (+2)” to introduce the LW-V system into the indoor environment, and 10% of the subjects maintained a neutral attitude. According the voting result, most of the subjects were willing to accept the introduction of the LW-V system into the room, which also reflects the positive impact of the LW-V system on improving indoor environmental quality and people’s mental health.

4. Conclusions

In this study, in order to study the effect of an LW-V system on an indoor environment during the transition season, a controlled experiment with a questionnaire was conducted to monitor the indoor environmental parameters, and the skin temperature of the subjects was measured.
(1)
During the transitional season, the LW-V system played a pivotal role in enhancing the indoor thermal environment. It effectively reduced the average room temperature by 1.45 °C, increased relative humidity by 19.1%, regulated indoor air speed to within the range of 0.2–0.65 m/s, and slightly decreased CO2 concentration levels.
(2)
During the transition season, the LW-V system was able to improve the subjects’ skin temperature, decreasing the subject’s mean skin temperature by 0.18 °C to closer to the neutral mean skin temperature of 33.2 °C.
(3)
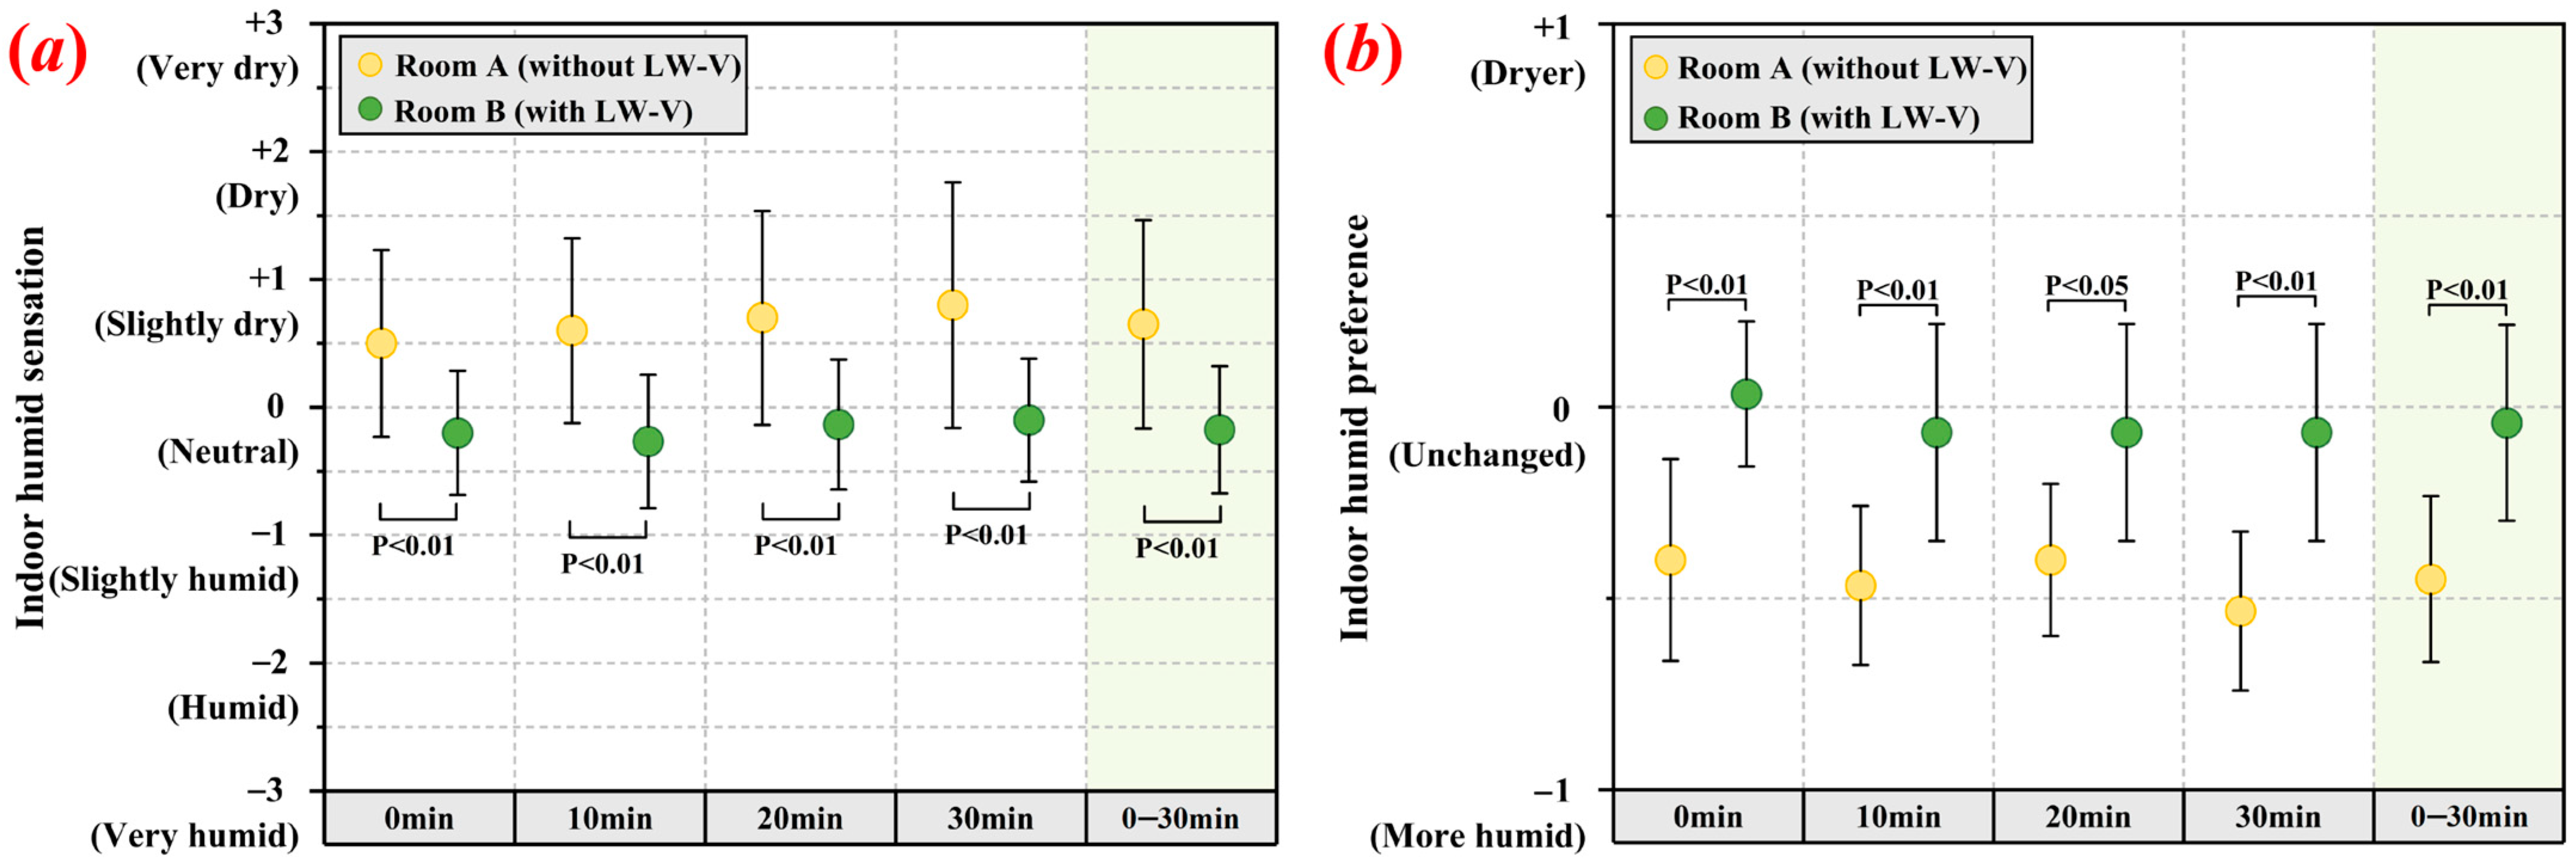
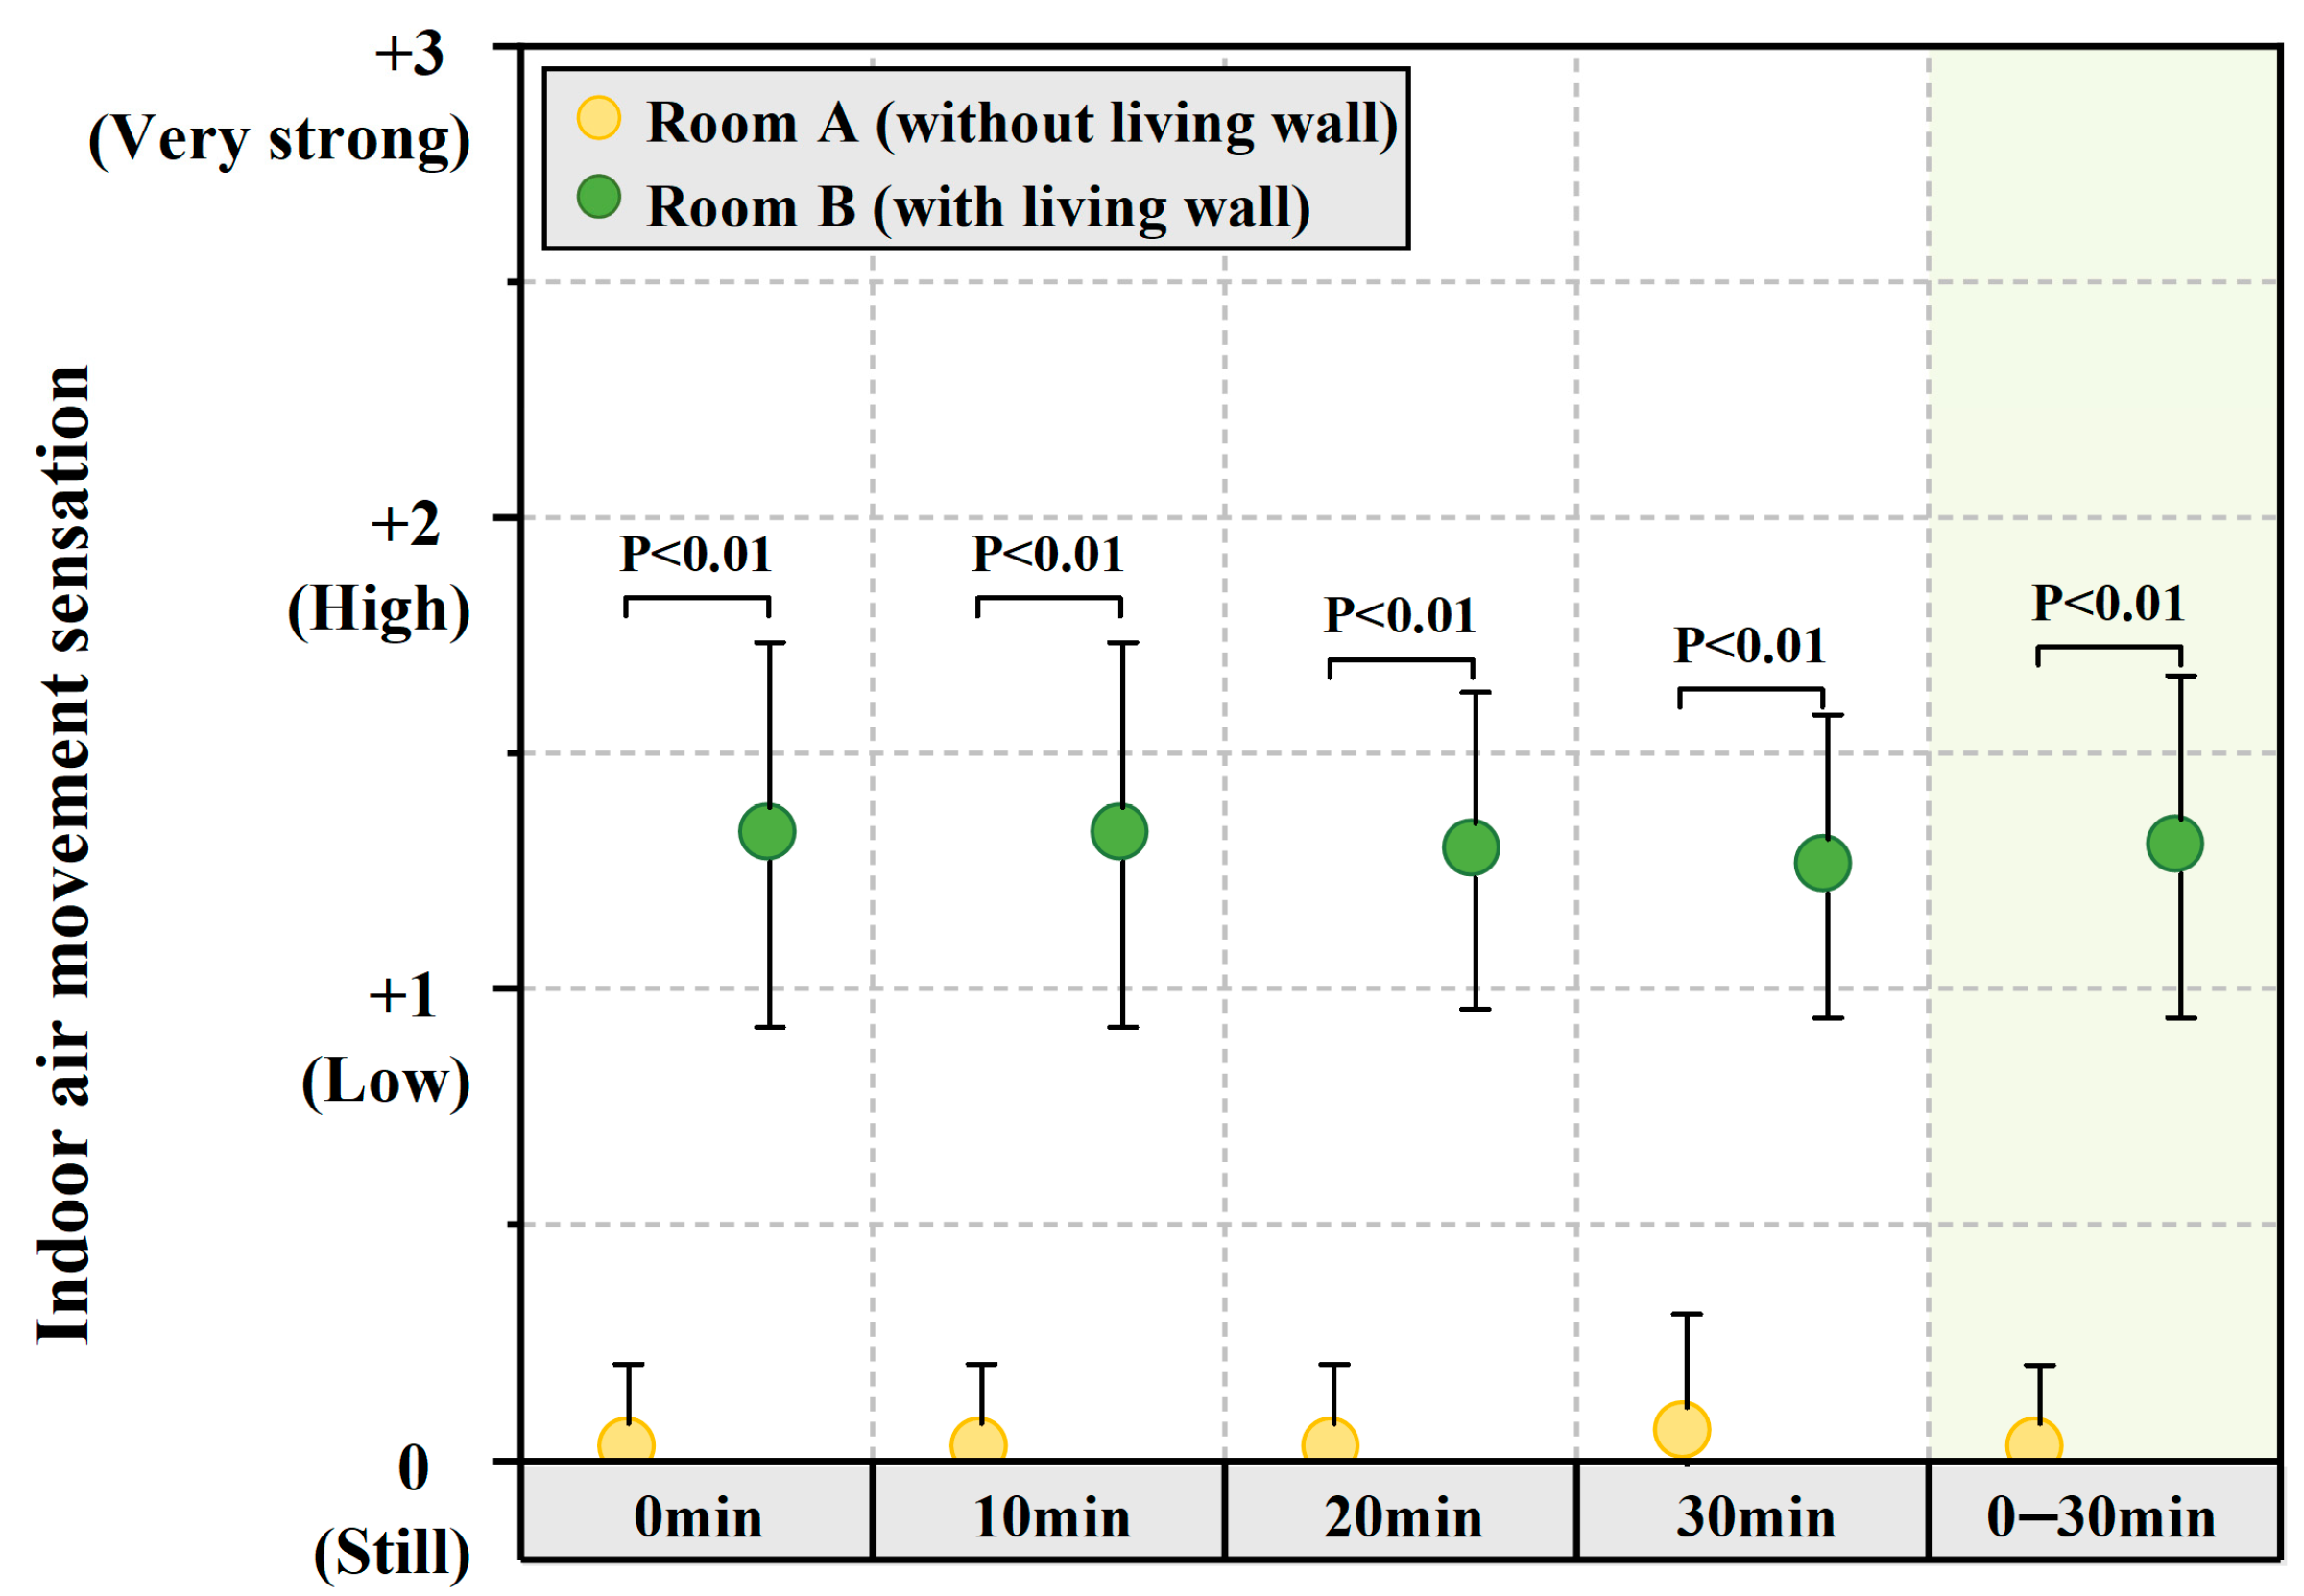
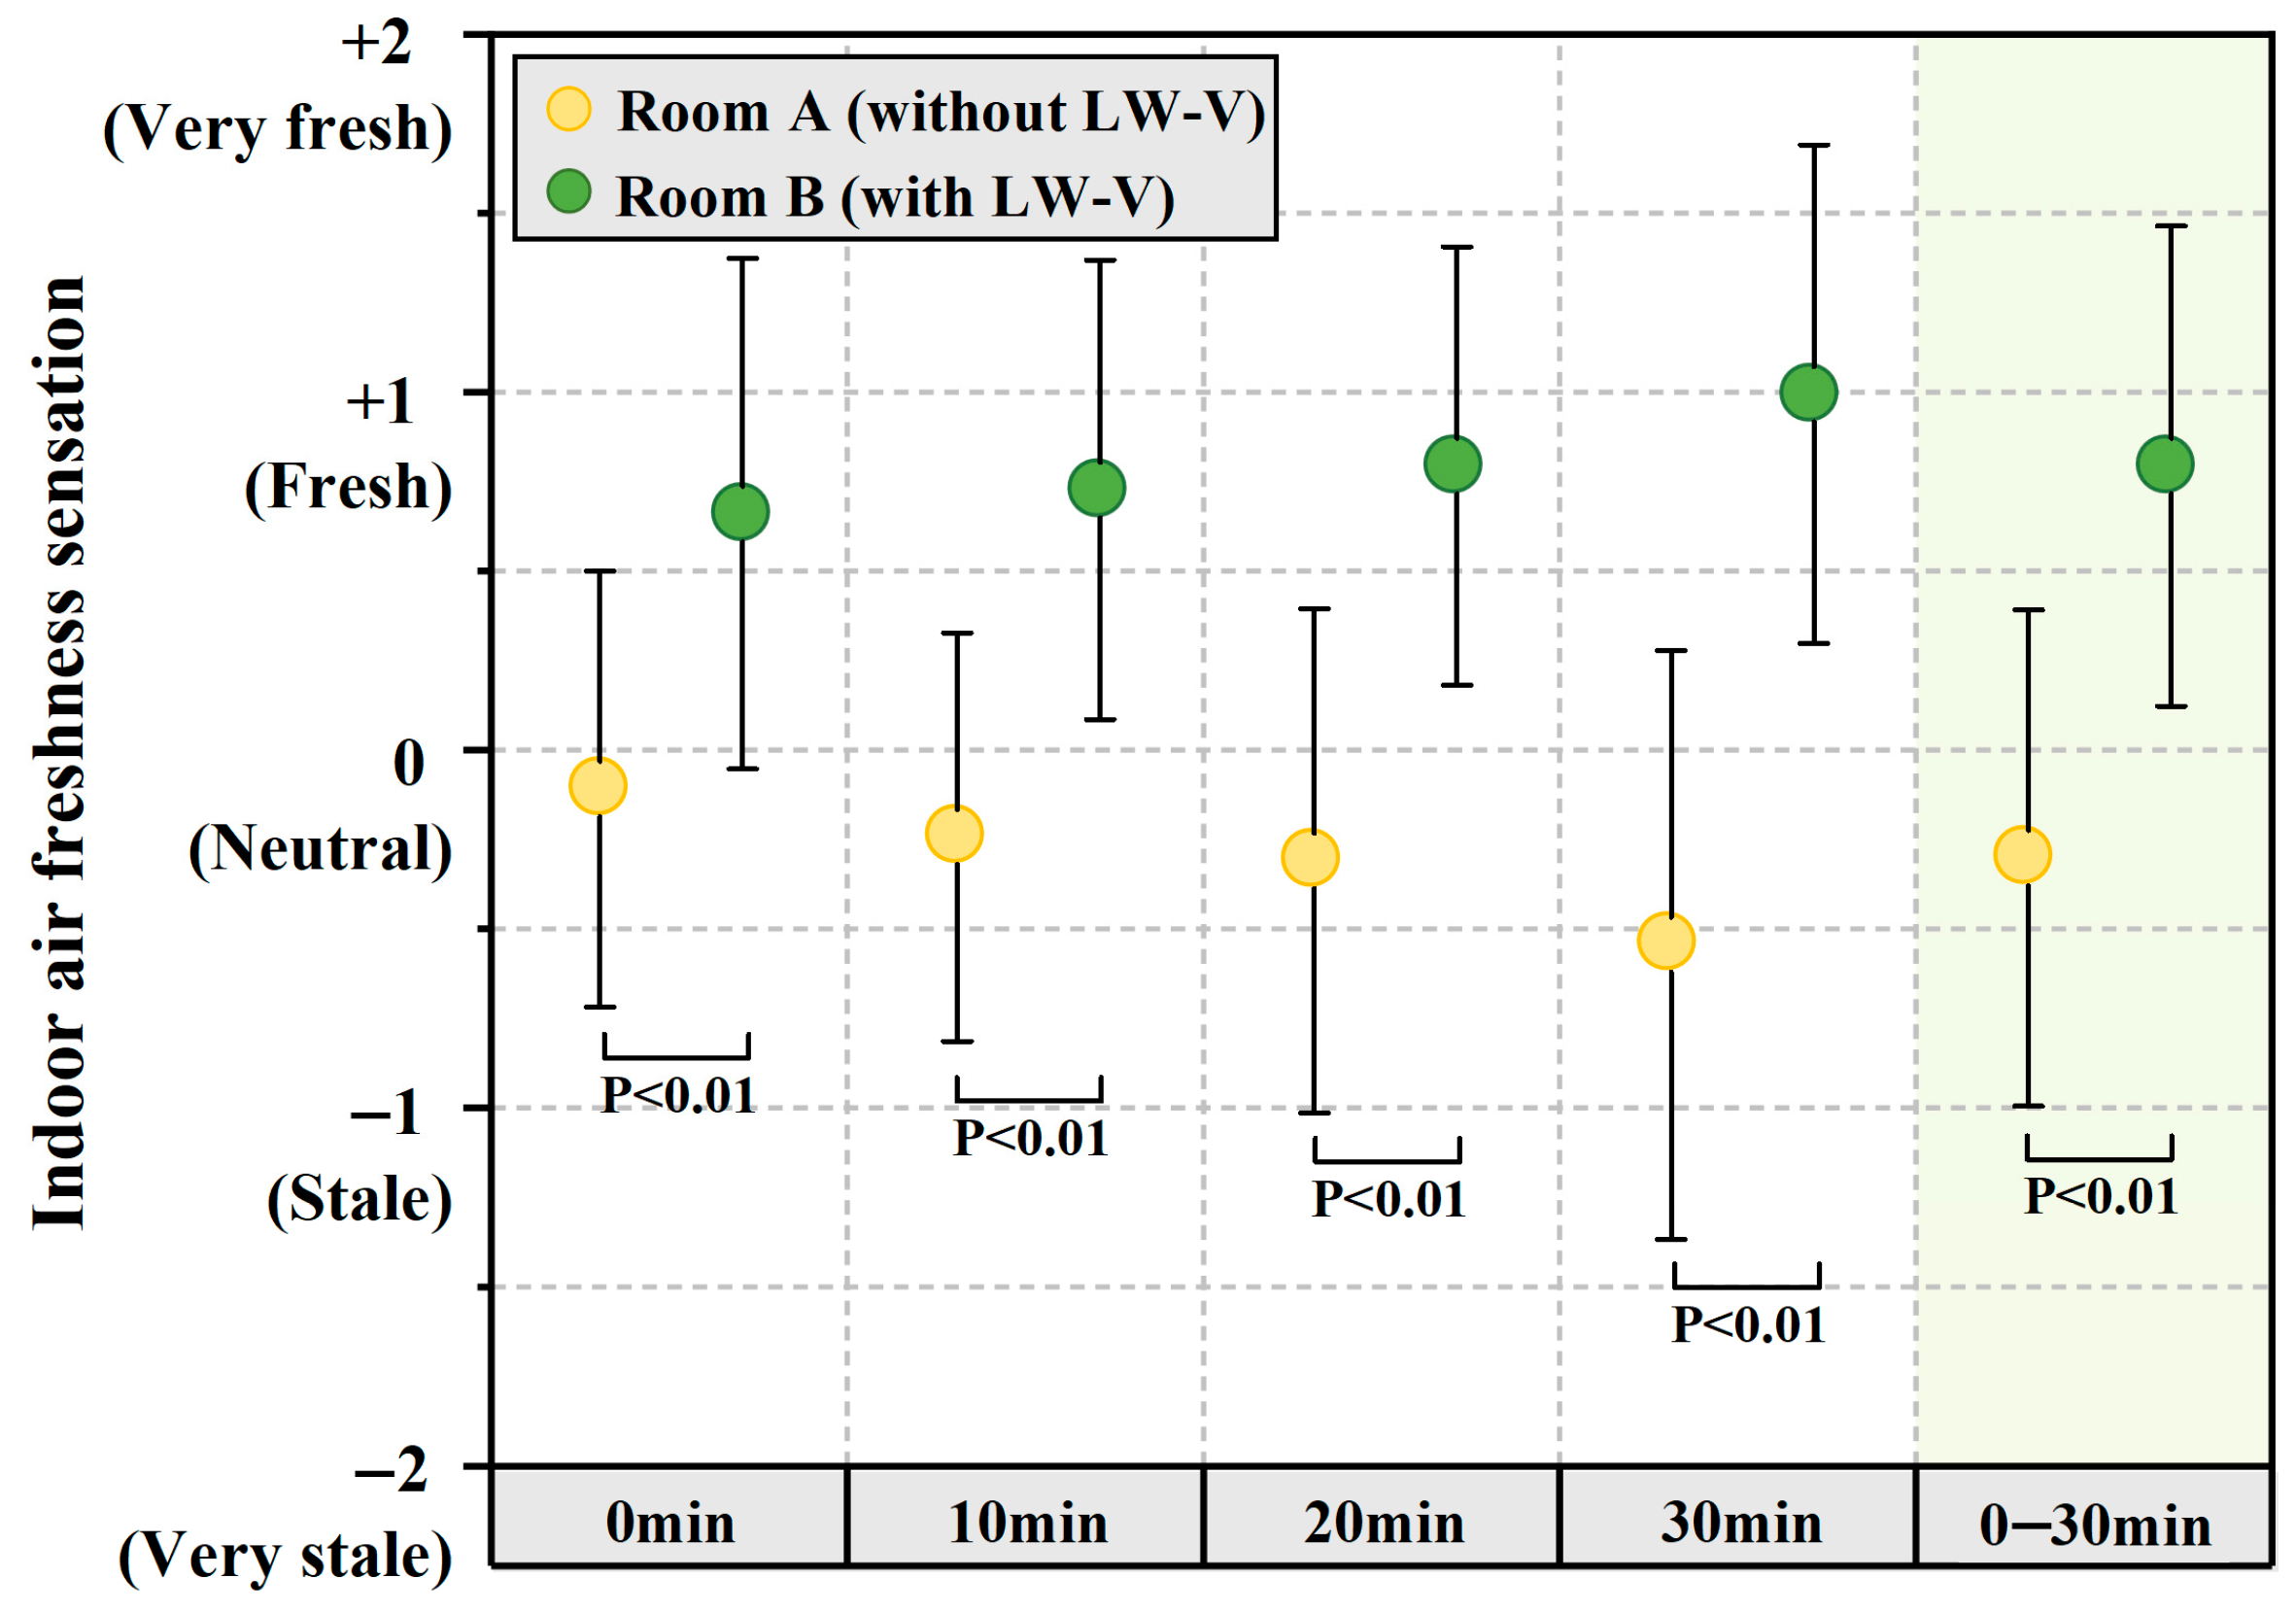
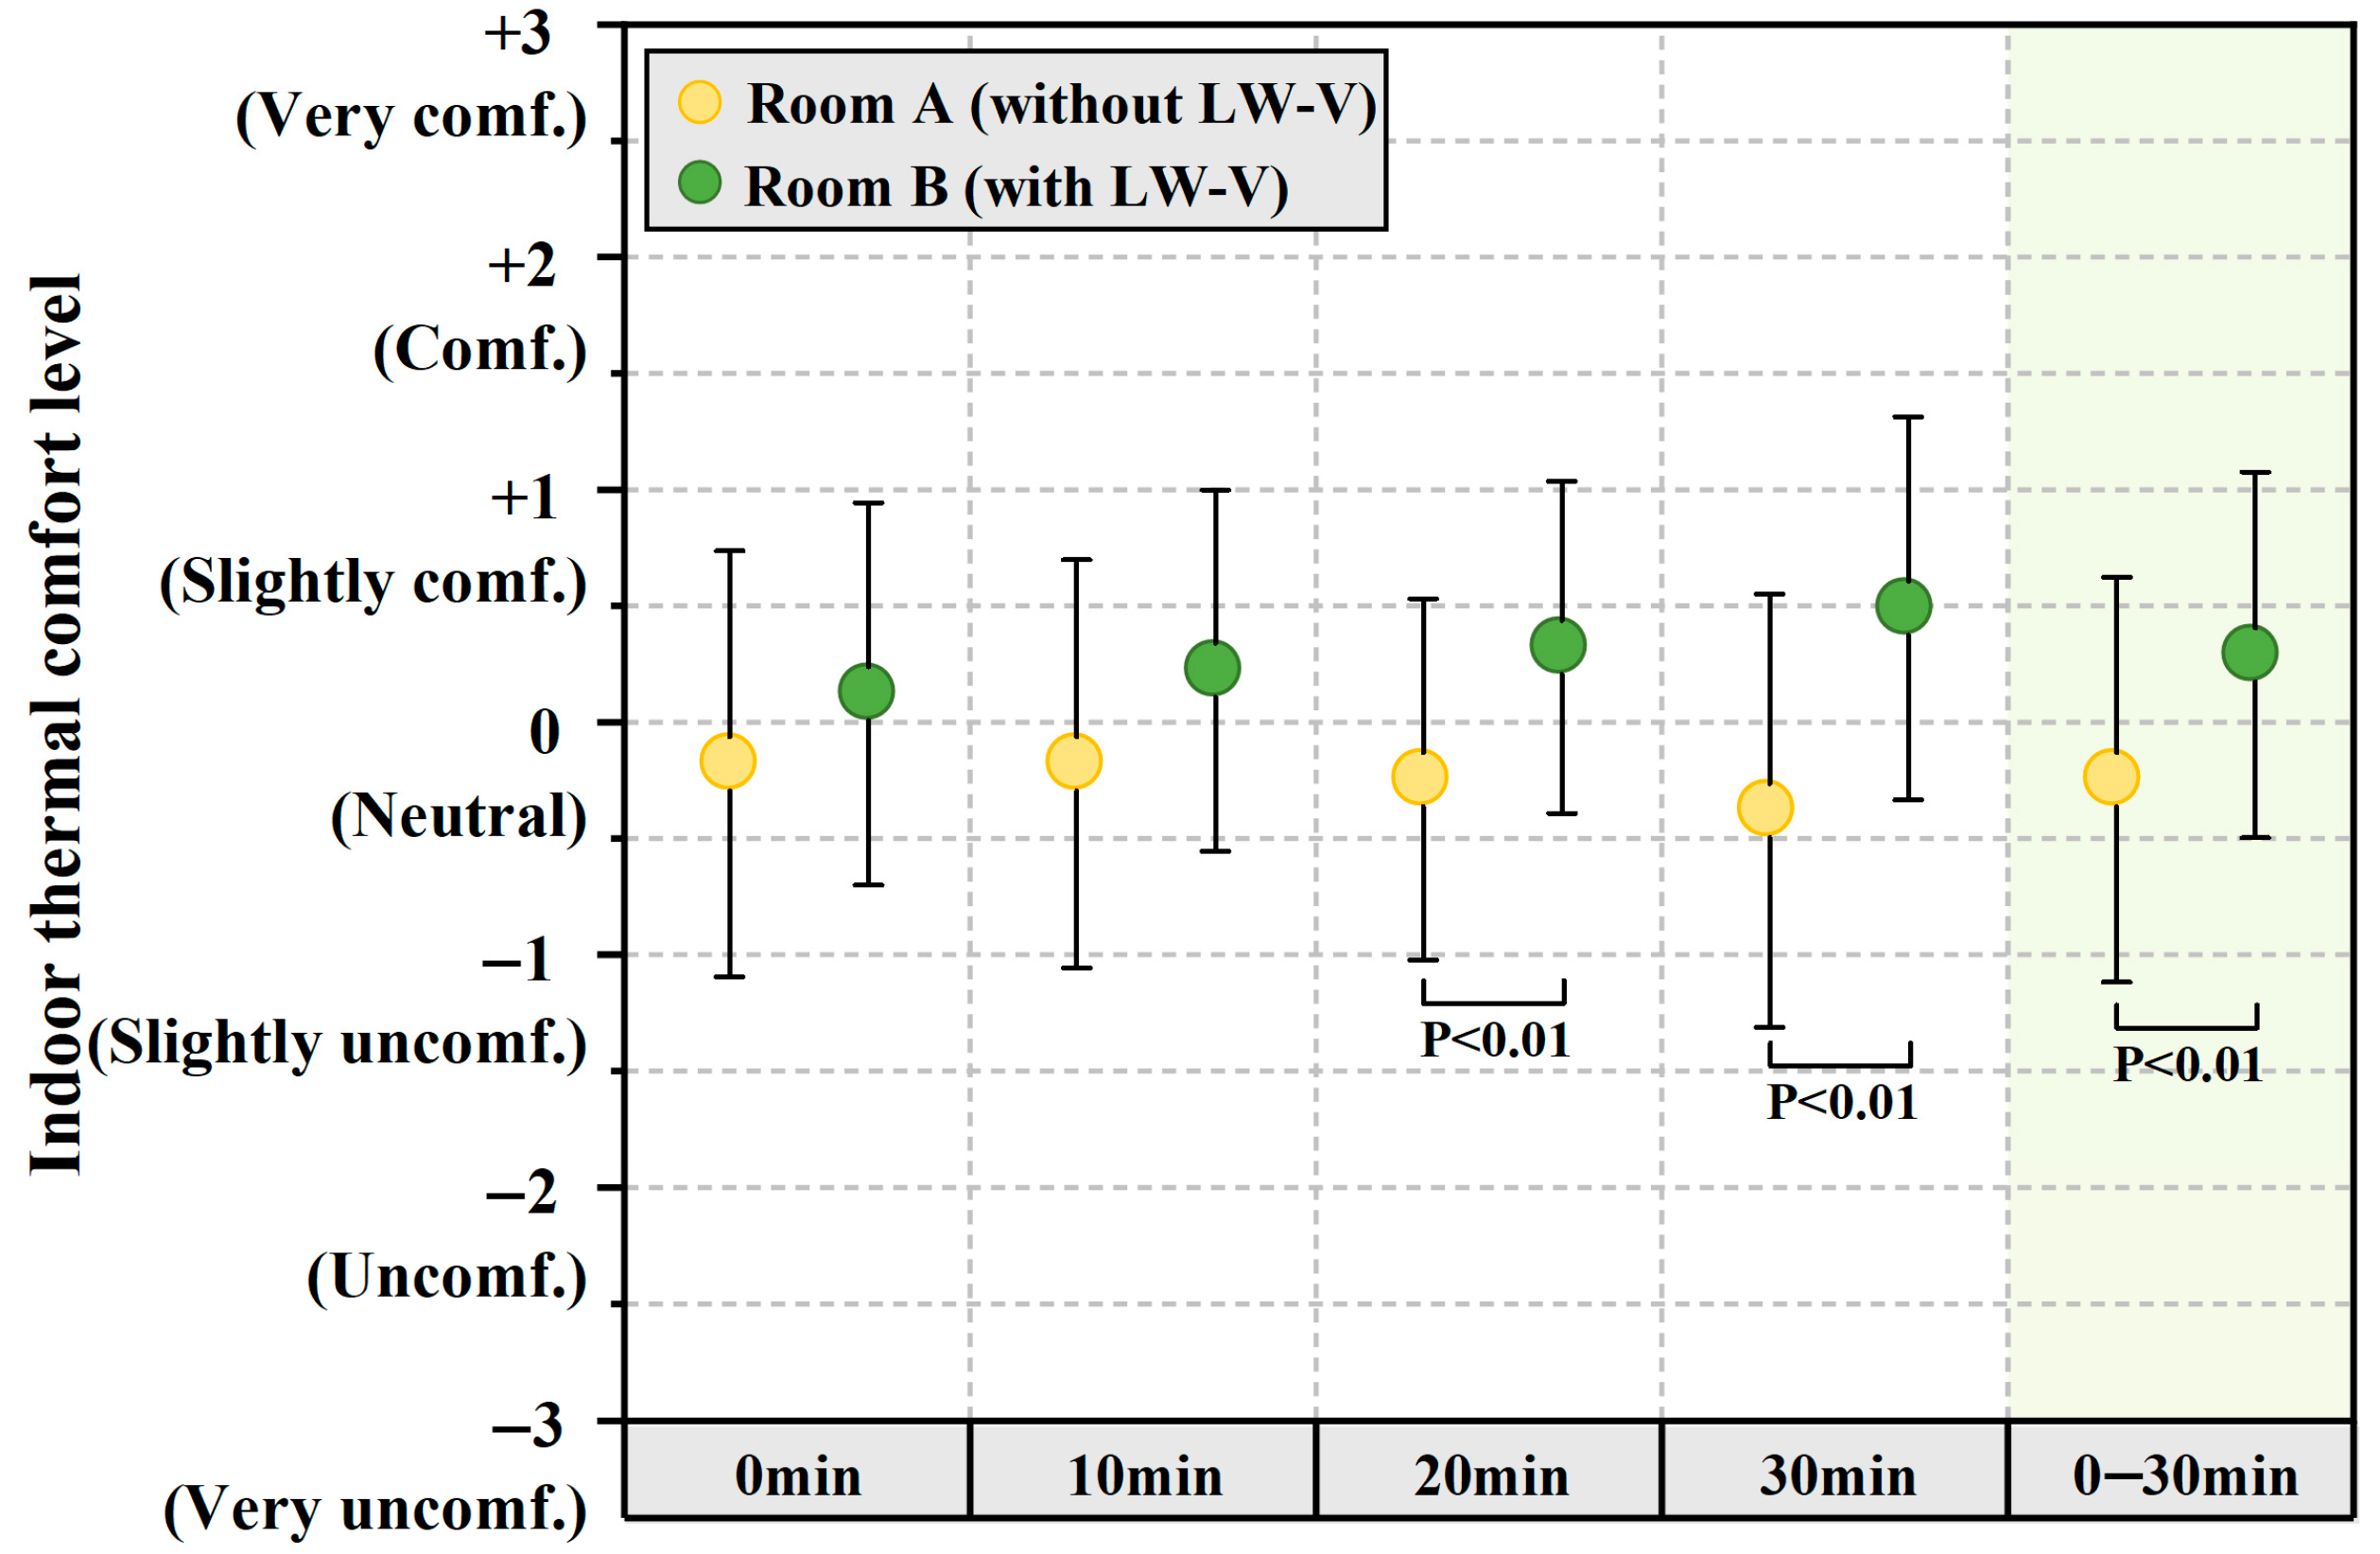
During the transition season, subjects rated Room B higher than Room A. To compare, during the experimental period, in Room B there was an overall thermal sensation vote of −0.51 (between “Neutral (0)” and “Slightly cool (−1)”) and an overall humid sensation vote of −0.18 (close to “Neutral (0)”); the overall indoor air speed sensation vote was 1.31, which was close to “Slight air speed (+1)”; the subjects rated the room freshness at 0.8 (closed to “Fresh (+1)”); and the overall thermal comfort vote was 0.3 (between “Neutral (0)” and “Slightly comfortable (+1)”), with a gradual upward trend in voting results over time.

Author Contributions

Conceptualization, F.L. and X.M.; methodology, F.L. and X.M.; formal analysis, F.L. and X.M.; investigation, F.L. and X.M.; data curation, F.L. and X.M.; writing—original draft preparation, F.L.; writing—review and editing, F.L. and X.M.; supervision, X.M.; project administration, X.M. All authors have read and agreed to the published version of the manuscript.

Funding

This research received no external funding.

Institutional Review Board Statement

Not applicable.

Informed Consent Statement

Not applicable.

Data Availability Statement

Data are contained within the article.

Conflicts of Interest

The authors declare no conflicts of interest.

References

  1. Zhao, P.J.; Zhang, M.Z. The impact of urbanisation on energy consumption: A 30-year review in China. Urban Clim. 2018, 24, 940–953. [Google Scholar] [CrossRef]
  2. Liu, S.H.; Ge, W.Y.; Meng, X. Influence of the shading nets on indoor thermal environment and air-conditioning energy consumption in lightweight buildings. Energy Rep. 2024, 11, 4515–4521. [Google Scholar] [CrossRef]
  3. Rentschler, J.; Leonov, N. Global air pollution exposure and poverty. Nat. Commun. 2023, 14, 4432. [Google Scholar] [CrossRef] [PubMed]
  4. Pérez-Urrestarazu, L.; Fernández-Cañero, R.; Franco-Salas, A.; Egea, G. Vertical Greening Systems and Sustainable Cities. J. Urban Technol. 2015, 22, 65–85. [Google Scholar] [CrossRef]
  5. Yi, F.; Yang, X.X.; Yang, R.Y.; Zhao, M.M.; Dong, Y.M.; Li, L.; He, Y.F.; Guo, M.M.; Li, J.; Zhang, X.H.; et al. A cross-sectional study of Chinese women facial skin status with environmental factors and individual lifestyles. Sci. Rep. 2022, 12, 18110. [Google Scholar] [CrossRef] [PubMed]
  6. Hamehkasi, M. Effects of Low Humidity on Comfort, Health, and Indoor Environmental Quality: Literature Review. Master’s Thesis, Kansas State University, Manhattan, KS, USA, 2016. [Google Scholar]
  7. Ge, L.M.; Gao, Y.; Meng, X. Employing the spray system to alleviate the thermal action of air-conditioning in summer. Case Stud. Therm. Eng. 2024, 55, 104133. [Google Scholar] [CrossRef]
  8. Agha-Hossein, M.M.; El-Jouzi, S.; Elmualim, A.A.; Ellis, J.; Williams, M. Post-occupancy studies of an office environment: Energy performance and occupants’ satisfaction. Build. Environ. 2013, 69, 121–130. [Google Scholar] [CrossRef]
  9. Liu, F.D.; Yan, L.Y.; Meng, X. A review on indoor green plants employed to improve indoor environment. J. Build. Eng. 2022, 53, 104542. [Google Scholar] [CrossRef]
  10. Deng, L.J.; Deng, Q.H. The basic roles of indoor plants in human health and comfort. Environ. Sci. Pollut. Res. 2018, 25, 36087–36101. [Google Scholar] [CrossRef]
  11. Fernández-Cañero, R.; Urrestarazu, L.P.; Franco, S.A. Assessment of the cooling potential of an indoor living wall using different substrates in a warm climate. Indoor Built Environ. 2012, 21, 642–650. [Google Scholar] [CrossRef]
  12. Pérez-Urrestarazu, L.; Fernández-Cañero, R.; Franco, A.; Egea, G. Influence of an active living wall on indoor temperature and humidity conditions. Ecol. Eng. 2016, 90, 120–124. [Google Scholar] [CrossRef]
  13. Meng, X.; Yan, L.Y.; Liu, F.D. A new method to improve indoor environment: Combining the living wall with air-conditioning. Build. Environ. 2022, 216, 108981. [Google Scholar] [CrossRef]
  14. Smith, A.; Pitt, M. Healthy workplaces: Plantscaping for indoor environmental quality. Facilities 2011, 29, 169–187. [Google Scholar] [CrossRef]
  15. Ding, N.; Liu, F.D.; Pang, F.; Su, J.Y.; Yan, L.Y.; Meng, X. Integrating the living wall with the split air conditioner towards indoor heating environment improvement in winter. Case Stud. Therm. Eng. 2023, 47, 103061. [Google Scholar] [CrossRef]
  16. Rodgers, K.; Handy, R.; Hutzel, W. Indoor air quality (IAQ) improvements using biofiltration in a highly efficient residential home. J. Green Build. 2013, 8, 22–27. [Google Scholar] [CrossRef]
  17. Tudiwer, D.; Korjenic, A. The effect of an indoor living wall system on humidity, mould spores and CO2-concentration. Energy Build. 2017, 146, 73–86. [Google Scholar] [CrossRef]
  18. Torpy, F.R.; Irga, P.J.; Burchett, M.D. Profiling indoor plants for the amelioration of high CO2 concentrations. Urban For. Urban Green. 2014, 13, 227–233. [Google Scholar] [CrossRef]
  19. Shao, Y.M.; Li, J.Q.; Zhou, Z.W.; Hu, Z.Y.; Zhang, F.; Cui, Y.L.; Chen, H.J. The effects of vertical farming on indoor carbon dioxide concentration and fresh air energy consumption in office buildings. Build. Environ. 2021, 195, 0360–1323. [Google Scholar] [CrossRef]
  20. Han, K.T. Influence of Limitedly Visible Leafy Indoor Plants on the Psychology, Behavior, and Health of Students at a Junior High School in Taiwan. Environ. Behav. 2009, 41, 658–692. [Google Scholar] [CrossRef]
  21. Jo, H.; Song, C.; Miyazaki, Y. Physiological Benefits of Viewing Nature: A Systematic Review of Indoor Experiments. Int. J. Environ. Res. Public Health 2019, 16, 4739. [Google Scholar] [CrossRef]
  22. Yin, J.; Yuan, J.; Arfaei, N.; Catalano, P.J.; Allen, J.G.; Spengler, J.D. Effects of biophilic indoor environment on stress and anxiety recovery: A between-subjects experiment in virtual reality. Environ. Int. 2020, 136, 105427. [Google Scholar] [CrossRef] [PubMed]
  23. Lee, M.S.; Lee, J.; Park, B.J.; Miyazaki, Y. Interaction with indoor plants may reduce psychological and physiological stress by suppressing autonomic nervous system activity in young adults: A randomized crossover study. J. Physiol. Anthropol. 2015, 34, 21. [Google Scholar] [CrossRef] [PubMed]
  24. Gonzalez, M.T.; Hartig, T.; Patil, G.G.; Martinsen, E.W.; Kirkevold, M. Therapeutic horticulture in clinical depression: A prospective study. Res. Theory Nurs. Pract. 2009, 23, 312–328. [Google Scholar] [CrossRef] [PubMed]
  25. Meng, X. Influence of Air-Conditioning Intermittent Operation on the Cooling Load from Opaque Envelopes in Residences. Case Stud. Therm. Eng. 2024, 58, 104393. [Google Scholar] [CrossRef]
  26. Han, A.R.; Park, S.A.; Ahn, B.E. Reduced stress and improved physical functional ability in elderly with mental health problems following a horticultural therapy program. Complement. Ther. Med. 2018, 38, 19–23. [Google Scholar] [CrossRef] [PubMed]
  27. Oh, Y.A.; Kim, S.O.; Park, S.A. Real Foliage Plants as Visual Stimuli to Improve Concentration and Attention in Elementary Students. Int. J. Environ. Res. Public Health 2019, 16, 796. [Google Scholar] [CrossRef] [PubMed]
  28. Van den Berg, A.E.; Wesselius, J.E.; Maas, J.; Tanja-Dijkstra, K. Green Walls for a Restorative Classroom Environment: A Controlled Evaluation Study. Environ. Behav. 2017, 49, 791–813. [Google Scholar] [CrossRef]
  29. Danielski, I.; Svensson, A.; Weimer, K.; Lorentzen, L.; Warne, M. Effects of Green Plants on the Indoor Environment and Wellbeing in Classrooms—A Case Study in a Swedish School. Sustainability 2022, 14, 3777. [Google Scholar] [CrossRef]
  30. Lohr, V.I.; Pearson-Mims, C.H.; Goodwin, G.K. Interior Plants May Improve Worker Productivity and Reduce Stress in a Windowless Environment. J. Environ. Hort. 1996, 14, 97–100. [Google Scholar] [CrossRef]
  31. Hähn, N.; Essah, E.; Blanusa, T. Biophilic design and office planting: A case study of effects on perceived health, well-being and performance metrics in the workplace. Intell. Build. Int. 2020, 13, 241–260. [Google Scholar] [CrossRef]
  32. Yıldırım, K.; Hidayetoğlu, M.L.; Ozkan, A. The Impacts of Indoor Plants on Participants Perceptual Evaluations. J. Art Arc. Stud. 2020, 9, 30–38. [Google Scholar]
  33. Kim, J.; Cha, S.H.; Koo, C.; Tang, A.K. The effects of indoor plants and artificial windows in an underground environment. Build. Environ. 2018, 138, 53–62. [Google Scholar] [CrossRef]
  34. Brilli, F.; Fares, S.; Ghirardo, A.; Visser, P.D.; Calatayud, V.; Muñoz, A.; Annesi-Maesano, I.; Sebastiani, F.; Alivernini, A.; Varriale, V.; et al. Plants for sustainable improvement of indoor air quality. Trends Plant Sci. 2018, 23, 507–512. [Google Scholar] [CrossRef] [PubMed]
  35. Ding, N.; Liu, F.D.; Ding, X.L.; Yan, L.Y.; Meng, X. Effect of Lighting Environment on the CO2 Concentration Reduction Efficiency of Plants by a Model Experiment. Buildings 2022, 12, 1848. [Google Scholar] [CrossRef]
  36. Song, J.W. Study on the Influence of Architectural Space Scale on Human Thermal Comfort. Master’s Thesis, Tianjin University, Tianjin, China, 2017. [Google Scholar]
  37. Wang, X.D. Study on the Matching Relation Between Indoor Thermal Environment and Bed Climate Based on Partial Body Thermal Demands. Ph.D. Thesis, Xi’an University of Architecture and Technology, Xi’an, China, 2016. [Google Scholar]
  38. Xiong, J.; Ma, T.; Lian, Z.W.; Dear, R.D. Perceptual and physiological responses of elderly subjects to moderate temperatures. Build. Environ. 2019, 156, 117–122. [Google Scholar] [CrossRef]
Figure 1. (a) Schematic diagram of LW-V system, (b) the experimental setup.
Sustainability 16 04300 g001
Figure 2. (a) Schematic layout of the laboratory, (b) actual view of the experimental system.
Sustainability 16 04300 g002
Figure 3. Schematic distribution of human skin temperature measurement points.
Sustainability 16 04300 g003
Figure 4. Schematic diagram of the experimental flow and questionnaire process.
Sustainability 16 04300 g004
Figure 5. The basic information of the subjects: (a) Gender, (b) Age and (c) Weight status (BMI).
Sustainability 16 04300 g005
Figure 6. Meteorological station data during the experimental period.
Sustainability 16 04300 g006
Figure 7. Comparison of (a) indoor temperatures and (b) relative humidity in Room A and Room B.
Sustainability 16 04300 g007
Figure 8. Comparison of indoor air speeds in Room A and Room B during the transition season.
Sustainability 16 04300 g008
Figure 9. Comparison of indoor CO2 concentrations in Room A and Room B during the transition season.
Sustainability 16 04300 g009
Figure 10. Comparison of skin temperatures and MST of different parts for eight body parts in Room A and Room B. The error bars represent the MST ± SD (standard deviation). Significance (p-value) was determined by using a t-test.
Sustainability 16 04300 g010
Figure 11. (a) Comparison of indoor thermal sensation voting and (b) the preference vote in Room A and Room B.
Sustainability 16 04300 g011
Figure 12. (a) Comparison of indoor humid sensation vote and (b) the humidity preference vote in Room A and Room B.
Sustainability 16 04300 g012
Figure 13. Comparison of indoor air speed sensation vote in Room A and Room B during the transitional season.
Sustainability 16 04300 g013
Figure 14. Comparison of indoor air freshness sensation vote in Room A and Room B during the transitional season.
Sustainability 16 04300 g014
Figure 15. Comparison of indoor thermal comfort level vote in Room A and Room B during the transitional season.
Sustainability 16 04300 g015
Figure 16. Comparison of the vote of (a) subjects’ willingness to stay in the two rooms, and (b) the acceptability of the LW-V system during the transition season.
Sustainability 16 04300 g016
Table 1. Testing range and accuracy of experimental instruments.
InstrumentModelTest ContentRangeAccuracy
Indoor thermal environment testerJT-IAQ-50Air temperature−20–120 °C±0.3 °C
Relative humidity0–100% RH±2% RH
Air speed0.05–2 m/s±0.03 m/s
Indoor environmental monitor3G19CO2 concentration400–5000 ppm±5%
Skin temperature monitorME103 (0.1) 3977V3B3000Skin temperature0–60 °C±0.1 °C
Table 2. The scales of the questionnaire’s physiological indicator parameters.
ScaleThermal
Sensation
Humid
Sensation
Air Speed
Sensation
Air Freshness
Sensation
Thermal Comfort LevelAcceptance Level
+3HotVery dryVery strong-Very comfortable-
+2WarmDryHighVery freshComfortableVery willing
+1Slightly warmSlightly dryLowFreshSlightly comfortableWilling
0NeutralNeutralStillNeutralNeutralNeutral
−1Slightly coolSlightly humid-StaleSlightly uncomfortableUnwilling
−2CoolHumid-Very staleUncomfortableVery unwilling
−3ColdVery humid--Very comfortable-
Disclaimer/Publisher’s Note: The statements, opinions and data contained in all publications are solely those of the individual author(s) and contributor(s) and not of MDPI and/or the editor(s). MDPI and/or the editor(s) disclaim responsibility for any injury to people or property resulting from any ideas, methods, instructions or products referred to in the content.

