1. Introduction
1.1. General Considerations
As global economic growth continues to unfold across multiple fronts [
1], the consequent surge in electricity demand [
2] necessitates a strategic response to accommodate new users and the heightened consumption by existing entities.
This study takes into account the projected 2% increase in total electricity consumption for the year 2024, as forecasted by Romanian authoritative bodies [
3], aiming to optimize the placement of new electrical substations within this evolving landscape. Moreover, legislative developments and incentives targeting prosumers represent potential catalysts for reconfiguring the entire electricity value chain—from production and transmission to distribution and consumption.
To comprehensively account for forthcoming developments, this study incorporates two distinct scenarios into its foundational assumptions. The first one is the Stated Policies Scenario (SPS) and the second one is the Announced Pledges Scenario (APS), as defined by the International Energy Agency (IEA). The trajectory of electricity demand within the SPS is projected to exhibit an annual growth rate of 2.4% throughout the remainder of the current decade, exceeding 30,600 terawatt-hours (TWh) by 2030. In the Alternate Pledges Scenario (APS), the pace of demand escalation is more accelerated, reaching approximately 31,750 TWh by 2030. These scenarios are detailed in
Table 1 and serve as further proof of the 2% Year-to-Year conservative assumption in demand increase used as the founding hypothesis of this paper [
4].
The need to establish new substations arises not only in response to escalating demand but also as a strategic lever to bolster grid resilience [
5] and facilitate decarbonization processes. By addressing the evolving dynamics of electricity consumption, this research underscores that the development of new substations can serve as a pivotal element in mitigating the adverse effects of global warming and enhancing the sustainability of the electrical grid.
In addition, the world faces multiple environmental constraints, struggling to diminish or fully suppress the carbon dioxide (CO
2) emissions released into the atmosphere [
6]. This concept, when applied in the field of energy engineering, is closely linked to renewable energy sources, as well as a reduction in energy and power losses.
1.2. Literature Review of Optimal Substation Placement Algorithms
Following a comprehensive literature review, the following approaches developed for optimal substation placement problems emerge in the scientific community:
Based on
Genetic Algorithms—Reference [
7] acknowledges the high importance of substation expansion planning in the context of power consumption augmentation within an uncertain framework. The method proposes a genetic algorithm employed to analyze the probabilistic placement and dimensions of the load points. The iterative approach finds at each step the location for the substation, considering the required investment cost while calculating the other necessary criteria using a mathematical model using occurrence probability. The performance of the proposed algorithm is investigated employing real data. In reference [
8], the topic of selecting the best substation location between two similar candidate solutions is addressed. A comprehensive evaluation method including the Delphi method (for grading the two possible locations), the analytic hierarchy process (to evaluate the combined weights), Gray relations analysis and fuzzy integrated (to evaluate the candidate schemes) evaluation (DHGF) is proposed. Reference [
9] proposes an Artificial Immune Systems algorithm with the goal of minimizing the overall planning costs. This algorithm tries to mimic the human immune system, as presented in [
10]. Reference [
11] introduces a long-term planning timeframe based on a pseudo-dynamic methodology. The load points are modeled using a fuzzy approach (including the associated uncertainty), while optimization is achieved through genetic algorithm implementation. The results are applied in several scenarios.
Using a
Geographic Information System (GIS)—In reference [
12], a multi-criteria decision approach is proposed, using a geographic information system. The authors identify the crucial criteria (such as environmental, social, administrative) underlying decision-makers’ preference for a particular location. The top two most important criteria are demonstrated to be the electric load density (with a weight of 44%) and the distance to the sub-transmission network (with a weight of 23%). Multi-criteria decision-making is applied also in substation maintenance problems, as demonstrated in [
13]. Reference [
14] further substantiates the idea of using geographical localization in order to determine the optimal position of a new substation. The authors focus on the minimization of the cost of land as the main optimization function and use a semi-supervised learning algorithm as the method for solving the problem. This type of approach offers solutions for highly urbanized locations where the cost of land is very high. Reference [
15] proposes a multi-stage distribution substation expansion planning method. The objective function is defined as the remaining benefit after subtracting the costs. Technical constraints such as voltage drop, expansion and operation capacity are considered. This first stage provides a binary set of solutions, among which the best candidate is determined using a dynamic bacterial foraging algorithm. The efficacy of the method is proved in a real city. Reference [
16] addresses simultaneously the problems of the sizing and positioning of the distributed generation and substations in order to achieve a resilient microgrid. The costs of investment, resiliency, emission and operations are taken into account for both the restrictions and the objective function. A line-flow-based model is employed for the test system. Then, a mixed-integer quadratically constrained optimization approach is defined and solved with a specialized global optimizer. Finally, the results are validated on a 24-bus test system.
Using
Probabilistic Methods—Reference [
17] introduces a probabilistic methodology to support network planning engineers in the selection of the most suitable locations for future substations. The locations of the load points (weighed depending on their size) underly the determination of the most probable load spread. Then, the outline with the highest likelihood of where the substation should be located is determined. The proposed solution is applied to a real test case, considering three bi-variate distribution functions (Gaussian, Weibull, and Freud exponential).
1.3. Paper Contributions
This paper is based on the fundamental assumptions derived from information pertaining to anticipated increases in the electrical load within Romania, as conveyed by Romanian regulatory bodies and the International Energy Agency (IEA). The principal contribution of this study lies in demonstrating that the challenge of identifying the optimal locations for new substations can be effectively addressed through the application of machine learning algorithms.
One of the objectives of this study is oriented towards the allocation of novel consumption points within the designated analysis area. This allocation is based on the utilization of the Weibull distribution, which determines both the locations and magnitudes of the anticipated load increases. By leveraging the flexibility of the Weibull distribution’s parameters, including shape and scale, we can simulate a wide range of potential load scenarios, fitting the expected behavior of economic entities with regard to the consumption points unfolding.
The central objective of this paper focuses on the development of two algorithms, namely geometrical-based and machine-learning-based algorithms, designed to ascertain the optimal positioning of new electrical substations capable of meeting the energy demands of the projected consumption points previously determined. The benchmark for comparison is defined by the minimal power loss incurred after the substation placement.
As highlighted by the literature review conducted in
Section 1.2, the optimal placement of substations is a trending topic in the current technical and environmental scientific and practical context. Several approaches are applied to achieve an optimal solution; however, there is no consensus on this matter. This paper analyzes two possible methods (classical, geometrical approach and machine-learning-based algorithm) with the main goal of minimizing power losses in the studied network.
This paper’s importance is in mitigating power losses, which emerges as a key strategy in designing a more sustainable network, ultimately contributing to a reduction in carbon emissions.
2. Materials and Methods
This paper employs data sourced from the authoritative repository of the National Energy Regulatory Authority of Romania (ANRE). Synthesizing insights derived from ANRE’s documentation, which depicts the national electricity consumption as approaching 50 TWh [
18], the analysis discerns a prospective escalation of 1000 MWh in electricity consumption. This quantum of energy equals an installed power (consumption) of 114 MW; however, for the purposes of a judiciously conservative hypothesis, a rounded figure of 100 MW is posited within the context of the paper.
The proposed algorithms are developed using Python 3.10.6 with the following libraries: NumPy 1.23.2 [
19], pandas 1.4.3 [
20], SciPy 1.9 [
21], Matplotlib 3.5.3 [
22] and scikit-learn 1.1.2 [
23].
2.1. Consumption Points Allocation
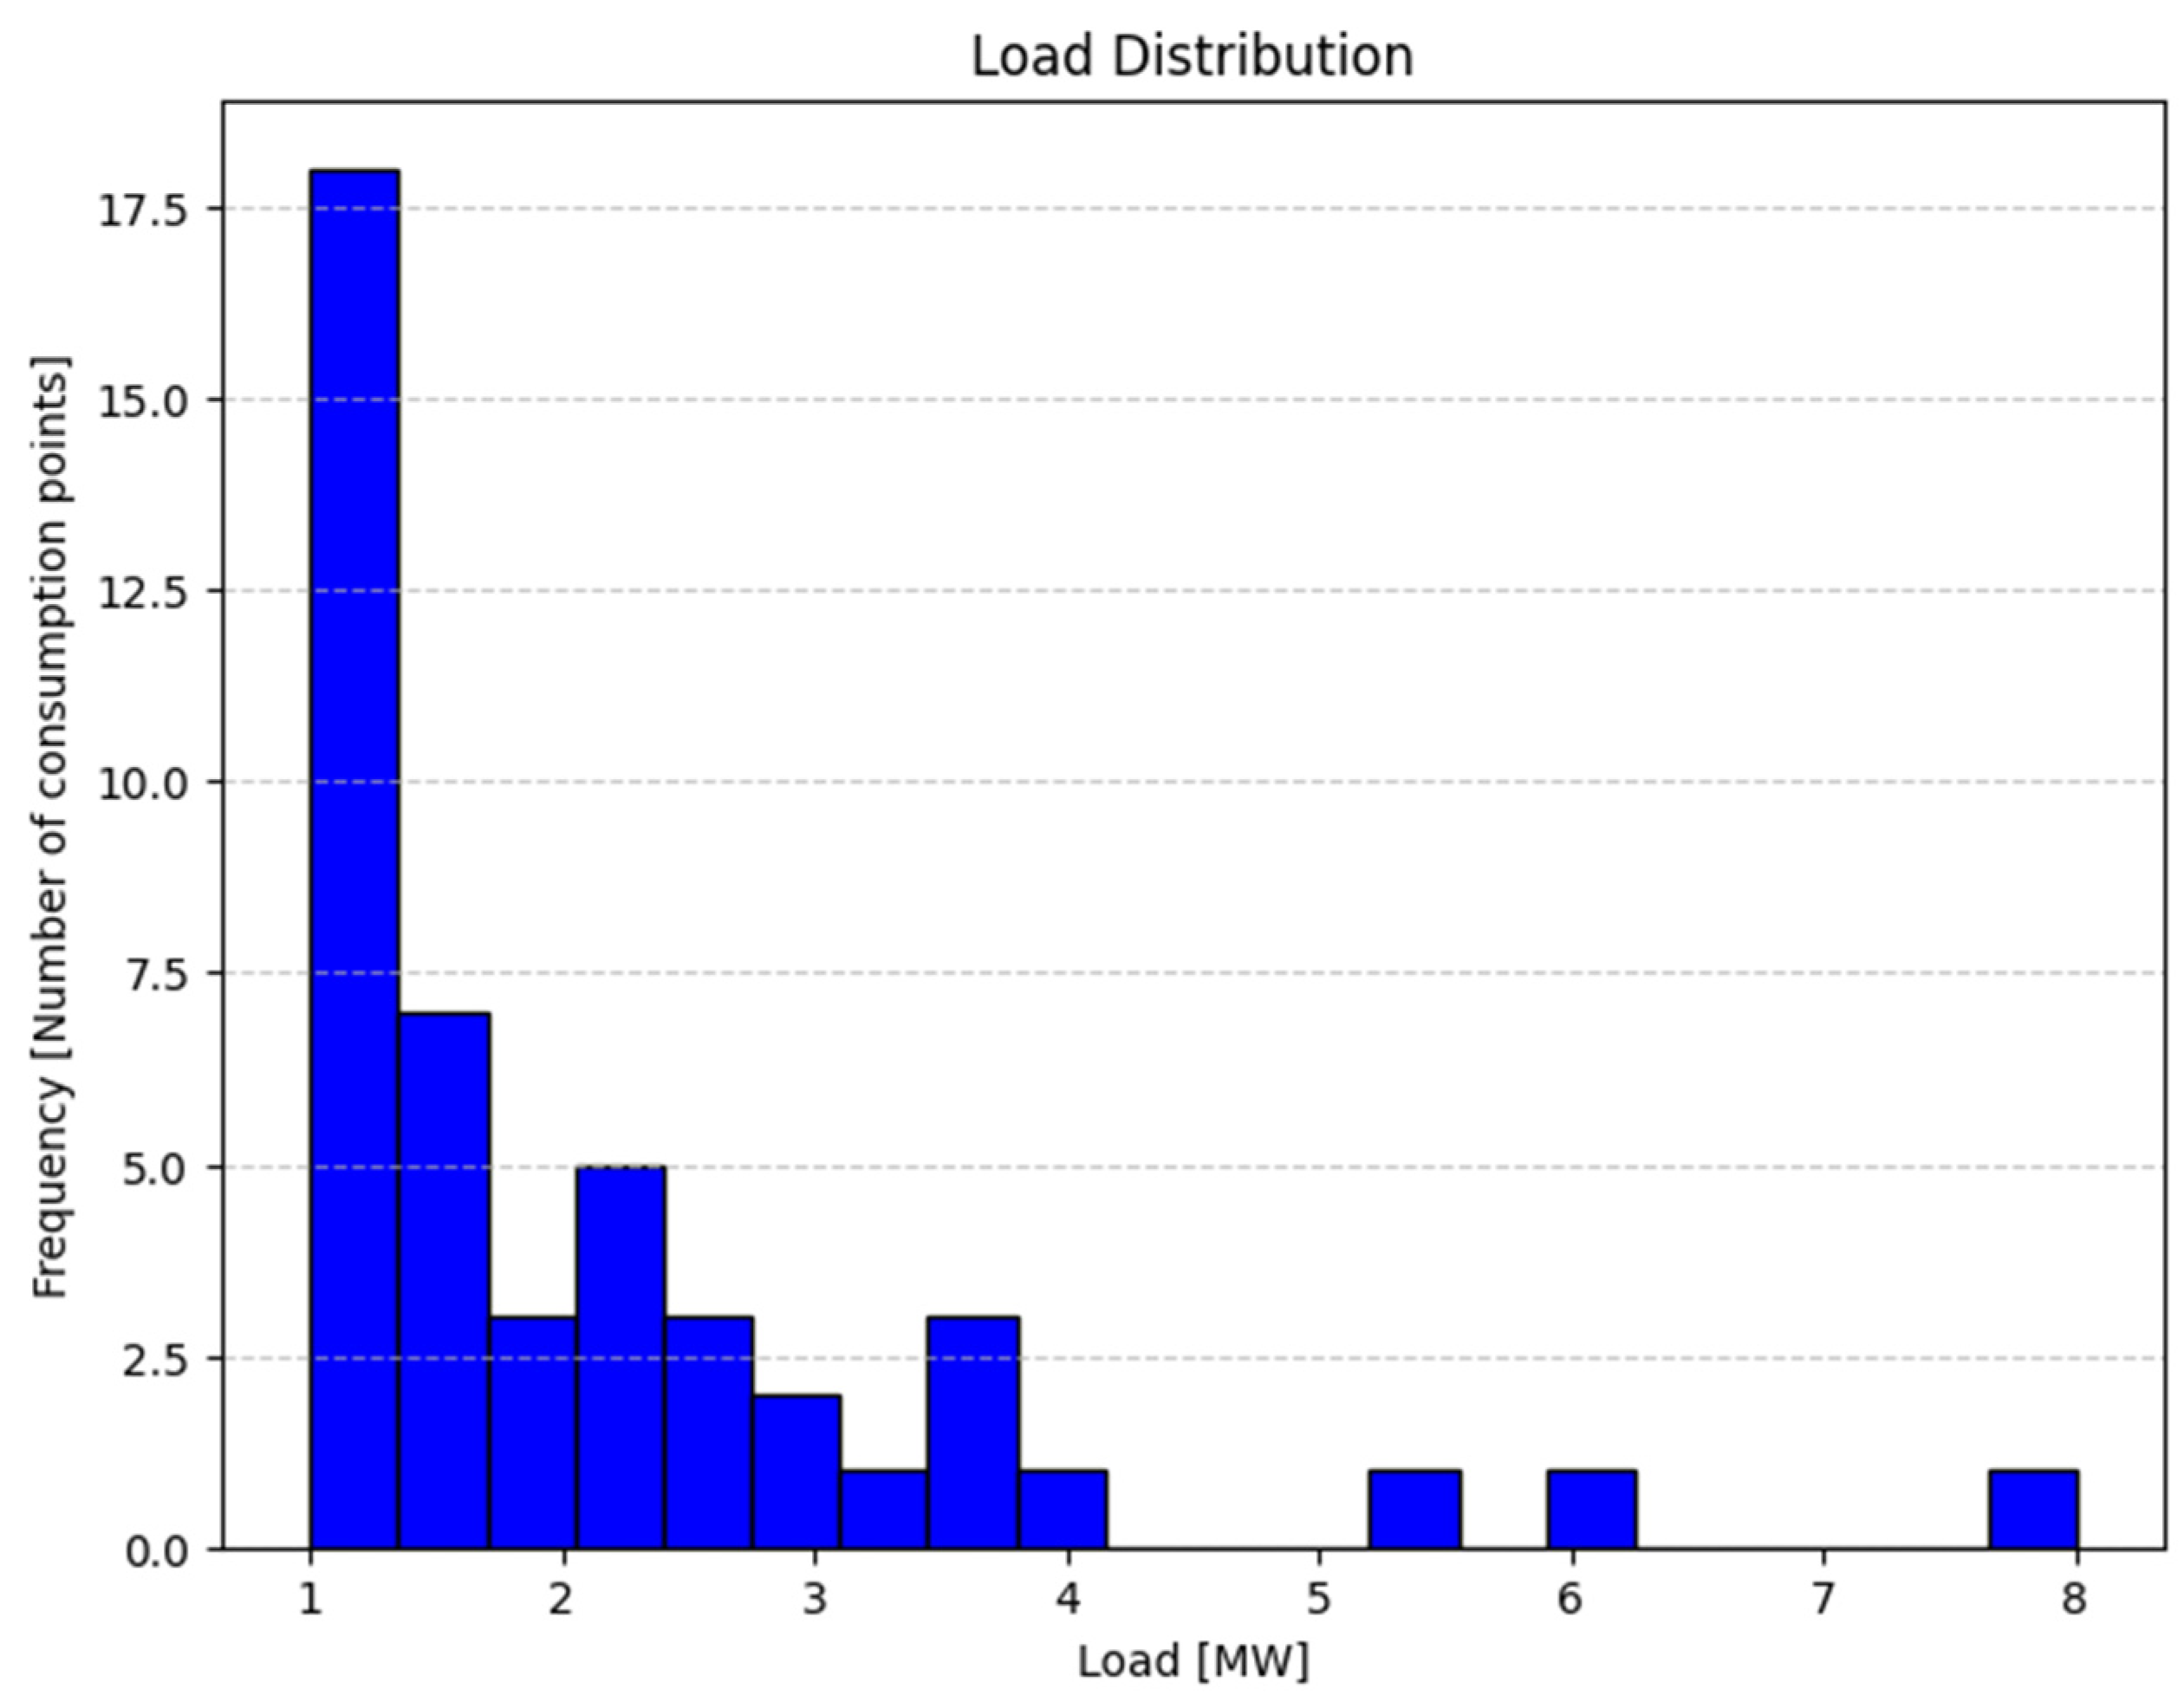
The disseminated power is allocated across the geographic area of Romania, thereby requiring the establishment of discrete consumption points within this spatial domain. The quantification of these points is modeled as power (MW) and adheres to an asymmetric Weibull distribution according to the hypothesis proposed in this paper. This approach is designed as a conceptual framework mirroring the dynamics of real-world economic expansion, wherein small and dispersed consumption points are substantially more likely than the initiation of large-scale, energy-intensive projects. This distribution is characterized by a pronounced concentration of values around 1 MW, with the boundaries ranging from 0.1 to 8 MW [
24]. The specified range of potential values is structured to simulate the statistically most probable medium-voltage (MV) loads envisaged to materialize in prospective scenarios. This assumption aligns with the intention of simulating prospective developments in a manner that captures the nuanced dynamics of power consumption. A graphical representation of the power consumption distribution for the proposed new consumption points is shown in
Figure 1 for comprehensive visualization.
These consumption points are defined in a table containing the following information:
Regarding energy losses, the following assumptions were used:
In order to be able to define the consumption areas, the transited power of the new substations is automatically generated using a uniform distribution with the usual values of a medium-voltage (MV) substation (between 4 and 25 MW), adding up to a total of 100 MW supplementary loads in the region.
A sample set of consumption points is presented in
Table 2.
The definition of consumption areas is intricately governed by the power characteristics of electrical stations, as postulated within the stipulated assumptions, and is further influenced by the spatial distribution of the consumption points.
In pursuit of a simulation that closely follows real-world scenarios, due consideration is given to incorporating an inherent inequality into the transmitted power of newly established stations. Considering this uniformity as a basepoint is grounded in the practical occurrences observed in various instances, stemming from the disparate economic development across different regions of the country, as well as the non-uniform distribution of energy potential across the territorial expanse of Romania [
25].
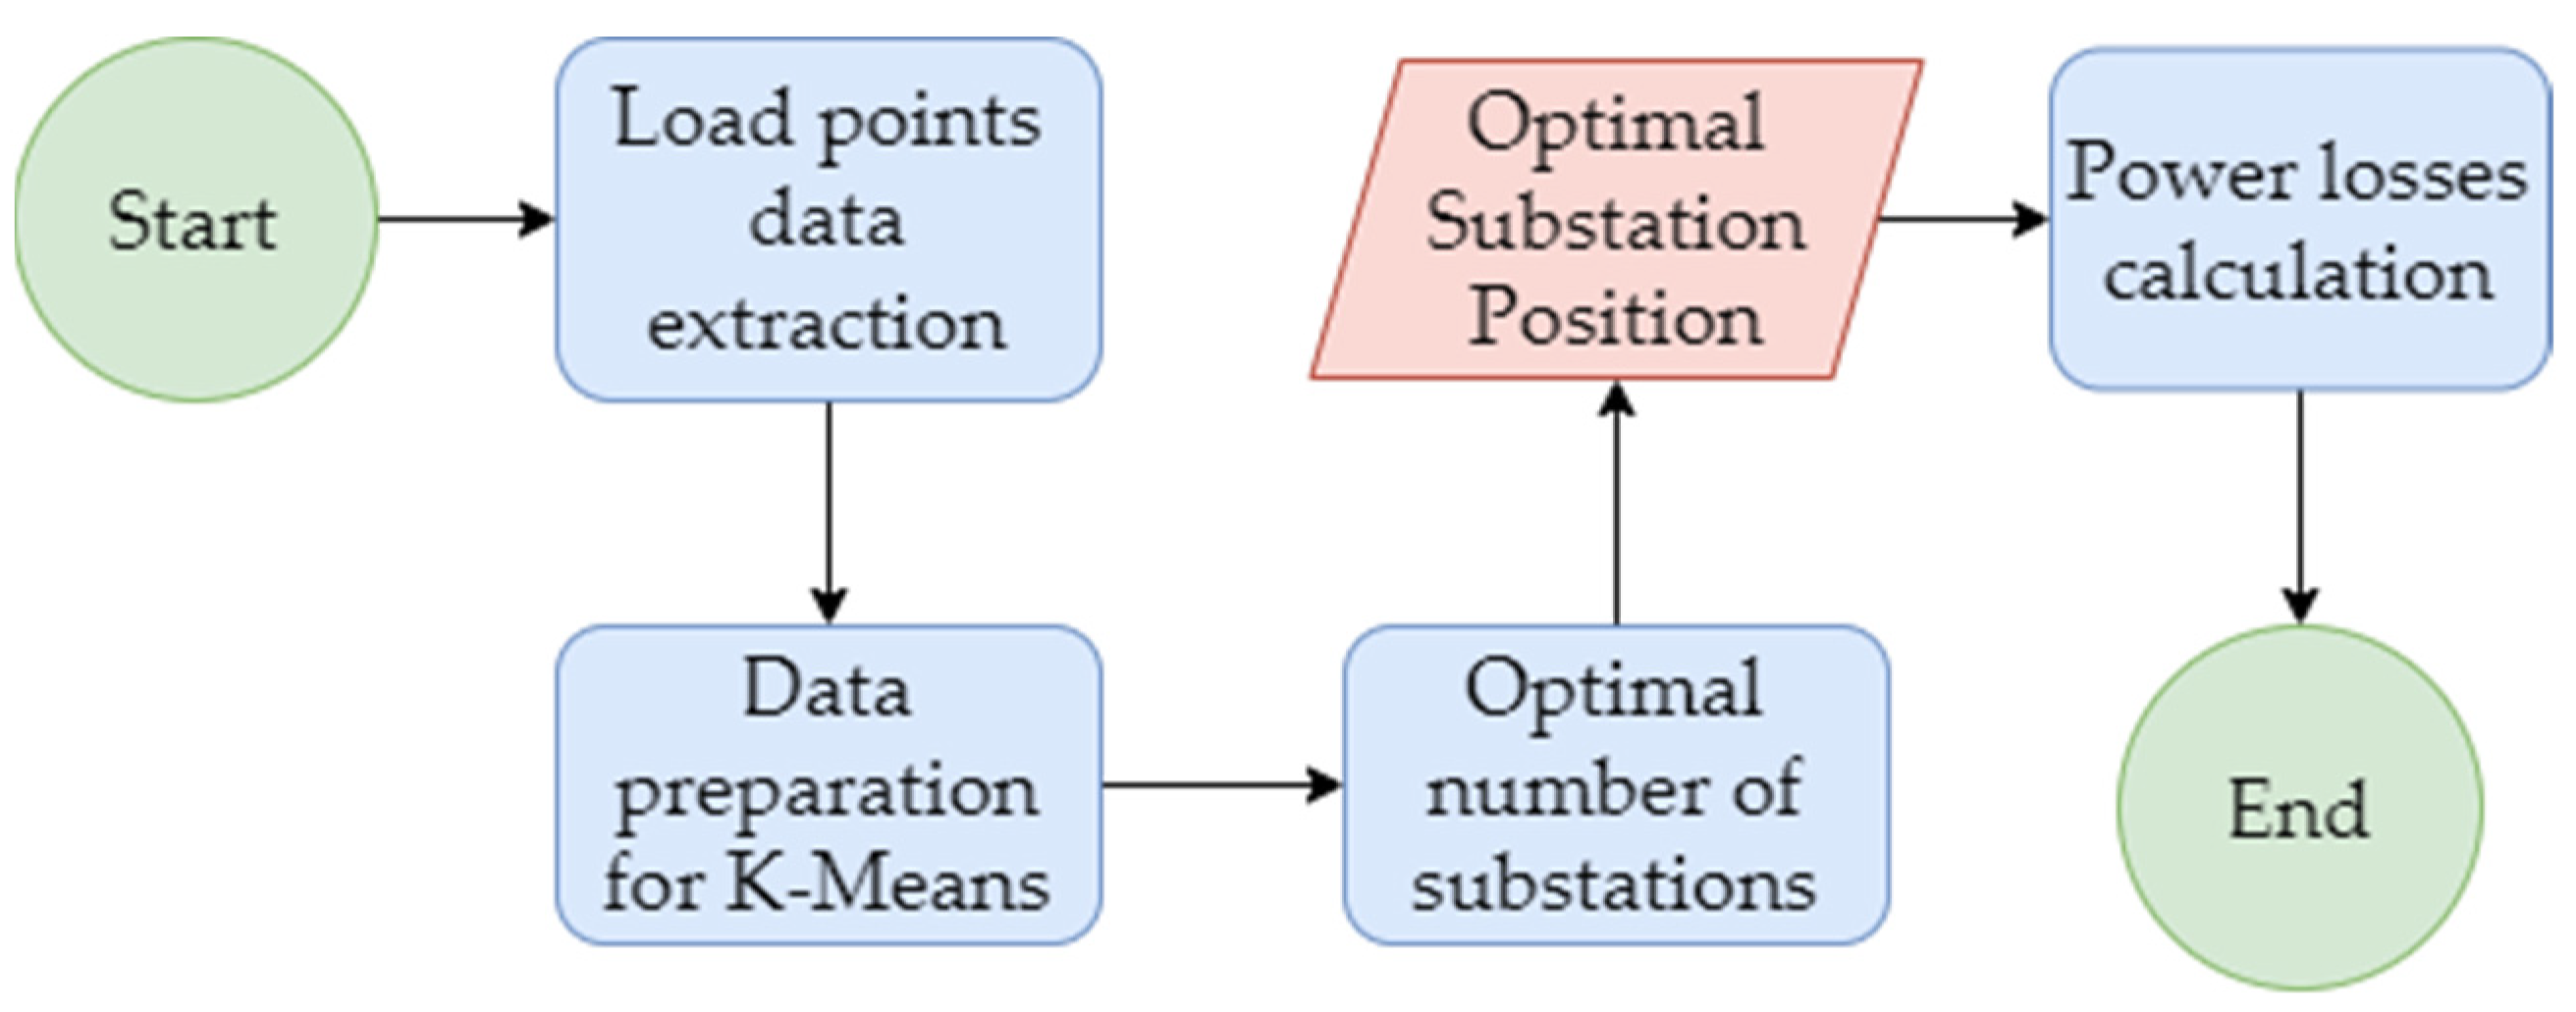
The algorithmic framework governing the assignment of consumption areas to individual consumption points is depicted in
Figure 2, detailing the operational intricacies for a comprehensive understanding of the simulation process.
After the integration of this algorithm, all the consumption points are assigned to a consumption zone and a station that is to be part of this zone.
2.2. Algorithms for Determining the Optimal Position of a New Electrical Substation
The algorithms presented in this paper are fundamentally oriented toward the optimization of the power loss cost associated with establishing a new substation. This is achieved through judicious placement within a designated perimeter, with a concurrent focus on mitigating electrical losses.
The proposed algorithms are often more computationally efficient compared to genetic algorithms or probabilistic algorithms. Genetic algorithms typically involve a population-based search, which can become computationally expensive, especially for large datasets or high-dimensional spaces [
26].
K-means and geometrical algorithms can be more robust to noise in the data compared to probabilistic algorithms. Probabilistic algorithms may assign uncertain probabilities to each potential location, which can be problematic if the data contain outliers or noise [
27].
K-means and geometrical algorithms do not assume any specific distribution of data, making them more versatile in handling various types of data distributions. Genetic algorithms or probabilistic algorithms may require specific assumptions about the distribution of the data or the relationships between variables.
While genetic algorithms, probabilistic algorithms and GIS algorithms certainly have their merits and can be powerful tools in certain optimization scenarios, the choice of algorithm ultimately depends on the specific requirements and constraints of the problem, as well as the desired balance between accuracy, efficiency, interpretability and ease of implementation. For this paper, the simplicity, efficiency and interpretability offered by the K-means and geometrical algorithms make them highly preferable choices for optimizing the location of a new electrical substation.
2.2.1. Geometrical Algorithm
This algorithm is founded upon the minimization of power losses through the strategic placement of stations at the “centers of gravity” [
28] of the consumed power area. The geometric algorithm relies on a geometric calculation to determine the optimal substation locations. It calculates the power losses based on the distances between the substations and individual consumption points in the cluster. The operational mechanism of the algorithm for this case study is delineated as follows:
Initialization—The algorithm initiates an empty result list with the objective of establishing a storage environment.
Loss Calculation for Each Potential Substation Location within the Analysis Zone—For every location of the electrical substation, the power losses are computed based on the distances between the station and the consumption points. Given the utilization of coordinates, an initial computation is conducted to determine the necessary lengths for overhead power lines (direct route).
Optimal Substation Position Selection Based on Minimum Losses—For each consumption zone, the substation position yielding the least energy losses is identified.
Recalculation of Steps 1 and 2 for the Remaining Analysis Zones—The computation persists until every consumption zone is serviced by a substation.
The geometrical algorithm is based on using Euclidean distances to quantify the spatial separation between the stations and consumption points. This distance metric is commonly used in geometric calculations and can provide a precise measure of the distance between two points in a multidimensional space. The Euclidean distance formula calculates the straight-line distance between two points in a Euclidean space, which is often represented as a Cartesian coordinate system. For two points
and
in a two-dimensional space, the Euclidean distance
between them is given by the following formula [
29]:
By exhaustively iterating through all the potential substation locations within each cluster, the algorithm computes the Euclidean distances between each load and candidate substation using the distance formula. These distances serve as inputs for the power loss calculations.
The Objective Function: Minimizing the total distance
between the potential substation locations
and all the consumption points
:
where:
—number of potential substation locations
—number of consumption points
—distance between substation location i and consumption point j
Constraints: The substation location S must adhere to the geographical limitations G (the geographical limits of Romania in this case).
2.2.2. Machine Learning Algorithm—K-Means Clustering
The K-means clustering algorithm [
30] stands as one of the most widely employed methods for data clustering in data analysis and machine learning (ML). It was initially devised by Lloyd [
31] in 1957 and has evolved into a fundamental technique for segmenting data into homogeneous groups. The primary objective of the K-means algorithm is to cluster data in such a way that objects within the same cluster exhibit similarity, while those in different clusters are maximally dissimilar.
The employed machine learning algorithm consists of K-means clustering. The operational rationale is expounded upon as follows:
Data Extraction for K-Means—Data pertaining to the locations of the consumption points are extracted and organized into a format suitable for the K-means algorithm.
Determination of the Optimal Number of Substations—The “elbow method” [
32] is employed to ascertain the optimal number of stations required to minimize power losses. This method calculates the sum of the squared intra-zone distances for varying numbers of consumption zones until a diminishing reduction in losses is observed.
Determination of Substation Positions—The K-means algorithm is applied to ascertain the optimal positions of electric substations within the distribution network.
Power Loss Calculation for Each Positioned Station—The algorithm computes the energy losses associated with each strategically positioned electric station.
In this case, the following aspects are considered: Let denote the total power losses in the distribution network, which we aim to minimize. This can be formulated as a combination of the objectives:
- (a)
Determination of the Optimal Number of Substations:
Minimize the sum of squared intra-zone distances for varying numbers of consumption zones until a diminishing reduction in losses is observed.
where
N represents the number of substations, and
f(
N) represents the sum of the squared intra-zone distances as follows:
where:
where:
is the total number of consumption points,
is the distance between the ith substation and the jth consumption point.
- (b)
Determination of Substation Positions:
We minimize the overall dissimilarity within each cluster formed by the K-means algorithm:
where
represents the position of the
ith substation and
represents the dissimilarity metric within the clusters.
The dissimilarity metric within the clusters can be calculated as follows:
where:
—total number of clusters,
—number of points in cluster ,
—points in cluster ,
—centroid of cluster .
2.2.3. Comparison Criterion
The comparative assessment criterion is based on the necessity of minimizing the power losses within the network. In accordance with the stipulations defined in
Section 2.1, specifically with reference to the assumed power loss rate of 250 W/km, each algorithm within the study evaluates its corresponding power losses.
The determination of the superior algorithm is established based on its capacity to achieve the minimum power losses within each designated zone of interest. This stringent evaluation framework ensures that the selected algorithm excels in mitigating the power losses across the network, thereby contributing to the overall efficacy and efficiency of the electrical infrastructure under consideration. Hence, the best algorithm for each consumption zone is based on this criterion.
The comparison criterion is presented in the following equation:
3. Results
In each consumption zone, losses were assessed through the application of two proposed methodologies. The variation in losses arising from substation placement using both the geometric algorithm and K-means clustering—the recommended algorithm for deployment due to its optimal performance within the specific consumption zone—was scrutinized. Additionally, the optimal geographic coordinates for the electric substation were determined. These outcomes are detailed in
Table 3:
It is imperative to note that the consumption zones are sequentially defined and constrained by the power transmitted through the substations. Consequently, certain territories may be serviced by two or more consumption zones and their respective electric substations. Subsequently, an increase in the power transmitted from one of the substations in the area may be applied, resulting in the allocation of the consumption points to a single consumption zone.
It is observed that for the five analyzed consumption zones, the total consumption losses using the K-means algorithm are lower than those incurred using the geometric algorithm. Moreover, in 60% of cases, the most effective algorithm was identified as K-means. This underscores the utility of integrating ML algorithms into determining the optimal position of an electric substation. Nevertheless, the geometric algorithm proves suitable in 40% of cases, with its losses comparable to those of K-means. Therefore, it can be observed that if the computational power does not impose limitations on applying the algorithms, they can be run in parallel, and the best results using the comparison criterion can be used to determine the optimized location in case-by-case scenarios.
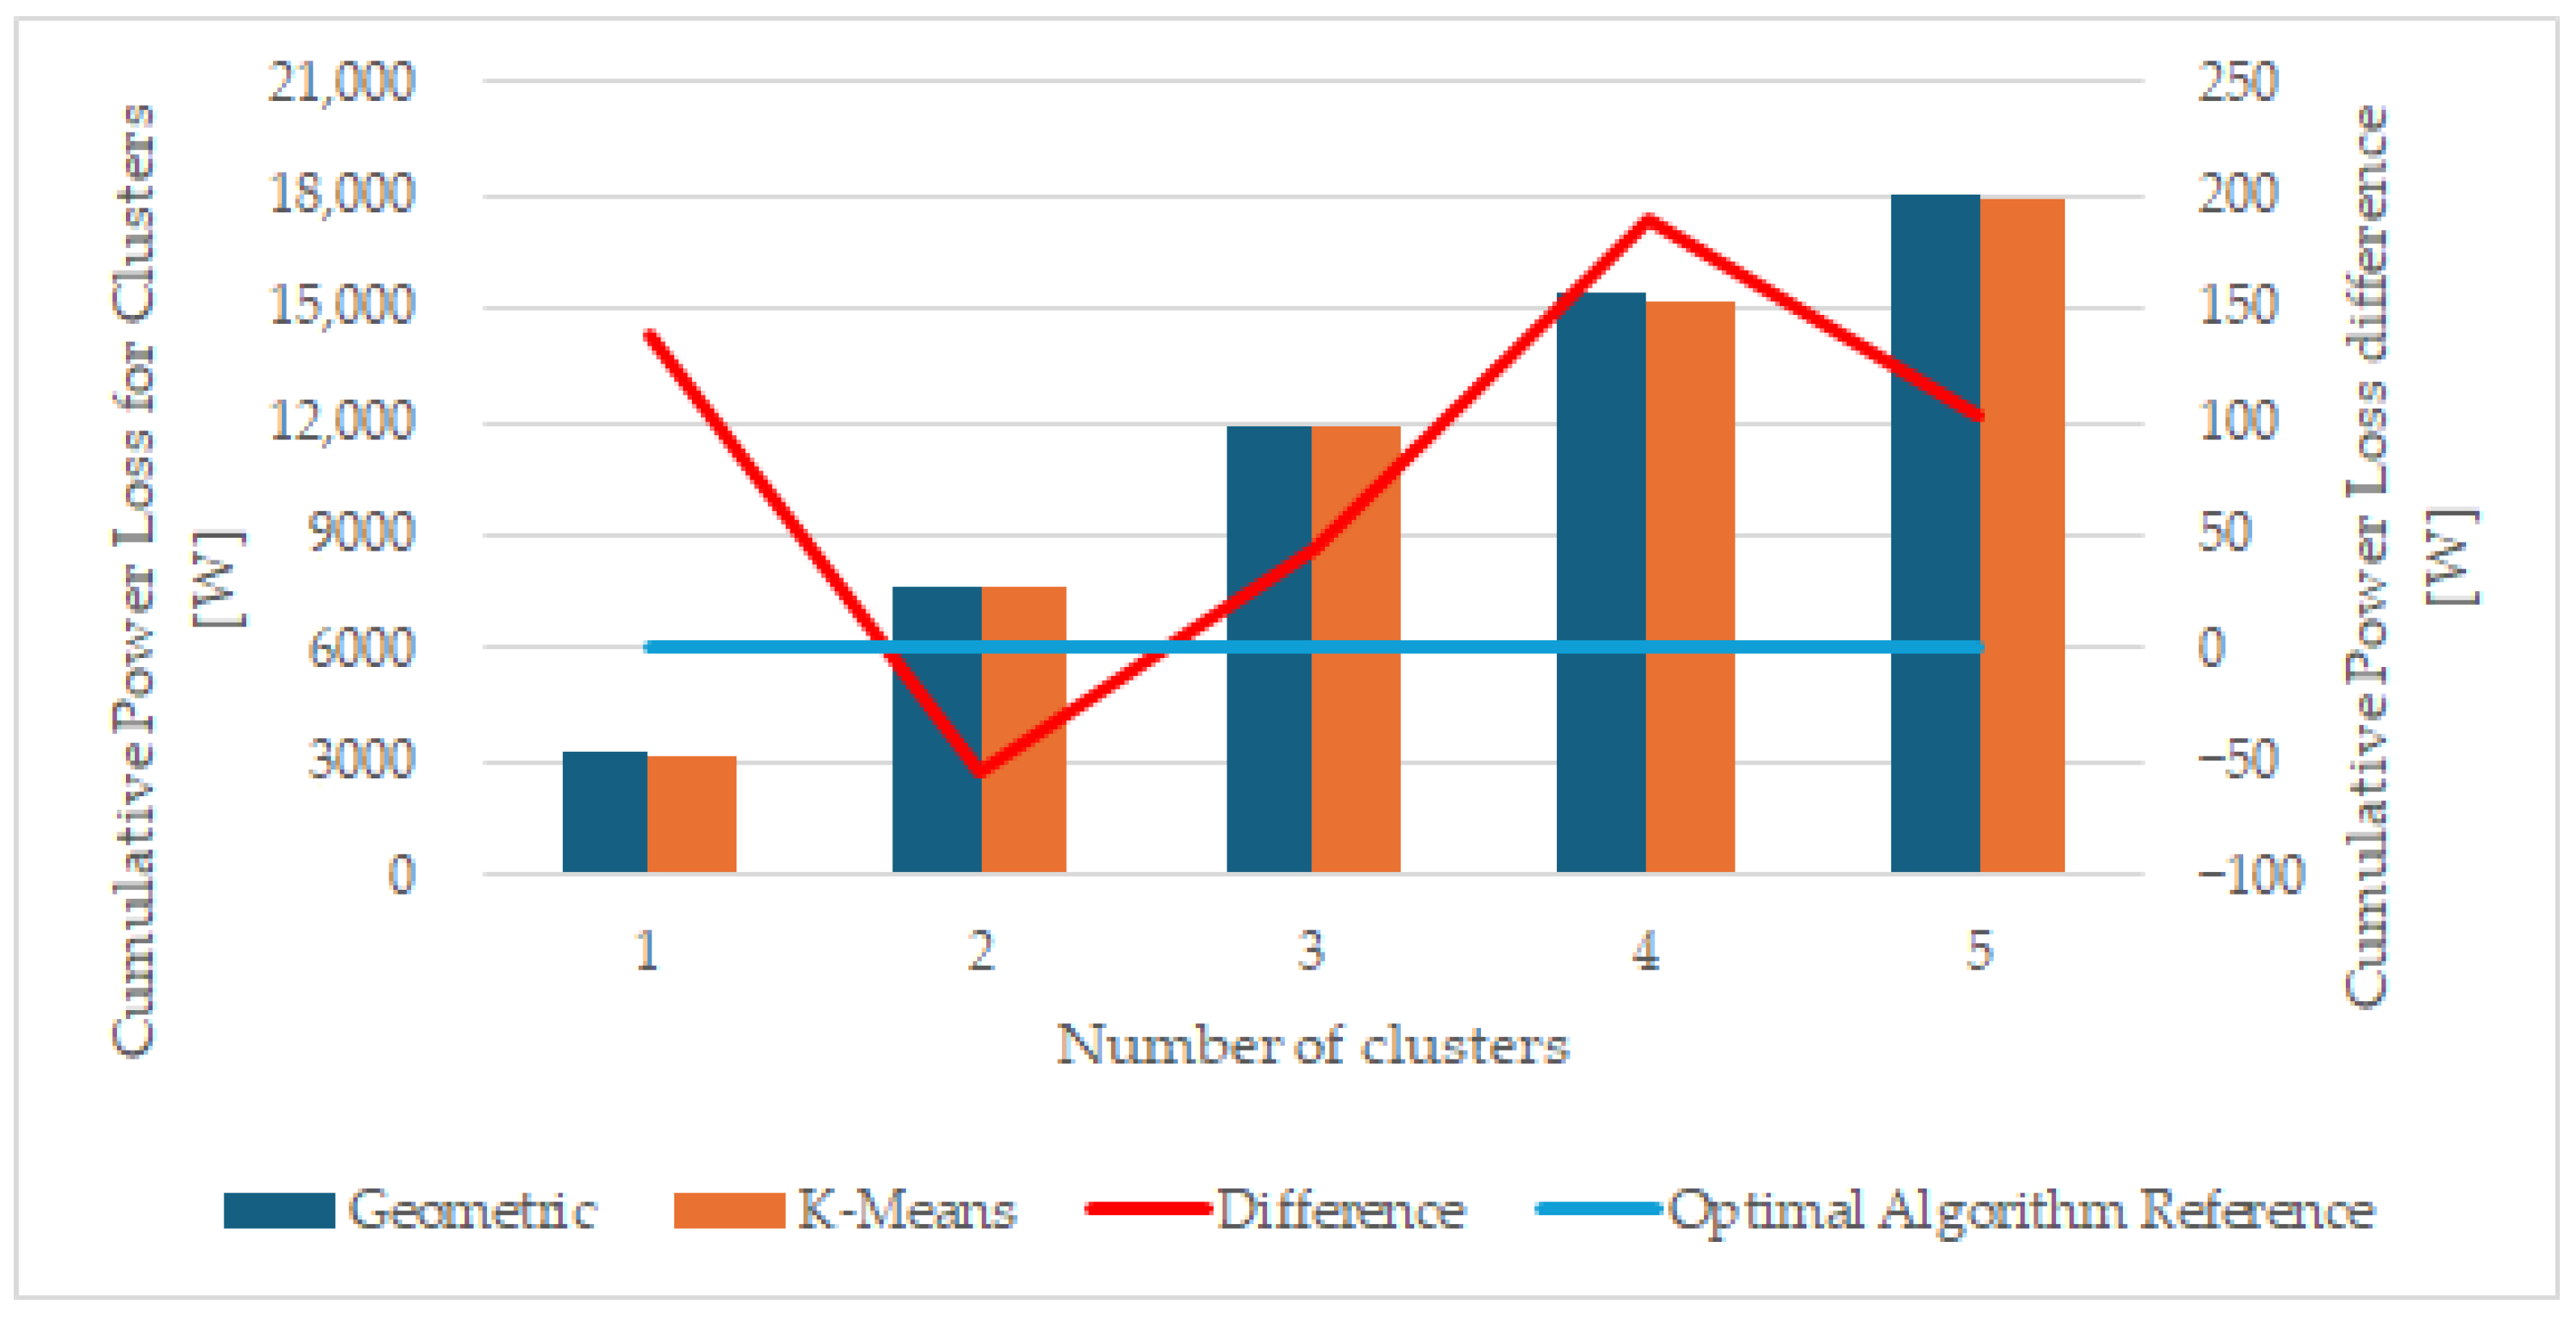
In
Figure 5, a comprehensive comparison is presented in reference to the power loss distributions resulting from the geometric algorithm and the K-means algorithm across the various studied clusters. The stacked column representations depict the cumulative power loss observed from cluster 1 to cluster 5. Notably, a discernible trend emerges, wherein the K-means algorithm consistently exhibits a diminished cumulative power loss when juxtaposed with the geometric algorithm. Furthermore, the line graph elucidates the temporal evolution of the disparity in power loss, with positive values indicating the superior performance of the K-means algorithm over its geometric counterpart and, conversely, negative values suggesting the inverse.
Figure 6 depicts the geographical positioning of the consumption points, the optimal electric substations, and the boundaries of the corresponding consumption zones based on the proposed algorithms.
It can be observed that the consumption zones can intersect. This is to be expected due to the natural uneven growth of the load presented in the study. If a substation has reached its maximum capacity, an assumption of no additional development of the substation was considered. Thus, Zone 1 and Zone 4 in
Figure 5 overlap, as well as Zone 2 and Zone 5.
The integration of this cartographic representation with the available natural and political demarcations serves to enhance our comprehension pertaining to the spatial allocation of the consumption points and substations. As shown in
Figure 7, this combination provides a clear perspective relevant to the focus of this research.
4. Discussion
The problem of determining the optimal position of electric substations remains a constant in the context of the evolving power consumption anticipated by Romanian and international governmental entities. Developing efficient algorithms has the potential to significantly reduce the computation durations of techno-economic studies.
Both methods, exemplified in this work as a geometric algorithm (a classical approach) and the K-means algorithm (representing contemporary trends), offer substation placements that ensure minimized losses. This paper corroborates that when confronted with computational resource constraints, adopting machine learning algorithms yields commendable outcomes in the mitigation of power losses. In scenarios where such limitations are absent, the expansive array of potential algorithms aligns with achieving superior results, particularly in the context of multiple consumption zones.
K-means demonstrates the capability to deliver higher performance under the hypotheses employed in this study. If the use of only one algorithm is necessary (e.g., due to computational constraints), the adoption of the K-means algorithm is recommended among the two considered.
The hypotheses of the proposed research do not incorporate considerations regarding the suitability of the proposed locations for substation placement, such as potential conflicts with existing establishments. To address these constraints, additional analysis of the vicinity surrounding the proposed locations could be conducted, followed by the determination of alternative locations adjacent to the proposed ones, utilizing the objective functions outlined in this paper. Moreover, the possibility of utilizing the next best location determined in the study, or iteratively seeking subsequent suitable locations until an optimal site is identified, holds potential for enhancing the robustness and applicability of the proposed methodology. However, it is duly acknowledged that the integration of such considerations and iterative processes warrants further exploration and refinement.
This research substantiates the imperative of formulating proficient algorithms for strategically placing electrical substations within an area of interest, with a primary focus on minimizing power losses. Contemporary computational capabilities enable the execution of machine learning tasks at nominal costs, and the retraining of models no longer presents formidable challenges.
Thus, the main conclusions can be summarized as follows:
Problem Significance: Optimizing electric substation placement is crucial for meeting changing power consumption needs, as recognized by government bodies.
Efficient Algorithms: Using efficient algorithms reduces the computation time for studies, addressing resource constraints effectively.
Classical vs. Contemporary Approaches: Both the traditional geometric and modern K-means algorithms minimize power losses through substation placement, but the K-means alternative is superior.
Role of Machine Learning: Machine learning algorithms, especially with computational constraints, effectively reduce power losses and optimize substation placement.
Algorithm Performance: The K-means algorithm is recommended for its superior performance in single-algorithm scenarios.
Considerations for Substation Placement: Additional analysis and iterative refinement can enhance the algorithm robustness by considering location suitability.
Research Implications: Efficient algorithm formulation is key to strategically placing substations and minimizing power losses using modern computational capabilities.
Subsequent research endeavors ought to concentrate on augmenting the dataset with additional features during the exploratory data analysis phase. Furthermore, a comprehensive exploration of alternative algorithms is warranted to ascertain their influence on determining the optimal positioning of a new substation.
Future research initiatives should explore alternative machine learning algorithms beyond K-means, undertaking a comparative analysis of the power loss outcomes and associated computational expenditures. Moreover, the pursuit of an enhanced Feature Engineering approach, encompassing the introduction of novel features, holds potential for yielding superior results.
Author Contributions
Conceptualization, M.E.Ț.-C.; methodology, M.E.Ț.-C. and D.A.Ț.-C.; software, M.E.Ț.-C.; validation, M.E.Ț.-C. and D.A.Ț.-C.; formal analysis, M.E.Ț.-C.; investigation, D.A.Ț.-C.; resources, M.E.Ț.-C.; data curation, M.E.Ț.-C.; writing—original draft preparation, M.E.Ț.-C. and D.A.Ț.-C.; writing—review and editing, D.A.Ț.-C.; visualization, M.E.Ț.-C. All authors have read and agreed to the published version of the manuscript.
Funding
This research received no external funding.
Institutional Review Board Statement
Not applicable.
Informed Consent Statement
Not applicable.
Data Availability Statement
Data sourced from the authoritative repository of the National Energy Regulatory Authority of Romania (ANRE) have been employed. Based on summarization of the ANRE documents, the load data were generated using the Weibull distribution from the SciPy library in Python with the following variables: shape = 0.8 and scale 6.0.
Conflicts of Interest
The authors declare no conflicts of interest.
References
- Surya, B.; Menne, F.; Sabhan, H.; Suriani, S.; Abubakar, H.; Idris, M. Economic growth, increasing productivity of smes, and open innovation. J. Open Innov. Technol. Mark. Complex. 2021, 7, 20. [Google Scholar] [CrossRef]
- Castillo, V.Z.; de Boer, H.S.; Muñoz, R.M.; Gernaat, D.E.H.J.; Benders, R.; van Vuuren, D. Future global electricity demand load curves. Energy 2022, 258, 124741. [Google Scholar] [CrossRef]
- Guvernul României. Notă Privind Prognoza Echilibrului Energetic; Guvernul României: Bucharest, Romania, 2021.
- International Energy Agency. International Energy Agency (IEA) World Energy Outlook 2022; International Energy Agency: Paris, France, 2022; p. 524. Available online: https://www.iea.org/reports/world-energy-outlook-2022 (accessed on 10 November 2023).
- Hossain, E.; Roy, S.; Mohammad, N.; Nawar, N.; Dipta, D.R. Metrics and enhancement strategies for grid resilience and reliability during natural disasters. Appl. Energy 2021, 290, 116709. [Google Scholar] [CrossRef]
- Papadis, E.; Tsatsaronis, G. Challenges in the decarbonization of the energy sector. Energy 2020, 205, 118025. [Google Scholar] [CrossRef]
- Abedi, M.H.; Hosseini, H.; Jalilvand, A. Sub-transmission substation expansion planning considering load center uncertainties of size and location. Int. J. Electr. Power Energy Syst. 2019, 109, 413–422. [Google Scholar] [CrossRef]
- Qin, C.; Li, B.; Shi, B.; Qin, T.; Xiao, J.; Xin, Y. Location of substation in similar candidates using comprehensive evaluation method base on DHGF. Meas. J. Int. Meas. Confed. 2019, 146, 152–158. [Google Scholar] [CrossRef]
- Silva, F.T.S.; Araujo, L.R.; Penido, D.R.R. Optimal Substation Placement in Distribution Systems using Artificial Immune Systems. IEEE Lat. Am. Trans. 2018, 16, 505–513. [Google Scholar] [CrossRef]
- Shu, Y.; Zhao, J. Dynamic artificial immune system with variable selection based on causal inference. Comput. Aided Chem. Eng. 2015, 37, 1793–1798. [Google Scholar] [CrossRef]
- Haghifam, M.R.; Shahabi, M. Optimal location and sizing of HV/MV substations in uncertainty load environment using genetic algorithm. Electr. Power Syst. Res. 2002, 63, 37–50. [Google Scholar] [CrossRef]
- Zambrano-Asanza, S.; Chumbi, W.E.; Franco, J.F.; Padilha-Feltrin, A. Multicriteria Decision Analysis in Geographic Information Systems for Identifying Ideal Locations for New Substations. J. Control. Autom. Electr. Syst. 2021, 32, 1305–1316. [Google Scholar] [CrossRef]
- Ciupageanu, D.A.; Costinaş, S. Improving Predictive Maintenance for HVDC Transmission Systems through Analytic Hierarchy Process. In Proceedings of the 2017 International Conference on Energy and Environment (CIEM), Bucharest, Romania, 19–20 October 2017. [Google Scholar] [CrossRef]
- Yu, L.; Shi, D.; Guo, X.; Jiang, Z.; Xu, G.; Jian, G.; Lei, J.; Jing, C. An efficient substation placement and sizing strategy based on GIS using semi-supervised learning. CSEE J. Power Energy Syst. 2018, 4, 371–379. [Google Scholar] [CrossRef]
- Kaewmamuang, K.; Siritaratiwat, A.; Surawanitkun, C.; Khunkitti, P.; Chatthaworn, R. A novel method for solving multi-stage distribution substation expansion planning. Energy Procedia 2019, 156, 371–383. [Google Scholar] [CrossRef]
- Behzadi, S.; Bagheri, A. A Convex Micro-Grid-Based Optimization Model for Planning of Resilient and Sustainable Distribution Systems Considering Feeders Routing and Siting/Sizing of Substations and DG Units. Sustain. Cities Soc. 2023, 97, 104787. [Google Scholar] [CrossRef]
- Khodr, H.M.; Melián, J.A.; Quiroz, A.J.; Picado, D.C.; Yusta, J.M.; Urdaneta, A.J. A probabilistic methodology for distribution substation location. IEEE Trans. Power Syst. 2003, 18, 388–393. [Google Scholar] [CrossRef]
- ANRE. Raport Anual Privind Activitatea ANRE; ANRE: Bucharest, Romania, 2022. [Google Scholar]
- Mu, A.C.; Guido, S. Introduction to Machine Learning with Python: A Guide for Data Scientist; O’Reilly Media, Inc.: Sebastopol, CA, USA, 2017. [Google Scholar]
- McKinney, W.; Pandas Development Team. Pandas—Powerful Python Data Analysis Toolkit; PyData: Eindhoven, The Netherlands, 2015. [Google Scholar]
- Kadhim, R.W.; Raheem, M.J.; Mohialden, Y.M.; Hussien, N.M. A Review of the Implementation of NumPy and SciPy Packages in Science and Math. Turk. J. Comput. Math. Educ. 2022, 13, 663–667. [Google Scholar]
- Hunter, J.D. Matplotlib: A 2D Graphics Environment. Comput. Sci. Eng. 2007, 9, 90–95. [Google Scholar] [CrossRef]
- Géron, A. Hands-On Machine Learning with Scikit-Learn, Keras and TensorFlow: Concepts, Tools, and Techniques to Build Intelligent Systems; O’Reilly Media, Inc.: Sebastopol, CA, USA, 2019. [Google Scholar]
- Scala, A.; Pahwa, S.; Scoglio, C.M. Cascade failures and distributed generation in power grids. Int. J. Crit. Infrastruct. 2015, 11, 067395. [Google Scholar] [CrossRef]
- Deloitte. Renewable Energy in Romania: Potential for Development by 2030; Deloitte: London, UK, 2019. [Google Scholar]
- Sedghi, M.; Ahmadian, A.; Aliakbar-Golkar, M. Assessment of optimization algorithms capability in distribution network planning: Review, comparison and modification techniques. Renew. Sustain. Energy Rev. 2016, 66, 415–434. [Google Scholar] [CrossRef]
- Ikotun, A.M.; Ezugwu, A.E.; Abualigah, L.; Abuhaija, B.; Heming, J. K-means clustering algorithms: A comprehensive review, variants analysis, and advances in the era of big data. Inf. Sci. 2023, 622, 178–210. [Google Scholar] [CrossRef]
- Meyer, E.L. The centre of gravity concept: Contemporary theories, comparison, and implications. Def. Stud. 2022, 22, 2030715. [Google Scholar] [CrossRef]
- Masum, H. Review of Computational Geometry: Algorithms and Applications (2nd ed.) by Mark de Berg, Marc van Kreveld, Mark Overmars, and Otfried Schwarzkopf. ACM SIGACT News 2000, 31, 571192. [Google Scholar] [CrossRef]
- Sinaga, K.P.; Yang, M.S. Unsupervised K-means clustering algorithm. IEEE Access 2020, 8, 80716–80727. [Google Scholar] [CrossRef]
- Ostrovsky, R.; Rabani, Y.; Schulman, L.J.; Swamy, C. The effectiveness of Lloyd-type methods for the k-means problem. J. ACM JACM 2006, 59, 1–22. [Google Scholar] [CrossRef]
- Cui, M. Introduction to the K-Means Clustering Algorithm Based on the Elbow Method. Account. Audit. Financ. 2020, 1, 5–8. [Google Scholar]
| Disclaimer/Publisher’s Note: The statements, opinions and data contained in all publications are solely those of the individual author(s) and contributor(s) and not of MDPI and/or the editor(s). MDPI and/or the editor(s) disclaim responsibility for any injury to people or property resulting from any ideas, methods, instructions or products referred to in the content. |
© 2024 by the authors. Licensee MDPI, Basel, Switzerland. This article is an open access article distributed under the terms and conditions of the Creative Commons Attribution (CC BY) license (https://creativecommons.org/licenses/by/4.0/).


