Article

Mechanisms and Impact Effects of Digital Agriculture Development on Agricultural Eco-Efficiency in China

School of Economics and Management, Northeast Forestry University, Harbin 150040, China
*
Author to whom correspondence should be addressed.
Sustainability 2024, 16(10), 4148; https://doi.org/10.3390/su16104148
Submission received: 31 March 2024 / Revised: 2 May 2024 / Accepted: 13 May 2024 / Published: 15 May 2024
(This article belongs to the Section Sustainable Agriculture)

Abstract

:
The green development of agriculture is an essential way to achieve high-quality agricultural development, and the development of digitalization has given new momentum to the green development of agriculture. In this study, based on the panel data of 30 provinces in China from 2011 to 2022, we measure the agricultural eco-efficiency and the level of digital agriculture development in China using the Super-SBM model with global reference and the entropy value method, respectively. The impact of the level of digital agriculture development on agricultural eco-efficiency is explored with the help of a regression model, and the mediating role of pesticide and fertilizer inputs in this impact pathway is explored using a mediating effects model. The study found that: (1) the level of digital agriculture development positively and significantly affects agricultural eco-efficiency to a relatively large extent; (2) the effect of digital agriculture development on the improvement of agriculture eco-efficiency is significantly heterogeneous in different regions; (3) pesticide and fertilizer inputs have a mediating role in this impact pathway. Therefore, the application and promotion of digital agriculture technology should be strengthened to build a green agricultural production and management system, so as to promote high-quality and sustainable development of Chinese agriculture.

1. Introduction

China has been a major agricultural country since ancient times, and with the development of the digital economy, the combination of agriculture and digitalization has gradually become a must for high-quality agricultural development. In 2022, the State Council released the “14th Five-Year Plan for the Development of the Digital Economy”, which proposes to vigorously improve the level of digital agriculture development, promote comprehensive information services for the “Three Rural Areas”, innovate the development of smart agriculture, and improve the level of digital agriculture development across agricultural production, processing, sales and logistics. Digital agriculture harnesses cutting-edge technologies like the Internet of Things, Big Data, and Artificial Intelligence to reduce the burden on farmers and increase agricultural productivity [1]. It also enhances the quality of agricultural products, increases farmers’ incomes [2], promotes sustainable agricultural development [3,4] and facilitates the prosperity of the rural economy. To this end, work on building an agricultural digital service platform, promoting the digitization of the entire agricultural industry chain, and accelerating the upgrading of the wisdom of agricultural parks has also been carried out around the world, all of which play an essential role in improving the efficiency of the agricultural system of production, building a modern agricultural production system, and fostering the high-quality development of agriculture [5]. Chinese agricultural digitization is still in a relatively early stage; the relevant agricultural digital infrastructure, digital networks, etc., are gradually building, the transformation and upgrading of digital agriculture will take a period of time to build and develop, and the combination of agriculture and digitalization is the shift from traditional agriculture to modern agriculture, and it is an essential part of the revitalization of the countryside and the construction of a smart countryside [6,7].
In recent years, numerous scholars have assessed the agricultural eco-efficiency and the level of digital agriculture development in China, and have carried out useful explorations of the relationship between digital agriculture development in rural areas and agricultural eco-efficiency. First of all, research on agricultural eco-efficiency primarily concentrates on measuring and analyzing the spatio-temporal evolution of agricultural eco-efficiency [8,9,10,11], the analysis of factors affecting agricultural eco-efficiency [12,13], and the study of paths to improve agricultural eco-efficiency [14,15]. Secondly, research on digital agriculture development mainly focuses on the measurement of the level of digital agriculture development in China and the analysis of regional differences [16,17], the paths and suggestions for digital agriculture development [18], and the exploration of mechanisms such as digital agriculture development boosting high-quality development and driving rural revitalization development [19,20,21,22]. Finally, in the exploration of the relationship between digital agriculture development and agricultural green development in rural areas, scholars generally agree that there is a significant correlation between them. Shengyue Fan et al. [23] (2021) used a spatial econometric model to find that the level of digitalization has a positive spatial spillover effect on the green development of agriculture; Shaorong Jin et al. [24] (2022) found that rural digitization has a significant contributing effect on the growth of green total factor productivity in agriculture and is mainly achieved by promoting the advancement of agricultural technology; Xinxin Zhou et al. [25] (2023) argued that digital agriculture significantly improves agricultural green total factor productivity, and human capital plays a moderating role; Liping Zhao et al. [26] (2023) found that rural digitization level enhancement can significantly promote agricultural carbon emission reduction at the national level. With the rapid advancement of digital technology, further investigation and research on the impact of digital agriculture development on the green growth of agriculture is a crucial direction for the expansion of theoretical research.
By combing through the above literature, it can be seen that scholars are less likely to study the mechanism and path of influence of the level of digital agriculture development on agricultural eco-efficiency. Compared to the existing literature, this paper makes the following marginal contributions: this study incorporates the net agricultural carbon sink into the agricultural eco-efficiency measurement index system and constructs a relatively comprehensive digital agriculture measurement index system; it investigates the impact of digital agriculture development on agricultural eco-efficiency by means of a benchmark regression and analyzes the extent of the impact and the heterogeneity between regions; at the same time, the mediating effect model was used to analyze the mediating role of pesticide and fertilizer inputs in the path of the impact of the level of development of digital agriculture on agricultural eco-efficiency, in order to be able to provide relevant references for the green development of agriculture, the construction of a strong agricultural country and the revitalization of the countryside.

2. Theoretical Analysis and Research Hypotheses

With the development of digital agriculture, the agricultural and rural big data system has been established and promoted and applied, and the new generation of information technology such as the Internet of Things, Big Data, Artificial Intelligence, Blockchain and other information technologies have also been deeply integrated with agricultural production and operation [27,28,29,30]. Meanwhile, the progress in digital agriculture has been integrated into all aspects of agricultural production. In terms of ecology, digital technology can help farmers implement ecological conservation and restoration measures, such as the creation of ecological corridors and the protection of wildlife. At the same time, digital agricultural technology can help farmers diversify their planting structure and crop rotation, reduce the pressure on the ecosystem caused by single-crop planting, and help to protect biodiversity, promote ecosystem balance and restoration, and improve the stability of agro-ecosystems and their resistance to disturbances. In terms of monitoring and early warning, digital agriculture can monitor soil status, climatic conditions and crop growth through sensor networks, detect pests and diseases in a timely manner, provide early warning and take measures to reduce the risk of agricultural eco-efficiency [31], thus improving agricultural eco-efficiency. In terms of large-scale production, the application of AI, 5G technology, etc., promotes standardized agricultural operations and improves the level of agricultural mechanization and agricultural intensification of inputs, thus optimizing the agricultural production process. In terms of agricultural management, digital technology can provide accurate soil, weather, crop growth and other data to help farmers achieve accurate fertiliser, application of fertilizer, irrigation and pest control, minimize the usage of pesticides and fertilizers, and reduce pollution of the soil and the ecological environment [32]; it can also achieve a rational allocation of resources and improve the efficiency of input resource use. Overall, digital agriculture development improves agricultural eco-efficiency by strengthening eco-environmental protection, improving agricultural monitoring and early warning, promoting large-scale agricultural operations and achieving precise agricultural management. The specific impact process is shown in Figure 1. Accordingly, this study proposes the first hypothesis.
Hypothesis 1 (H1). 
The development of digital agriculture positively and significantly affects the agricultural eco-efficiency.
Digital agriculture development has led to the full application of Artificial Intelligence and Big Data in agricultural production, which allows farmers to understand soil conditions, crop needs, and pests and diseases more accurately, so as to achieve precise application of fertilizers and precise application of medicines [33]. This precision application decreases the overreliance on pesticides and fertilizers, avoids problems such as soil eutrophication caused by excessive application of single-species fertilizers, reduces the risk of fertilizer and pesticide residues and pollution, reduces the agriculture’s adverse effects on the environment [34,35], and improves agricultural eco-efficiency. At the same time, the scale and uniformity of this digital production method also prevents farmers from arbitrarily determining the time of pesticide application, which can effectively reduce the behavior of multiple pesticide applications brought about by inconsistencies in the time and type of application [36], which is also conducive to the improvement in agricultural eco-efficiency. Overall, the development of digital agriculture promotes the practice of eco-friendly agriculture, and through ecosystem model optimization and precision management, it can reduce the dependence on chemical pesticides and fertilizers, avoid the waste of fertilizers and pesticides, improve the utilization of resources, adopt alternatives such as organic fertilizers and biopesticides [37], improve agricultural eco-efficiency, and promote the balance and stability of agroecosystems to promote the sustainable development of agriculture. Accordingly, the second hypothesis is proposed in this study.
Hypothesis 2 (H2). 
Fertilizer and pesticide input intensity has a significant mediating effect on the pathway of digital agriculture development on agricultural eco-efficiency.

3. Materials and Methods

3.1. Data Sources

In order to ensure the continuity and authenticity of the data, 2011–2022 was selected as the sample interval for the study. Considering the completeness of the data, 30 provinces and regions in China (excluding Tibet, Hong Kong, Macao and Taiwan) were selected for the study. The raw data of the research indicators mainly come from the China Statistical Yearbook, China Rural Statistical Yearbook, China Tertiary Industry Statistical Yearbook, statistical yearbooks of provinces, municipalities and autonomous regions, and the official website of the National Bureau of Statistics. For individual missing data, linear interpolation was used to make up for them.

3.2. Variable Selection

3.2.1. Explained Variable

The explained variable in this study is agricultural eco-efficiency, which is mainly obtained by selecting indicators from the input–output perspective and using the Super-SBM model with global reference for measurement. Input indicators are selected from the agricultural sown area, number of people employed in agriculture, irrigated area, gross power of agricultural machinery, diesel use in agriculture, application of agricultural fertilizer, pesticide use, and use of agricultural film, and desired output indicators are selected from gross agricultural product (with 2011 as the base period) and net carbon sink in agriculture, and based on which, a system of indicators for agricultural eco-efficiency in China is constructed, as shown in Table 1.
The number of people employed in agriculture in the input section and the net carbon sink in agriculture in the output section of the indicator system are not directly counted, and the specific estimation methods used in this study are as follows:
  • Number of people employed in agriculture
The number of people employed in agriculture is estimated by multiplying the number of people employed in agriculture, forestry, animal husbandry and fisheries by the proportion of the total value of agricultural output in the total value of agricultural, forestry, animal husbandry and fisheries output.
  • Net carbon sink in agriculture
The agricultural net carbon sink is obtained by subtracting the total agricultural carbon emissions from the total agricultural carbon sequestration.
Firstly, the agricultural carbon emissions are calculated with reference to the carbon emission model and relevant coefficients of Bo Li et al. [38].
E = E i = T i × σ i
where E is the total amount of carbon emissions from agriculture, Ei is the amount of carbon emissions from each type of carbon source, Ti is the amount of each type of carbon source, and σi is the carbon emission coefficient of each type of carbon source. Among them, pesticide is 4.9341 kg/kg, agricultural fertilizer is 0.8956 kg/kg, agricultural plastic film is 5.18 kg/kg, agricultural diesel is 0.5927 kg/kg, agricultural ploughing is 312.6 kg/km2, and agricultural irrigation is 20.476 kg/hm2.
Secondly, agricultural carbon sequestration was referred to in Kerang Li’s study [39], which was calculated based on the economic coefficients, carbon sequestration rates, and water content of the main crops, and the carbon content of each crop and other indicators were quoted from the relevant literature [40,41].
C = C j × D j = C j × 1 r j Y j / H j
where C denotes total crop carbon sequestration; Cj denotes the carbon sequestration rate of a crop; Dj, Yj and Hj denote the biological yield, economic yield and economic coefficient of a crop, respectively; rj denotes the water content of the economic product part of the crop; and j denotes the crop species. The crop species, economic coefficients, carbon sequestration rates and water content selected for this study are shown in Table 2.

3.2.2. Core Explanatory Variable

The core explanatory variable in this study is the level of digital agriculture development, which is measured using the entropy value method. Digital agriculture is the use of digital information technology as a new agricultural production factor; digital management of agricultural production and operation activities is carried out with the assistance of digitalization, informatization and intelligence, to achieve the networked, intelligent and refined operation of agricultural production. Starting from the connotation of digital agriculture, this study is based on the China Digital Rural Development Report (2019) and the 2020 Evaluation Report on the Level of Digital Agricultural and Rural Development of National Counties, and draws on the relevant research results of domestic scholars [16,42]. This study constructs an indicator system for measuring the level of digital agriculture development from five levels: digital agriculture development environment, digital agriculture infrastructure, human and technology resources, digital agriculture green development, and digital agriculture economic benefits, as shown in Table 3.

3.2.3. Control Variables

Referring to the pertinent existing research [43] and combining the characteristics of China’s agro-ecological development, the control variables were selected as agricultural resource endowment, level of financial support to agriculture, industrial structure, agricultural disaster rate, land use intensity, agricultural machinery intensity and rural electricity consumption. The selection of each variable and its description are shown in Table 4.

3.3. Research Methods and Modelling

3.3.1. Super-SBM Model with Global Reference

The SBM model is developed from the DEA model. Considering that multiple decision-making units located on the frontier cannot be compared, tone combines the SBM model with the Super-DEA model to propose a Super-SBM model that can solve this problem [44,45]. The Super-SBM model can better resolve the problem of multiple DMU efficiency values of 1.0 in the results calculated by the traditional DEA model. The basic principle of the Super-SBM Model lies in finding the effective decision-making units in the SBM model and then sorting them with Super-SBM, and the Super-SBM model with global reference can effectively solve the problem that the efficiency values cannot be compared across periods. In order to obtain more accurate efficiency values, the Super-SBM model with global reference is used in this study. The formula is as follows:
m i n ρ = 1 1 m i = 1 m s i / x i k 1 + 1 s i = 1 s s r + / y r k
s . t . x k = X λ + s
y k = Y λ + s +
λ 0 , s 0 , s + 0
where m and s denote the number of input and output indicators, respectively, s and s+ denote the input and output slack variables, respectively, xk and yk denote the input and output vectors of DMU, respectively, i and r denote the different evaluation units, and λ is a column vector. ρ is an indicator of agricultural eco-efficiency, the larger ρ, the higher the agricultural eco-efficiency; 0 < ρ < 1 denotes that there is room for improvement in the agricultural eco-efficiency; ρ ≥ 1 indicates that agricultural eco-efficiency reaches the effective level.

3.3.2. Entropy Value Method

In the multi-index comprehensive evaluation, the entropy method is more suitable for evaluating different research objects in multiple time periods than the principal component method and the equal weight determination method. In this study, the entropy method is selected to calculate the weight of agricultural digitization indicators in each region, and the standardized data are processed. The outlined steps are as follows:
In the first step, in order to eliminate the influence of its dimension and order of magnitude, the positive and negative indicator data are standardized. The positive indicator means that the higher the value of the indicator, the better the development of digital agriculture. The negative indicator indicates that the smaller the value of the indicator, the better the development of digital agriculture. At the same time, in order to prevent Zλij = 0, the whole index is moved backwards by 0.0001 units, and the standardization method is as follows:
Z λ i j = ( a λ i j min ( a λ i j ) ) / ( max ( a λ i j ) min ( a λ i j ) ) + 0.0001
Z λ i j = ( max ( a λ i j ) a λ i j ) / ( max ( a λ i j ) min ( a λ i j ) ) + 0.0001
where aλij represents the original value of the λth year, the ith province, and the jth indicator, and Zλij is the result after standardization.
The second step is the normalization of the indicators:
P λ i j = Z λ i j / λ = 1 h i = 1 m Z λ i j
where h represents a total of h years and m represents a total of m provinces.
The third step involves calculating the entropy value for each index:
E j = k λ = 1 h i = 1 m P λ i j ln P λ i j
The fourth step is to calculate the redundancy of entropy value of each index:
D j = 1 E j
The fifth step is dedicated to determining the weight of each indicator:
W j = D j / j = 1 n D j
where n represents a total of n indicators.
The sixth step is to calculate the level of digital agriculture development in each province in each year:
M λ i = j = 1 n Z λ ij × W j

3.3.3. Kernel Density Estimation

The kernel density estimation method is a non-parametric approach to estimation, which takes the data sample itself as the entry point, uses the probability density function to fit, obtains a continuous and smooth density curve, and analyzes the characteristics of the curve, such as the peak and ductility, to solve the problem. It is an important method for solving practical problems using statistical methods. Its formula is:
f ( x ) = 1 n h i = 1 n K ( x i x h )
In the formula: f(x) is the density function, n is the number of observations, h denotes the bandwidth, xi represents independent identically distributed observations, and K(x) is the kernel function.

3.3.4. Benchmark Regression Model

In this study, we constructed the following Benchmark Regression Model to explore the influence of digital agriculture development levels on agricultural eco-efficiency:
E i , t = α 0 + α 1 M i , t + δ X i , t + μ i + ε i , t
where Ei,t is agricultural eco-efficiency, Mi,t is the level of digital agriculture development, Xi,t is the control variable, i represents the region, t denotes the year, α0 is the intercept term, α1 and δ both denote variable correlation coefficients, μi represents the fixed effect, and ɛi,t represents the random error term.

3.3.5. Mediating Effects Model

In order to verify whether there is a significant mediating effect of pesticide use and agricultural fertilizer application between the level of digital agriculture development and agricultural eco-efficiency, this paper constructs a mediating effect model based on Equation (15) as follows:
D i , t = β 0 + β 1 M i , t + β X i , t + μ i + ε i , t
E i , t = λ 0 + λ 1 M i , t + λ 2 D i , t + λ X i , t + μ i + ε i , t
where Di,t denotes the mediator variable, β0 and λ0 is the intercept term, β1, β, λ1, λ2 and λ denotes the variable correlation coefficient, and the other parameter values and symbols are consistent with Equation (15).

4. Results

4.1. Analysis of the Spatio-Temporal Evolution of Agricultural Eco-Efficiency and the Level of Digital Agriculture Development

4.1.1. Evolution of Agricultural Eco-Efficiency

In this study, the Super-SBM model with global reference was used to measure the agricultural eco-efficiency of 30 provinces in China, and the years 2011, 2015, 2019, and 2022 were selected as the sample years to be demonstrated, and the specific results are presented in Table 5. As Table 5 shows, on the whole, the agricultural eco-efficiency of most provinces in China shows an upward trend, which is mainly due to the fact that China has been implementing sustainable agricultural development policies, including strengthening agricultural scientific and technological innovations, promoting refined management, implementing agro-ecological compensation and other measures, which have contributed to more environmentally friendly and efficient agricultural production. Meanwhile, the overall agricultural eco-efficiency shows a large increase during 2019–2022, which suggests that documents such as the National Strategic Plan for Quality Agriculture (2018–2022) and the National Agricultural Green Development Plan for the 14th Five-Year Plan released during this period have played a certain guidance. In terms of subregions, the Northeast region has the highest average agricultural eco-efficiency among the four regions, which is due to the fact that the Northeast region is the main agricultural production area in China, with a higher level of large-scale and mechanized agricultural production. The level of agricultural eco-efficiency in the eastern region was not high in the early years, but has improved greatly in recent years, mainly due to the phenomenon of “polluting first, treating later” that existed in the development of the eastern region in the early years.
In order to further explore the distribution dynamic evolution characteristics of China’s agricultural eco-efficiency, the six years of 2012, 2014, 2016, 2018, 2020 and 2022 are selected for observation in Kernel density estimation (Figure 2). As evident from the figure, the location of the main peak shows the characteristics of “right-left-right”, showing a short and small leftward shift from 2016 to 2018, and the main peak moves to the right in other years, indicating that the overall level of agricultural eco-efficiency in China shows an increasing trend. Among them, there are side peaks in 2012 and 2014, and the side peaks disappear after 2014, indicating that the absolute difference in agricultural eco-efficiency among provinces decreases.

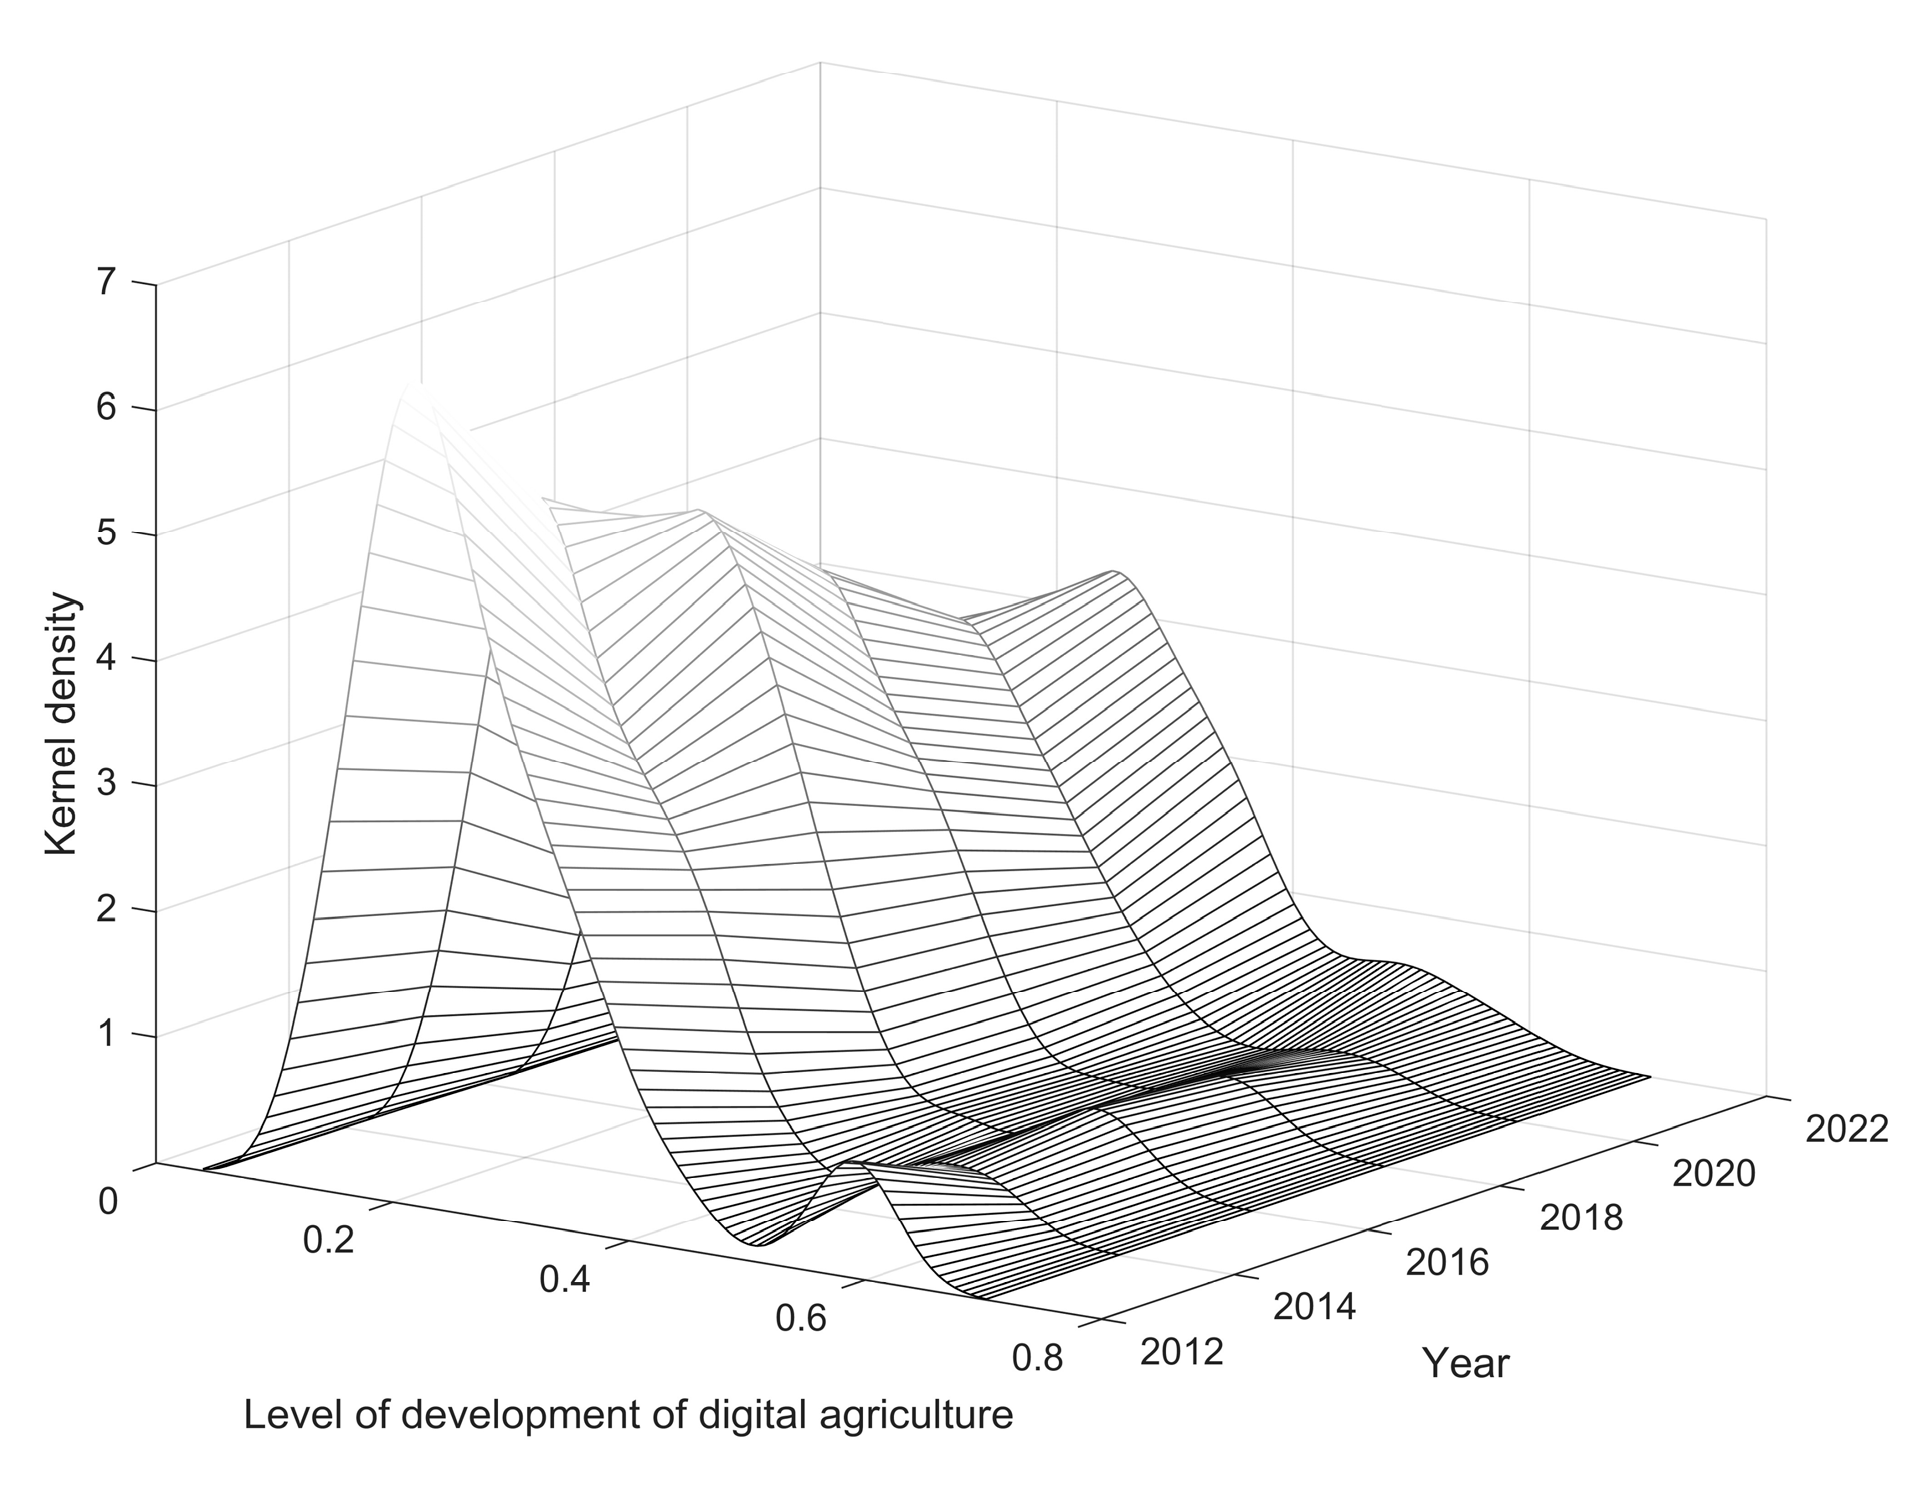
4.1.2. Evolution of the Level of Digital Agriculture Development

The level of China’s agricultural digitalization development from 2011 to 2022 is calculated by the entropy method, and 2011, 2015, 2019 and 2022 are selected as sample years for display, as shown in Table 6. As can be seen from Table 6, the level of digital agriculture development has significant regional characteristics. As a whole, the trend of changes in the level of digital agriculture development in the eastern, central and western regions is broadly in line with that of the entire country as a whole, but there are still large differences between different regions. In terms of regions, the eastern region is mostly coastal cities, with significant advantages in economic foundation and agricultural technology level over other regions, and its level of digital agriculture development has always been higher than the national average and is in a leading position; the level of digital agriculture development in the central region is close to the national average and the gap is narrowing, exceeding the national average in 2020; the northeastern region as a whole fluctuates little; the western region was at the bottom of the list in terms of digital agriculture development until 2020 due to poor infrastructure development and relatively backward economic development.
In order to further explore the distribution and dynamic evolution characteristics of the development level of digital agriculture in China, six years of 2012, 2014, 2016, 2018, 2020 and 2022 were selected as observation time points for Kernel density estimation (Figure 3). From the perspective of distribution, during the investigation period, the main peak of digital agriculture development level nationwide is at a low level, and there is a side peak at a relatively high level, indicating that most provinces have a low level of digital agriculture development, while some provinces have a high level of digital agriculture development. Through the control of provinces, it is found that the emergence of side peaks originates from Guangdong Province and Jiangsu Province. The reason is that the good economic environment, sound digital infrastructure and rich human resources of the two provinces have provided an essential guarantee for the development of digital agriculture. With regard to the distribution pattern, it shows a decrease in the height of the main peak and an increase in the width, indicating that the gap in the level of digital agriculture development between provinces and regions has become wider, and the absolute difference shows a trend of enhancement. From the perspective of distribution extensibility, the distribution curve shows a certain tailing phenomenon, indicating that the development level of digital agriculture in some provinces is still higher than the national average level.

4.2. Mechanisms of the Impact of the Level of Digital Agriculture Development on Agricultural Eco-Efficiency

4.2.1. Benchmark Regression Analysis

Table 7 demonstrates the regression findings of the impact of the level of digital agriculture development on agricultural eco-efficiency. In the analysis, in an attempt to avoid the bias of estimation results due to multicollinearity, the variance inflation factor (VIF) of the explanatory variables was initially calculated. The results revealed that all VIFs of the explanatory variables were below 10, indicating the absence of multicollinearity and enabling the conduct of regression analyses.
The regression outcomes from the benchmark model presented in Table 7 show that the coefficients of the core explanatory variable, the level of digital agriculture development (M) on agricultural eco-efficiency (E), are significantly positive and pass the 1% level of significance in the cases of both not including control variables and including them. In terms of regression coefficients, the regression coefficient of the level of digital agriculture development (M) is 1.2454 when control variables are included, and the level of digital agriculture development has the greatest degree of impact on agroecological efficiency compared to the three control variables, namely, agricultural resource endowment (X1), agricultural disaster rate (X4), and rural electricity consumption (X7), which have also passed the test of a significance level of 1%. This suggests that the development of digital agriculture is conducive to enhancing agroecological efficiency, thus validating Hypothesis 1 of this study.
The reason why digital agriculture development can enhance agricultural eco-efficiency is that it can effectively integrate and utilize information technology to achieve accurate agricultural management. Through sensors, remote sensing technology, drones and other digital tools, agricultural producers can monitor real-time data on soil moisture, crop growth, pests and diseases, so as to accurately apply fertilizers and irrigation, reduce the use of pesticides and fertilizers, reduce the negative impact on the ecological environment, and enhance the agricultural eco-efficiency.
In addition, from the regression results of other control variables, agricultural resource endowment (X1), level of financial support to agriculture (X2), agricultural disaster rate (X4) and rural electricity consumption (X7) all passed the test of significance in statistical significance and in economic significance in the direction of the expected impact. Agricultural resource endowment, measured in terms of arable land area per capita, is significantly positive at the 1% level, and is usually accompanied by agricultural modernization and scientific and technological progress, which allows agricultural production to be more finely managed, reducing resource waste and environmental burdens, thus improving agricultural eco-efficiency. The significantly negative level of financial support for agriculture probably stems from the fact that the scope of China’s financial assistance to agriculture is not limited to various types of agricultural machinery and agricultural machinery socialization services, but may also have a certain proportion of fertilizers, pesticides and other elements of agricultural materials. The significantly negative effect of agricultural disaster rate on agricultural eco-efficiency is mainly due to the negative impact of natural disasters on agricultural production and ecosystems. The main reason for the significantly negative rural electricity consumption may lie in the relationship between electricity consumption and energy sources, which, if the increase in rural electricity consumption relies mainly on traditional fossil energy sources such as coal or oil, will lead to more greenhouse gas emissions and environmental pollution, exacerbating the problems of global warming and atmospheric pollution, thus harming the health of agro-ecosystems.

4.2.2. Robustness Tests

In order to ensure the reliability of the main findings of this paper, the main effects were tested for robustness in different ways. Firstly, the methodology of the model study was changed and the model was re-estimated using tobit regression, the results of which are presented in column (1). Then, the lag order of the explanatory variables was adjusted for verification. Generally speaking, the explanatory variables in the early period will have a sustained impact on the later agricultural eco-efficiency. Taking into account the time lag problem, the explanatory variables lagged one period into the model to re-test the impact on the agricultural eco-efficiency; the regression outcomes are given in column (2). Finally, the method of measuring the explanatory variables is changed, and agricultural carbon emissions are included in the indicator system of agricultural eco-efficiency measurement as non-desired outputs, and agricultural eco-efficiency is re-measured using the Super-SBM model with global reference that includes non-desired outputs, and the regression results are given in column (3). As Table 8 shows, three robustness tests are conducted and there is no essential change in the sign and significance of the coefficients of the core explanatory variables, and the levels of digital agriculture development are all positively significant at the 1% level, indicating that the estimates are robust.

4.2.3. Heterogeneity Tests

The impact of the level of digital agriculture development on agricultural eco-efficiency is likely to be heterogeneous across regions, influenced mainly by inter-regional differences in ecological environment, infrastructure and policies. First, ecological differences between regions can lead to different ways of practicing digital agriculture, and factors such as climate, soil type, and topography can affect the applicability and effectiveness of digital agricultural technologies. Second, the level of development of agricultural infrastructure varies from region to region, including differences in network coverage, electricity supply and agricultural technical services, which can affect the degree of adoption and application of digital agricultural technologies. In addition, policy support and financial inputs vary in different regions, which may affect the pace and depth of digital agriculture development.
The results of the heterogeneity test are shown in Table 9, from which it can be seen that the level of digital agriculture development in the eastern, central and western regions has a significantly positive impact on agricultural eco-efficiency and passes the test of significance at least at the 5% level, and the impact is not significant in the northeast region. The main reason for this phenomenon may be that the application of digital agricultural technology is more widespread and deeper in the eastern region, probably due to its developed economy and higher level of technology; the central region is at an intermediate stage in the development of digital agriculture, and although its level of development is slightly lower than that of the eastern region, it still has better infrastructure and policy support, which contributes to the promotion and application of digital agriculture. The western region, on the other hand, is likely to benefit from focused government support and investment in the development of digital agriculture, which, coupled with the region’s relatively fragile agro-ecology, can be more directly improved by the implementation of digital agriculture; the non-significant results in the Northeast may be due to the fact that its special geographic and climatic conditions impose certain limitations on the application of certain digital agriculture technologies. In addition, the Northeast is dominated by grain cultivation and has a relatively low degree of agricultural diversification, which may lead to the application of digital agriculture in the Northeast being less effective than in other regions.

4.2.4. Analysis of Mediating Effects

As mentioned earlier, the level of digital agriculture development may affect agricultural eco-efficiency by influencing pesticide use and agricultural fertilizer application. In order to verify this mechanism, it is necessary to demonstrate the effect of the level of digital agriculture development on the mediating variable and then the effect of the mediating variable on agricultural eco-efficiency. Columns (2) and (3) of Table 10 show the estimation results of the effect of the level of digital agriculture development on the mediating variables. The results show that the effects of the level of digital agriculture development on pesticide and fertilizer inputs are all negatively significant at the 1% level, i.e., as the level of digital agriculture development increases, agricultural production can be monitored and managed more accurately and intelligently for precise fertilizer and pesticide use, and pesticide and fertilizer inputs will decrease. Columns (4) and (5) of Table 10 demonstrate the effect of the mediating variables on agricultural eco-efficiency and show that the estimated coefficients of both pesticide use and agricultural fertilizer application are significantly negative at the 5% level, suggesting that pesticide and fertilizer inputs exacerbate surface source pollution and thus reduce agricultural eco-efficiency. Thus, the level of digital agriculture development affects agricultural eco-efficiency by influencing the amount of pesticide and fertilizer inputs. Thus, Hypothesis 2 of this study was tested.

5. Conclusions and Recommendations

Based on the panel data of 30 provinces in China (excluding Tibet, Hong Kong, Macao and Taiwan) from 2011 to 2022, this study measured agricultural eco-efficiency with the help of the Super-SBM model with global reference, measured the level of digital agriculture development with the help of the entropy method, empirically examined the influential relationship between the level of digital agriculture development and agricultural eco-efficiency with the help of the fixed effect model, and empirically tested its influential relationship using the mediating effect model to analyze the influence mechanism. The following conclusions were obtained: first, the level of digital agriculture development positively and significantly affects agricultural eco-efficiency, which means that agricultural eco-efficiency increases as the level of digital agriculture development increases; second, the effect of digital agriculture development on the improvement of agricultural eco-efficiency is significantly heterogeneous in different regions, with a significant positive effect on agricultural eco-efficiency in the eastern, central and western regions, and a non-significant effect in the northeastern region; third, fertilizer and pesticide inputs have a mediating role in the path of the impact of the level of digital agriculture development on agricultural eco-efficiency, which means that an increase in the level of digital agriculture development reduces the amount of pesticide and fertilizer inputs, thus increasing agricultural eco-efficiency.
Despite the extensive and in-depth research conducted in this paper, a number of limitations remain. Firstly, the sample of this paper is not comprehensive enough; due to the large amount of missing data from Tibet and Hong Kong, Macao and Taiwan, the research sample of this paper only chooses 30 provinces in China. Secondly, this paper only examines the impact of the level of digital agriculture development on agricultural eco-efficiency without discussing in depth its impact on the environment or biodiversity. Based on this, in the future, we will choose to carry out research in the following aspects: firstly, we will expand the research sample, spatially try to refine the research level from the provincial level to prefectural cities, and temporally track this issue in the long term; secondly, interdisciplinary cooperation should be strengthened to discuss how the level of digital agriculture development affects the environment and biodiversity in different regions, and to quantify and study the mechanisms of impact, drawing on theories and methodologies in related fields.
Drawing from the aforementioned findings, the ensuing policy recommendations are outlined as follows:
  • Strengthen the application and promotion of digital agriculture technology to achieve synergistic development of digital technology and green agriculture. Establish a comprehensive digital infrastructure, including smart sensors and remote monitoring systems, in order to realize data collection in the entire process of agricultural production. At the same time, carry out digital training for agricultural practitioners to improve their ability to use digital technology, so that they can better utilize advanced technology for agricultural production management.
  • Build a green agricultural production and management system and optimize the management of pesticide and fertilizer use. Establish a sound management system for the use of pesticides and chemical fertilizers, including the setting of reasonable standards and quotas for their use, and strengthen regular monitoring of farmland in order to detect and correct non-compliant use of pesticides and chemical fertilizers in a timely manner. At the same time, drive the research, development and dissemination of green alternatives such as biological control and organic fertilizers to reduce the demand for chemical pesticides and fertilizers. Finally, incentive policies, such as the provision of subsidies and rewards, are used to encourage farmers to adopt environmentally friendly and sustainable agricultural production methods.

Author Contributions

Conceptualization, Y.J. and Z.F.; methodology, Z.F.; software, Z.F.; validation, Z.F. and Y.B.; formal analysis, Z.F.; investigation, Z.F.; resources, Y.B.; data curation, Z.F. and Y.B.; writing—original draft preparation, Y.J. and Z.F.; writing—review and editing, Y.J. and Z.F.; visualization, Z.F.; supervision, Y.J. and Z.F.; project administration, Y.J.; funding acquisition, Y.J. All authors have read and agreed to the published version of the manuscript.

Funding

National College Students’ Innovation and Entrepreneurship Training Program of Northeast Forestry University, grant number 202310225324.

Institutional Review Board Statement

Not applicable.

Informed Consent Statement

Not applicable.

Data Availability Statement

The data presented in this study are available on request from the first author.

Conflicts of Interest

The authors declare no conflicts of interest.

References

  1. Yuan, L.; Zhang, L.; Zhang, J. The impact of informationization of agricultural services on farmers’ production efficiency: A double inspection based on service stages and service objects. Res. Agric. Mod. 2023, 44, 1059–1069. [Google Scholar]
  2. Xu, X.; Xu, Z.; Wu, B. Can digital rural construction promote income growth for rural residents?—PSM-DID test based on 801 counties. Study Explor. 2023, 45, 77–89+178. [Google Scholar]
  3. Huang, Y.; Li, X.; Chi, J.; Wang, Y. Spatial spillover and threshold effect of rural digitalization on agricultural carbon emission intensity. J. Kunming Univ. Sci. Technol. (Nat. Sci.) 2024, 49, 180–191. [Google Scholar]
  4. Zhong, W.; Li, D. Digitalization and green production in agricultural enterprises: Evidence from the planting industry. Economist 2024, 118–128. [Google Scholar] [CrossRef]
  5. Zhan, S.; Wan, Z. Realistic logic, practical path and safeguard countermeasures of digital intelligence service enabling high-quality digital-real integration in agriculture. Southwest Finance 2024, 45, 81–92. [Google Scholar]
  6. Wang, Y.; Niu, X. Study on digital economy for rural revitalisation. Chin. J. Agric. Resour. Reg. Plann. 2024, 45, 44+56. [Google Scholar]
  7. Li, Y. Theological logic and practical strategies of digital technology for rural revitalisation. Agric. Econ. 2023, 43, 40–42. [Google Scholar]
  8. Wang, B.; Zhang, W. A research of agricultural eco-efficiency measure in China and space-time differences. China Popul. Resour. Environ. 2016, 26, 11–19. [Google Scholar]
  9. Zheng, D.; Hao, S.; Sun, C. Evaluation of agricultural ecological efficiency and its spatial-temporal differentiation based on DEA-ESDA. Sci. Geogr. Sin. 2018, 38, 419–427. [Google Scholar]
  10. Pang, J.; Chen, X.; Zhang, Z.; Li, H. Measuring eco-efficiency of agriculture in China. Sustainability 2016, 8, 398. [Google Scholar] [CrossRef]
  11. Chi, M.; Guo, Q.; Mi, L.; Wang, G.; Song, W. Spatial distribution of agricultural eco-efficiency and agriculture high-quality development in China. Land 2022, 11, 722. [Google Scholar] [CrossRef]
  12. Huang, J.; Liu, Y. Measurement of agro-ecological efficiency and analysis of its influencing factors in the Three Gorges reservoir area. Stat. Decis. 2018, 34, 123–127. [Google Scholar]
  13. Deng, Y.; Chao, B. Provincial agricultural ecological efficiency and its influencing factors in China from the perspective of grey water footprint. Sci. Agric. Sin. 2022, 55, 4879–4894. [Google Scholar]
  14. Fang, Y.; Zeng, X. Evaluation and improvement of agricultural eco-efficiency in China. J. Agric. Resour. Environ. 2021, 38, 135–142. [Google Scholar]
  15. Zhang, Y.; Zhang, L.; Han, L. Study on the evaluation and promotion path of agricultural ecological efficiency: An empirical analysis of 17 prefecture level cities in Shandong Province. Ecol. Econ. 2021, 37, 118–124+131. [Google Scholar]
  16. Liu, Z. Study on digital agriculture development level, regional differences and spatiotemporal evolution characteristics. Stat. Decis. 2023, 39, 94–99. [Google Scholar]
  17. Li, F. Measurement of digital agriculture level and spatial location distribution in the context of Chinese-style modernization. Feed Res. 2023, 46, 186–192. [Google Scholar]
  18. Chen, J.; Xiong, L. Research on the connotation, function mechanism, challenge and promotion path of digital agriculture. Southwest Finance 2022, 43, 92–102. [Google Scholar]
  19. Meng, J.; Zhao, B.; Song, Y.; Lin, X. Research on the spatial dynamic evolution of digital agriculture-evidence from china. Sustainability 2024, 16, 735. [Google Scholar] [CrossRef]
  20. Yao, W. The mechanism and promotion path of the impact of digital agriculture on the achievement of the goal of building a strong agricultural country—Empirical testing based on the perspective of building a strong agricultural province. J. South China Norm. Univ. Soc. Sci. Ed. 2023, 68, 31–55+205–206. [Google Scholar]
  21. Hu, J.; Zhao, W. The strategy for promoting rural revitalization with digital agriculture. Acad. Exch. 2023, 39, 140–153. [Google Scholar]
  22. Walter, A. How will digitalization change agriculture? Int. Trade Forum 2016, 2016, 28–29. [Google Scholar] [CrossRef]
  23. Fan, S.; Li, Y.; Ma, X.; Liu, H. An empirical study of the impact of digital level on agricultural green development—Based on the panel data 30 provinces of China. World Agric. 2021, 4–16. [Google Scholar] [CrossRef]
  24. Jin, S.; Ren, Z. The Impact of Rural Digitalization on Agricultural Green Total Factor Productivity. Reform 2022, 35, 102–118. [Google Scholar]
  25. Zhou, X.; Chen, T.; Zhang, B. Research on the Impact of Digital Agriculture Development on Agricultural Green Total Factor Productivity. Land 2023, 12, 195. [Google Scholar] [CrossRef]
  26. Zhao, L.; Rao, X.; Ding, S. Can rural digitization promote agricultural carbon reduction? J. Huazhong Agric. Univ. Soc. Sci. Ed. 2023, 42–52. [Google Scholar] [CrossRef]
  27. Wan, S.; Tang, K. Research on the mechanism and path of digital economy promoting rural industry revitalization. Acad. J. Zhongzhou 2022, 44, 29–36. [Google Scholar]
  28. Pylianidis, C.; Osinga, S.; Athanasiadis, I.N. Introducing digital twins to agriculture. Comput. Electron. Agric. 2021, 184. [Google Scholar] [CrossRef]
  29. Runck, B.C.; Joglekar, A.; Silverstein, K.A.T.; Chan-Kang, C.; Pardey, P.G.; Wilgenbusch, J.C. Digital agriculture platforms: Driving data-enabled agricultural innovation in a world fraught with privacy and security concerns. Agron. J. 2022, 114, 2635–2643. [Google Scholar] [CrossRef]
  30. Yao, W.; Sun, Z. The impact of the digital economy on high-quality development of agriculture: A china case study. Sustainability 2023, 15, 5745. [Google Scholar] [CrossRef]
  31. Yan, H.; Qiao, J. The impact of agricultural productive services on grain production: An empirical study based on china′s provincial panel data from 2008 to 2017. Commer. Res. 2020, 107–118. [Google Scholar] [CrossRef]
  32. Luo, J.; Jin, X.; Liu, J.; Liang, X.; Han, B.; Zhou, Y. Process and influencing factors of agricultural eco-efficiency in northern Jiangsu of China from 2000 to 2020. Trans. Chin. Soc. Agric. Eng. 2023, 39, 239–248. [Google Scholar]
  33. Liu, Q.; Lin, Z.; Pu, L. Comparisons and revelation of eco-economic rationality of fertilizer use in three countries of CHN-KAZ-GER. Soil Fert. Sci. China 2019, 56, 99–107+203. [Google Scholar]
  34. Quan, W.; Yan, L. Effects of agricultural non-point source pollution on eutrophica tion of water body and its control measure. Acta Ecol. Sin. 2002, 22, 291–299. [Google Scholar]
  35. Hou, M.; Deng, Y.; Yao, S. Rural labor transfer, fertilizer use intensity and agro-ecological efficiency: Interaction effects and spatial spillover. J. Agric. Technol. Econ. 2021, 79–94. [Google Scholar] [CrossRef]
  36. Ying, R.; Xu, B. Effects of regional pest control adoption on pesticides application. China Popul. Resour. Environ. 2017, 27, 90–97. [Google Scholar]
  37. Liu, H. Speed up the construction of digital agriculture and add new energy to agricultural and rural modernization. Chin. J. Agric. Resour. Reg. Plann. 2017, 38, 1–6. [Google Scholar]
  38. Li, B.; Zhang, J.; Li, H. Research on spatial-temporal characteristics and affecting factors decomposition of agricultural carbon emission in China. China Popul. Resour. Environ. 2011, 21, 80–86. [Google Scholar]
  39. Li, K. Land-Use Change and Net Greenhouse Gas Emissions and the Carbon Cycle in Terrestrial Ecosystems; Meteorological Publishing Co.: Beijing, China, 2002. [Google Scholar]
  40. Chen, L.; Hao, J.; Wang, F.; Yin, Y.; Gao, Y.; Duan, W.; Yang, J. Carbon sequestration function of cultivated land use system based on the carbon cycle for the Huang-Huai-Hai. Plain. Resour. Sci. 2016, 38, 1039–1053. [Google Scholar]
  41. Tian, Y.; Zhang, J. Regional differentiation research on net carbon effect of agricultural production in China. J. Nat. Resour. 2013, 28, 1298–1309. [Google Scholar]
  42. Zhang, H.; Wang, H.; Li, Z. Research on High Quality Development Evaluation of Digital Agriculture Under the Background of Rural Revitalization—Based on the Data Analysis of 31 Provinces and Cities in China From 2015 to 2019. J. Shaanxi Norm. Univ. Philos. Soc. Sci. Ed. 2021, 50, 141–154. [Google Scholar]
  43. Wang, B.; Zhang, W. Cross-provincial differences in determinants of agricultural eco-efficiency in china: An analysis based on panel data from 31 provinces in 1996–2015. Chin. Rural Econ. 2018, 34, 46–62. [Google Scholar]
  44. Tone, K. A slacks: Based measure of super-efficiency in data envelopment analysis. Eur. J. Oper. Res. 2002, 143, 32–41. [Google Scholar] [CrossRef]
  45. Andersen, P.; Petersen, N.C. A procedure for ranking efficient unitsin data envelopment analysis. Manage. Sci. 1993, 39, 1261–1264. [Google Scholar] [CrossRef]
Figure 1. Diagram of the action path.
Sustainability 16 04148 g001
Figure 2. Kernel density map of agricultural eco-efficiency.
Sustainability 16 04148 g002
Figure 3. Kernel density map of digital agriculture development levels.
Sustainability 16 04148 g003
Table 1. Indicator system for measuring agricultural eco-efficiency.
Primary IndicatorsSecondary IndicatorsVariable Description
InputLand (103 hm2)Crop sown area
Labor (104 people)Number of people employed in agriculture
Irrigation (103 hm2)Irrigated agricultural area
Machinery (104 kw)Total power of agricultural machinery
Energy (104 t)Agricultural diesel usage
Fertilizer (104 t)Amount of agricultural chemical fertilizer applied
Pesticides (104 t)Pesticide usage
Membrane (104 t)Usage of agricultural membranes
outputEconomic
(100 million CNY)
Total agricultural production output value
Ecological (104 t)Net carbon sink in agriculture
Note: CNY is the Chinese currency and on 25 April 2024, 1 EUR = 7.64 CNY and 1 USD = 7.11 CNY.
Table 2. Economic coefficients, carbon sequestration rates, and water content of major crops.
Crop TypesCrop NamesCarbon Sequestration RateWater ContentEconomic Coefficients
CerealsRice (crop)0.410.120.45
Wheat0.490.120.40
Corn0.470.130.40
Beans0.340.130.45
Potatoes0.420.700.70
Cash crop (economics)Sugar cane0.450.500.50
Sugar beet0.410.750.70
Tobacco0.450.850.55
Cotton0.450.080.10
Peanut0.450.100.43
Rapeseed0.450.100.25
Garden cropVegetables0.450.900.65
Melons and fruits0.450.900.70
Table 3. Evaluation system of digital agriculture development level.
DimensionIndicatorProperty
Digital agriculture
development environment
Investment in fixed assets in transport, storage and postal services (CNY 100 million)+
Investing in fixed assets within the information transmission, software, and information technology services industry (CNY 100 million)+
Gross power of agricultural machinery (104 kw)+
Rural electricity consumption (108 kw)+
Number of environmental and agrometeorological observation stations (Number)+
Digital agriculture
infrastructure
Rural year-end computer ownership per million households (Number)+
Rural year-end mobile phone ownership per million households (Number)+
Number of rural Internet broadband access subscribers (104 households)+
Rural cable broadcasting and television penetration rate (%)+
Length of long-distance fibre-optic cable routes (kilometres)+
Rural mail coverage (%)+
Human and technical
resources
Employees in the information transmission, software and information technology services industry (104 people)+
Number of enterprises in the software and information technology services industry (Number)+
Financial expenditure on science and technology (CNY 100 million)+
Total telecommunication services (CNY 100 million)+
Digital agriculture
green production
Fertiliser use (104 t)
Pesticide use (t)
Plastic film use (t)
Effective irrigated area (103 hm2)+
Digital agriculture
economic benefits
Gross output value of agriculture, forestry, livestock and fisheries
(CNY 100 million)
+
E-commerce sales (CNY 100 million)+
E-commerce purchases (CNY 100 million)+
Note: “+” for positive indicators, “−“ for negative indicators.
Table 4. Description of variables.
CategoryVariable SelectionDescription of Variables
Explained variableAgricultural eco-efficiency (E)Measured by the Super-SBM model with global reference
Core explanatory variableLevel of development of digital agriculture (M)Measured by the entropy method
Mediating variablesPesticide use (104 t) (D1)Direct statistics
Fertiliser application in agriculture (104 t) (D2)Direct statistics
Control variablesAgricultural resource endowment (mu/person) (X1)Cultivated land area/number of people working in agriculture
Level of financial support for agriculture (%) (X2)Agriculture, forestry and water expenditure/local general public budget expenditure
Industrial structure (%) (X3)Value added of primary sector/GDP
Agricultural disaster rate (%) (X4)Area affected by crops/total area sown with crops
land use intensity (%) (X5) Effective irrigated area/total sown area of crops
Strength of agricultural machinery (10 kw/hm2) (X6)Total power of agricultural machinery/area sown with crops
Rural electricity consumption (108 kw) (X7)Direct statistics
Table 5. Measurement results of agroecological efficiency in 30 provinces in China.
Regions2011201520192022Average
Beijing0.520.600.510.610.56
Tianjin0.440.580.791.040.67
Hebei0.420.470.560.700.52
Shanghai1.020.670.691.020.79
Jiangsu0.520.670.710.900.68
Zhejiang0.290.400.551.020.50
Fujian0.280.550.541.030.50
Shandong0.430.520.590.720.55
Guangdong0.460.640.811.050.68
Hainan0.420.510.521.080.56
Eastern average0.480.560.630.920.60
Shanxi0.380.420.470.570.46
Anhui0.380.420.460.600.46
Jiangxi0.400.520.600.710.55
Henan0.480.550.670.800.61
Hubei0.450.510.560.720.54
Hunan0.510.540.520.730.55
Central average0.430.490.550.690.53
Liaoning0.520.570.640.730.60
Jilin0.640.670.841.010.78
Heilongjiang0.620.731.011.020.85
Northeastern average0.590.650.830.920.74
Inner Mongolia0.450.490.630.730.59
Guangxi0.950.860.971.040.95
Chongqing0.490.630.620.790.61
Sichuan0.570.670.741.000.70
Guizhou0.351.010.811.050.74
Yunnan0.390.460.651.000.58
Shaanxi0.530.610.681.040.68
Gansu0.290.370.400.520.37
Qinghai0.370.450.531.020.54
Ningxia0.380.530.590.720.55
Xinjiang0.760.680.821.030.83
Western average0.500.610.680.900.65
National average0.490.580.650.870.62
Table 6. Measurement results of digital agriculture development level in 30 provinces in China.
Regions2011201520192022Average
Beijing0.200.260.360.440.30
Tianjin0.070.100.100.120.10
Hebei0.160.200.260.270.22
Shanghai0.150.250.280.310.24
Jiangsu0.340.490.570.520.49
Zhejiang0.200.260.370.340.29
Fujian0.130.190.260.200.20
Shandong0.240.340.450.510.38
Guangdong0.350.440.670.620.51
Hainan0.040.050.070.070.06
Eastern average0.190.260.340.340.28
Shanxi0.080.100.110.140.10
Anhui0.110.160.230.280.19
Jiangxi0.090.110.160.180.13
Henan0.160.200.280.320.23
Hubei0.120.200.290.280.22
Hunan0.120.150.240.270.19
Central average0.110.160.220.240.18
Liaoning0.160.220.170.170.18
Jilin0.090.120.130.110.12
Heilongjiang0.110.140.170.160.15
Northeastern average0.120.160.160.150.15
Inner Mongolia0.090.110.130.150.12
Guangxi0.080.120.170.200.14
Chongqing0.070.100.160.200.13
Sichuan0.140.210.330.320.24
Guizhou0.060.090.150.160.11
Yunnan0.080.100.160.160.13
Shaanxi0.100.130.190.170.14
Gansu0.060.070.100.110.08
Qinghai0.040.050.060.060.05
Ningxia0.040.050.060.060.05
Xinjiang0.080.110.130.150.12
Western average0.080.110.150.160.12
National average0.130.170.230.230.19
Table 7. Benchmark model regression results.
VariablesNo Control VariablesInclude Control Variables
M1.5281 ***
(6.71)
1.2454 ***
(5.15)
X1 0.0107 ***
(5.26)
X2 −1.4410 *
(−2.02)
X3 0.3574
(0.43)
X4 −0.2644 ***
(−3.12)
X5 −0.2200
(−1.37)
X6 −0.0268
(−0.18)
X7 −0.0002 ***
(−4.11)
_cons0.3336 ***
(7.85)
0.5092 ***
(3.52)
R20.26120.4621
N360360
Note: * and *** indicate significance levels at 10% and 1%, respectively.
Table 8. Robustness test results.
Variables(1)
E
(2)
E
(3)
E
M1.245 ***
(8.443)
1.274 ***
(7.824)
1.285 ***
(5.257)
Control variableYESYESYES
_cons0.377 ***
(3.101)
0.536 ***
(4.634)
0.510 ***
(3.454)
R2 0.4530.447
N360330360
Note: *** indicate significance levels at 1%.
Table 9. Heterogeneity test results.
VariablesEastern RegionCentral RegionNortheastern RegionWestern Region
EEEE
M0.5386 **
(2.1870)
1.1458 ***
(5.2976)
−0.8579
(−0.5222)
1.9738 ***
(4.6884)
Control variableYESYESYESYES
_cons1.2985 ***
(5.2913)
0.3951 ***
(3.4625)
0.0707
(0.2111)
0.3232
(1.2745)
R20.4210.8880.4880.500
N1207236132
Note: **, and *** indicate significance levels at 5% and 1%, respectively.
Table 10. Results of the mediation effect test for pesticide and fertilizer application rates.
Variables(1)(2)(3)(4)(5)
ED1D2EE
M1.245 ***
(5.149)
−12.129 ***
(−5.610)
−224.734 ***
(−4.030)
0.878 ***
(3.064)
0.850 ***
(3.257)
D1 −0.030 **
(−2.696)
D2 −0.002 **
(−2.726)
X10.011 ***
(5.263)
−0.049 **
(−2.105)
0.033
(0.105)
0.009 ***
(4.571)
0.011 ***
(5.610)
X2−1.441 *
(−2.018)
9.965
(1.311)
347.689 ***
(3.545)
−1.139 *
(−1.709)
−0.829
(−1.174)
X30.357
(0.426)
12.348
(1.231)
5.883
(0.041)
0.732
(1.021)
0.368
(0.443)
X4−0.264 ***
(−3.120)
0.855
(1.119)
1.928
(0.236)
−0.238 **
(−2.712)
−0.261 ***
(−3.120)
X5−0.220
(−1.375)
0.621
(0.603)
−1.871
(−0.108)
−0.201
(−1.276)
−0.223
(−1.420)
X6−0.027
(−0.182)
0.273
(0.467)
17.631 *
(1.895)
−0.018
(−0.124)
0.004
(0.028)
X7−0.000 ***
(−4.106)
0.001 *
(1.704)
0.013 **
(2.271)
−0.000 ***
(−3.557)
−0.000 ***
(−3.067)
_cons0.509 ***
(3.516)
5.437 ***
(3.537)
175.204 ***
(10.932)
0.674 ***
(4.532)
0.818 ***
(4.514)
N360360360360360
r20.4620.5700.4600.4820.486
Note: *, **, and *** indicate significance levels at 10%, 5%, and 1%, respectively.
Disclaimer/Publisher’s Note: The statements, opinions and data contained in all publications are solely those of the individual author(s) and contributor(s) and not of MDPI and/or the editor(s). MDPI and/or the editor(s) disclaim responsibility for any injury to people or property resulting from any ideas, methods, instructions or products referred to in the content.

