


Impacts of Low-Carbon City Pilot Policy on Urban Land Green Use Efficiency: Evidence from 283 Cities in China


Abstract
1. Introduction
2. Theoretical Analysis and Research Hypotheses
2.1. Direct Impact of LCCPP on ULGUE
2.2. The Spatial Spillover Effect of LCCPP
2.3. Influence Mechanism of Energy Utilization Intensity and Urban Innovation Level
3. Methodology and Data
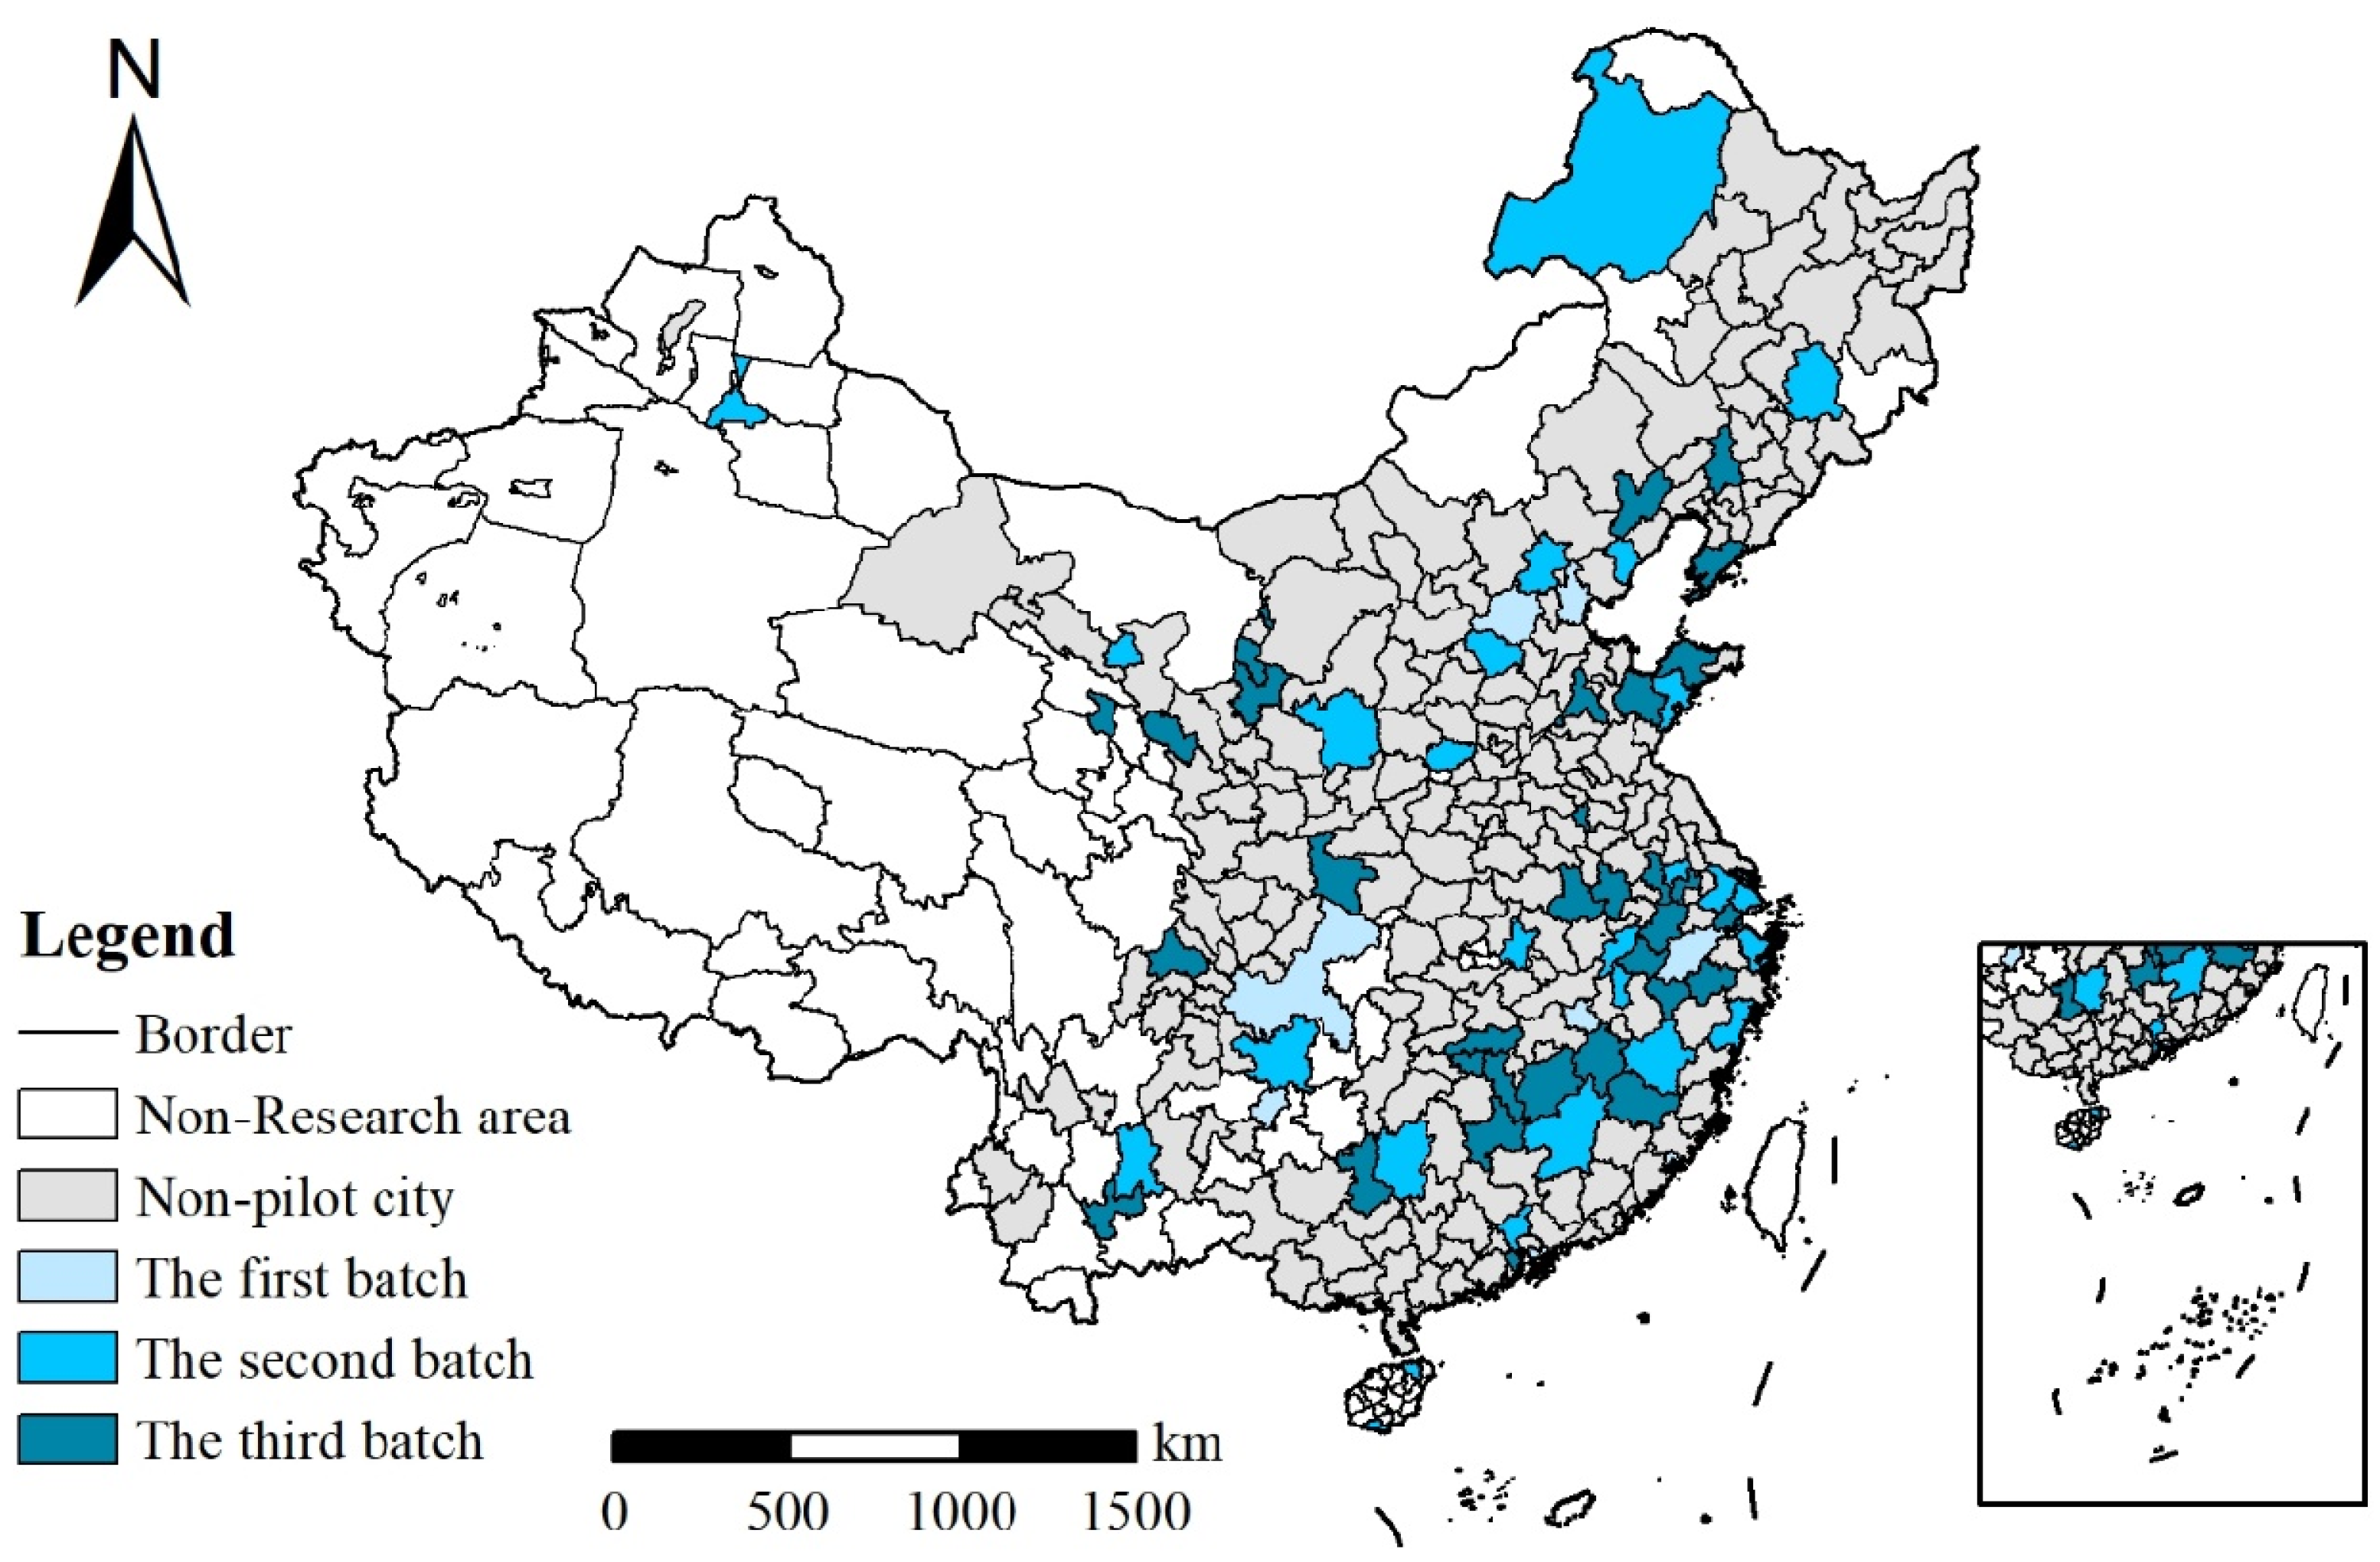
3.1. Research Area
3.2. Measurement of ULGUE
3.2.1. Super-Efficiency Slack-Based Measure Model with Undesirable Outputs
3.2.2. Selection of Measurement Indicators
3.3. Model Building
3.3.1. Multi-Period Difference-in-Differences Model
3.3.2. Spatial Difference-in-Differences Model
3.3.3. Intermediary Effects Model
3.4. Variable Setting and Data Resource
4. Empirical Results
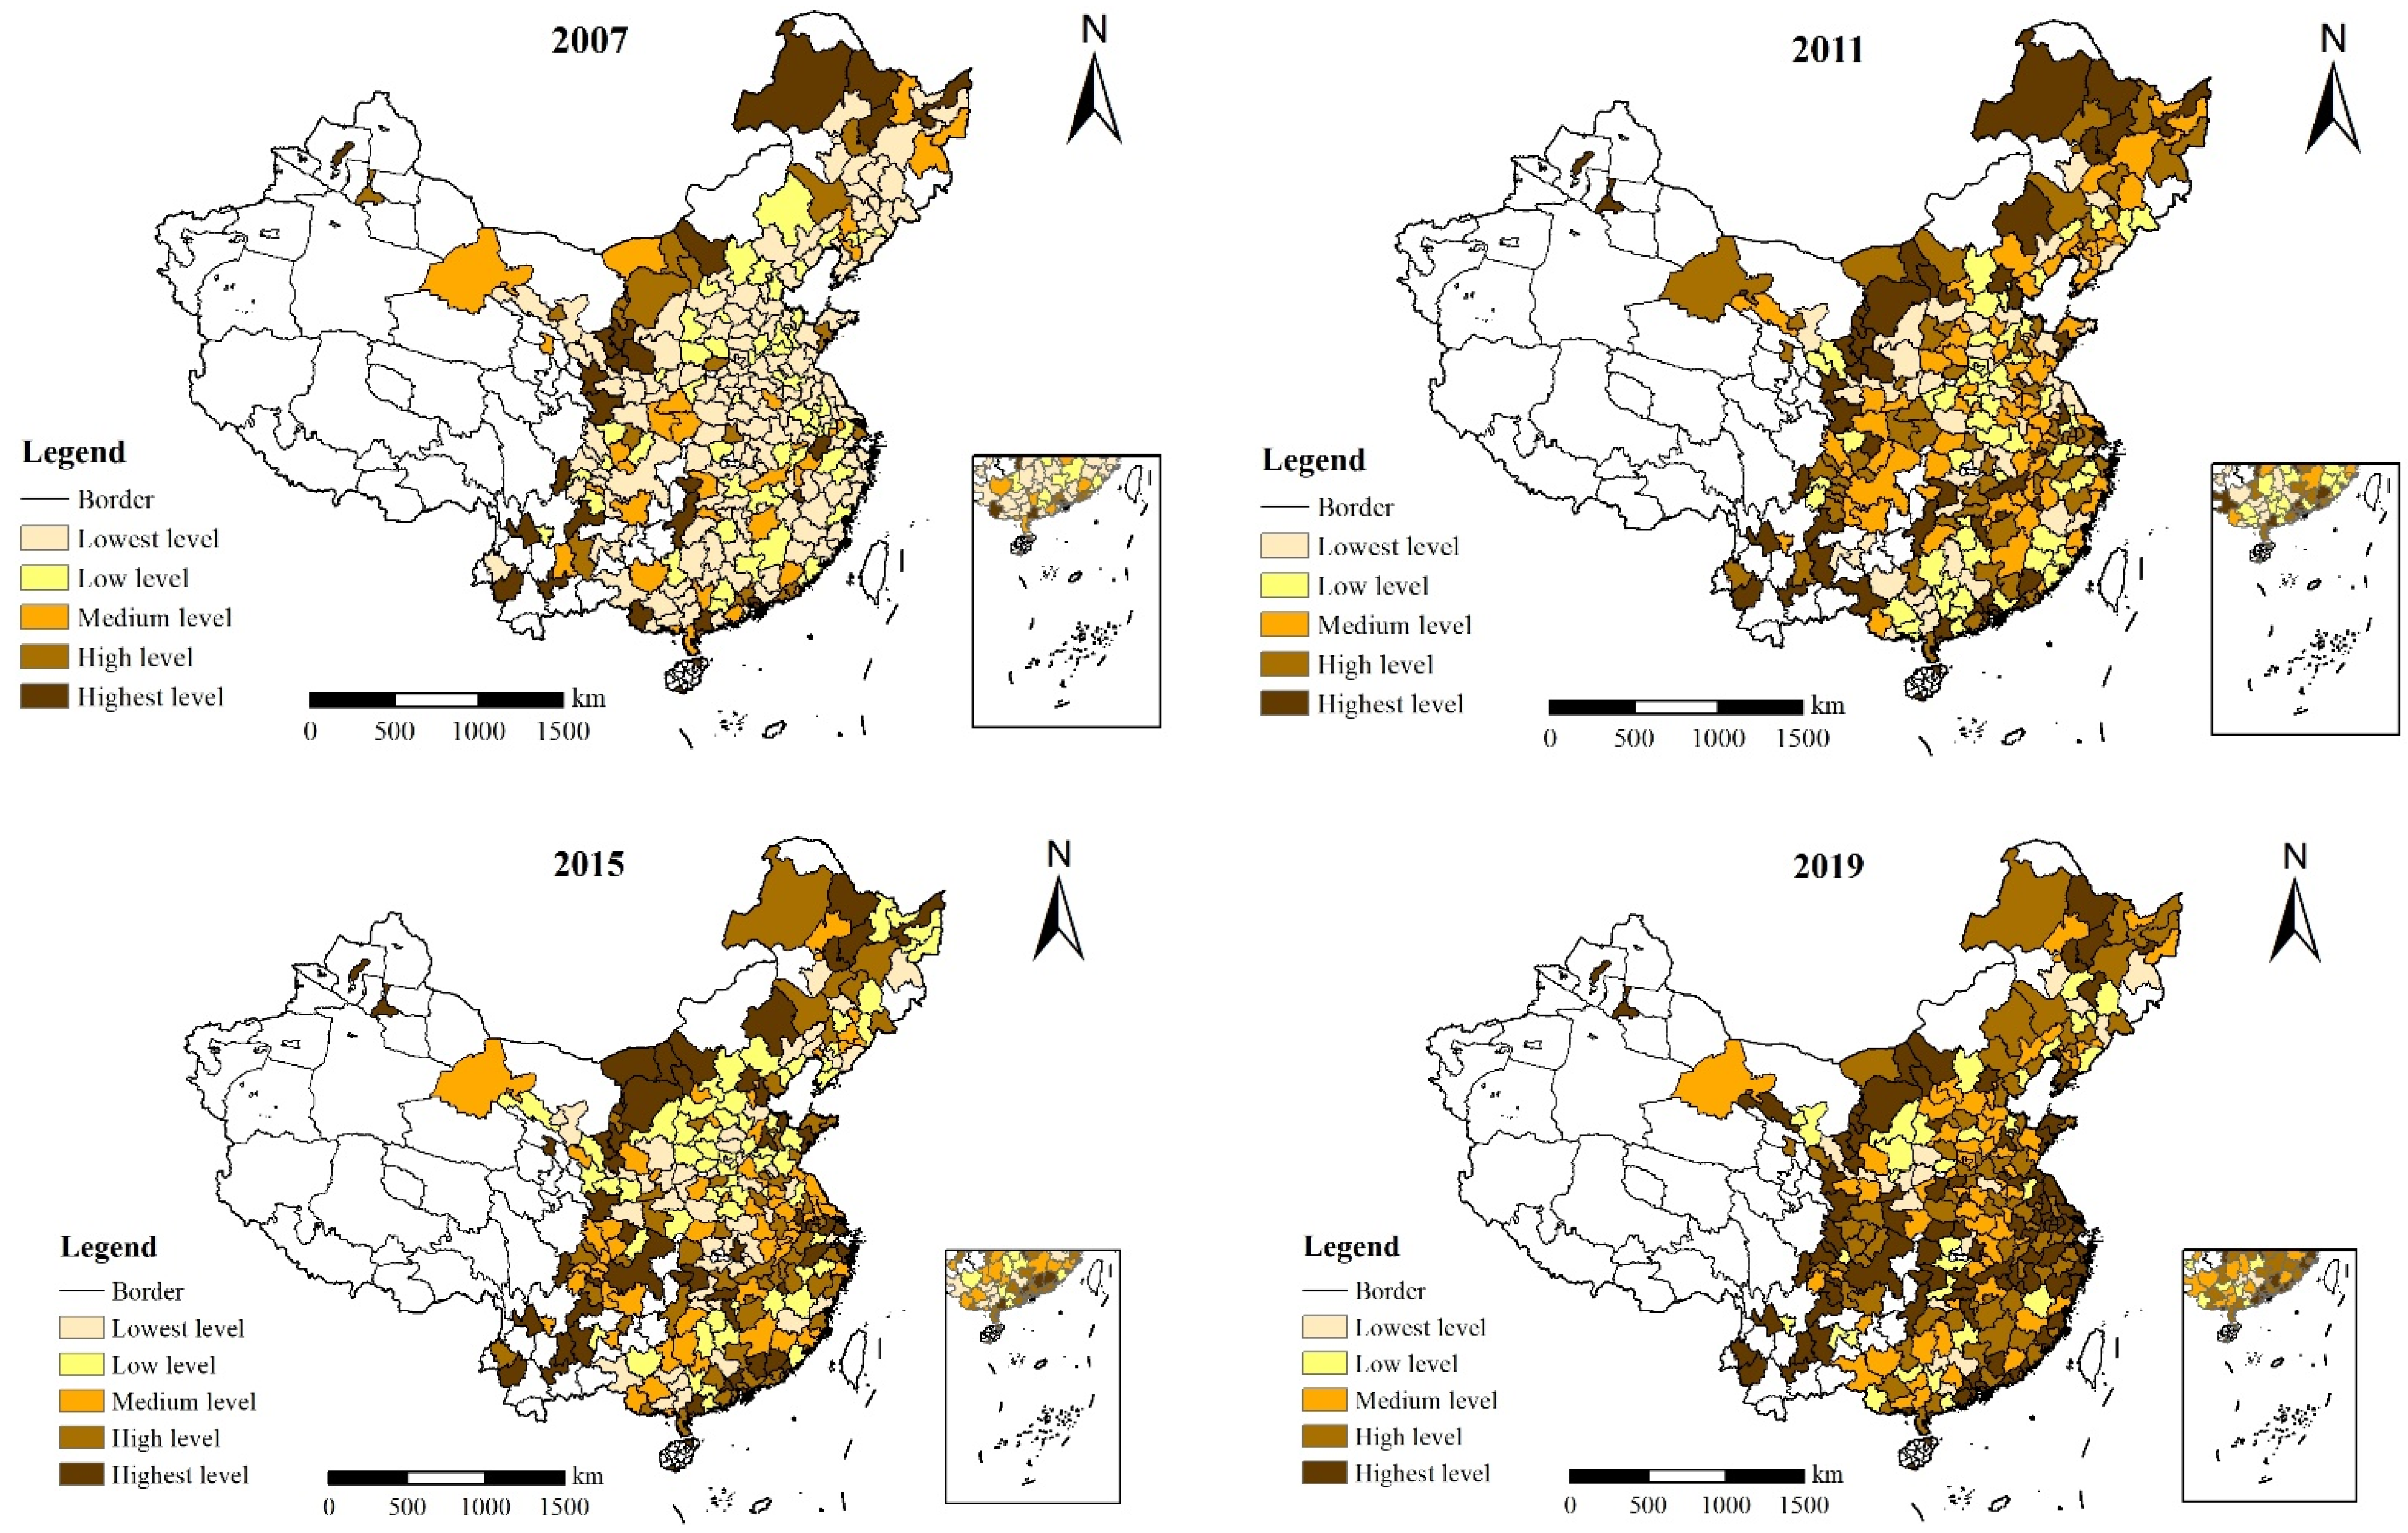
4.1. Spatial Evolutionary Characteristics of ULGUE
4.2. Direct Effect Analysis
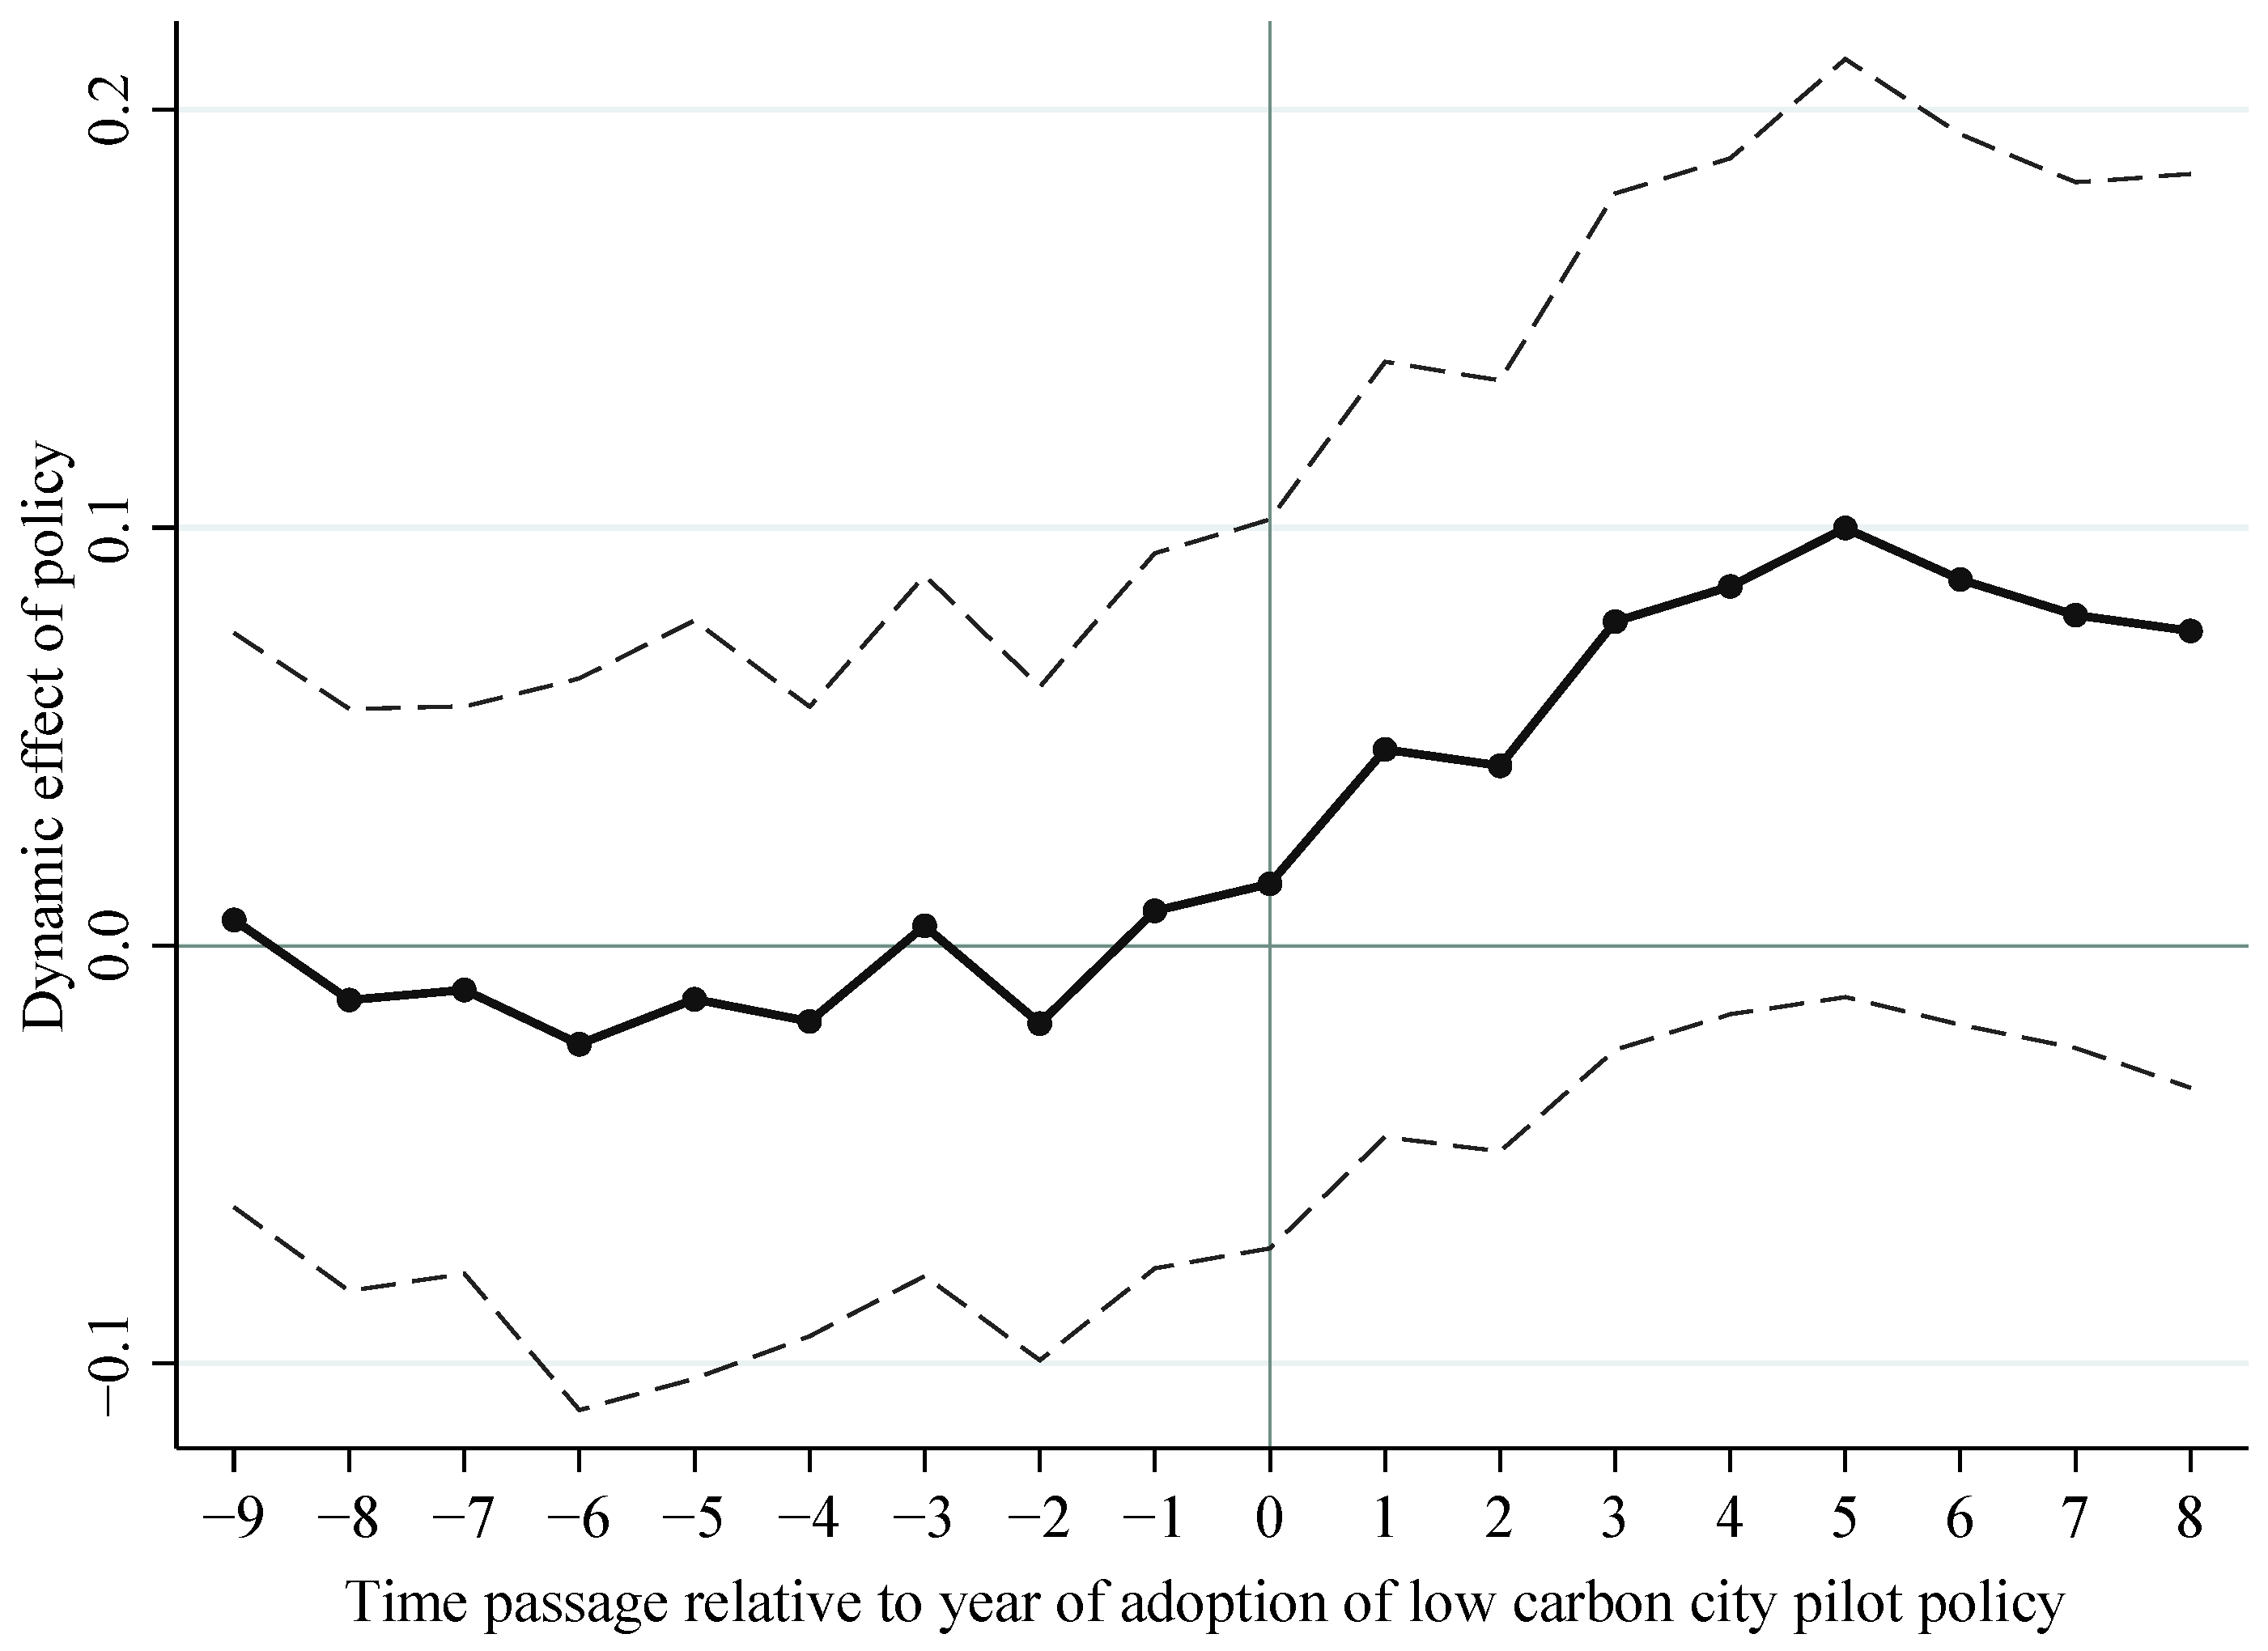
4.2.1. Parallel Trend Test
4.2.2. Basic Regression
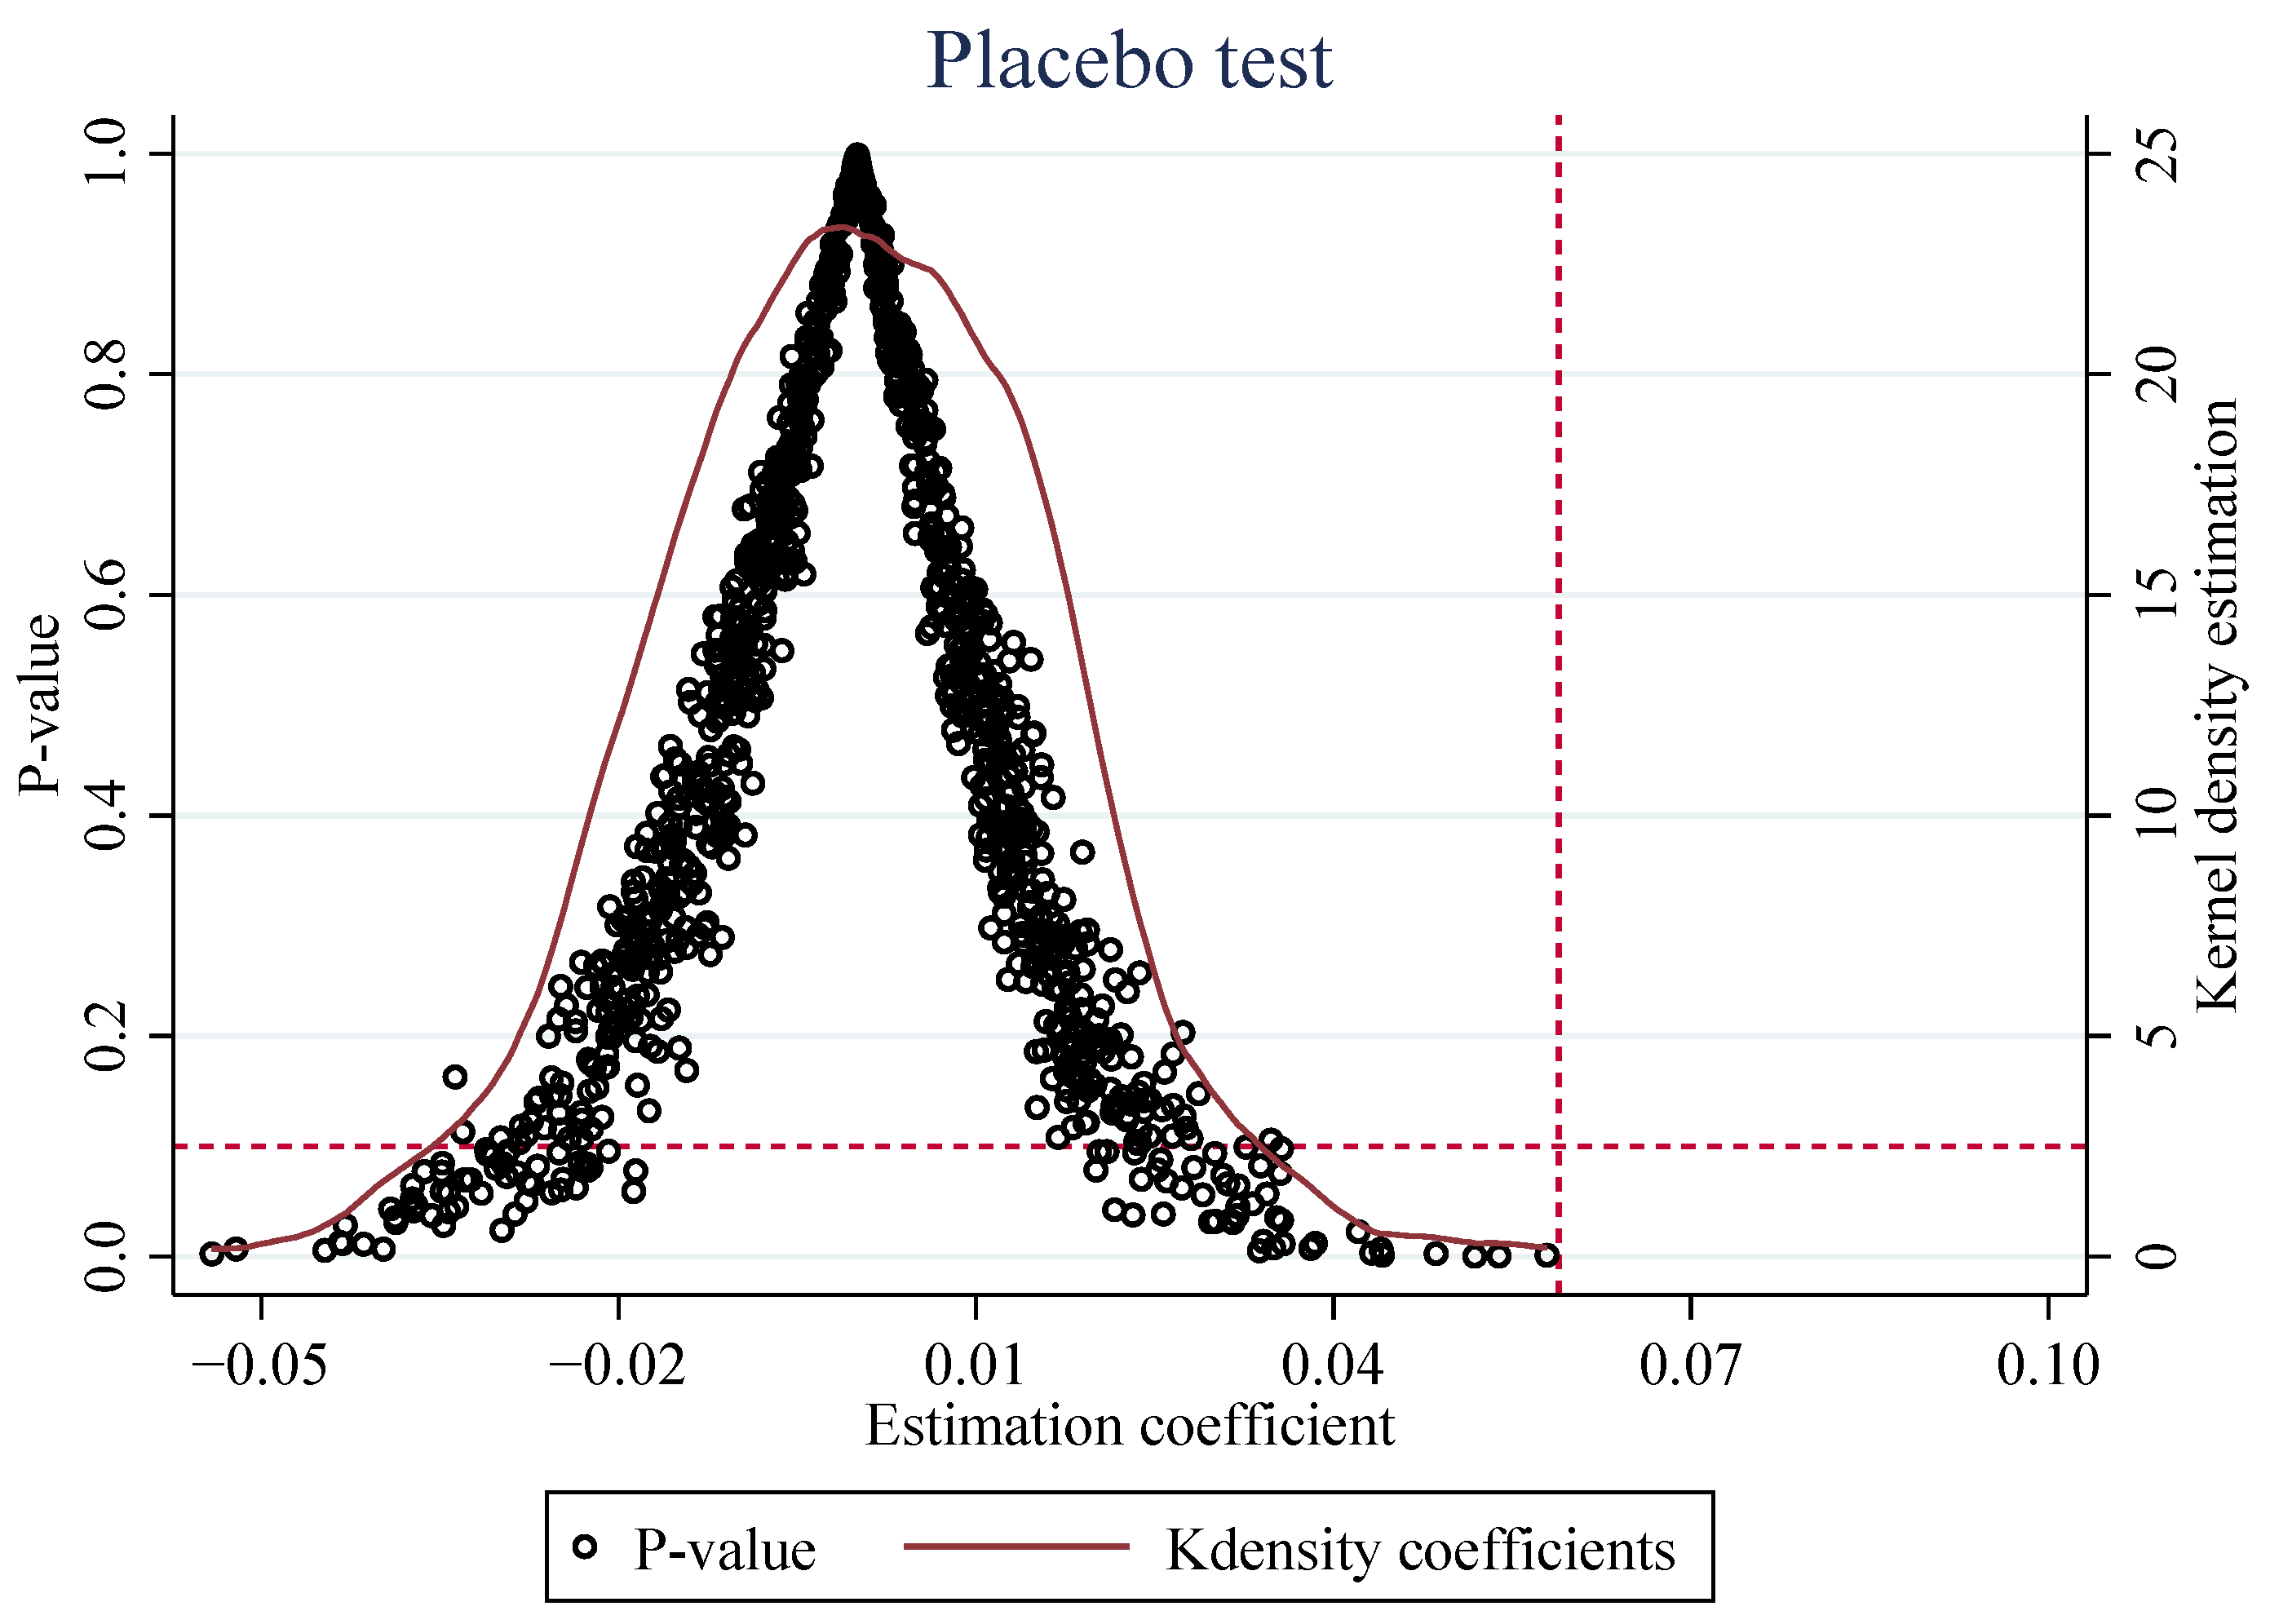
4.2.3. Placebo Test
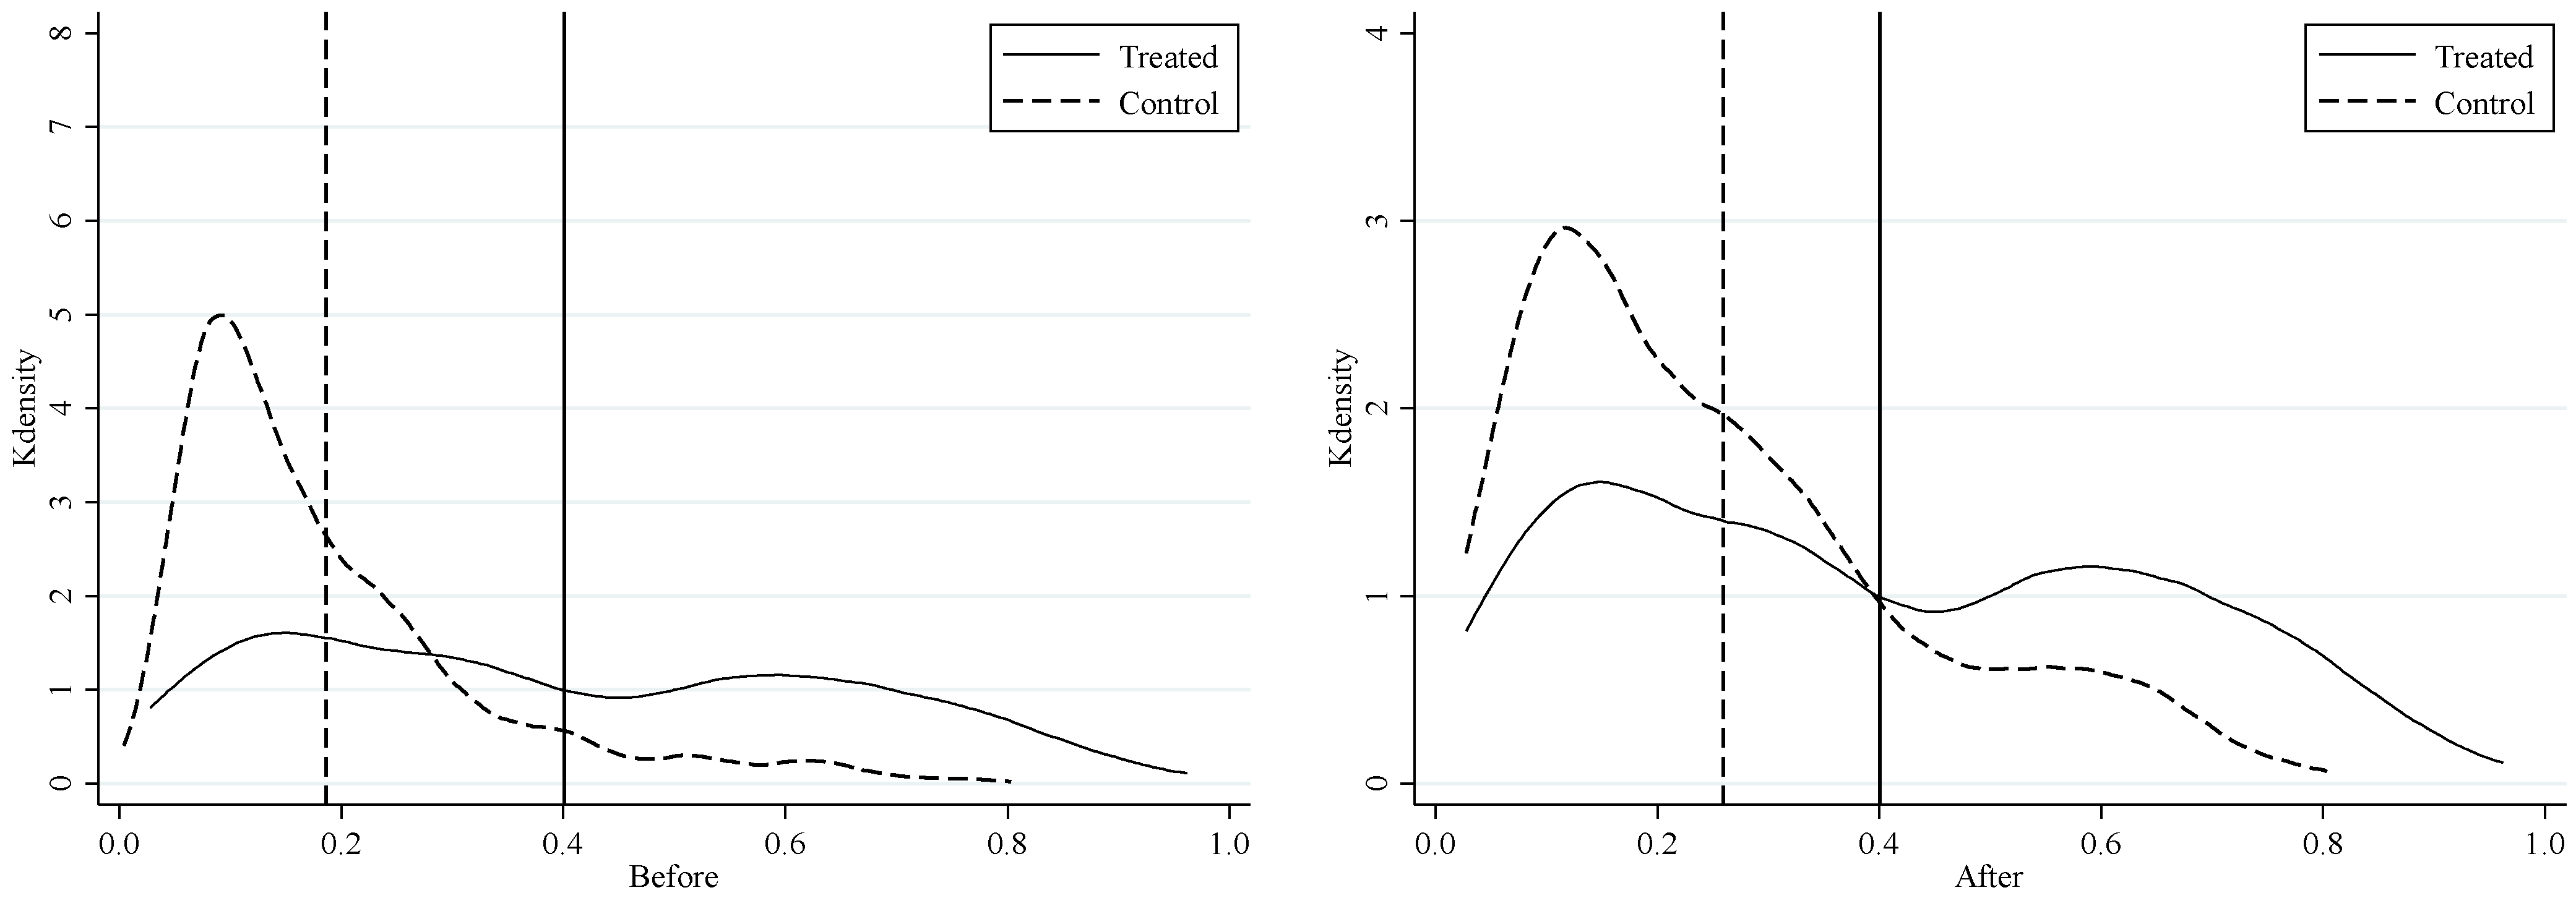
4.2.4. PSM-DID
4.3. Spatial Spillover Effect Analysis
4.3.1. Spatial Correlation Test
4.3.2. Spatial DID
4.4. Influence Mechanism Test
4.5. Heterogeneity Analysis
4.5.1. Heterogeneity in Region
4.5.2. Heterogeneity in Urban Types
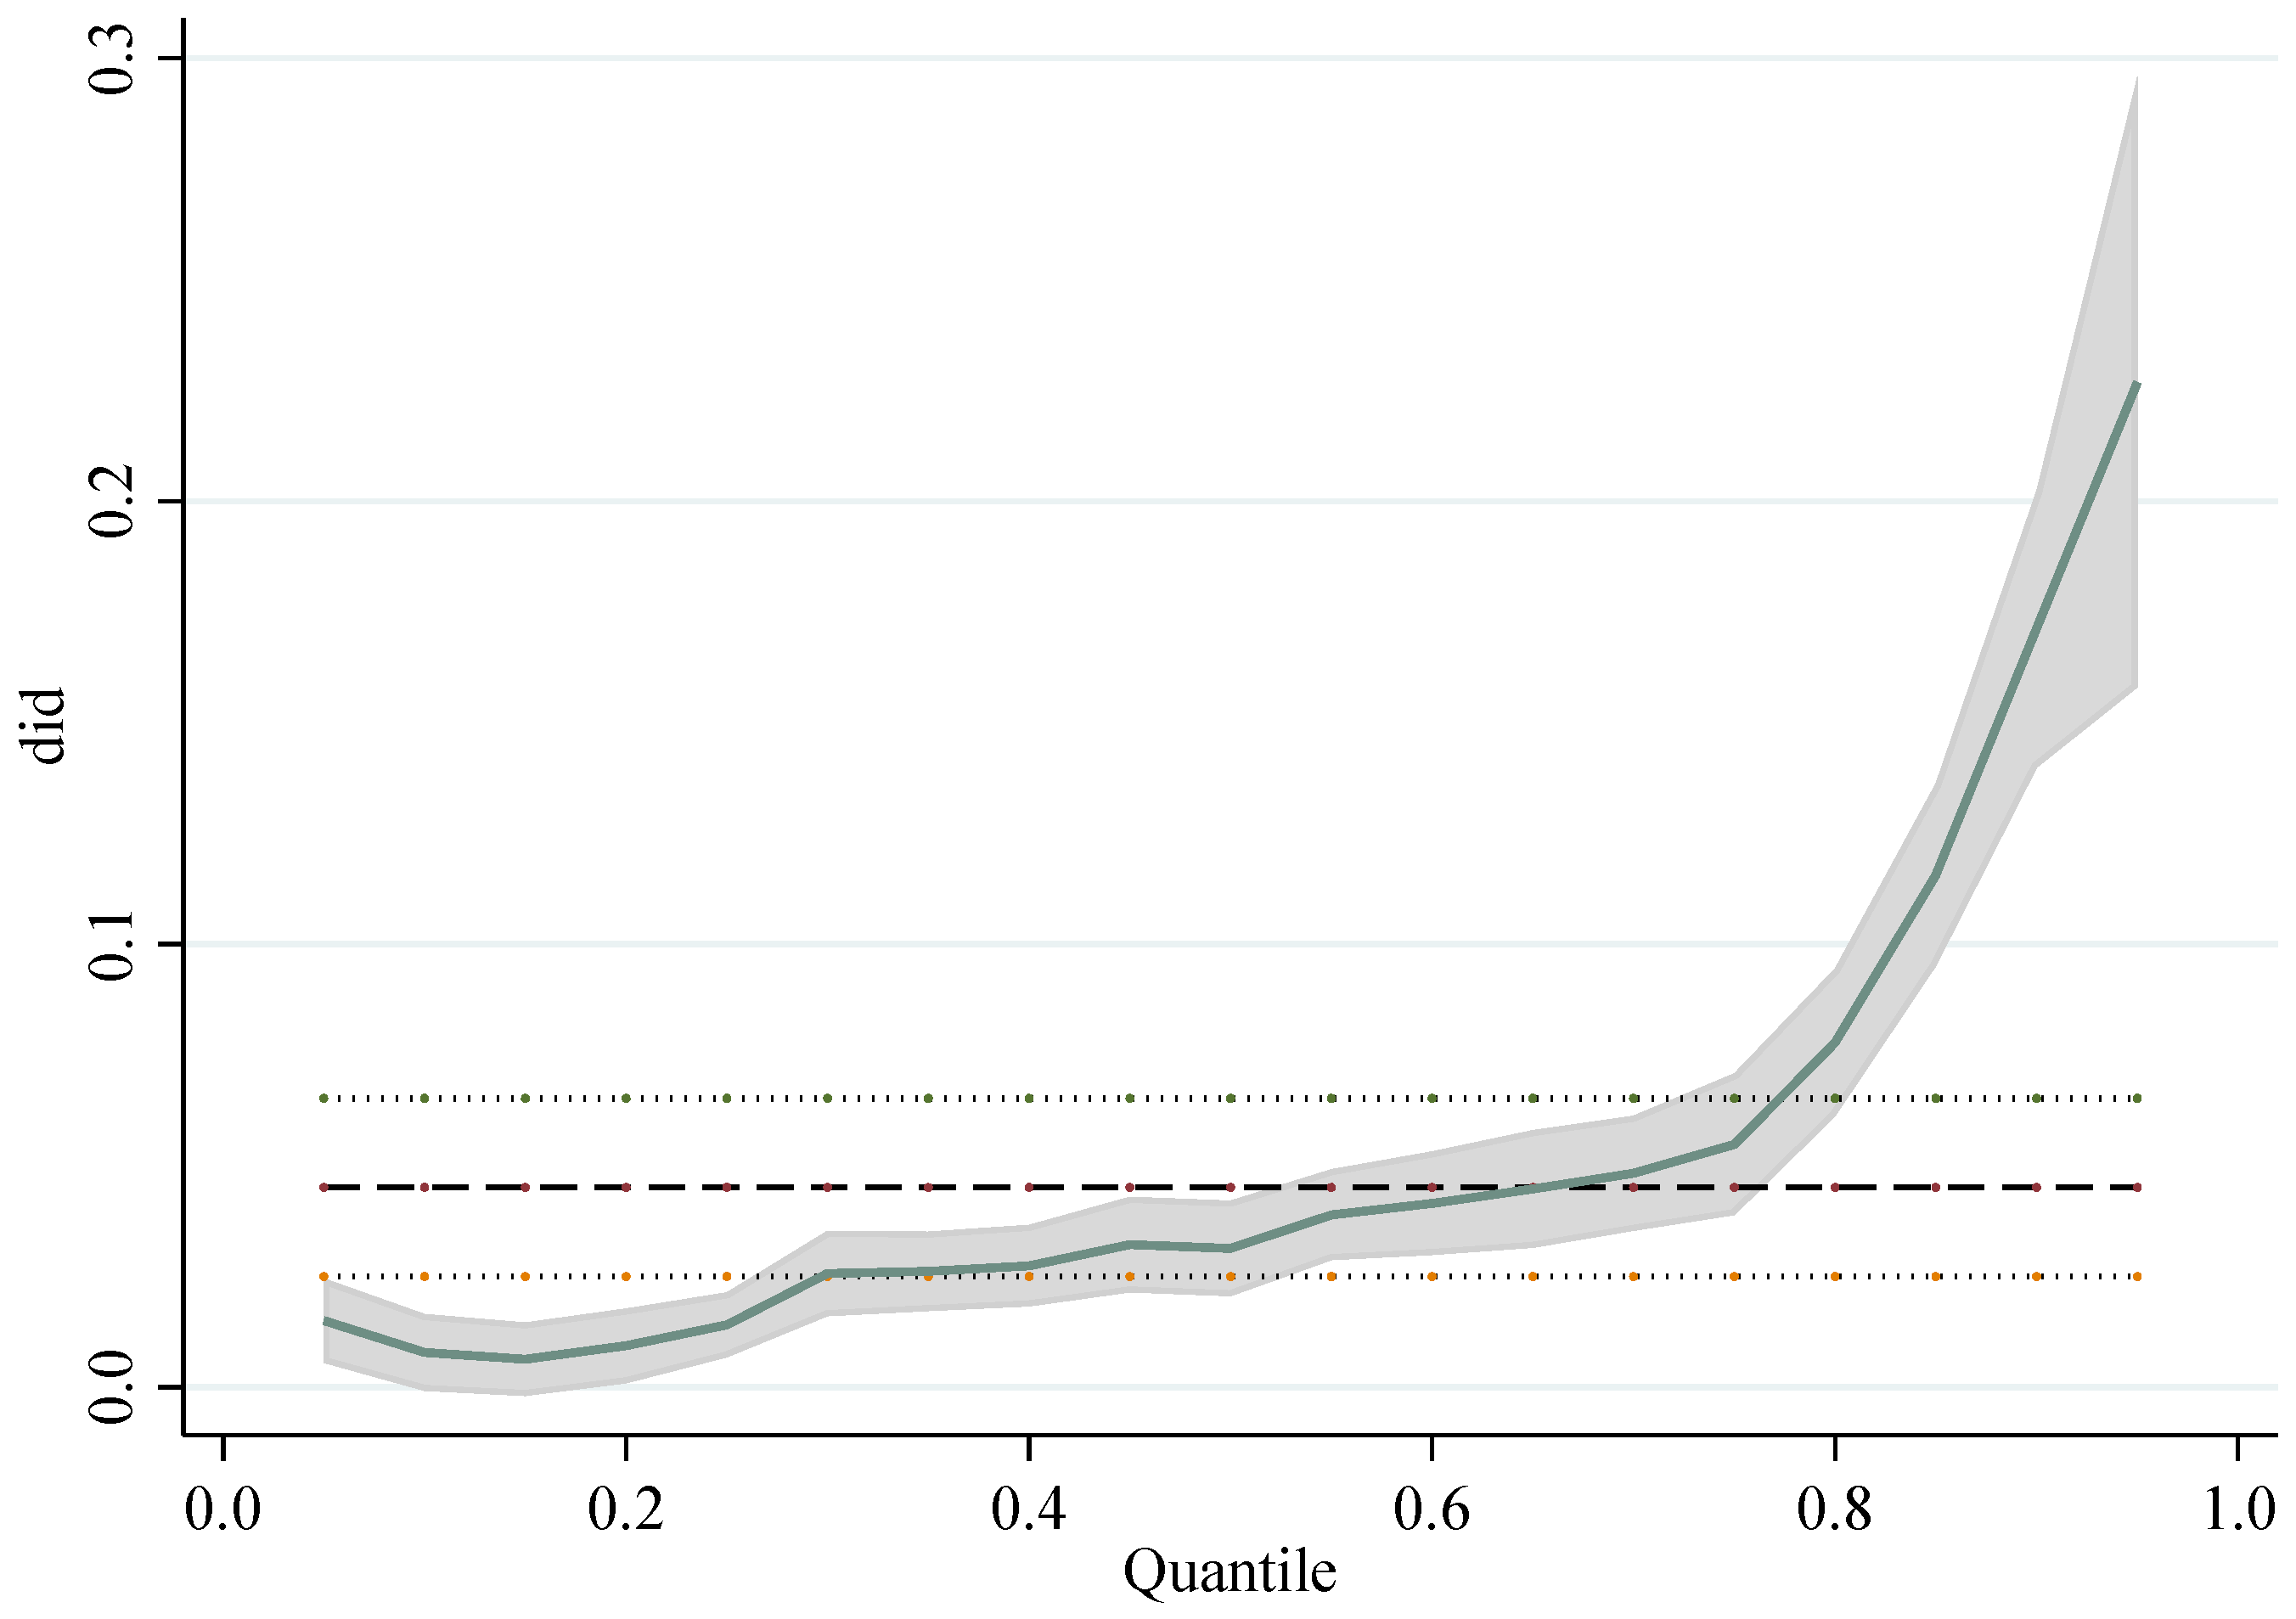
4.5.3. Quantile Regression
5. Conclusions and Policy Implications
5.1. Conclusion Summary
5.1.1. Discussion
5.1.2. Conclusions
5.2. Policy Recommendations
- Pay greater attention to the ULGUE. Various countries should establish a comprehensive land use planning system in urban areas, clearly define the functional positioning and rational utilization objectives of land, strengthen land management and supervision, and enhance the system of land use rights and market. This will effectively improve the ecological efficiency of land usage. Moreover, cities can be encouraged to engage in ecological restoration and greening initiatives, introduce sustainable urban agriculture and ecological farming models, as well as achieve multi-functional land use and resource recycling.
- Promote the implementation of LCCPP in a similar manner. Local governments can develop specific guidelines and policy measures for constructing low-carbon cities based on local resource conditions, infrastructure, economic development, and other factors. They should also clarify the tasks and objectives of pilot cities. For instance, preferential fiscal and tax policies can be introduced to incentivize enterprises and residents to adopt energy-saving and emission reduction measures. Additionally, special funds dedicated to low-carbon cities can be established to support the implementation of innovative low-carbon technologies and demonstration projects. Furthermore, it is crucial to enhance publicity and education efforts in order to raise public awareness about and engagement in low-carbon city construction.
- Strengthen the research and development and innovation of low-carbon technologies. During the development of low-carbon cities, it is essential for the government to increase investments in the research and development of low-carbon technologies. This will encourage technological innovation and application, ultimately leading to a reduction in energy consumption and an improvement in the efficient use of urban land. Additionally, it is crucial to foster collaboration between enterprises, universities, and scientific research institutions. This collaborative effort will drive the development and application of low-carbon technologies and help establish low-carbon innovative industries that can compete internationally.
- Enhance international cooperation and exchanges. All regions and countries should enhance international cooperation and exchanges to facilitate the sharing of successful experiences and technologies in green land use. By establishing an international cooperation platform, cities can promote collaboration and exchanges and jointly research and address global challenges related to green land use, thereby advancing sustainable development. Additionally, collaborative research projects should be conducted and data and information resources shared, while also emphasizing technological innovation and application.
5.3. Limitations and Prospects
Author Contributions
Funding
Institutional Review Board Statement
Informed Consent Statement
Data Availability Statement
Acknowledgments
Conflicts of Interest
References
- World Meteorological Organization. State of the Global Climate 2022. 2023. Available online: https://library.wmo.int/idurl/4/66214 (accessed on 1 December 2023).
- Intergovernmental Panel on Climate Change. AR6 Synthesis Report: Climate Change 2023. 2023. Available online: https://www.ipcc.ch/report/sixth-assessment-report-cycle (accessed on 2 December 2023).
- Shen, B.; Yang, X.; Xu, Y.; Ge, W.; Liu, G.; Su, X.; Zhao, S.; Dagestani, A.A.; Ran, Q. Can carbon emission trading pilot policy drive industrial structure low-carbon restructuring: New evidence from China. Environ. Sci. Pollut. Res. 2023, 30, 41553–41569. [Google Scholar] [CrossRef] [PubMed]
- International Energy Agency. CO2 Emissions in 2022. 2023. Available online: https://www.iea.org/reports/co2-emissions-in-2022 (accessed on 6 December 2023).
- Yue, L.; Cao, Y.; Wang, Y. Effect of energy policies on regional carbon emission reduction. Resour. Sci. 2022, 44, 1105–1118. (In Chinese) [Google Scholar] [CrossRef]
- Chen, L.; Wang, K. The spatial spillover effect of low-carbon city pilot scheme on green efficiency in China’s cities: Evidence from a quasi-natural experiment. Energy Econ. 2022, 110, 106018. [Google Scholar] [CrossRef]
- Tan, S.; Hu, B.; Kuang, B.; Zhou, M. Regional differences and dynamic evolution of urban land green use efficiency within the Yangtze River Delta, China. Land Use Policy 2021, 106, 105449. [Google Scholar] [CrossRef]
- Wang, G.; Han, Q. The multi-objective spatial optimization of urban land use based on low-carbon city planning. Ecol. Indic. 2021, 125, 107540. [Google Scholar] [CrossRef]
- Carpio, A.; Ponce-Lopez, R.; Lozano-García, D.F. Urban form, land use, and cover change and their impact on carbon emissions in the Monterrey Metropolitan area, Mexico. Urban Clim. 2021, 39, 100947. [Google Scholar] [CrossRef]
- Feng, Y.; Chen, S.; Tong, X.; Lei, Z.; Gao, C.; Wang, J. Modeling changes in China’s 2000–2030 carbon stock caused by land use change. J. Clean. Prod. 2020, 252, 119659. [Google Scholar] [CrossRef]
- Wang, G.; Han, Q.; Vries, B.D. Assessment of the relation between land use and carbon emission in Eindhoven, The Netherlands. J. Environ. Manag. 2019, 247, 413–424. [Google Scholar] [CrossRef] [PubMed]
- Fu, J.; Ding, R.; Zhang, Y.; Zhou, T.; Du, Y.; Zhu, Y.; Du, L.; Peng, L.; Zou, J.; Xiao, W. The spatial-temporal transition and influencing factors of green and low-carbon utilization efficiency of urban land in China under the goal of carbon neutralization. Int. J. Environ. Res. Public Health 2022, 19, 16149. [Google Scholar] [CrossRef]
- Penazzi, S.; Accorsi, R.; Manzini, R. Planning low carbon urban-rural ecosystems: An integrated transport land-use model. J. Clean. Prod. 2019, 235, 96–111. [Google Scholar] [CrossRef]
- Nieuwenhuijsen, M.J. Urban and transport planning pathways to carbon neutral, liveable and healthy cities; A review of the current evidence. Environ. Int. 2020, 140, 105661. [Google Scholar] [CrossRef] [PubMed]
- Wolff, H. Keep your clunker in the suburb: Low-emission zones and adoption of green vehicles. Econ. J. 2014, 124, F481–F512. [Google Scholar] [CrossRef]
- Chen, H.; Guo, W.; Feng, X.; Wei, W.; Liu, H.; Feng, Y.; Gong, W. The impact of low-carbon city pilot policy on the total factor productivity of listed enterprises in China. Resour. Conserv. Recycl. 2021, 169, 105457. [Google Scholar] [CrossRef]
- Gehrsitz, M. The effect of low emission zones on air pollution and infant health. J. Environ. Econ. Manag. 2017, 83, 121–144. [Google Scholar] [CrossRef]
- Ma, J.; Hu, Q.; Shen, W.; Wei, X. Does the low-carbon city pilot policy promote green technology innovation? Based on green patent data of Chinese A-share listed companies. Int. J. Environ. Res. Public Health 2021, 18, 3695. [Google Scholar] [CrossRef]
- Xu, J.; Cui, J. Low-carbon cities and firms’ green technological innovation. China Ind. Econ. 2020, 12, 178–196. (In Chinese) [Google Scholar] [CrossRef]
- Zheng, J.; Shao, X.; Liu, W.; Kong, J.; Zuo, G. The impact of the pilot program on industrial structure upgrading in low-carbon cities. J. Clean. Prod. 2021, 290, 125868. [Google Scholar] [CrossRef]
- Liu, X.; Li, Y.; Chen, X.; Liu, J. Evaluation of low carbon city pilot policy effect on carbon abatement in China: An empirical evidence based on time-varying DID model. Cities 2022, 123, 103582. [Google Scholar] [CrossRef]
- Li, Z.; Bai, T.; Tang, C. How does the low-carbon city pilot policy affect the synergistic governance efficiency of carbon and smog? Quasi-experimental evidence from China. J. Clean. Prod. 2022, 373, 133809. [Google Scholar] [CrossRef]
- Wang, B.; Zhang, Y.; Feng, S. Impact of the low-carbon city pilot project on China’s land transfers in high energy-consuming industries. J. Clean. Prod. 2022, 363, 132491. [Google Scholar] [CrossRef]
- Liu, J.; Feng, H.; Wang, K. The low-carbon city pilot policy and urban land use efficiency: A policy assessment from China. Land 2022, 11, 604. [Google Scholar] [CrossRef]
- Niu, S.; Luo, X.; Yang, T.; Lin, G.; Li, C. Does the low-carbon city pilot policy improve the urban land green use efficiency?—Investigation based on multi-period difference-in-differences model. Int. J. Environ. Res. Public Health 2023, 20, 2704. [Google Scholar] [CrossRef] [PubMed]
- Chang, J.; Wang, W.; Liu, J. Industrial upgrading and its influence on green land use efficiency. Sci. Rep. 2023, 13, 2813. [Google Scholar] [CrossRef] [PubMed]
- Cheng, Z.; Li, X.; Zhang, Q. Can new-type urbanization promote the green intensive use of land? J. Environ. Manag. 2023, 342, 118150. [Google Scholar] [CrossRef]
- Yu, B.; Shen, C. Environmental regulation and industrial capacity utilization: An empirical study of China. J. Clean. Prod. 2020, 246, 118986. [Google Scholar] [CrossRef]
- Desiere, S.; Jolliffe, D. Land productivity and plot size: Is measurement error driving the inverse relationship? J. Dev. Econ. 2018, 130, 84–98. [Google Scholar] [CrossRef]
- Choi, D.; Berry, F.S.; Ghadimi, A. Policy design and achieving social outcomes: A comparative analysis of social enterprise policy. Public Adm. Rev. 2019, 80, 494–505. [Google Scholar] [CrossRef]
- Mamuneas, T.P.; Ishaq Nadiri, M. Public R&D policies and cost behavior of the US manufacturing industries. J. Public Econ. 1996, 63, 57–81. [Google Scholar] [CrossRef]
- Yang, S.; Jahanger, A.; Hossain, M.R. How effective has the low-carbon city pilot policy been as an environmental intervention in curbing pollution? Evidence from Chinese industrial enterprises. Energy Econ. 2023, 118, 106523. [Google Scholar] [CrossRef]
- Wen, S.; Jia, Z.; Chen, X. Can low-carbon city pilot policies significantly improve carbon emission efficiency? Empirical evidence from China. J. Clean. Prod. 2022, 346, 131131. [Google Scholar] [CrossRef]
- Wang, H.; Gu, K.; Dong, F.; Sun, H. Does the low-carbon city pilot policy achieve the synergistic effect of pollution and carbon reduction? Energy Environ. 2022, 35, 569–596. [Google Scholar] [CrossRef]
- Breton, A. Competitive Governments: An Economic Theory of Politics and Public Finance; Cambridge University Press: Cambridge, UK, 1998. [Google Scholar]
- Lazear, E.P.; Rosen, S. Rank-order tournaments as optimum labor contracts. J. Political Econ. 1981, 89, 841–864. [Google Scholar] [CrossRef]
- Edmiston, K.; Turnbull, G.K. Local Government Competition for Economic Development; Working Paper; Andrew Young School of Policy Studies at Georgia State University: Atlanta, GA, USA, 2003; Available online: https://www.researchgate.net/publication/228609854 (accessed on 16 December 2023).
- Jin, H.; Qian, Y.; Weingast, B.R. Regional decentralization and fiscal incentives: Federalism, Chinese style. J. Public Econ. 2005, 89, 1719–1742. [Google Scholar] [CrossRef]
- Liu, J.-Y.; Woodward, R.T.; Zhang, Y.-J. Has carbon emissions trading reduced PM2.5 in China? Environ. Sci. Technol. 2021, 55, 6631–6643. [Google Scholar] [CrossRef] [PubMed]
- Wheeler, D. Racing to the bottom? Foreign investment and air pollution in developing countries. J. Environ. Dev. 2016, 10, 225–245. [Google Scholar] [CrossRef]
- Feng, T.; Du, H.; Lin, Z.; Zuo, J. Spatial spillover effects of environmental regulations on air pollution: Evidence from urban agglomerations in China. J. Environ. Manag. 2020, 272, 110998. [Google Scholar] [CrossRef]
- Sachs, J.D.; Schmidt-Traub, G.; Mazzucato, M.; Messner, D.; Nakicenovic, N.; Rockström, J. Six transformations to achieve the sustainable development goals. Nat. Sustain. 2019, 2, 805–814. [Google Scholar] [CrossRef]
- Lee, C.-C.; Feng, Y.; Peng, D. A green path towards sustainable development: The impact of low-carbon city pilot on energy transition. Energy Econ. 2022, 115, 106343. [Google Scholar] [CrossRef]
- Hsieh, C.-T.; Klenow, P.J. Misallocation and Manufacturing TFP in China and India. Q. J. Econ. 2009, 124, 1403–1448. [Google Scholar] [CrossRef]
- Porter, M.E.; Linde, C.V.D. Toward a new conception of the environment-competitiveness relationship. J. Econ. Perspect. 1995, 9, 97–118. [Google Scholar] [CrossRef]
- Qiu, S.; Wang, Z.; Liu, S. The policy outcomes of low-carbon city construction on urban green development: Evidence from a quasi-natural experiment conducted in China. Sustain. Cities Soc. 2021, 66, 102699. [Google Scholar] [CrossRef]
- Aigner, D.; Lovell, C.A.K.; Schmidt, P. Formulation and estimation of stochastic frontier production function models. J. Econom. 1977, 6, 21–37. [Google Scholar] [CrossRef]
- Charnes, A.; Cooper, W.W.; Rhodes, E. Measuring the efficiency of decision making units. Eur. J. Oper. Res. 1978, 2, 429–444. [Google Scholar] [CrossRef]
- Quah, D.T. Twin peaks: Growth and convergence in models of distribution dynamics. Econ. J. 1996, 106, 1045–1055. [Google Scholar] [CrossRef]
- Tone, K. A slacks-based measure of efficiency in data envelopment analysis. Eur. J. Oper. Res. 2001, 130, 498–509. [Google Scholar] [CrossRef]
- Tone, K. Dealing with Undesirable Outputs in DEA: A Slacks-Based Measure (SBM) Approach 2003. Available online: https://www.researchgate.net/publication/284047010 (accessed on 20 December 2023).
- Xie, X.; Fang, B.; Xu, H.; He, S.; Li, X. Study on the coordinated relationship between Urban Land use efficiency and ecosystem health in China. Land Use Policy 2021, 102, 105235. [Google Scholar] [CrossRef]
- Feng, Y.; Li, Y.; Nie, C. The effect of place-based policy on urban land green use efficiency: Evidence from the pilot free-trade zone establishment in China. Land 2023, 12, 701. [Google Scholar] [CrossRef]
- Wang, J.; Han, P. The impact of industrial agglomeration on urban green land use efficiency in the Yangtze River Economic Belt. Sci. Rep. 2023, 13, 974. [Google Scholar] [CrossRef]
- Dou, Y.; Luo, X.; Dong, L.; Wu, C.; Liang, H.; Ren, J. An empirical study on transit-oriented low-carbon urban land use planning: Exploratory Spatial Data Analysis (ESDA) on Shanghai, China. Habitat Int. 2016, 53, 379–389. [Google Scholar] [CrossRef]
- Liu, Z.; Lai, B.; Wu, S.; Liu, X.; Liu, Q.; Ge, K. Growth targets management, regional competition and urban land green use efficiency according to evidence from China. Int. J. Environ. Res. Public Health 2022, 19, 6250. [Google Scholar] [CrossRef]
- Zhang, J.; Wu, G.; Zhang, J. The estimation of China’s provincial capital stock: 1952–2000. J. Econ. Res. 2004, 39, 35–44. (In Chinese) [Google Scholar]
- Zhao, M.; Kong, Z.-h.; Escobedo, F.J.; Gao, J. Impacts of urban forests on offsetting carbon emissions from industrial energy use in Hangzhou, China. J. Environ. Manag. 2010, 91, 807–813. [Google Scholar] [CrossRef] [PubMed]
- Huang, H.; Cai, K.; Xing, G. The Low-carbon development features and countermeasures based on carbon balance of the cities in Guangdong province. Urban Dev. Stud. 2015, 22, 12–18. (In Chinese) [Google Scholar] [CrossRef]
- Cong, J.; Liu, X.; Zhao, X. Demarcation problems and the corresponding measurement methods of the urban carbon accounting. China Popul. Resour. Environ. 2014, 24, 19–26. (In Chinese) [Google Scholar] [CrossRef]
- Moser, P.; Voena, A. Compulsory licensing: Evidence from the trading with the enemy act. Am. Econ. Rev. 2012, 102, 396–427. [Google Scholar] [CrossRef]
- Corrado, L.; Fingleton, B. Where Is the Economics in Spatial Econometrics? J. Reg. Sci. 2012, 52, 210–239. [Google Scholar] [CrossRef]
- MacKinnon, D.P.; Krull, J.L.; Lockwood, C.M. Equivalence of the mediation, confounding and suppression effect. Prev. Sci. 2000, 1, 173–181. Available online: https://www.ncbi.nlm.nih.gov/pubmed/11523746 (accessed on 21 December 2023).
- Edwards, J.R.; Lambert, L.S. Methods for integrating moderation and mediation: A general analytical framework using moderated path analysis. Psychol. Methods 2007, 12, 1–22. [Google Scholar] [CrossRef] [PubMed]
- Xie, H.; Chen, Q.; Lu, F.; Wang, W.; Yao, G.; Yu, J. Spatial-temporal disparities and influencing factors of total-factor green use efficiency of industrial land in China. J. Clean. Prod. 2019, 207, 1047–1058. [Google Scholar] [CrossRef]
- Li, H.; Wang, Z.; Zhu, M.; Hu, C.; Liu, C. Study on the spatial–temporal evolution and driving mechanism of urban land green use efficiency in the Yellow River Basin cities. Ecol. Indic. 2023, 154, 110672. [Google Scholar] [CrossRef]
- Lu, X.; Chen, D.; Kuang, B.; Zhang, C.; Cheng, C. Is high-tech zone a policy trap or a growth drive? Insights from the perspective of urban land use efficiency. Land Use Policy 2020, 95, 104583. [Google Scholar] [CrossRef]
- Kou, Z.; Liu, X. Find Report on City and Industrial Innovation in China; Fudan Institute of Industrial Development, School of Economics, Fudan University: Shanghai, China, 2017. (In Chinese) [Google Scholar]
- Grossman, G.M.; Krueger, A.B. Economic growth and the environment. Q. J. Econ. 1995, 110, 353–377. [Google Scholar] [CrossRef]
- Copeland, B.R.; Taylor, M.S. North-South Trade and the Environment. Q. J. Econ. 1994, 109, 755–787. [Google Scholar] [CrossRef]
- Cao, Q. Driving Effects of National New Zone on Regional Economic Growth—Evidence from 70 Cities of China. China Ind. Econ. 2020, 7, 43–60. (In Chinese) [Google Scholar] [CrossRef]
- Bai, J.; Zhang, Y.; Bian, Y. Does innovation-driven policy increase entrepreneurial activity in cities—Evidence from the national innovative city pilot policy. China Ind. Econ. 2022, 411, 61–78. (In Chinese) [Google Scholar] [CrossRef]
- Koenker, R.; Bassett, G. Regression quantiles. Econometrica 1978, 46, 33–50. [Google Scholar] [CrossRef]


| Index | Specific Index | Index Composition | References |
|---|---|---|---|
| Input | Capital | Fixed capital stock of municipal district (unit: 10,000 yuan) | Chang et al. [26] |
| Labor | Number of employees of secondary and tertiary industries in municipal districts (unit: 10,000 people) | Feng et al. [53] | |
| Land | Built-up area of municipal district (unit: km2) | Xie et al. [52] | |
| Desirable output | Economy | Added value of secondary and tertiary industries in municipal districts (unit: 10,000 yuan) | Wang and Han. [54] |
| Society | Average wages of urban workers in municipal districts (unit: yuan) | Xie et al. [52] | |
| Ecology | Total carbon sink of urban green space in municipal district (unit: 10,000 tons) | Dou et al. [55] | |
| Undesirable output | Industrial pollution | Industrial sulfur dioxide emissions (unit: 10,000 tons) | Wang and Han [54] |
| Industrial soot emission (unit: 10,000 tons) | |||
| Industrial wastewater discharge (unit: 10,000 tons) | |||
| Carbon emission | Municipal district carbon emissions (unit: 10,000 tons) | Liu et al. [56] |
| Variable | Symbol | Observations | Mean | Std. Dev. | Min | Max |
|---|---|---|---|---|---|---|
| Urban land green use efficiency | ULGUE | 3679 | 0.2823 | 0.1888 | 0.0039 | 1.9215 |
| Virtual indicator for LCCPP | did | 3679 | 0.0960 | 0.2946 | 0.0000 | 1.0000 |
| Economic level | agdp | 3679 | 10.5876 | 0.6187 | 8.0868 | 15.4191 |
| Population size | density | 3679 | 6.4587 | 0.9342 | 2.5649 | 9.3457 |
| Government financial support | government | 3679 | 0.5667 | 0.2767 | 0.0228 | 8.3902 |
| Level of opening up | fdi | 3679 | 0.0216 | 0.0235 | 0.0000 | 0.2265 |
| Traffic condition | road | 3679 | 2.4363 | 0.5347 | 0.0182 | 4.6943 |
| Science education level | technology | 3679 | 11.6701 | 1.1422 | 8.2933 | 16.2634 |
| Industrial structure | industry | 3679 | 1.0762 | 0.6619 | 0.0943 | 6.5326 |
| Human capital level | hcl | 3679 | 10.3659 | 1.4181 | 2.3026 | 13.9169 |
| Energy utilization intensity | energy | 3679 | 13.6816 | 1.2344 | 9.3537 | 17.5211 |
| Urban innovation level | innovation | 3679 | 1.3345 | 1.2907 | 0.0000 | 7.5828 |
| Variable | ULGUE | |||
|---|---|---|---|---|
| (1) DID | (2) DID | (3) PSM-DID | (4) PSM-DID | |
| did | 0.0628 *** | 0.0589 *** | 0.0397 *** | 0.0381 *** |
| (6.5098) | (6.2279) | (3.9436) | (3.8542) | |
| agdp | 0.0417 *** | 0.0415 *** | ||
| (3.3714) | (3.1424) | |||
| density | −0.0206 ** | −0.0235 *** | ||
| (−2.4268) | (−2.8436) | |||
| government | 0.0058 | 0.0323 * | ||
| (0.5950) | (1.7258) | |||
| fdi | −0.4439 *** | −0.4942 *** | ||
| (−3.2416) | (−3.4873) | |||
| road | −0.0159 * | −0.0105 | ||
| (−1.8262) | (−1.2457) | |||
| technology | 0.0219 *** | 0.0219 *** | ||
| (2.9523) | (2.8776) | |||
| industry | 0.0393 *** | 0.0345 *** | ||
| (4.3359) | (3.7238) | |||
| hcl | −0.0040 | −0.0029 | ||
| (−0.6870) | (−0.3691) | |||
| Year fixed | Yes | Yes | Yes | Yes |
| City fixed | Yes | Yes | Yes | Yes |
| Observations | 3679 | 3679 | 3509 | 3509 |
| R-squared | 0.6840 | 0.6903 | 0.6920 | 0.6980 |
| Year | I | Z | p-Value |
|---|---|---|---|
| 2007 | 0.033 | 1.159 | 0.246 |
| 2008 | 0.052 | 1.726 | 0.084 |
| 2009 | 0.035 | 1.215 | 0.224 |
| 2010 | 0.020 | 0.738 | 0.461 |
| 2011 | 0.049 | 1.630 | 0.103 |
| 2012 | 0.066 | 2.170 | 0.030 |
| 2013 | 0.074 | 2.429 | 0.015 |
| 2014 | 0.058 | 1.915 | 0.056 |
| 2015 | 0.128 | 4.133 | 0.000 |
| 2016 | 0.116 | 3.746 | 0.000 |
| 2017 | 0.216 | 6.851 | 0.000 |
| 2018 | 0.132 | 4.220 | 0.000 |
| 2019 | 0.149 | 4.719 | 0.000 |
| Variable | ULGUE | ||||
|---|---|---|---|---|---|
| (1) Main | (2) Wx | (3) LR_Direct | (4) LR_Indirect | (5) LR_Total | |
| did | 0.0468 *** | 0.1412 *** | 0.0495 *** | 0.1607 *** | 0.2101 *** |
| (2.9106) | (4.8576) | (2.9789) | (5.0698) | (5.8304) | |
| agdp | 0.0497 *** | −0.0400 | 0.0485 *** | −0.0405 | 0.0081 |
| (2.9147) | (−1.4823) | (2.9455) | (−1.4170) | (0.2366) | |
| density | −0.0238 | 0.0115 | −0.0218 | 0.0143 | −0.0075 |
| (−1.4953) | (0.3177) | (−1.4151) | (0.3360) | (−0.1541) | |
| government | 0.0122 | −0.0165 | 0.0120 | −0.0176 | −0.0056 |
| (1.0516) | (−1.6245) | (1.0558) | (−1.6192) | (−0.3378) | |
| fdi | −0.3368 ** | −1.0310 *** | −0.3489 ** | −1.1675 *** | −1.5165 *** |
| (−2.0691) | (−2.6418) | (−2.1772) | (−2.7544) | (−3.2025) | |
| road | −0.0181 | −0.0258 | −0.0180 * | −0.0311 | −0.0492 * |
| (−1.7661) | (−1.2093) | (−1.8113) | (−1.3970) | (−1.9150) | |
| technology | 0.0238 ** | 0.0209 | 0.0242 ** | 0.0248 | 0.0490 * |
| (2.1132) | (0.9049) | (2.1504) | (0.9549) | (1.7500) | |
| industry | 0.0424 *** | 0.0088 | 0.0418 *** | 0.0168 | 0.0585 ** |
| (3.1028) | (0.3840) | (3.1289) | (0.6815) | (2.1271) | |
| hcl | −0.0009 | 0.0248 | 0.0004 | 0.0271 | 0.0275 |
| (−0.0985) | (1.2258) | (0.0411) | (1.2101) | (1.0800) | |
| rho | 0.0936 *** | ||||
| (2.7262) | |||||
| sigma2_e | 0.0098 *** | ||||
| (7.9595) | |||||
| Year fixed | Yes | Yes | Yes | Yes | Yes |
| City fixed | Yes | Yes | Yes | Yes | Yes |
| Observations | 3679 | 3679 | 3679 | 3679 | 3679 |
| R-squared | 0.1352 | 0.1352 | 0.1352 | 0.1352 | 0.1352 |
| Variable | Energy | ULGUE | Innovation | ULGUE |
|---|---|---|---|---|
| (1) | (2) | (3) | (4) | |
| energy | −0.0276 *** | |||
| (−4.6607) | ||||
| innovation | 0.0635 *** | |||
| (8.8407) | ||||
| did | −0.1141 *** | 0.0557 *** | 0.3600 *** | 0.0361 *** |
| (−3.8535) | (6.0124) | (12.7223) | (3.9364) | |
| agdp | 0.2129 *** | 0.0476 *** | −0.0934 *** | 0.0476 *** |
| (3.8308) | (3.5951) | (−3.5058) | (3.8135) | |
| density | −0.0221 | −0.0212 ** | −0.0834 ** | −0.0153 * |
| (−0.4970) | (−2.4030) | (−2.3229) | (−1.8135) | |
| government | 0.0361 | 0.0068 | −0.0003 | 0.0058 |
| (1.1712) | (0.6721) | (−0.0142) | (0.6104) | |
| fdi | 0.1475 | −0.4398 *** | −1.8696 *** | −0.3253 ** |
| (0.3515) | (−3.2568) | (−3.9707) | (−2.3465) | |
| road | −0.0502 | −0.0173 * | −0.0099 | −0.0153 * |
| (−1.1372) | (−1.9515) | (−0.3784) | (−1.7904) | |
| technology | 0.1855 *** | 0.0270 *** | 0.2012 *** | 0.0092 |
| (7.0601) | (3.5453) | (9.0105) | (1.2392) | |
| industry | 0.0356 | 0.0403 *** | −0.0712 *** | 0.0439 *** |
| (1.1182) | (4.4258) | (−2.9523) | (4.8815) | |
| hcl | 0.0299 | −0.0032 | −0.0507 *** | −0.0008 |
| (1.4029) | (−0.5523) | (−2.9577) | (−0.1405) | |
| Year fixed | Yes | Yes | Yes | Yes |
| City fixed | Yes | Yes | Yes | Yes |
| Observations | 3679 | 3679 | 3679 | 3679 |
| R-squared | 0.9181 | 0.6928 | 0.9390 | 0.7017 |
| Variable | ULGUE | ||
|---|---|---|---|
| (1) East | (2) Mid | (3) West | |
| did | 0.0812 *** | 0.0275 | 0.0513 ** |
| (6.2092) | (1.5121) | (2.5457) | |
| agdp | 0.0630 *** | 0.0780 *** | 0.0316 |
| (3.6773) | (4.2684) | (1.5349) | |
| density | −0.0218 * | 0.0014 | −0.0285 |
| (−1.7589) | (0.1241) | (−1.1087) | |
| government | −0.0089 * | 0.0078 | 0.1072 * |
| (−1.8871) | (0.3105) | (1.7914) | |
| fdi | −0.2657 | −0.3286 | −0.6313 |
| (−1.4612) | (−1.6414) | (−0.8957) | |
| road | −0.0121 | −0.0159 | −0.0052 |
| (−0.6457) | (−1.1782) | (−0.3065) | |
| technology | 0.0102 | 0.0067 | 0.0588 *** |
| (0.8725) | (0.6844) | (3.2285) | |
| industry | 0.0357 ** | 0.0362 ** | 0.0499 *** |
| (2.0641) | (2.4986) | (2.9978) | |
| hcl | −0.0555 *** | −0.0064 | 0.0161 * |
| (−3.3518) | (−1.0465) | (1.7659) | |
| Year fixed | Yes | Yes | Yes |
| City fixed | Yes | Yes | Yes |
| Observations | 1300 | 1300 | 1079 |
| R-squared | 0.7624 | 0.5874 | 0.6705 |
| Variable | ULGUE | |
|---|---|---|
| (1) Non-Resource-Based | (2) Resource-Based | |
| did | 0.0774 *** | −0.0341 *** |
| (6.6931) | (−2.9591) | |
| agdp | 0.0543 *** | 0.0274 * |
| (3.5898) | (1.7498) | |
| density | −0.0043 | −0.0672 *** |
| (−0.4600) | (−4.5285) | |
| government | 0.0022 | −0.0032 |
| (0.2532) | (−0.1157) | |
| fdi | −0.1732 | −0.6782 *** |
| (−1.1172) | (−3.2167) | |
| road | −0.0217 * | 0.0050 |
| (−1.9154) | (0.3806) | |
| technology | 0.0199 ** | 0.0093 |
| (2.1813) | (0.7711) | |
| industry | 0.0429 *** | 0.0286 ** |
| (3.6057) | (2.1638) | |
| hcl | −0.0103 | 0.0031 |
| (−1.4859) | (0.3125) | |
| Year fixed | Yes | Yes |
| City fixed | Yes | Yes |
| Observations | 2210 | 1469 |
| R-squared | 0.7101 | 0.6697 |
Disclaimer/Publisher’s Note: The statements, opinions and data contained in all publications are solely those of the individual author(s) and contributor(s) and not of MDPI and/or the editor(s). MDPI and/or the editor(s) disclaim responsibility for any injury to people or property resulting from any ideas, methods, instructions or products referred to in the content. |
© 2024 by the authors. Licensee MDPI, Basel, Switzerland. This article is an open access article distributed under the terms and conditions of the Creative Commons Attribution (CC BY) license (https://creativecommons.org/licenses/by/4.0/).
Share and Cite
Zheng, L.; Chen, J. Impacts of Low-Carbon City Pilot Policy on Urban Land Green Use Efficiency: Evidence from 283 Cities in China. Sustainability 2024, 16, 4115. https://doi.org/10.3390/su16104115
Zheng L, Chen J. Impacts of Low-Carbon City Pilot Policy on Urban Land Green Use Efficiency: Evidence from 283 Cities in China. Sustainability. 2024; 16(10):4115. https://doi.org/10.3390/su16104115
Chicago/Turabian StyleZheng, Lingyan, and Jiangping Chen. 2024. "Impacts of Low-Carbon City Pilot Policy on Urban Land Green Use Efficiency: Evidence from 283 Cities in China" Sustainability 16, no. 10: 4115. https://doi.org/10.3390/su16104115
APA StyleZheng, L., & Chen, J. (2024). Impacts of Low-Carbon City Pilot Policy on Urban Land Green Use Efficiency: Evidence from 283 Cities in China. Sustainability, 16(10), 4115. https://doi.org/10.3390/su16104115