
State Reliability of Wind Turbines Based on XGBoost–LSTM and Their Application in Northeast China


Abstract
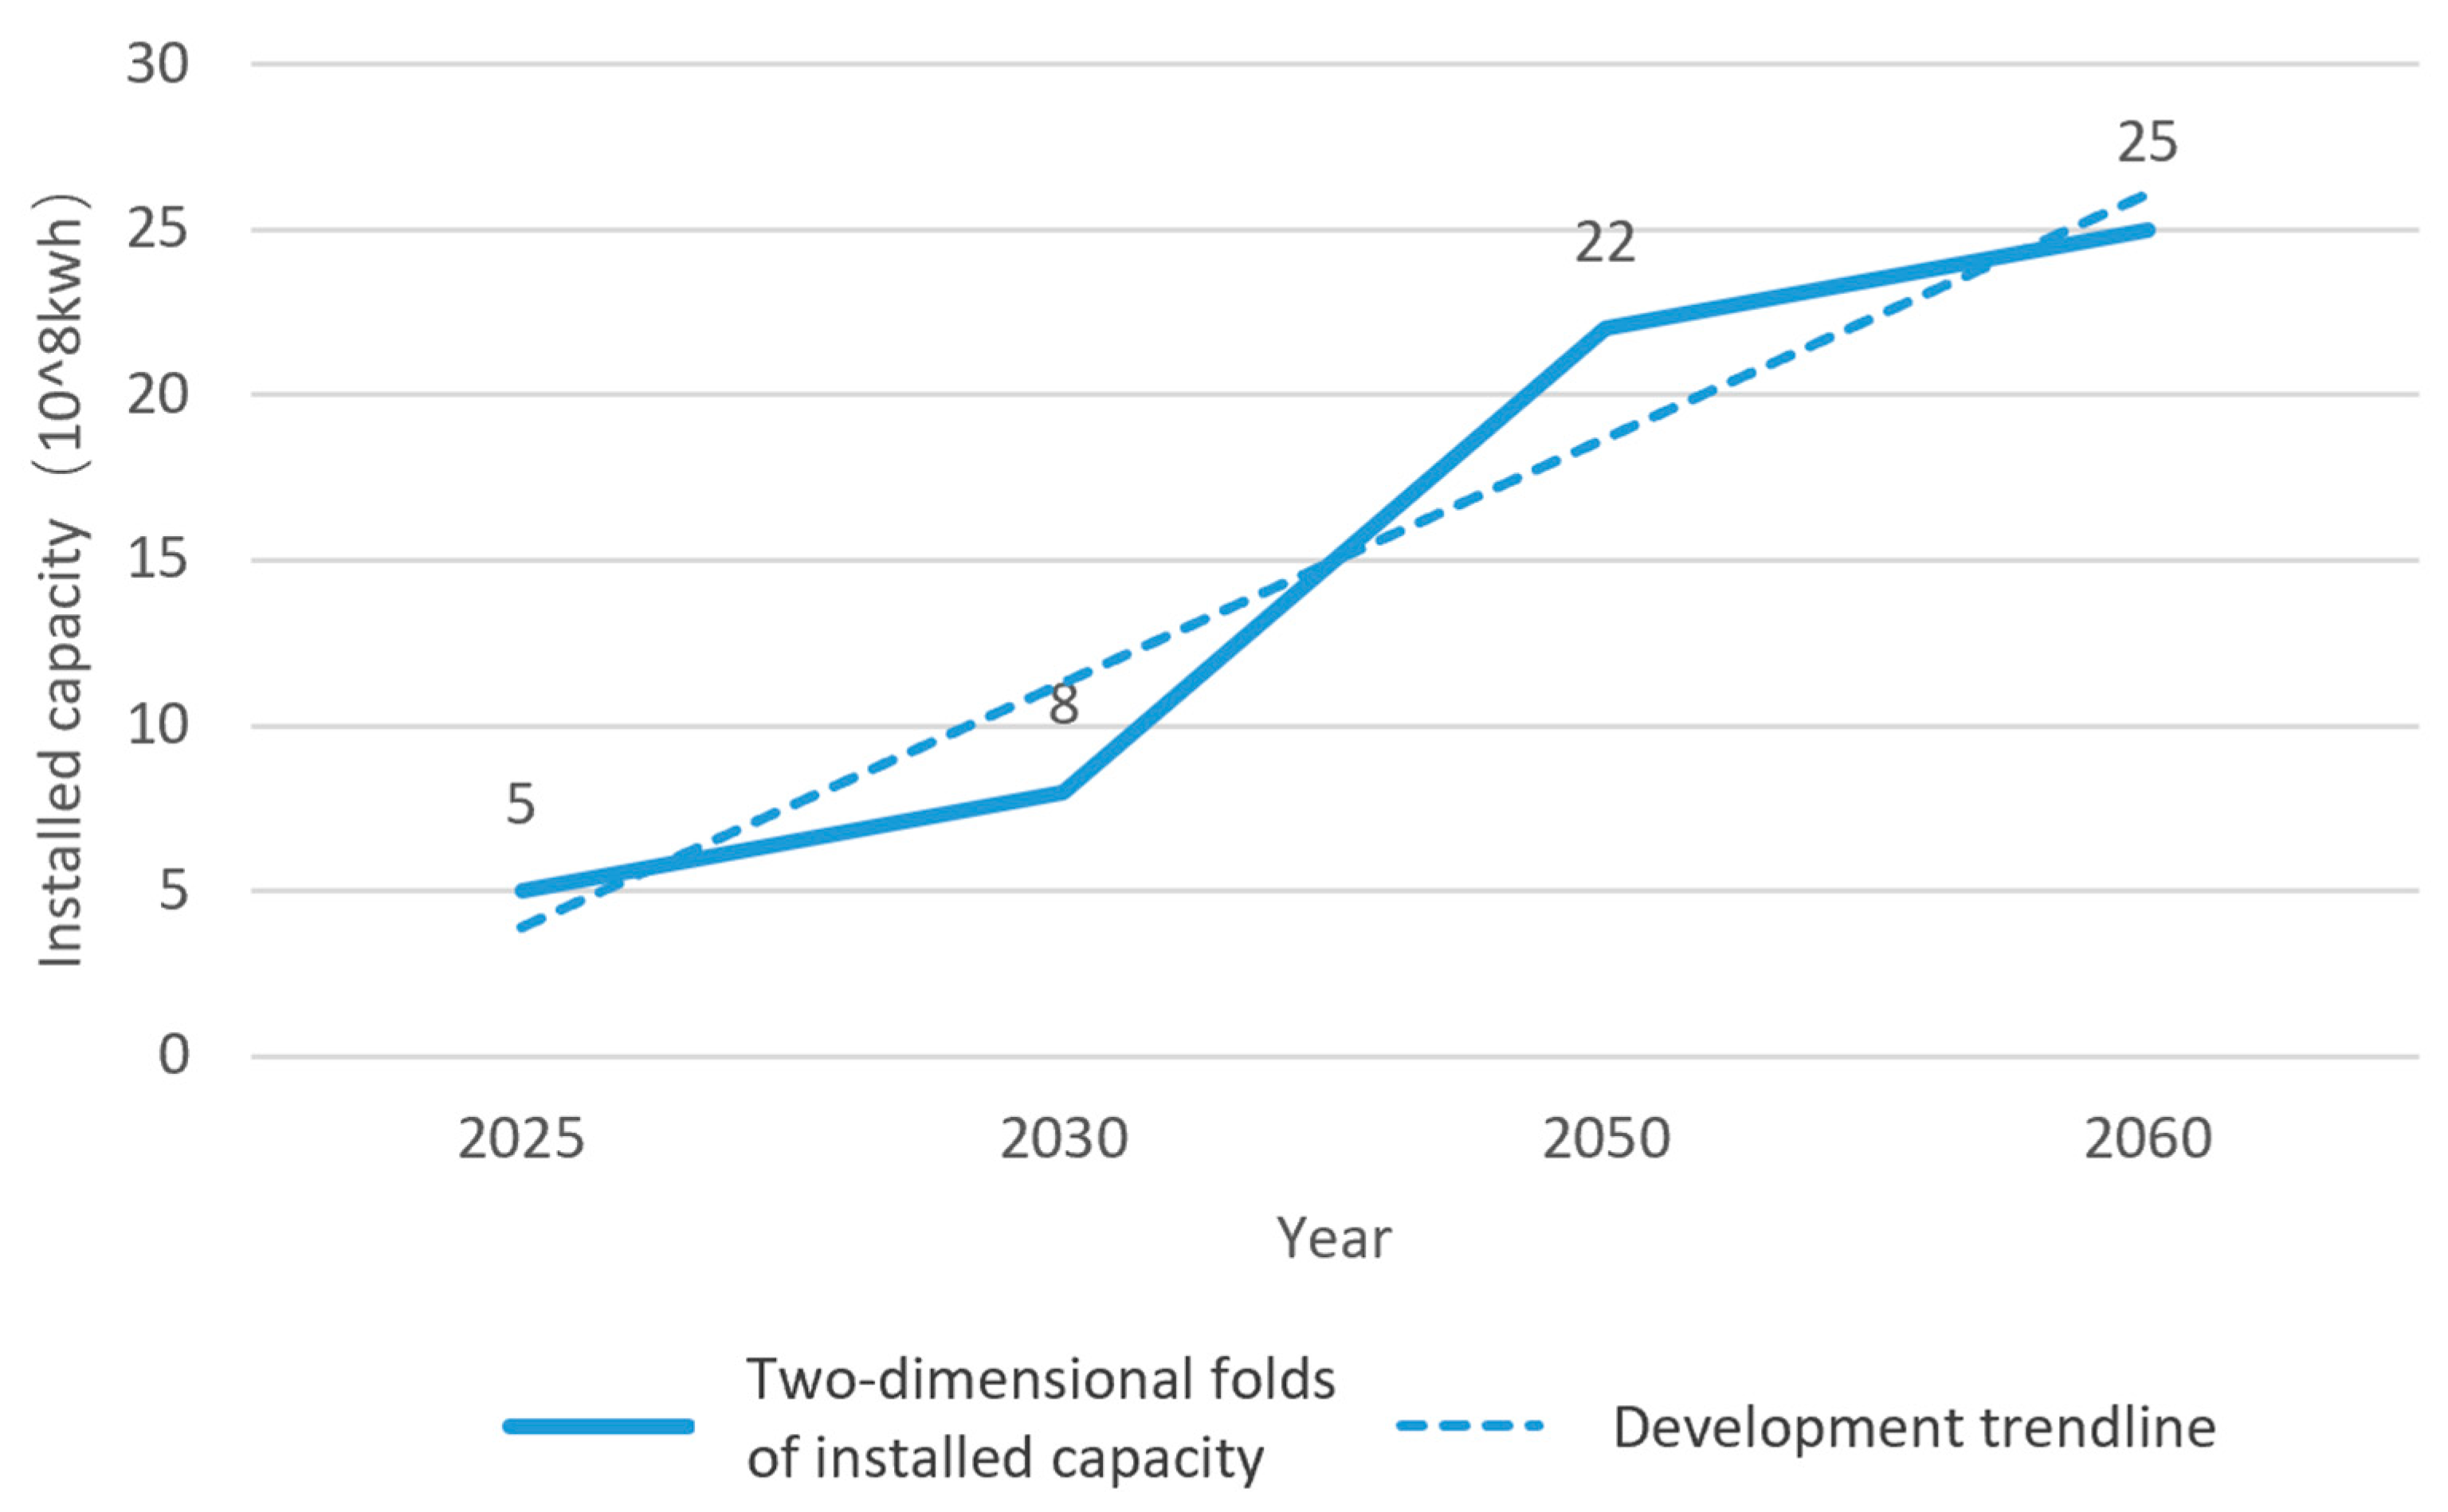
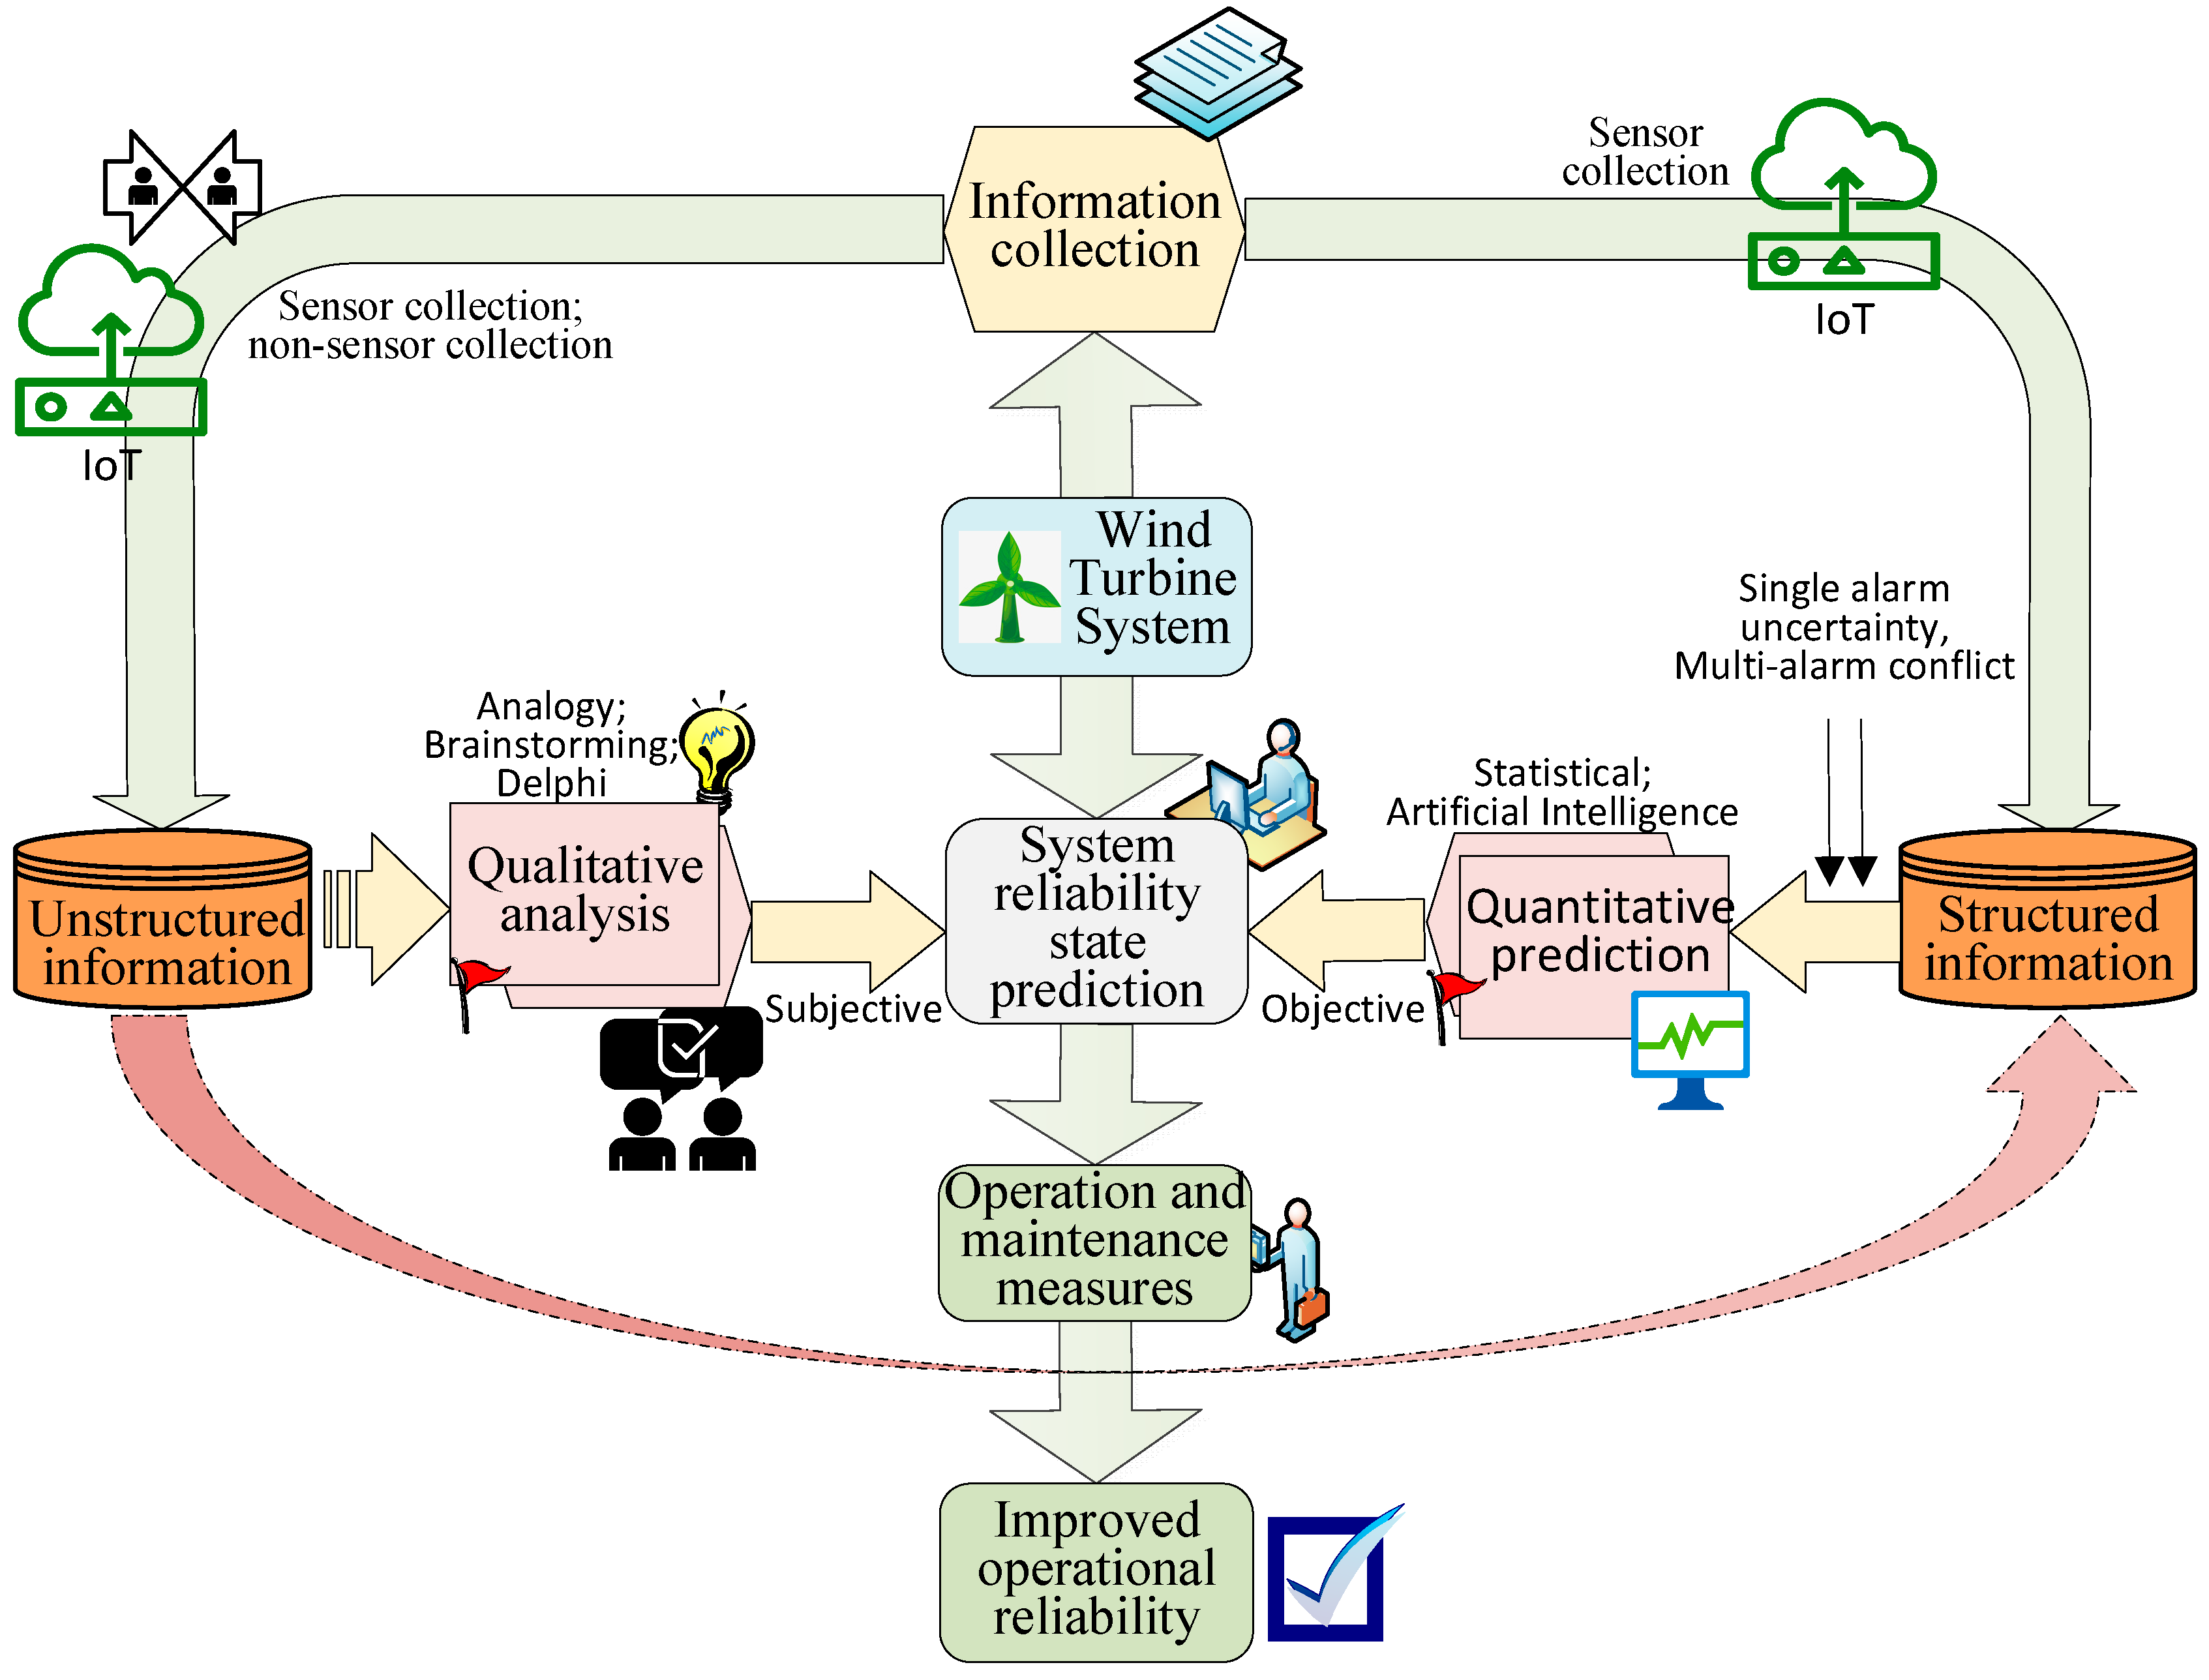
1. Introduction
2. Materials and Methods
2.1. Previous Related Work
2.2. Methods
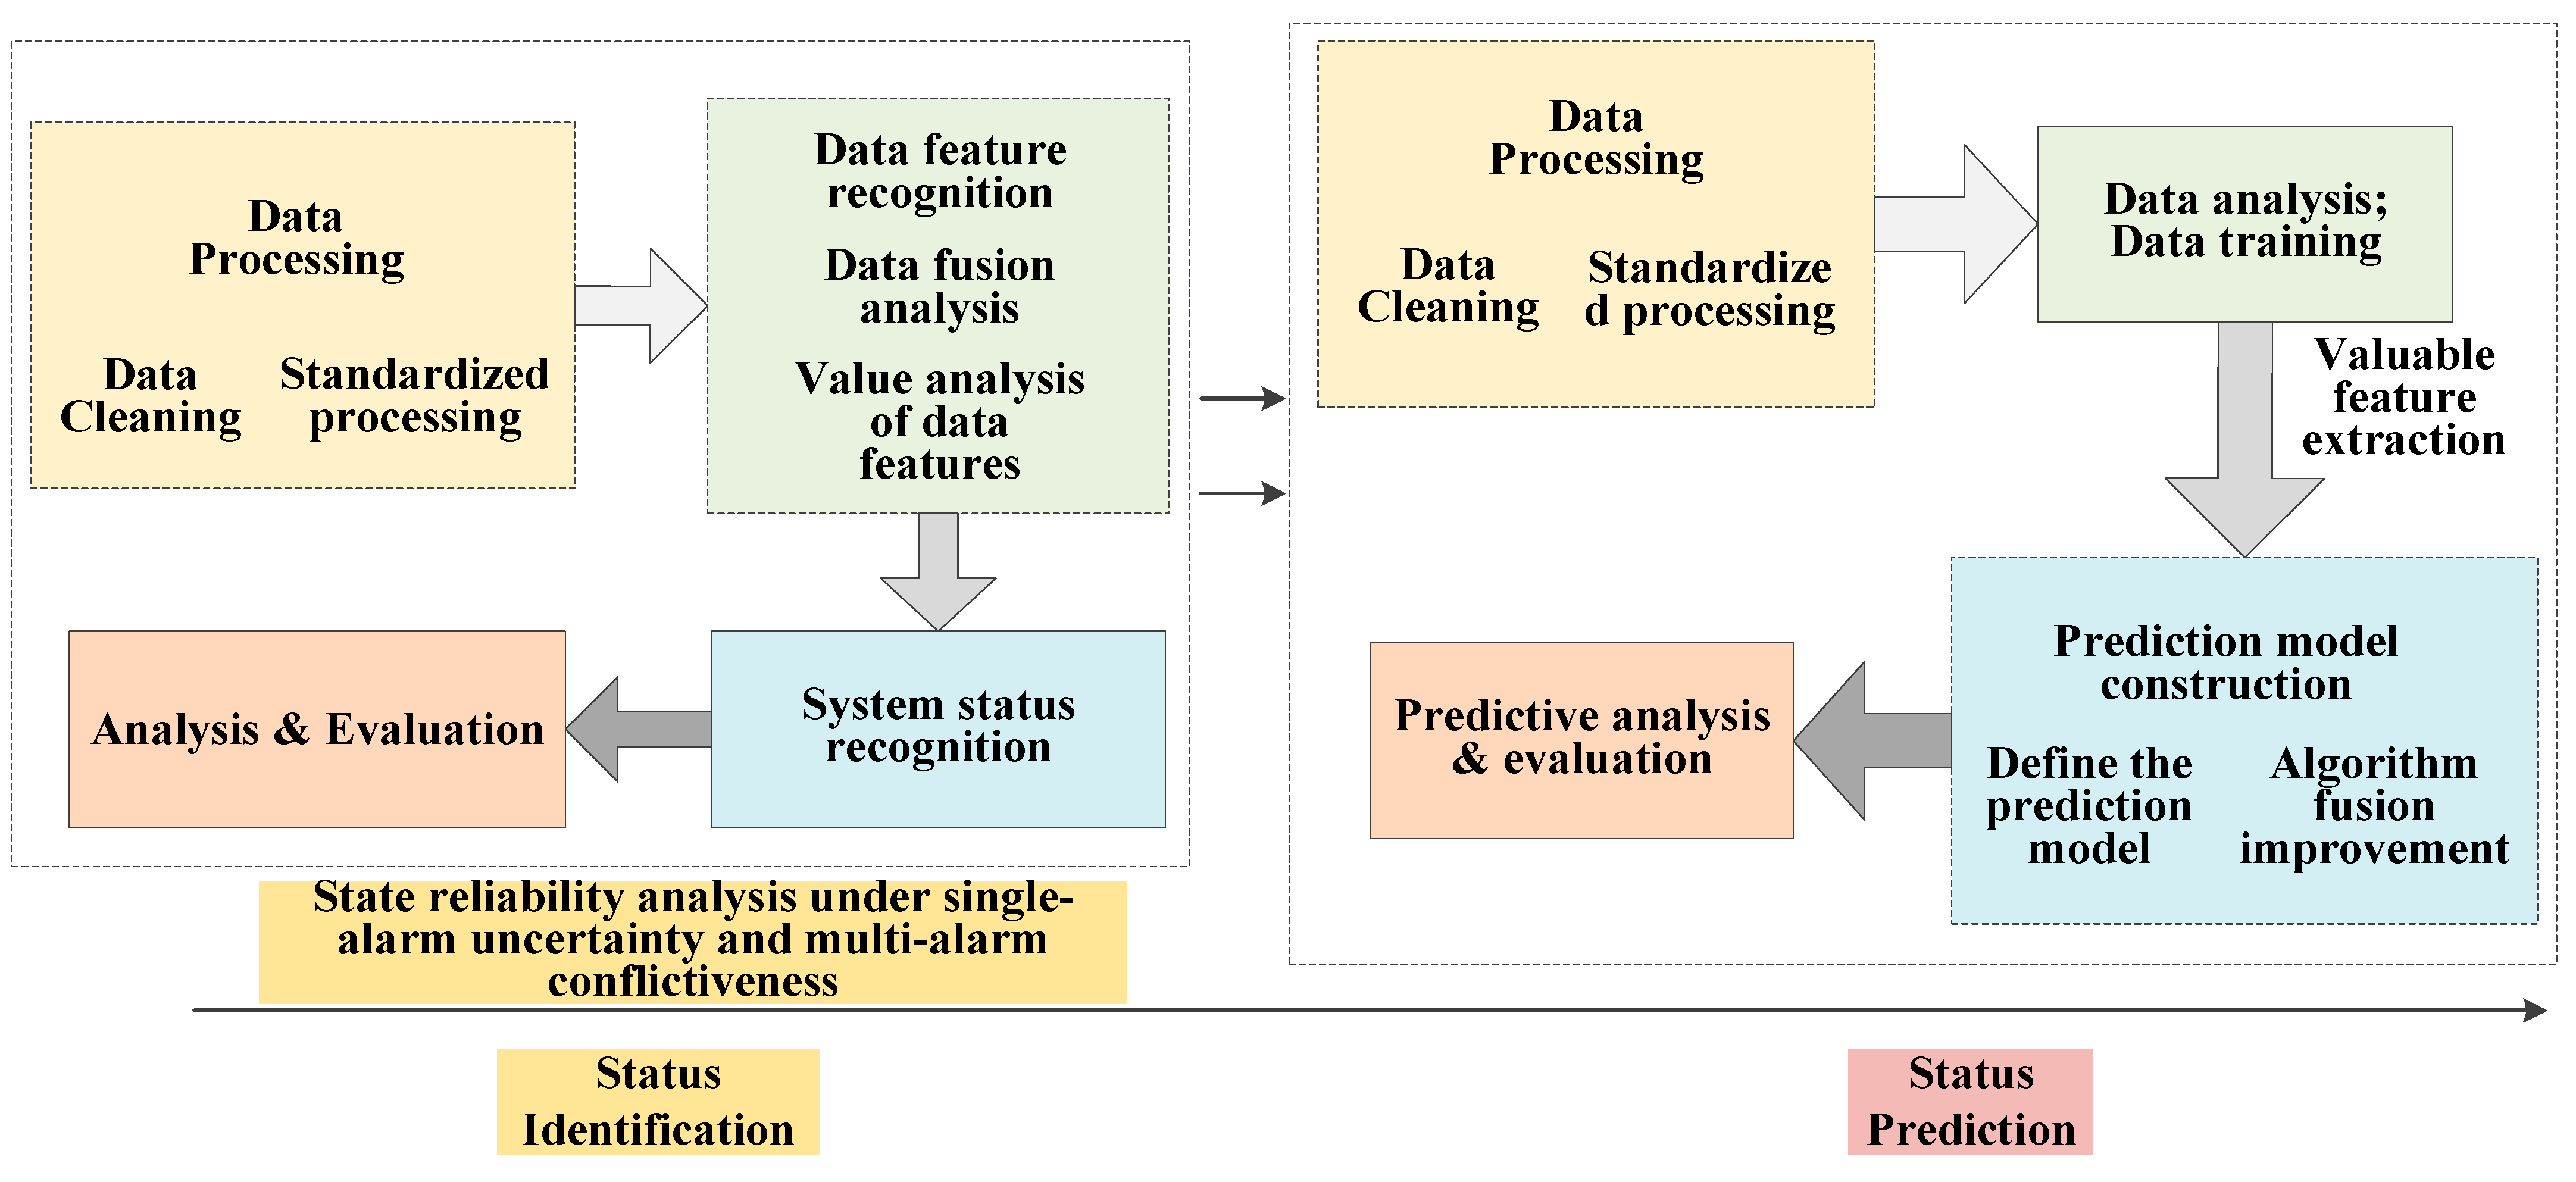
2.2.1. Research Model and Process Design
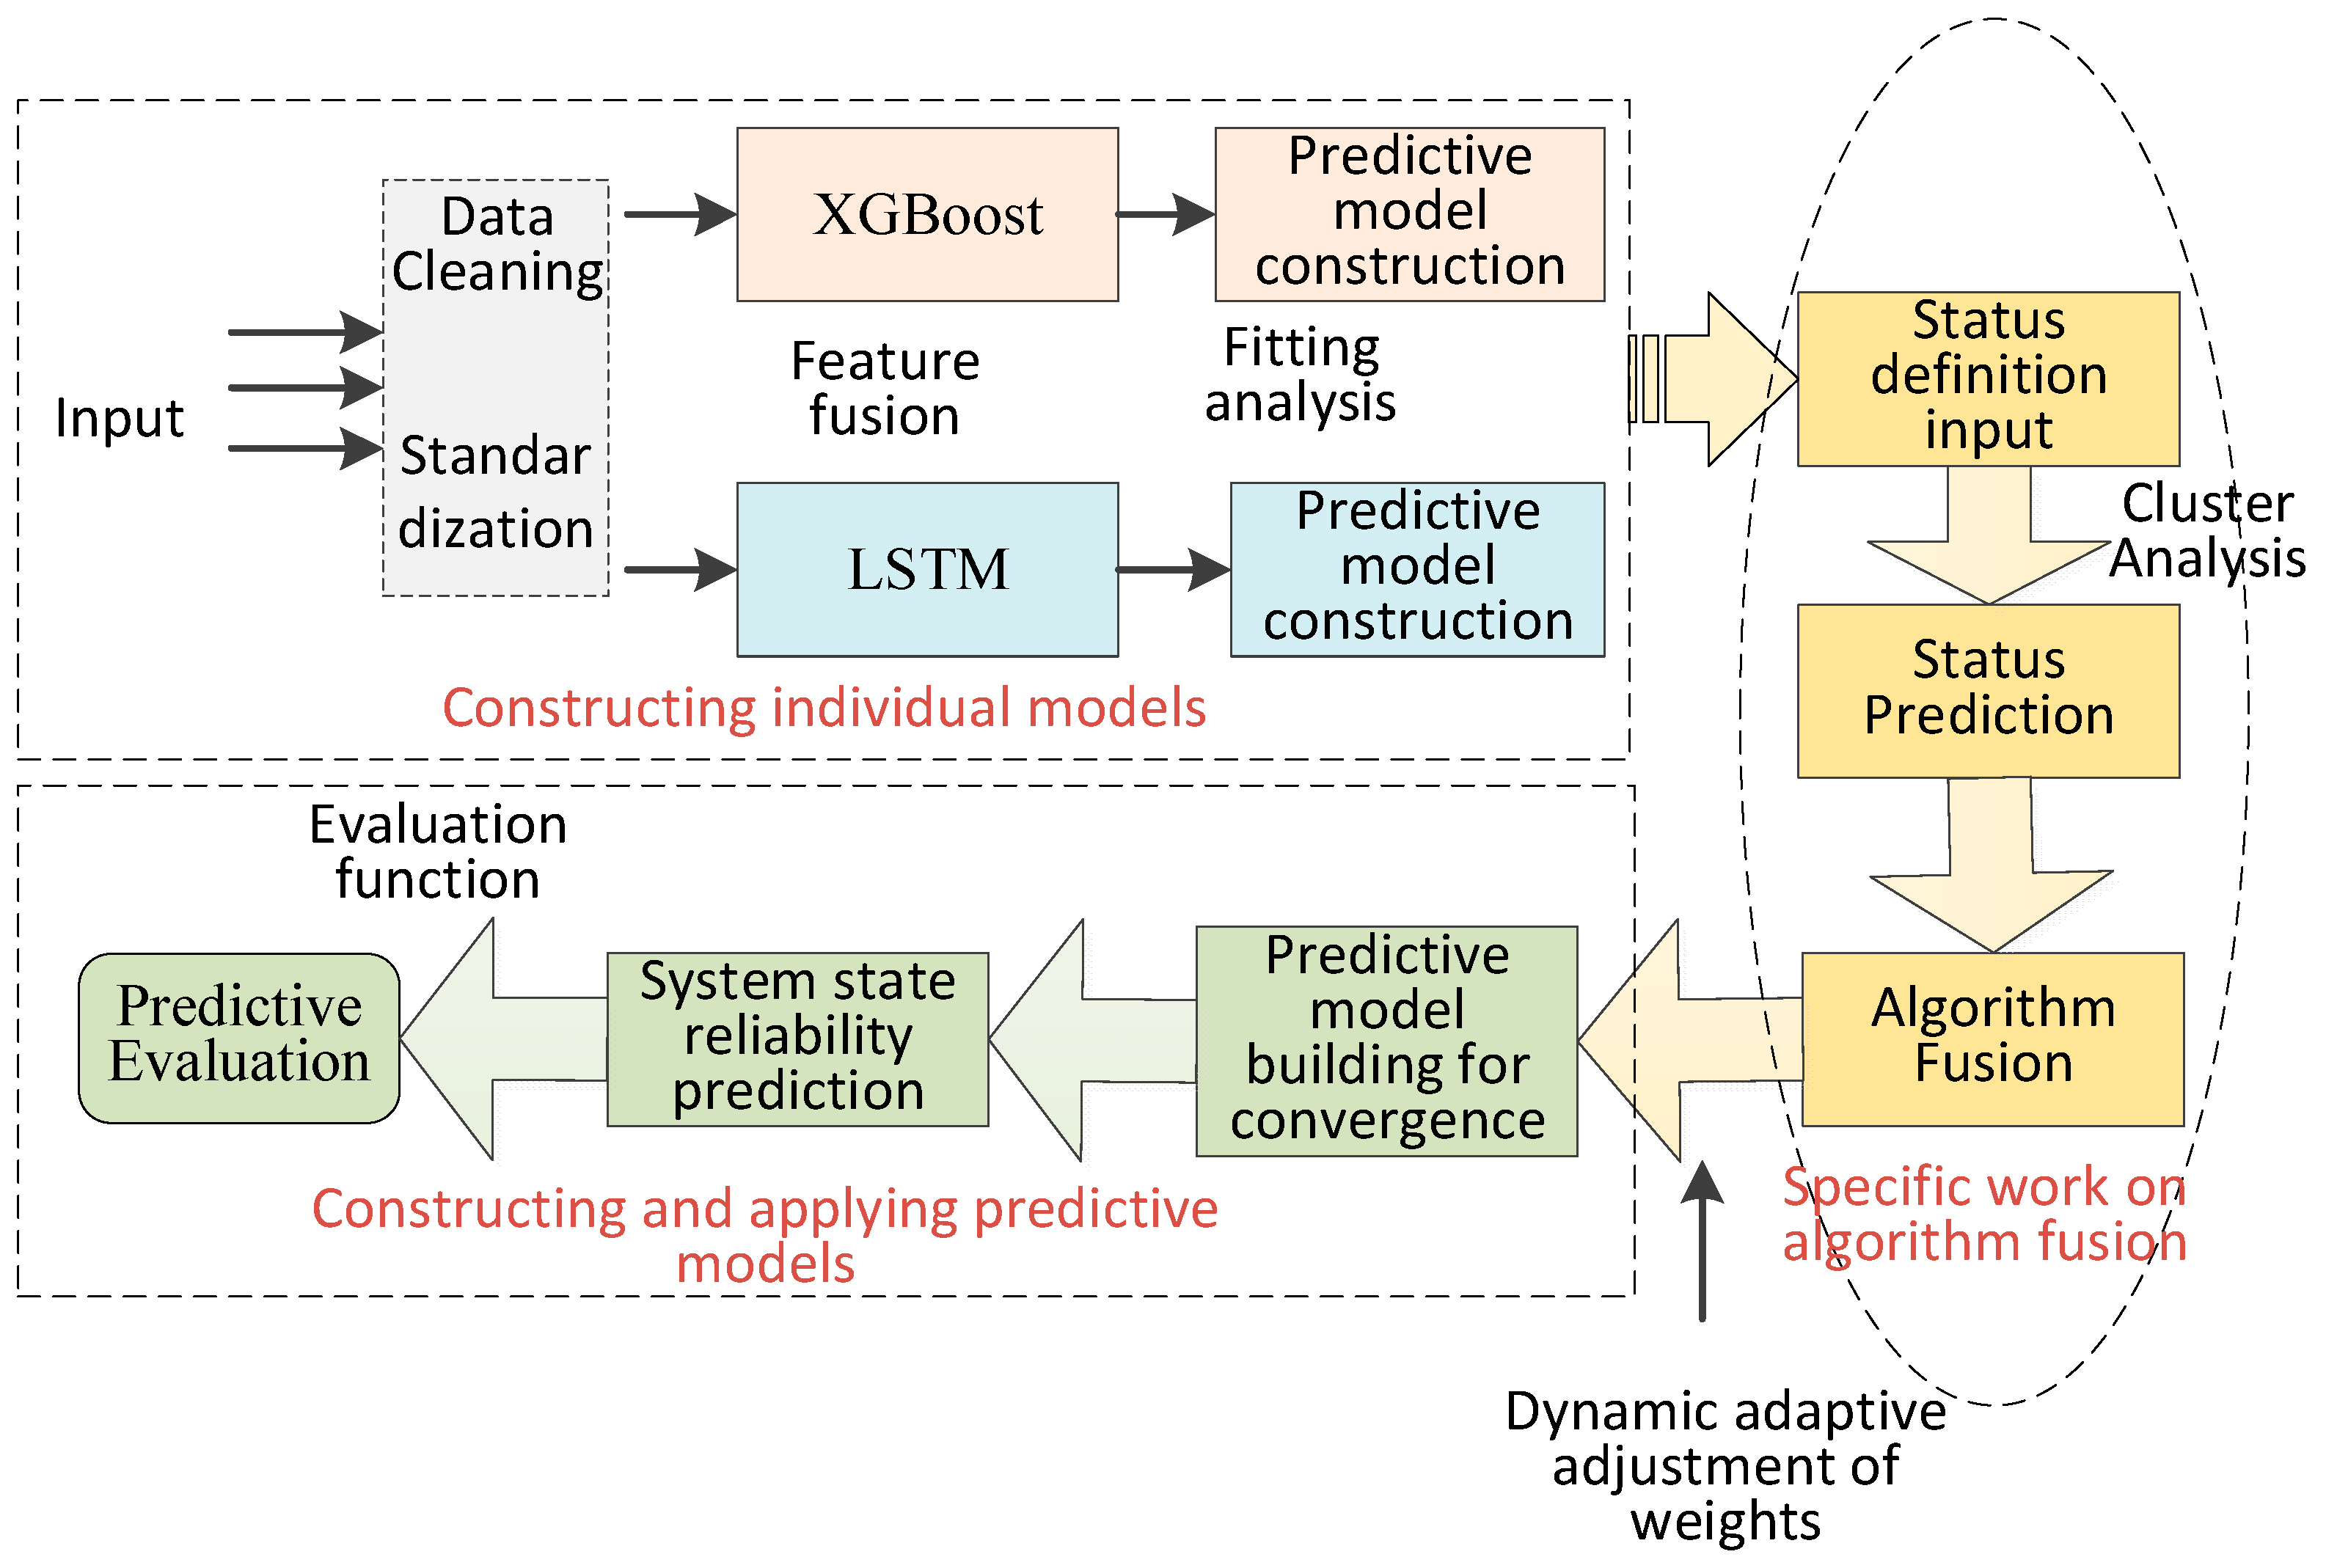
2.2.2. Construction of Improved Prediction Model Based on XGBoost–LSTM
- (1)
- Single-prediction model construction
- (2)
- Fusion prediction model construction
3. Results
3.1. Wind Turbine System State Reliability Prediction
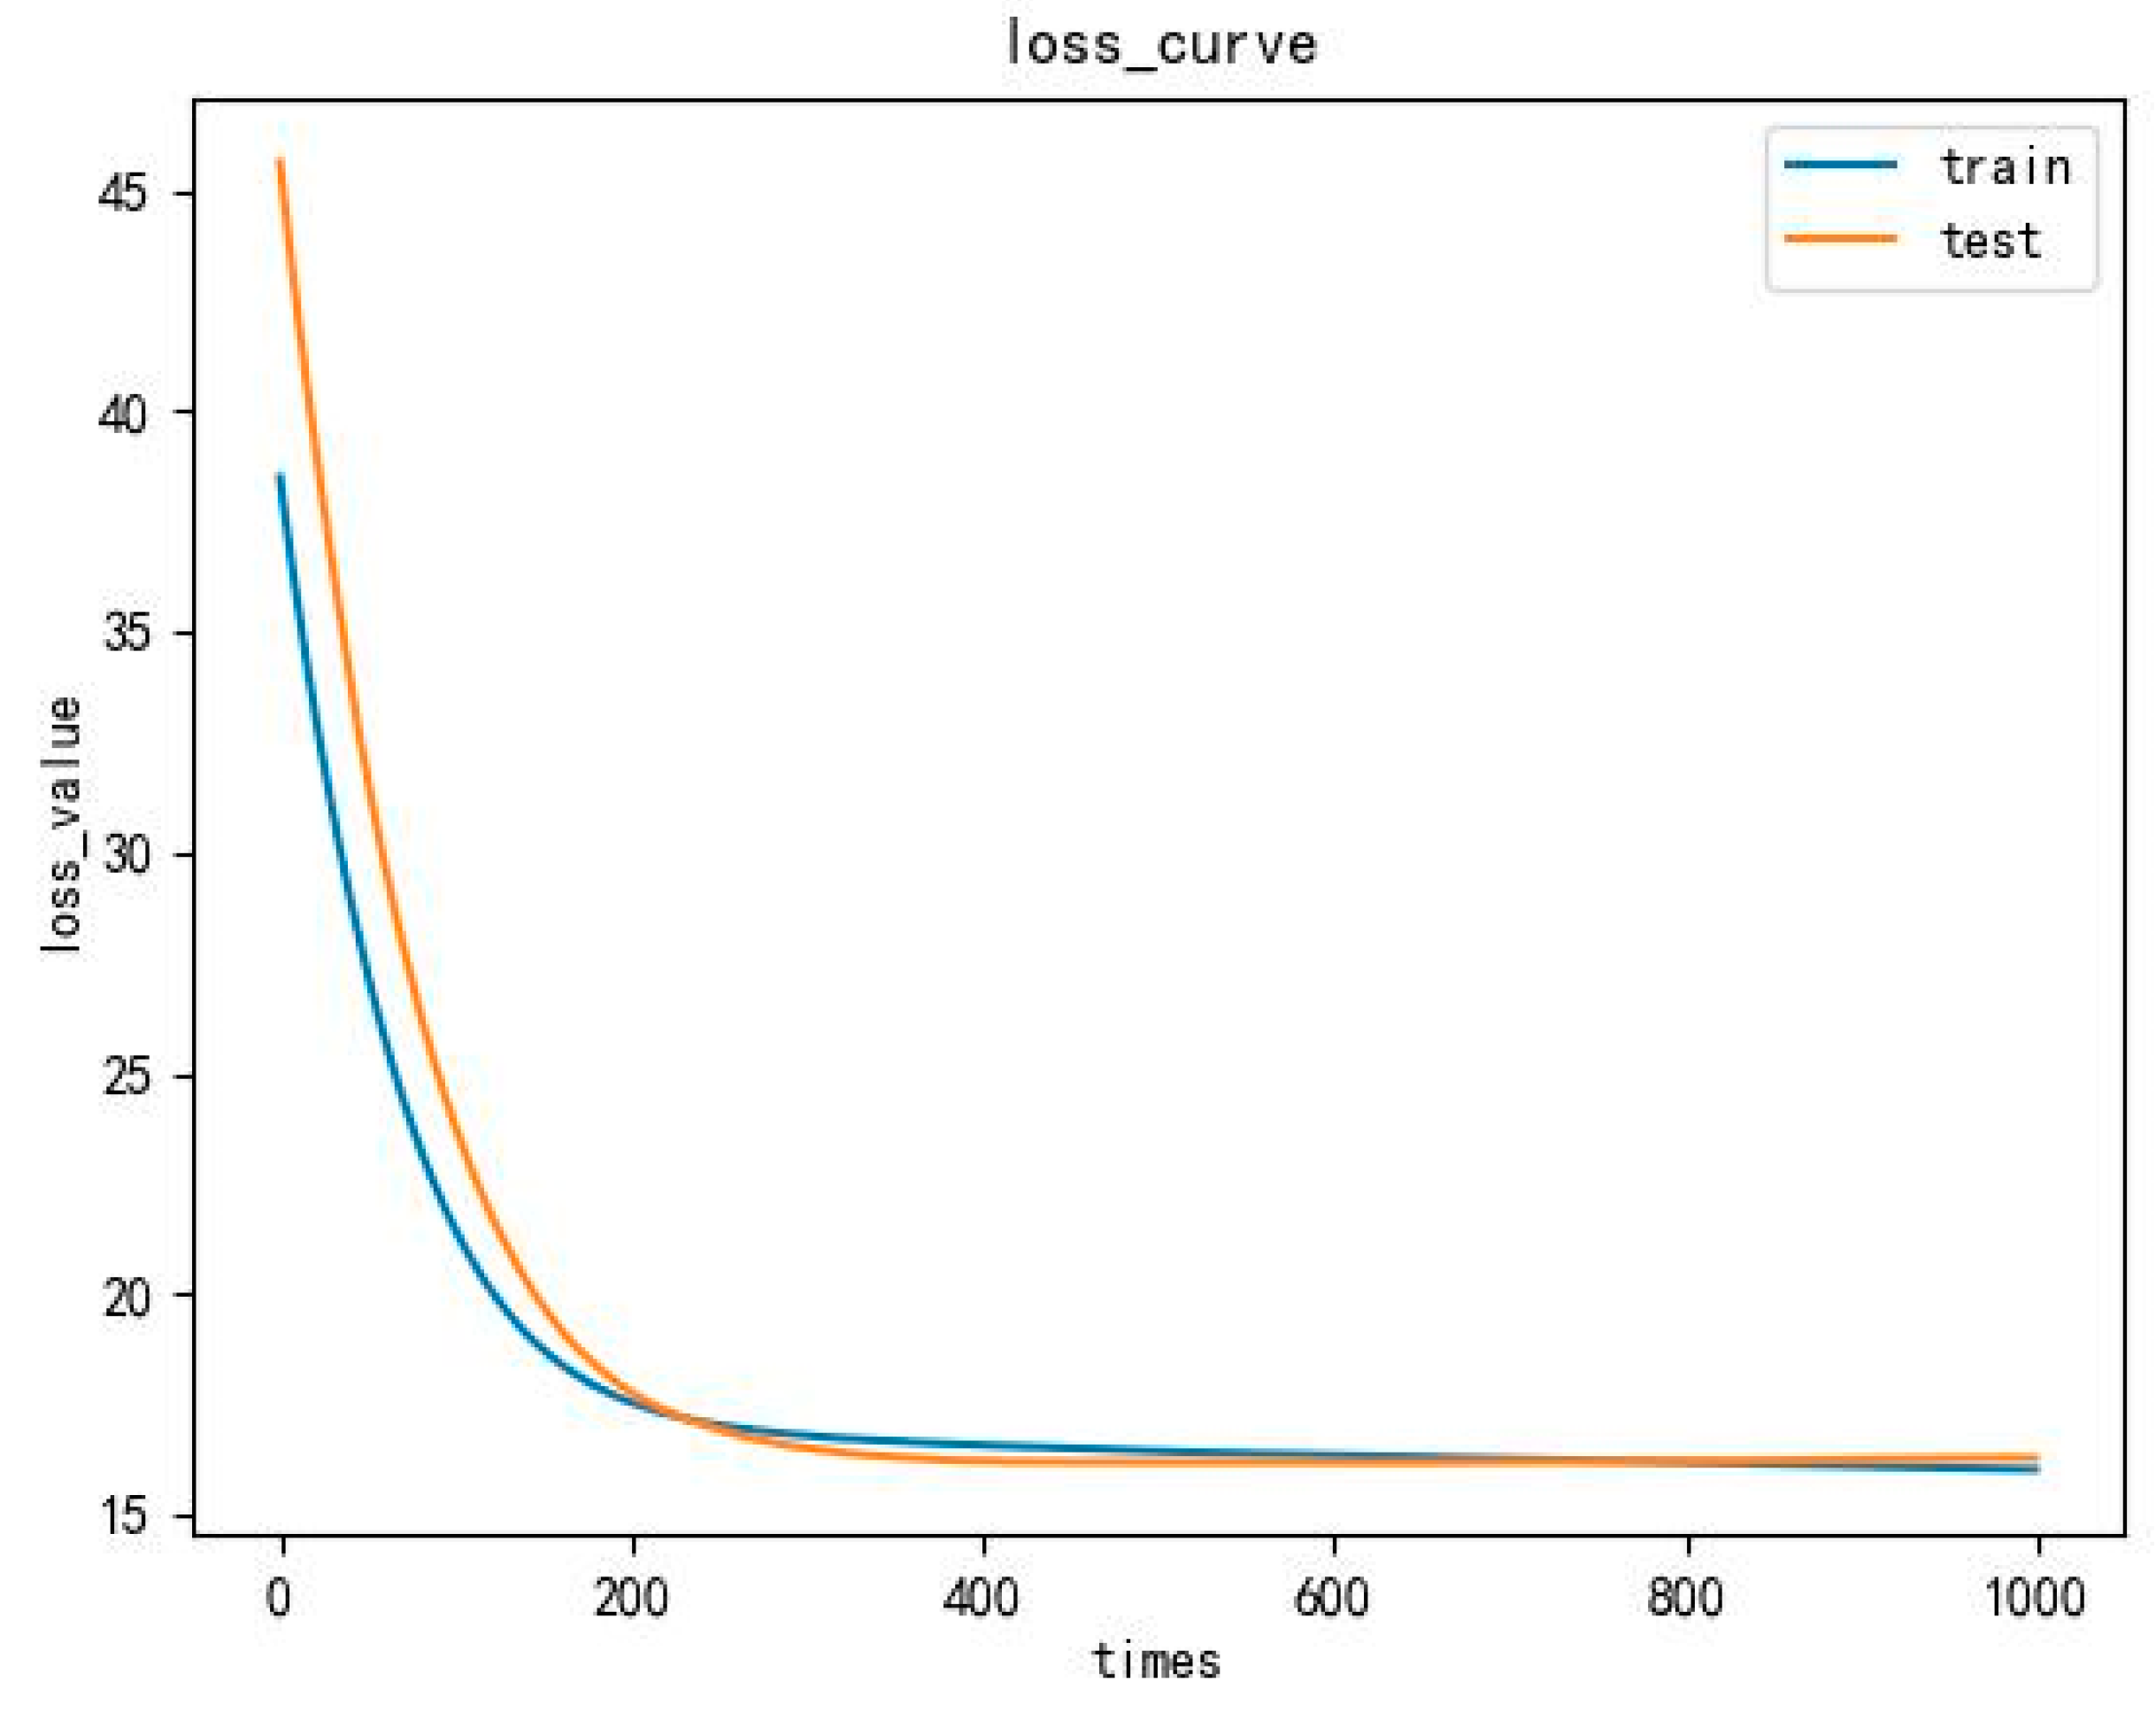
3.1.1. Hyperparameter Optimization
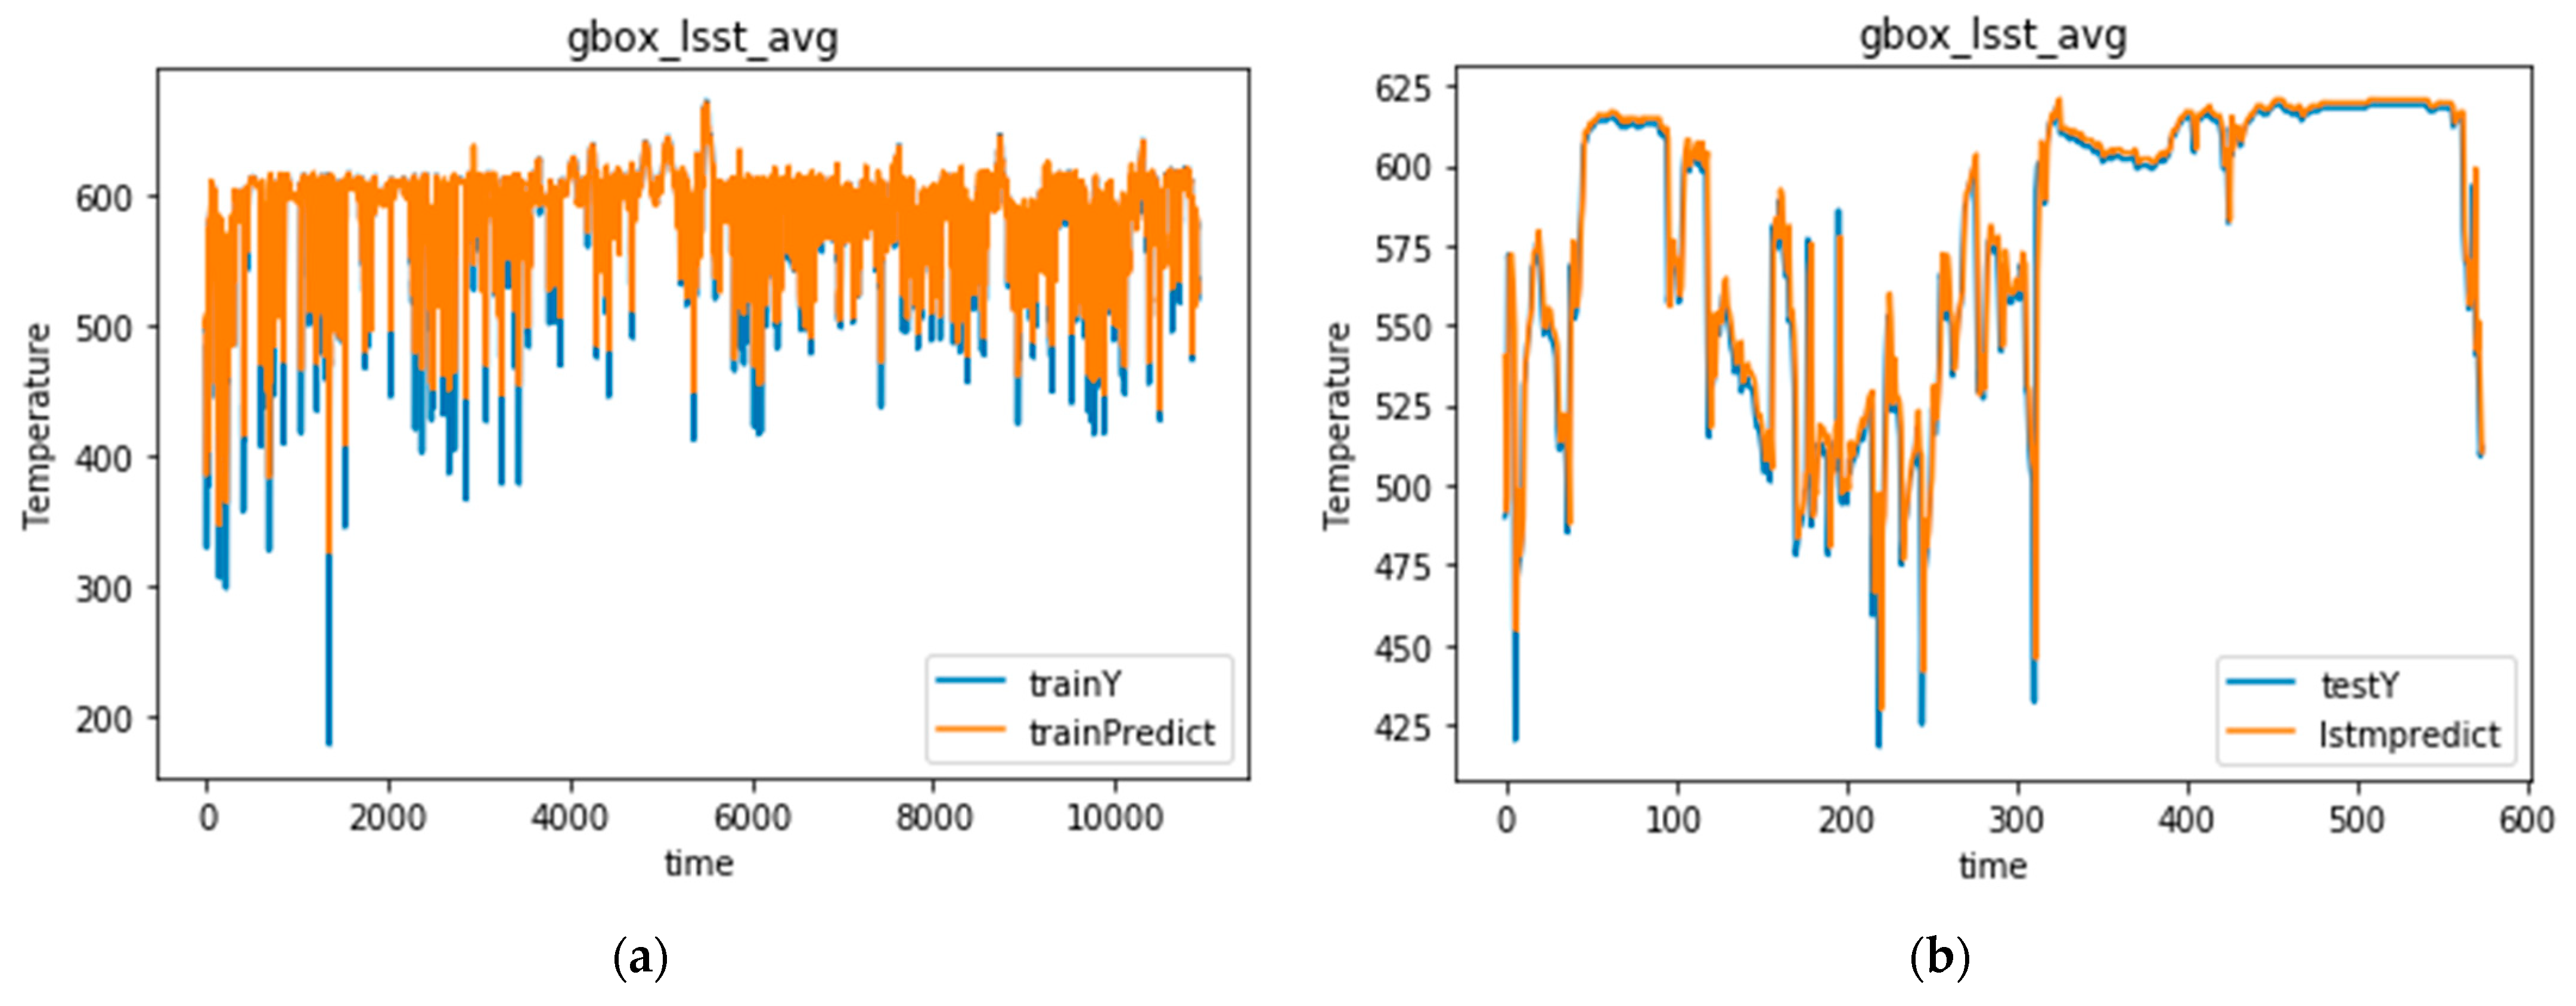
3.1.2. System State Reliability Prediction Based on the LSTM Algorithm
3.1.3. System State Reliability Prediction Based on the XGBoost Algorithm
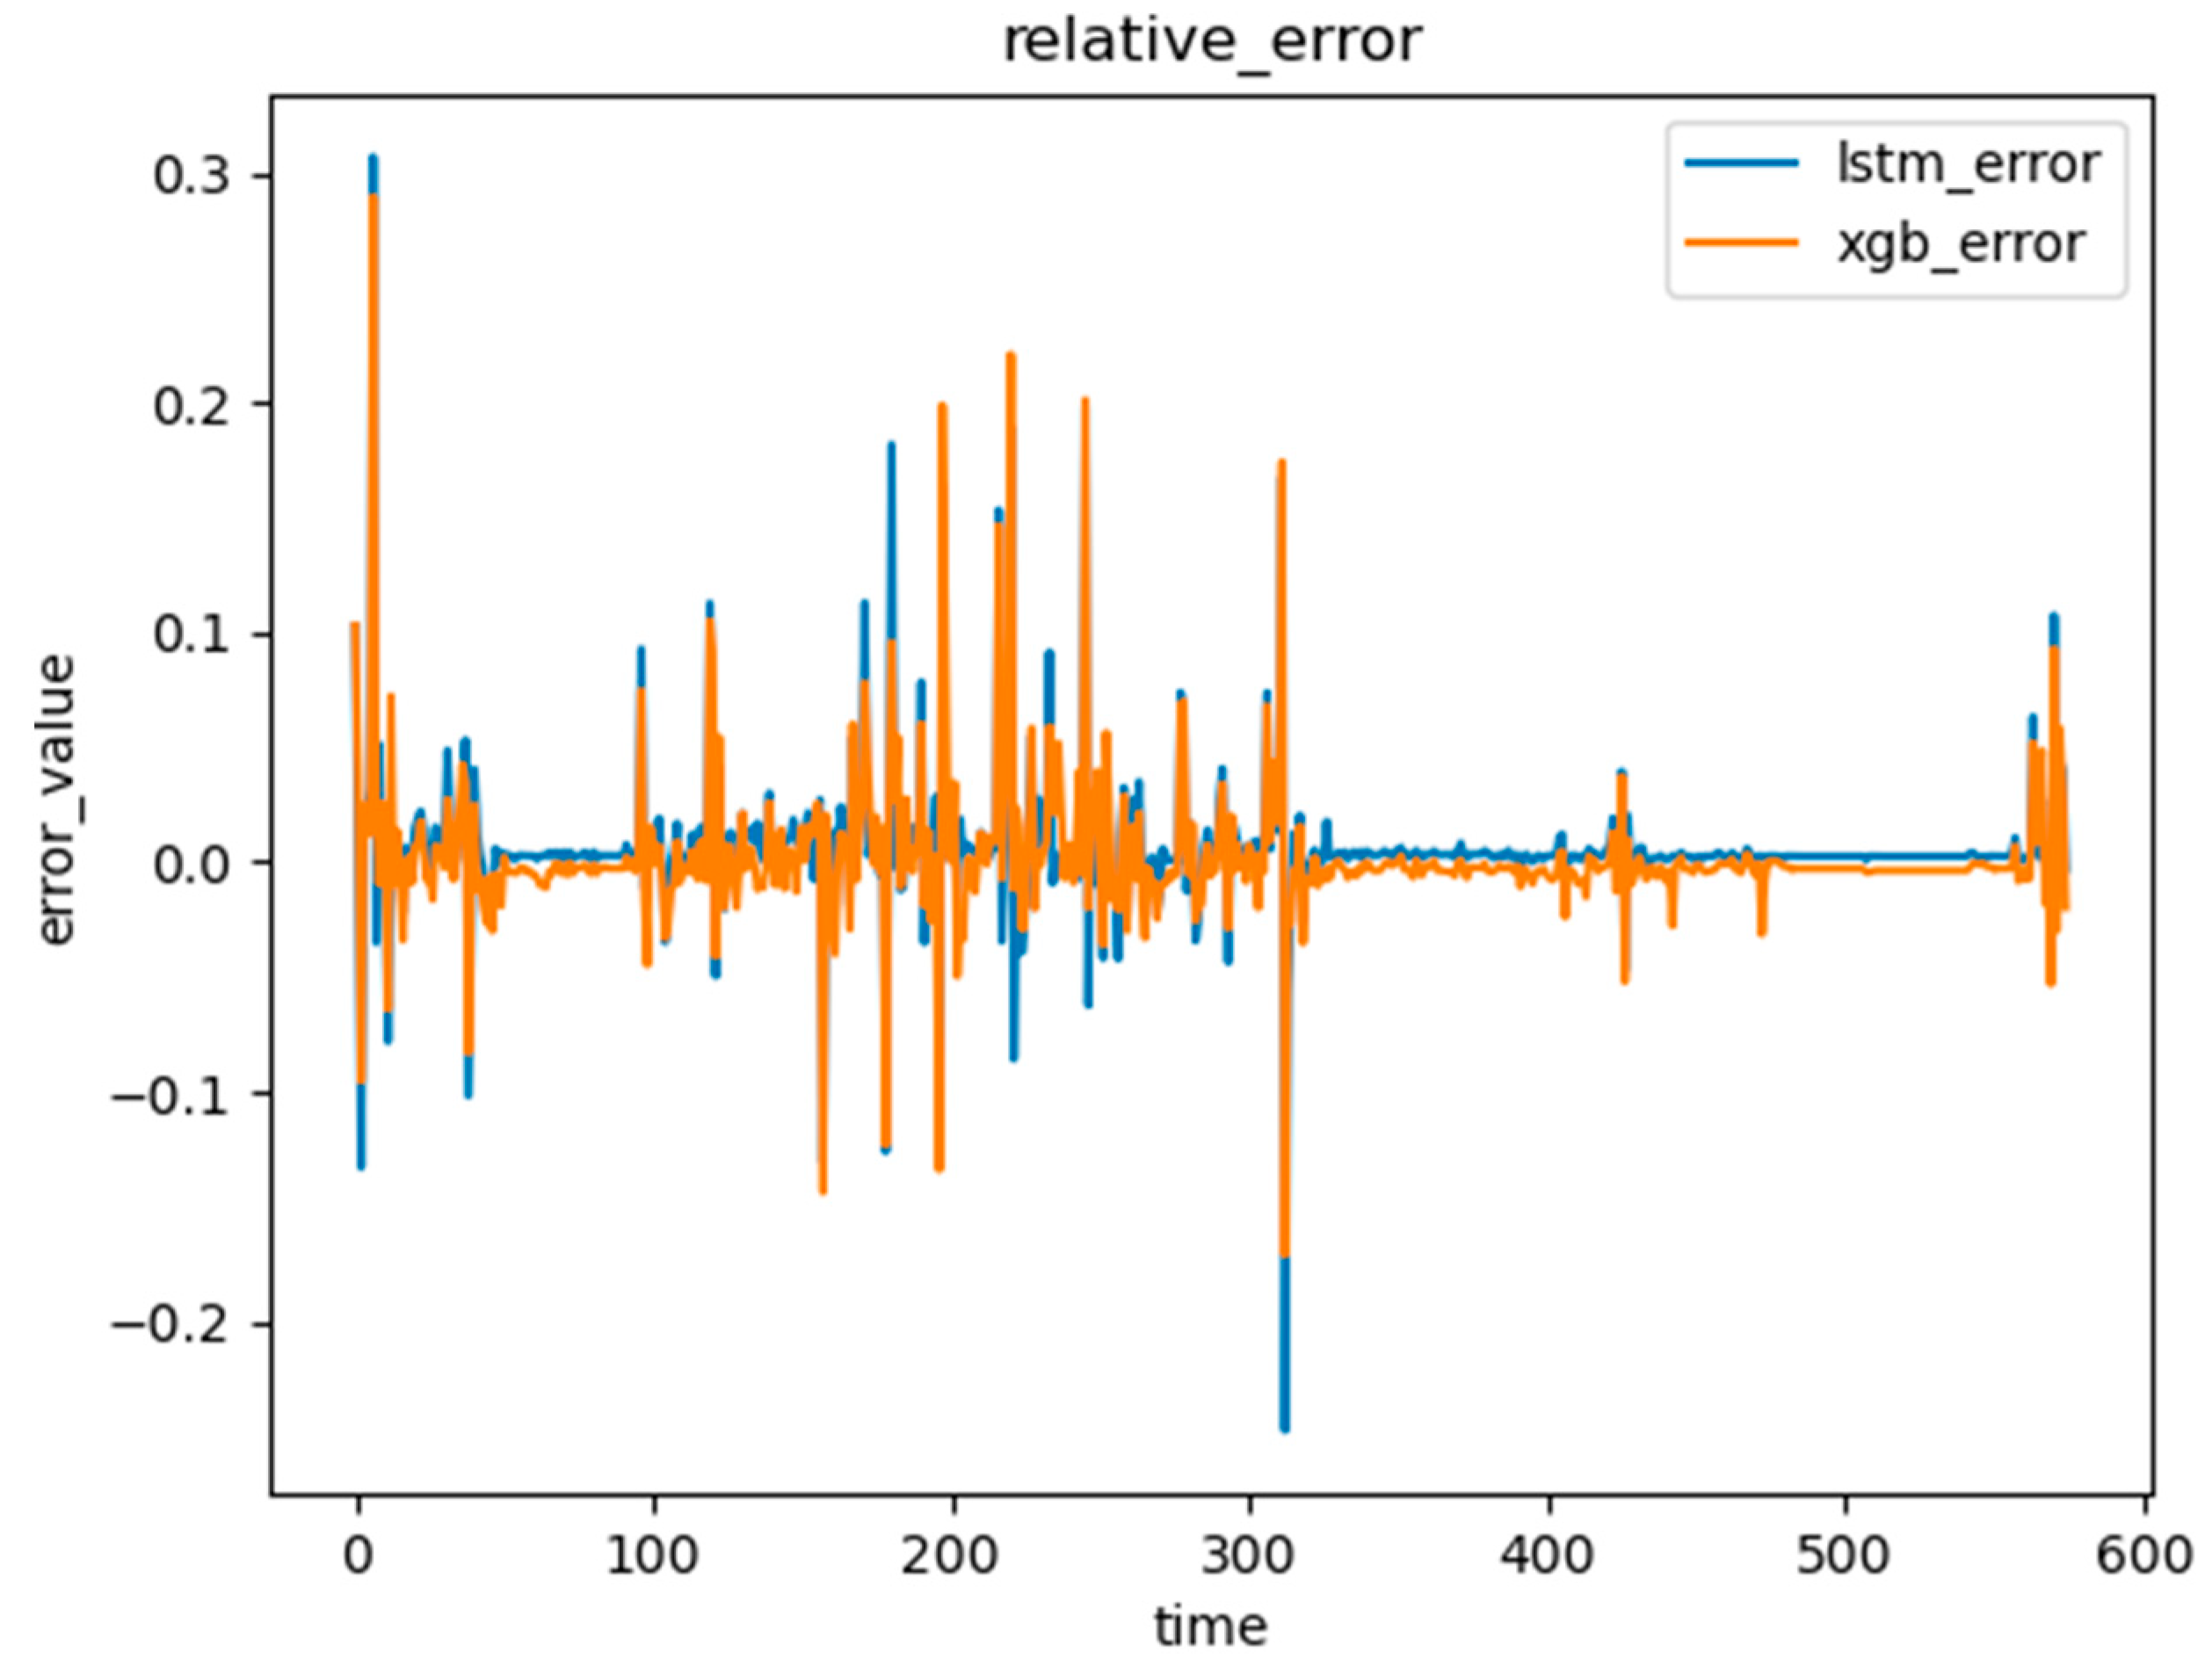
3.1.4. Relative Error Analysis of the LSTM and XGBoost Algorithms
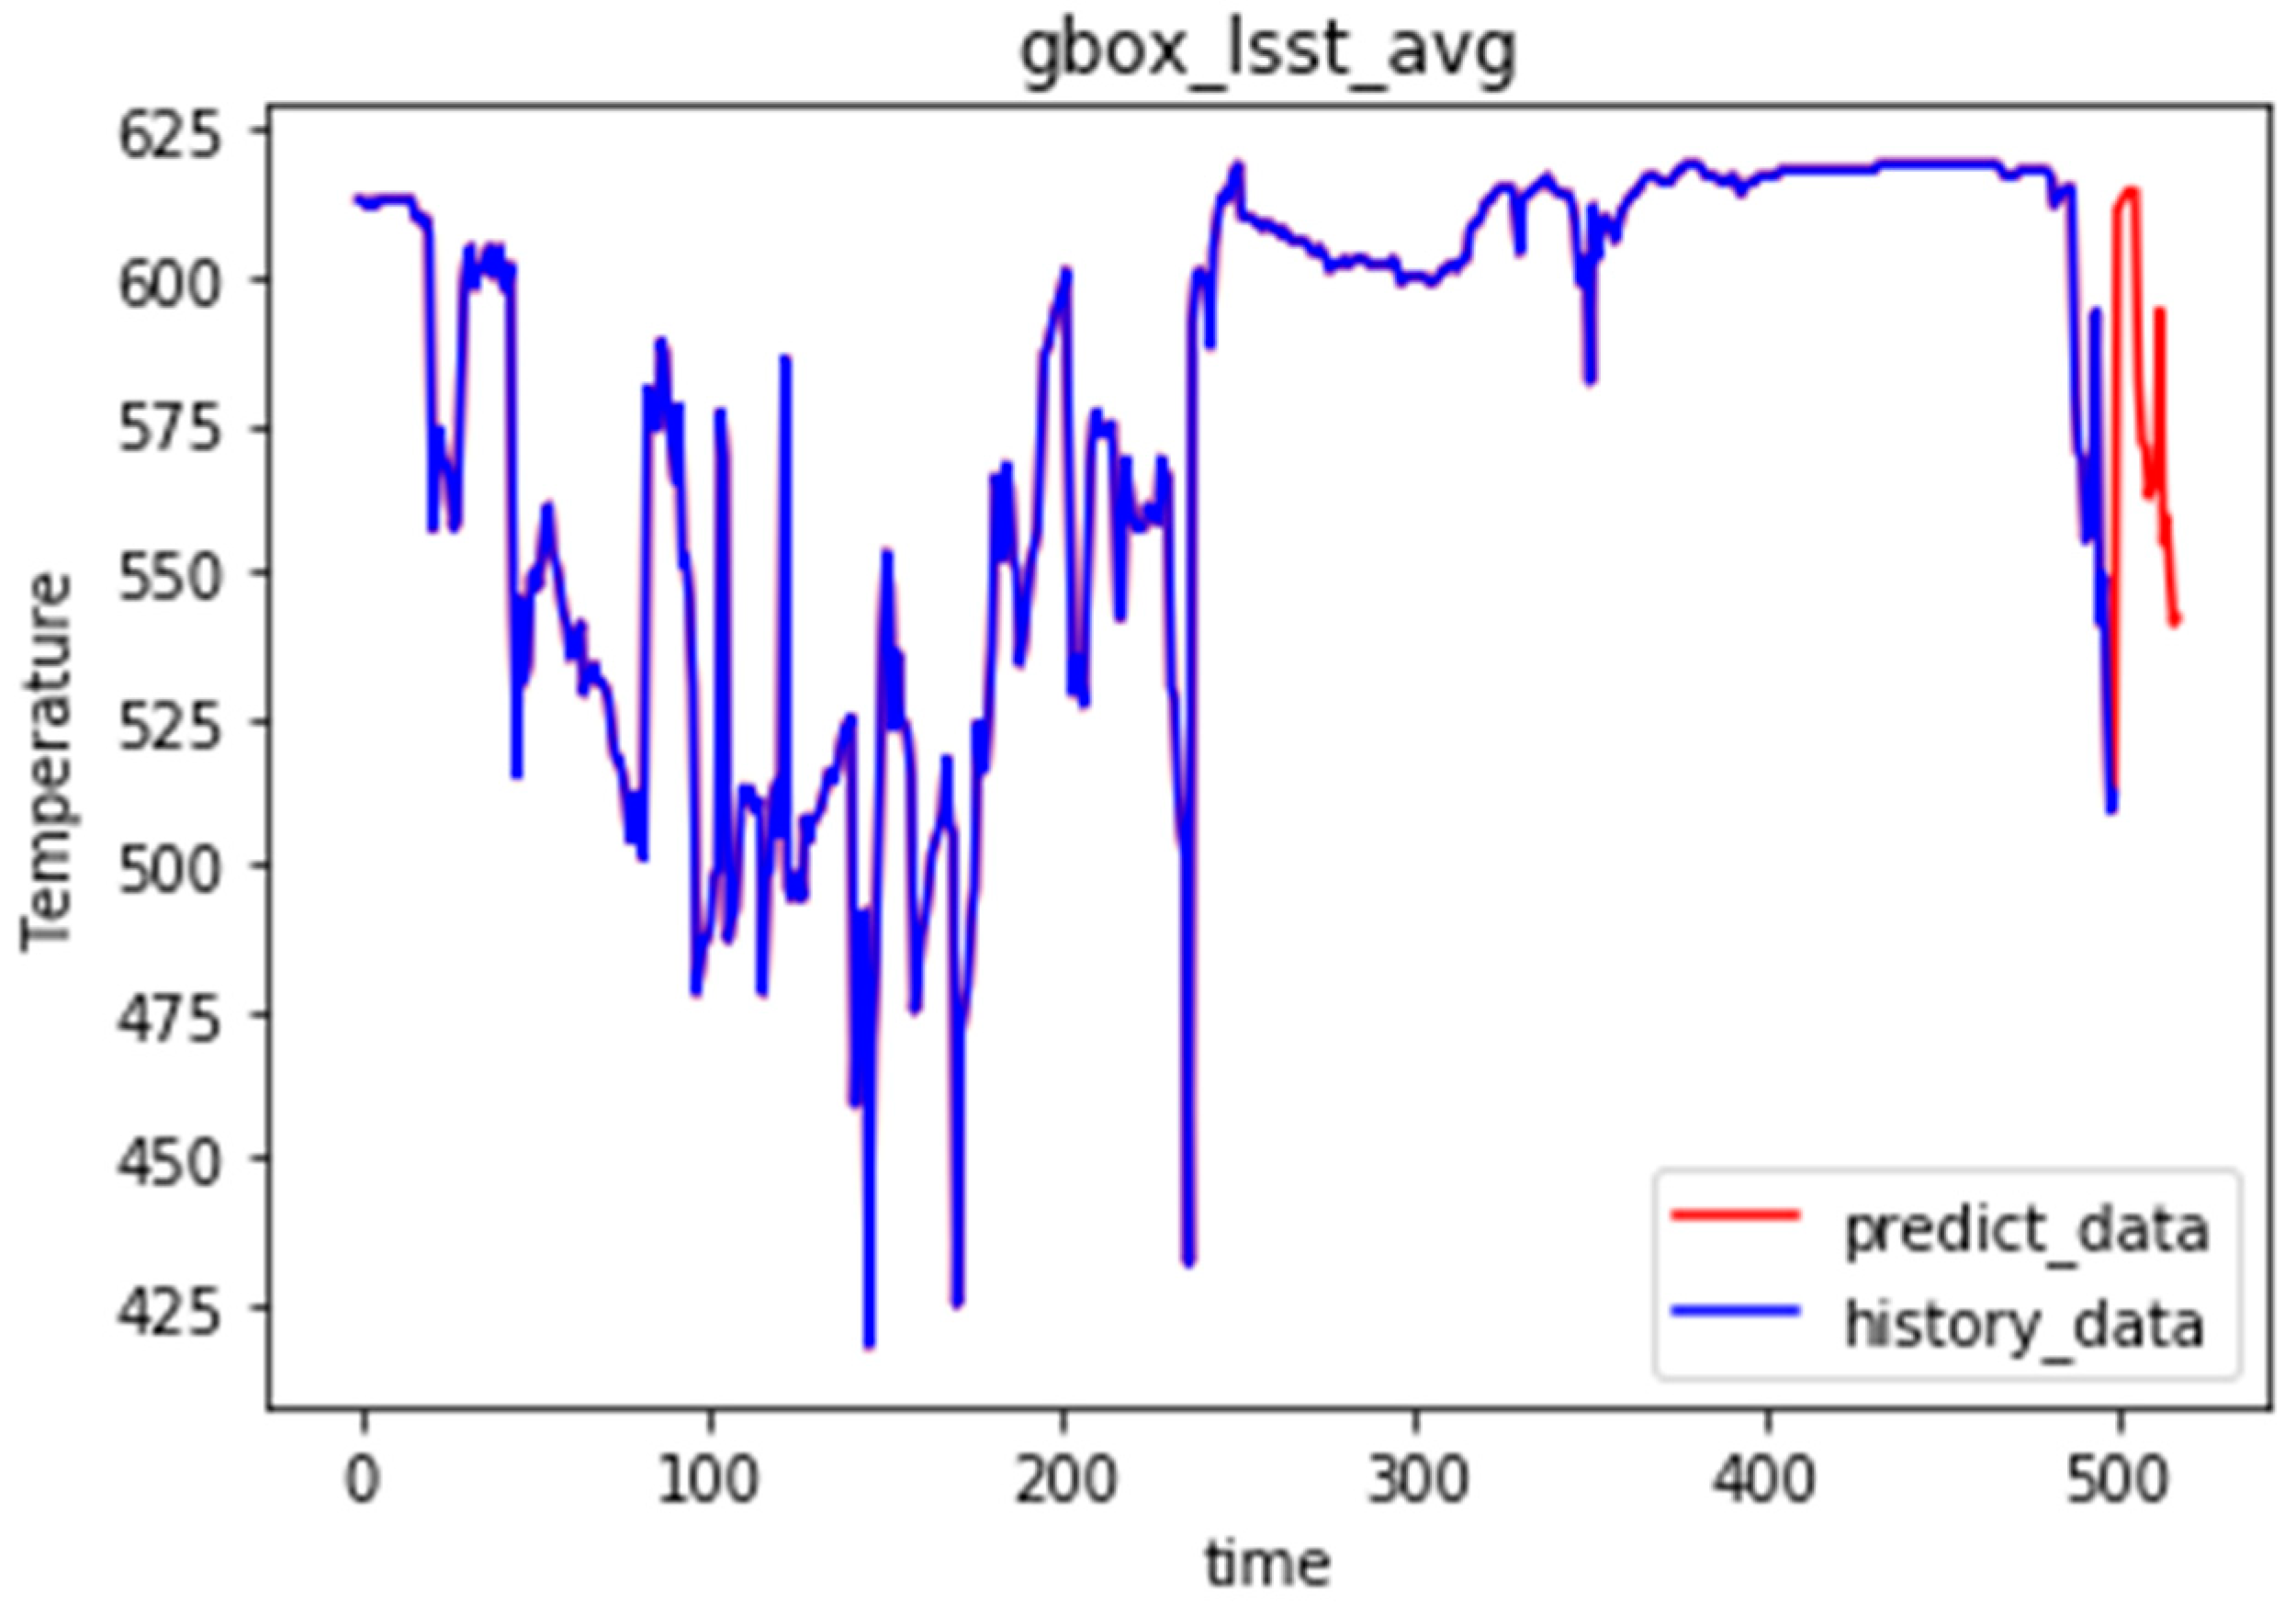
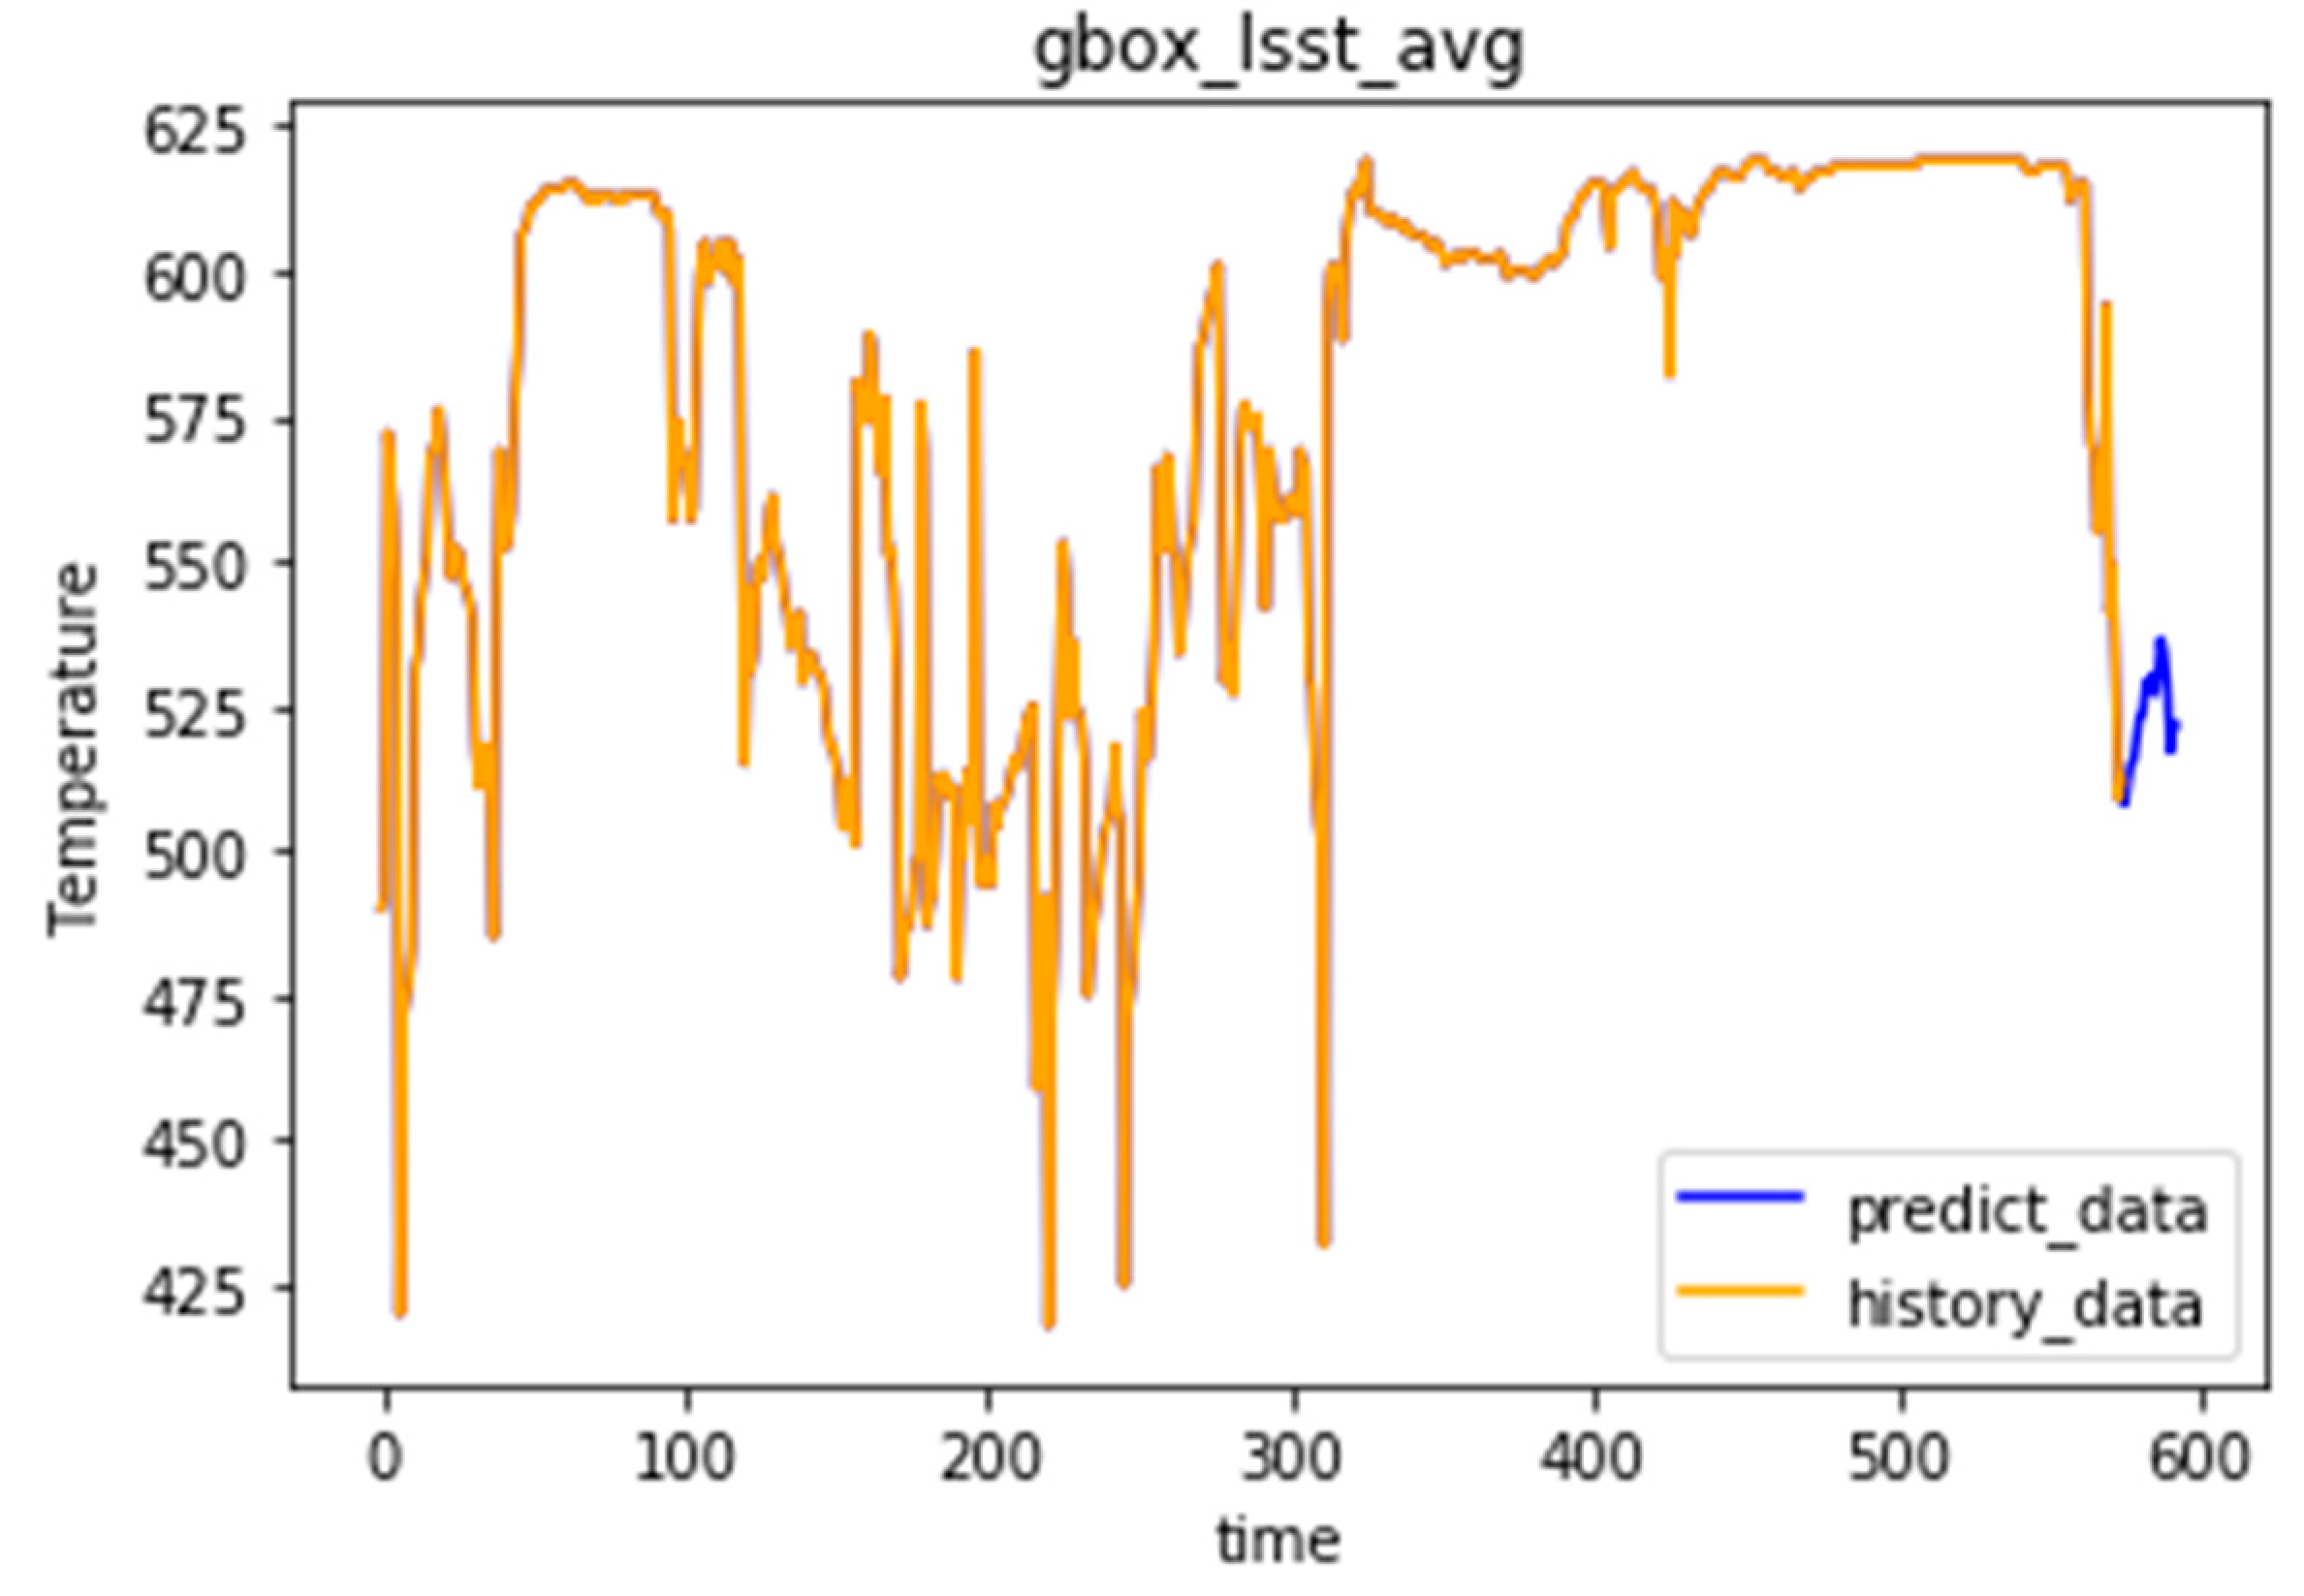
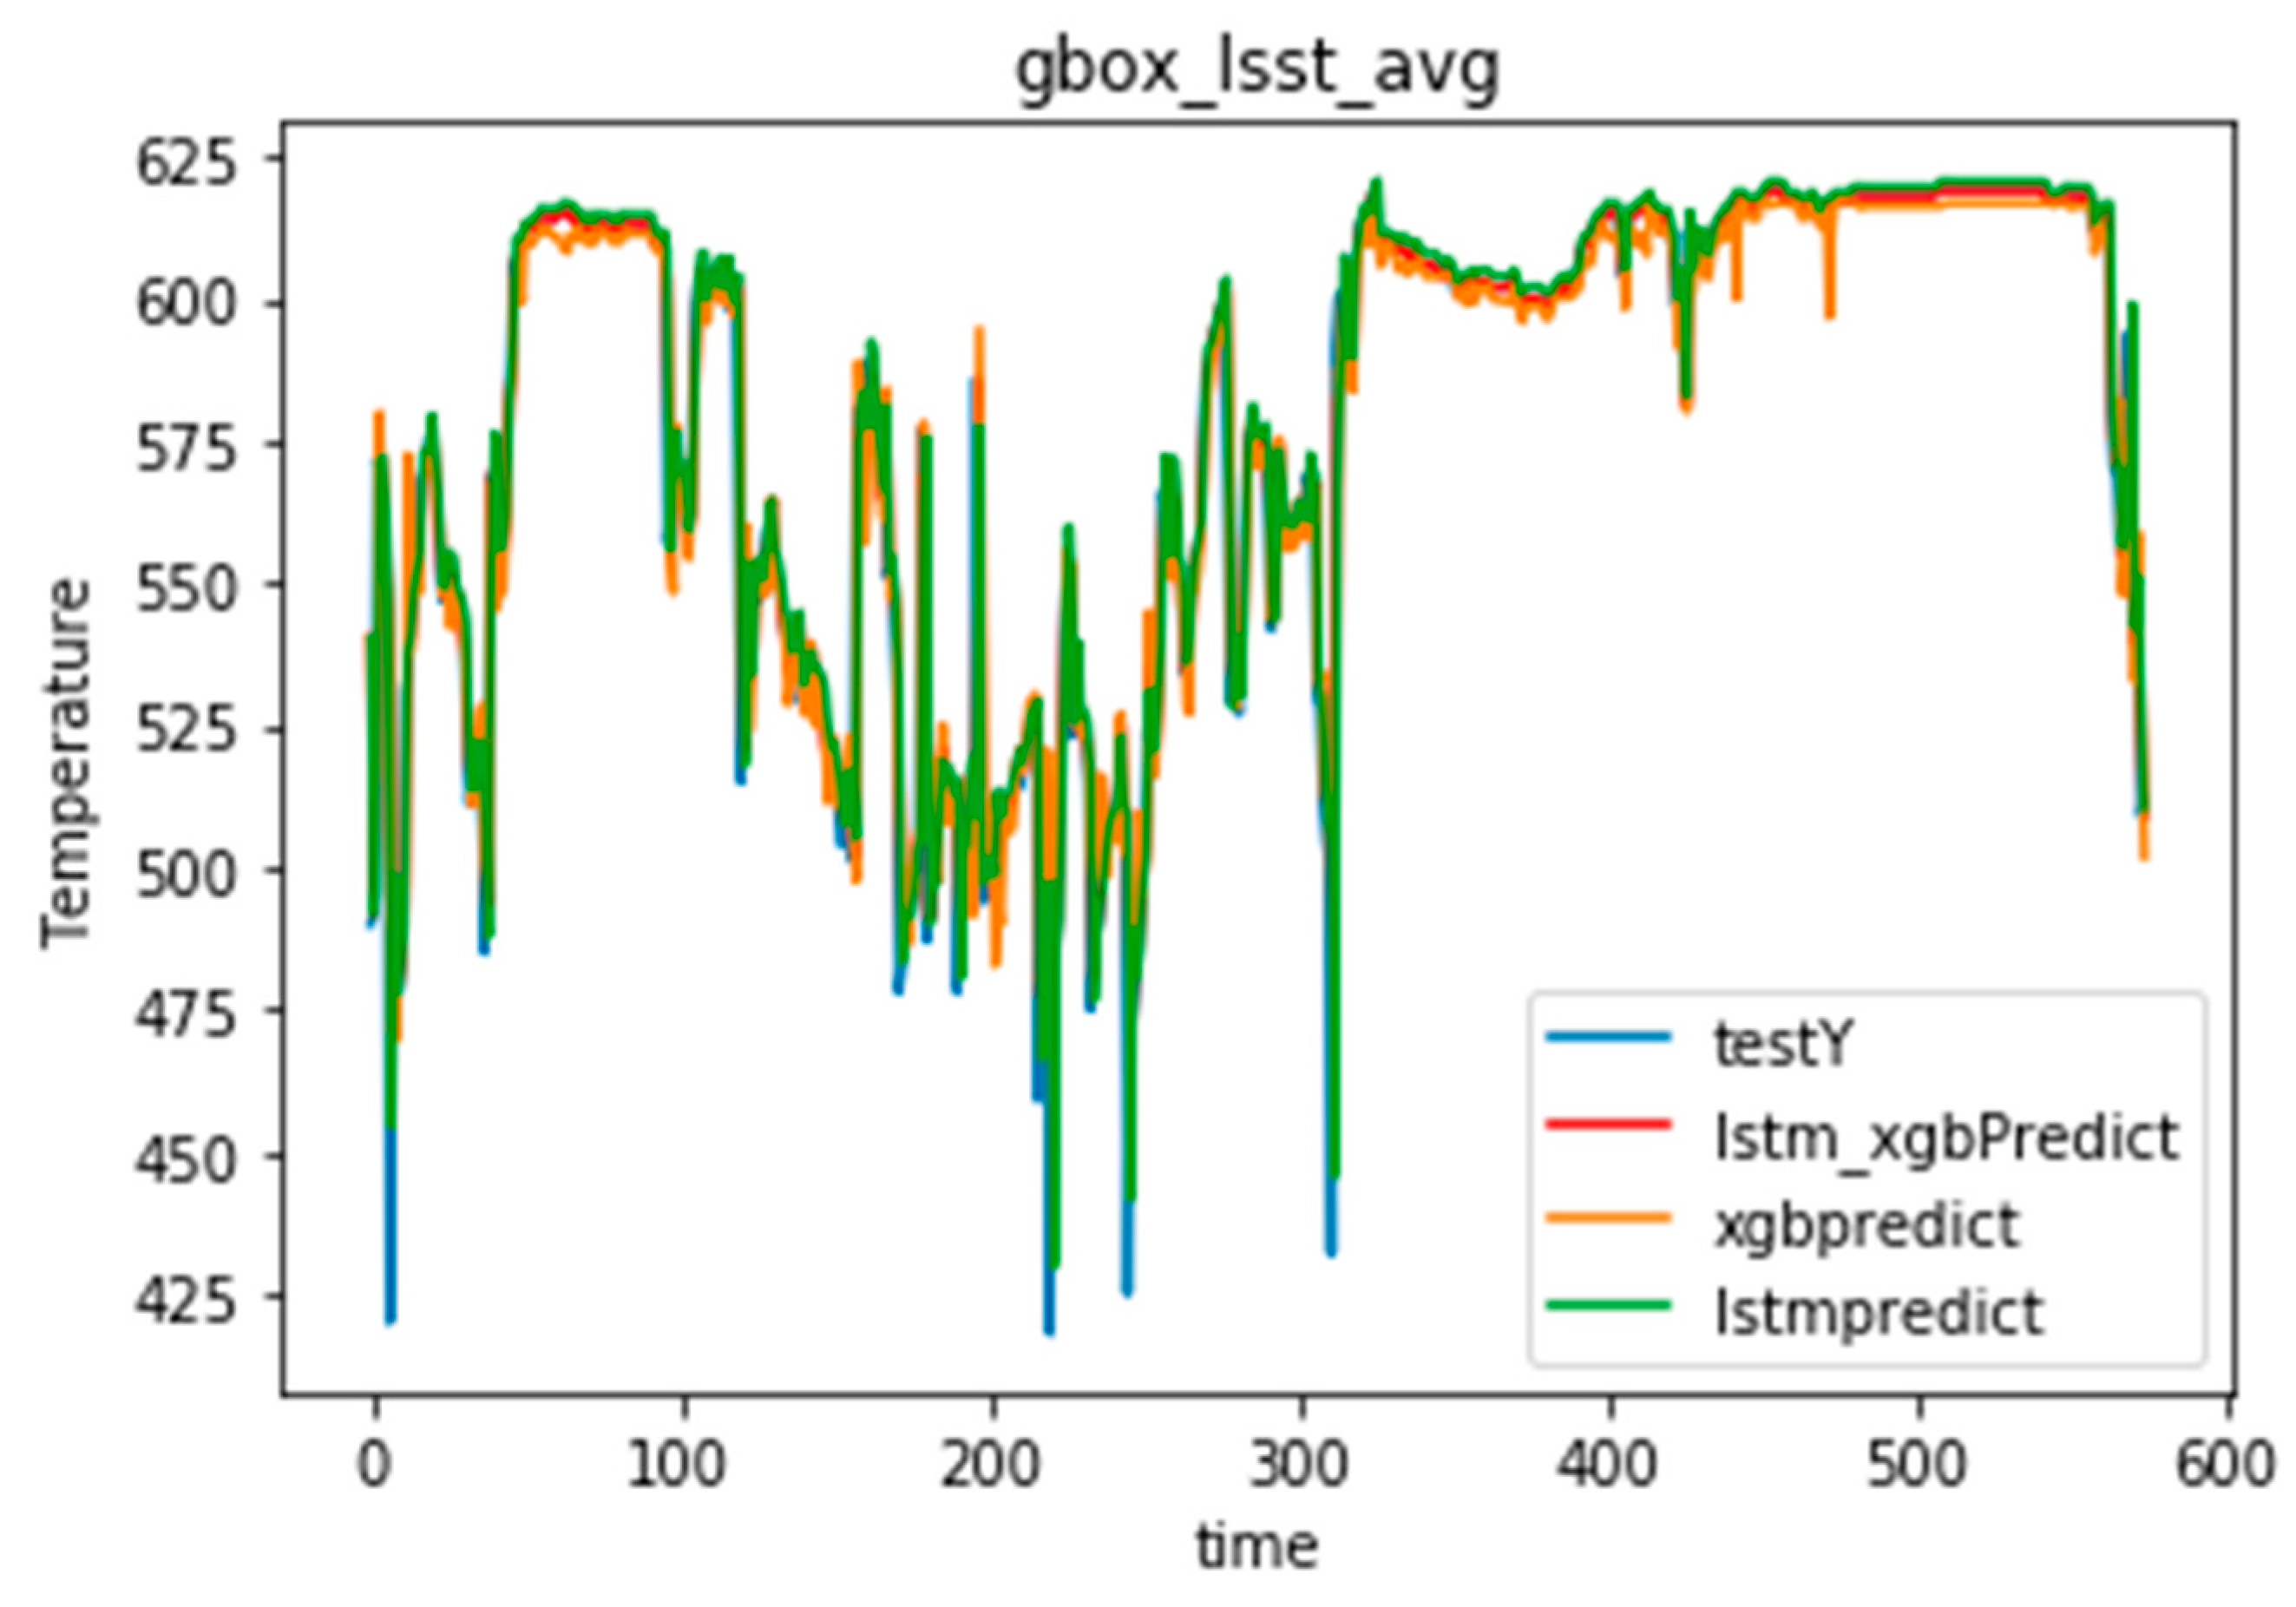
3.2. State Reliability Prediction Evaluation of Wind Turbine System with Improved Algorithm
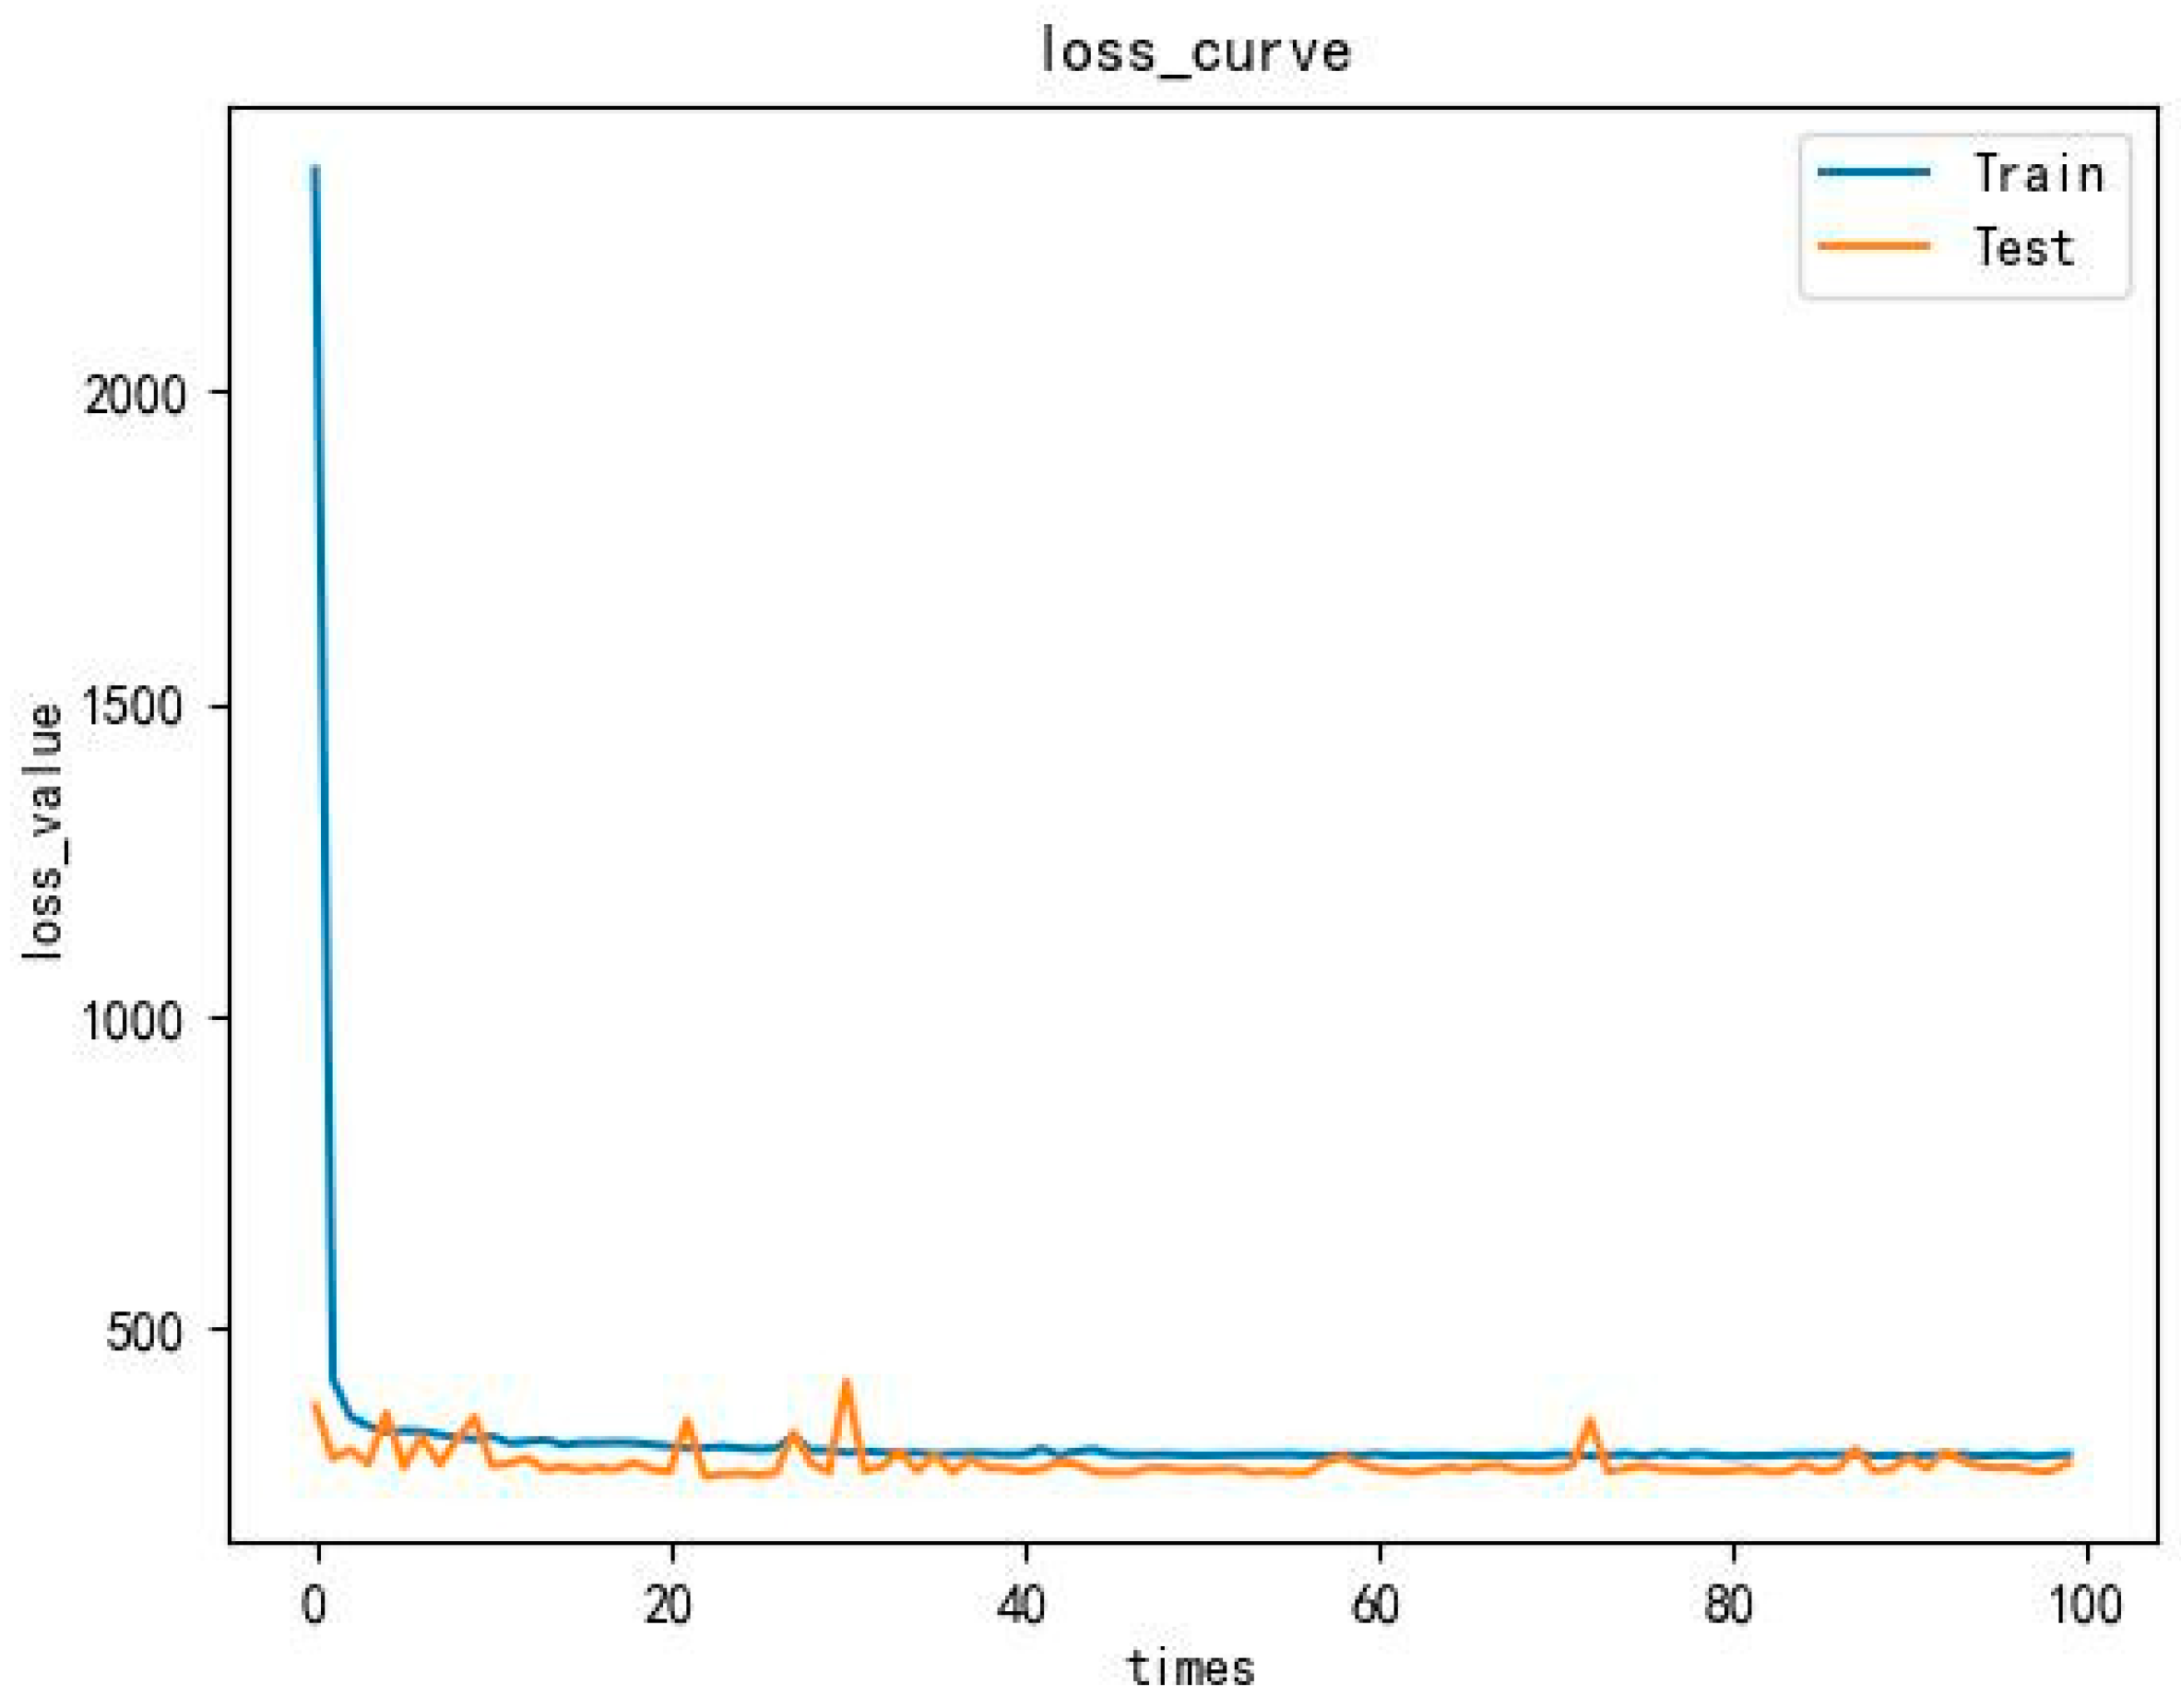
4. Discussion
- (1)
- In the trend of the wind speed–power standard relationship curve, the gearbox high-speed bearing temperature data with better comprehensive performance can be used as the basic data support for system state classification and reliability prediction, which can effectively predict the reliability of wind turbine state for the next 5 h.
- (2)
- Considering the dynamic variability of weights for algorithm fusion under irregular fluctuations in the same parameter over time in nonlinear systems, the improved XGBoost–LSTM fusion model reduces the defects in gradient anomalies, the lack of a priori probability, and overfitting that exist in the individual models. It is verified by the index parameters of RMSE, MAPE, and R2.
- (3)
- The improved XGBoost–LSTM fusion model effectively improves the short-term prediction accuracy compared to that of the LSTM and XGBoost algorithms. The RMSE is reduced by 8.26% and 4.15%, respectively; the MAPE is reduced by 24.56% and 27.99%, respectively; and the goodness-of-fit R2 is closer to 1, which solves the problem of the low accuracy in predicting the state anomaly of the wind turbine system.
- (4)
- In the comparison of the results analyzed using the same dataset in LSTM, XGBoost, and the improved XGBoost–LSTM algorithm, it can be found that the model accuracy of the improved XGBoost–LSTM algorithm has been effectively improved, and the accuracy of the probabilistic assessment of the state reliability of the system has also been improved, which is of great value for improving the reliability of the system.
5. Conclusions
Author Contributions
Funding
Institutional Review Board Statement
Informed Consent Statement
Data Availability Statement
Acknowledgments
Conflicts of Interest
References
- Yuan, B.X.; Chen, W.J.; Li, Z.H.; Zhao, J.; Luo, Q.Z.; Chen, W.W.; Chen, T.Y. Sustainability of the polymer SH reinforced recycled granite residual soil: Properties, physicochemical mechanism, and applications. J. Soils Sediments 2023, 23, 246–262. [Google Scholar] [CrossRef]
- Pathak, A.K.; Sharma, M.P.; Bundele, M. A critical review of voltage and reactive power management of wind farms. Renew. Sustain. Energy Rev. 2016, 51, 460–471. [Google Scholar] [CrossRef]
- Tian, Q.; Huang, G.; Hu, K.M.; Niyogi, D. Observed and global climate model based changes in wind power potential over the Northern Hemisphere during 1979–2016. Energy 2019, 167, 1224–1235. [Google Scholar] [CrossRef]
- Akhtar, I.; Kirmani, S. Error-Based Wind Power Prediction Technique Based on Generalized Factors Analysis with Improved Power System Reliability. IETE J. Res. 2020, 68, 4232–4243. [Google Scholar] [CrossRef]
- Mehrjoo, M.; Jozani, M.J.; Pawlak, M. Wind turbine power curve modeling for reliable power prediction using monotonic regression. Renew. Energy 2020, 147, 214–222. [Google Scholar] [CrossRef]
- Tian, X.G.; Jiang, Y.J.; Liang, C.; Liu, C.; Ying, Y.; Wang, H.; Zhang, D.H.; Qian, P. A Novel Condition Monitoring Method of Wind Turbines Based on GMDH Neural Network. Energies 2022, 15, 6717. [Google Scholar] [CrossRef]
- Liu, W.; Liu, Y.M.; Fu, L.; Yang, M.H.; Hu, R.C.; Kang, Y.P. Wind Power Forecasting Method Based on Bidirectional Long Short-Term Memory Neural Network and Error Correction. Electr. Power Compon. Syst. 2022, 49, 1169–1180. [Google Scholar] [CrossRef]
- Peng, X.S.; Wang, H.Y.; Lang, J.X.; Li, W.Z.; Xu, Q.Y.; Zhang, Z.W.; Cai, T.; Duan, S.X.; Liu, F.J.; Li, C.S. EALSTM-QR: Interval wind-power prediction model based on numerical weather prediction and deep learning. Energy 2021, 220, 119692. [Google Scholar] [CrossRef]
- Ren, G.R.; Wan, J.; Liu, J.F.; Yu, D.R. Spatial and temporal correlation analysis of wind power between different provinces in China. Energy 2020, 191, 116514. [Google Scholar] [CrossRef]
- Wang, Y.; Zhu, C.; Li, Y.; Tan, J. The effect of reduced power operation of faulty wind turbines on the total power generation for different wind speeds. Sustain. Energy Technol. Assess. 2021, 45, 101178. [Google Scholar] [CrossRef]
- Wang, P.; Li, Y.T.; Zhang, G.Y. Probabilistic power curve estimation based on meteorological factors and density LSTM. Energy 2023, 269, 126768. [Google Scholar] [CrossRef]
- Cui, Y.; Chen, Z.H.; He, Y.J.; Xiong, X.; Li, F. An algorithm for forecasting day-ahead wind power via novel long short-term memory and wind power ramp events. Energy 2022, 263, 125888. [Google Scholar] [CrossRef]
- He, Z.S.; Chen, Y.H.; Xu, J. A Combined Model Based on the Social Cognitive Optimization Algorithm for Wind Speed Forecasting. Processes 2022, 10, 689. [Google Scholar] [CrossRef]
- Yu, S.; Vautard, R. A transfer method to estimate hub-height wind speed from 10 meters wind speed based on machine learning. Renew. Sustain. Energy Rev. 2022, 169, 112897. [Google Scholar] [CrossRef]
- Wang, F.; Tong, S.; Sun, Y.Q.; Xie, Y.S.; Zhen, Z.; Li, G.Q.; Cao, C.M.; Duic, N.; Liu, D.G. Wind process pattern forecasting based ultra-short-term wind speed hybrid prediction. Energy 2022, 255, 124509. [Google Scholar] [CrossRef]
- Cai, R.; Xie, S.; Wang, B.Z.; Yang, R.J.; Xu, D.S.; He, Y. Wind Speed Forecasting Based on Extreme Gradient Boosting. IEEE Access 2020, 8, 175063–175069. [Google Scholar] [CrossRef]
- Su, C.Y.; Wu, J.X.; Jiang, G.J.; Zhang, N.; Song, X.W. Uncertainty analysis of wind speed of wind turbine. Qual. Reliab. Eng. Int. 2023, 39, 1814–1830. [Google Scholar] [CrossRef]
- Eryilmaz, S.; Kan, C. Reliability based modeling and analysis for a wind power system integrated by two wind farms considering wind speed dependence. Reliab. Eng. Syst. Saf. 2020, 203, 107077. [Google Scholar] [CrossRef]
- Ren, G.R.; Wan, J.; Liu, J.F.; Yu, D.R.; Soder, L. Analysis of wind power intermittency based on historical wind power data. Energy 2018, 150, 482–492. [Google Scholar] [CrossRef]
- Guo, P.; Infield, D. Wind turbine blade icing detection with multi-model collaborative monitoring method. Renew. Energy 2021, 179, 1098–1105. [Google Scholar] [CrossRef]
- Zheng, H.; Wu, Y.H. A XGBoost Model with Weather Similarity Analysis and Feature Engineering for Short-Term Wind Power Forecasting. Appl. Sci. 2019, 9, 3019. [Google Scholar] [CrossRef]
- Xiong, X.; Guo, X.J.; Zeng, P.L.; Zou, R.L.; Wang, X.L. A Short-Term Wind Power Forecast Method via XGBoost Hyper-Parameters Optimization. Front. Energy Res. 2022, 10, 905155. [Google Scholar] [CrossRef]
- Hanifi, S.; Lotfian, S.; Zare-Behtash, H.; Cammarano, A. Offshore Wind Power Forecasting-A New Hyperparameter Optimisation Algorithm for Deep Learning Models. Energies 2022, 15, 6919. [Google Scholar] [CrossRef]
- Deng, X.; Shao, H.J.; Hu, C.L.; Jiang, D.B.; Jiang, Y.T. Wind Power Forecasting Methods Based on Deep Learning: A Survey. Cmes-Comput. Model. Eng. Sci. 2020, 122, 273–301. [Google Scholar] [CrossRef]
- Bilendo, F.; Meyer, A.; Badihi, H.; Lu, N.Y.; Cambron, P.; Jiang, B. Applications and Modeling Techniques of Wind Turbine Power Curve for Wind Farms—A Review. Energies 2023, 16, 180. [Google Scholar] [CrossRef]
- Peng, X.S.; Li, Y.H.; Dong, L.; Cheng, K.; Wang, H.Y.; Xu, Q.Y.; Wang, B.; Liu, C.; Che, J.F.; Yang, F. Short-Term Wind Power Prediction Based on Wavelet Feature Arrangement and Convolutional Neural Networks Deep Learning. IEEE Trans. Ind. Appl. 2021, 57, 6375–6384. [Google Scholar] [CrossRef]
- Chen, X.J.; Zhang, X.Q.; Dong, M.; Huang, L.S.; Guo, Y.; He, S.Y. Deep Learning-Based Prediction of Wind Power for Multi-turbines in a Wind Farm. Front. Energy Res. 2021, 9, 723775. [Google Scholar] [CrossRef]
- Farah, S.; David, W.A.; Humaira, N.; Aneela, Z.; Steffen, E. Short-term multi-hour ahead country-wide wind power prediction for Germany using gated recurrent unit deep learning. Renew. Sustain. Energy Rev. 2022, 167, 112700. [Google Scholar] [CrossRef]
- Zhou, B.W.; Ma, X.J.; Luo, Y.H.; Yang, D.S. Wind Power Prediction Based on LSTM Networks and Nonparametric Kernel Density Estimation. IEEE Access 2020, 7, 165279–165292. [Google Scholar] [CrossRef]
- Eryilmaz, S.; Devrim, Y. Theoretical derivation of wind plant power distribution with the consideration of wind turbine reliability. Reliab. Eng. Syst. Saf. 2019, 185, 192–197. [Google Scholar] [CrossRef]
- Philippe, W.P.J.; Zhang, S.; Eftekharnejad, S.; Ghosh, P.K.; Varshney, P.K. Mixed Copula-Based Uncertainty Modeling of Hourly Wind Farm Production for Power System Operational Planning Studies. IEEE Access 2020, 8, 138569–138583. [Google Scholar] [CrossRef]
- Pandit, R.K.; Infield, D.; Kolios, A. Comparison of advanced non-parametric models for wind turbine power curves. IET Renew. Power Gener. 2019, 13, 1503–1510. [Google Scholar] [CrossRef]
- Park, B.; Hur, J. Accurate Short-Term Power Forecasting of Wind Turbines: The Case of Jeju Island’s Wind Farm. Energies 2017, 10, 812. [Google Scholar] [CrossRef]
- Deng, K.; Song, L.K.; Bai, G.C.; Li, X.Q. Improved Kriging-based hierarchical collaborative approach for multi-failure dependent reliability assessment. Int. J. Fatigue 2022, 160, 106842. [Google Scholar] [CrossRef]
- Shi, Y.L.; Liu, Y.R.; Gao, X. Study of Wind Turbine Fault Diagnosis and Early Warning Based on SCADA Data. IEEE Access 2021, 9, 124600–124615. [Google Scholar] [CrossRef]
- Zhang, C.; Hu, D.; Yang, T. Anomaly detection and diagnosis for wind turbines using long short-term memory-based stacked denoising autoencoders and XGBoost. Reliab. Eng. Syst. Saf. 2022, 222, 108445. [Google Scholar] [CrossRef]
- Kong, X.; Fu, Y.; Wang, Q.; Ma, H.; Wu, X.; Mao, G. A high generalizable feature extraction method using ensemble learning and deep auto-encoders for operational reliability assessment of bearings. Neural Process. Lett. 2020, 51, 383–406. [Google Scholar] [CrossRef]
- Yao, Q.T.; Li, X.Z.; Xiang, L.; Hu, A.J.; Hankun, B. A new condition-monitoring method based on multi-variable correlation learning network for wind turbine fault detection. Meas. Sci. Technol. 2023, 34, 024009. [Google Scholar] [CrossRef]
- Zhang, D.M.; Yuan, J.; Zhu, J.; Ji, Q.C.; Zhang, X.T.; Liu, H. Fault Diagnosis Strategy for Wind Turbine Generator Based on the Gaussian Process Metamodel. Math. Probl. Eng. 2020, 2020, 4295093. [Google Scholar] [CrossRef]
- Phan, Q.T.; Wu, Y.K.; Phan, Q.D. A Hybrid Wind Power Forecasting Model with XGBoost, Data Preprocessing Considering Different NWPs. Appl. Sci. 2021, 11, 1100. [Google Scholar] [CrossRef]
- Chatterjee, J.; Dethlefs, N. Deep learning with knowledge transfer for explainable anomaly prediction in wind turbines. Wind. Energy 2020, 23, 1693–1710. [Google Scholar] [CrossRef]
- Udo, W.; Muhammad, Y. Data-Driven Predictive Maintenance of Wind Turbine Based on SCADA Data. IEEE Access 2021, 9, 162370–162388. [Google Scholar] [CrossRef]
- Wakjira, T.G.; Ibrahim, M.; Ebead, U.; Alam, M.S. Explainable machine learning model and reliability analysis for flexural capacity prediction of RC beams strengthened in flexure with FRCM. Eng. Struct. 2022, 255, 113903. [Google Scholar] [CrossRef]
- Wakjira, T.G.; Alam, M.S. Peak and ultimate stress-strain model of confined ultra-high-performance concrete (UHPC) using hybrid machine learning model with conditional tabular generative adversarial network. Appl. Soft Comput. 2024, 154, 111353. [Google Scholar] [CrossRef]


| Time | Generator Speed | Gearbox Low-Speed Bearing Temperature | Gearbox Oil Pressure | Gearbox Inlet Oil Temperature | Grid Current | Wind Turbine Rotation Speed |
|---|---|---|---|---|---|---|
| 1 | 495 | 105 | 1 | 26 | 64 | 46 |
| 2 | 13,134 | 395 | 67 | 50 | 2030 | 132 |
| 3 | 12,107 | 405 | 61 | 73 | 1480 | 125 |
| 4 | 12,145 | 403 | 60 | 79 | 1586 | 132 |
| 5 | 11,246 | 396 | 56 | 74 | 952 | 114 |
| 6 | 11,954 | 381 | 57 | 74 | 1453 | 125 |
| 7 | 11,669 | 376 | 55 | 71 | 1352 | 119 |
| 8 | 6489 | 359 | 33 | 124 | 275 | 104 |
| 9 | 8651 | 355 | 43 | 71 | 624 | 109 |
| 10 | 11,933 | 346 | 56 | 108 | 1334 | 132 |
| … | … | … | … | … | … | … |
| … | … | … | … | … | … | … |
| … | … | … | … | … | … | … |
| n | 11,634 | 491 | 44 | 361 | 1046 | 125 |
| Xrms | Ku | |||
|---|---|---|---|---|
| Generator speed | 10,521.7620 | 41,960,495.0503 | 6477.6922 | −1.0436 |
| Gearbox low-speed bearing temperature | 504.6761 | 9946.0789 | 99.7300 | 0.9723 |
| Gearbox oil pressure | 39.6961 | 159.9260 | 12.6462 | 3.2665 |
| Gearbox inlet oil temperature | 288.1725 | 12,941.4651 | 113.7606 | −0.7909 |
| Grid current | 2891.4333 | 12,926,206.1303 | 3595.3033 | 0.7805 |
| Wind turbine rotation speed | 104.5015 | 3774.7921 | 61.4393 | −0.8912 |
| Parameter | Value | Parameter | Value |
|---|---|---|---|
| dropout_rate | 0.295 | neurons | 150 |
| num_layers | 2 | learning_rate | 0.0002 |
| Parameter | Value | Parameter | Value |
|---|---|---|---|
| learning_rate | 0.008 | Lambda | 0.002 |
| Alpha | 0.017 | max_depth | 15 |
| Gamma | 1 | min_child_weight | 7 |
| Subsample | 0.6 | colsample_bytree | 0.6 |
| Algorithms | Training Set | Test Set | ||||
|---|---|---|---|---|---|---|
| RMSE | MAPE | R2 | RMSE | MAPE | R2 | |
| LSTM | 16.677 | 1.391 | 0.8664 | 16.970 | 1.422 | 0.8087 |
| XGBoost | 15.961 | 1.457 | 0.8776 | 16.033 | 1.415 | 0.8293 |
| XGBoost–LSTM | 15.299 | 1.049 | 0.8875 | 15.836 | 1.297 | 0.8337 |
Disclaimer/Publisher’s Note: The statements, opinions and data contained in all publications are solely those of the individual author(s) and contributor(s) and not of MDPI and/or the editor(s). MDPI and/or the editor(s) disclaim responsibility for any injury to people or property resulting from any ideas, methods, instructions or products referred to in the content. |
© 2024 by the authors. Licensee MDPI, Basel, Switzerland. This article is an open access article distributed under the terms and conditions of the Creative Commons Attribution (CC BY) license (https://creativecommons.org/licenses/by/4.0/).
Share and Cite
Gou, L.; Zhang, J.; Wen, L.; Fan, Y. State Reliability of Wind Turbines Based on XGBoost–LSTM and Their Application in Northeast China. Sustainability 2024, 16, 4099. https://doi.org/10.3390/su16104099
Gou L, Zhang J, Wen L, Fan Y. State Reliability of Wind Turbines Based on XGBoost–LSTM and Their Application in Northeast China. Sustainability. 2024; 16(10):4099. https://doi.org/10.3390/su16104099
Chicago/Turabian StyleGou, Liming, Jian Zhang, Lihao Wen, and Yu Fan. 2024. "State Reliability of Wind Turbines Based on XGBoost–LSTM and Their Application in Northeast China" Sustainability 16, no. 10: 4099. https://doi.org/10.3390/su16104099
APA StyleGou, L., Zhang, J., Wen, L., & Fan, Y. (2024). State Reliability of Wind Turbines Based on XGBoost–LSTM and Their Application in Northeast China. Sustainability, 16(10), 4099. https://doi.org/10.3390/su16104099