Article

Embodied Energy Coefficient Quantification and Implementation for an Energy-Conservative House in Thailand

by
Nattaya Sangngamratsakul
1,*,
Kuskana Kubaha
1 and
Siriluk Chiarakorn
2
1
Energy Management Technology Program, School of Energy, Environment and Materials, King Mongkut’s University of Technology Thonburi, 126 Pracha Uthit Rd., Bang Mod, Thung Khru, Bangkok 10140, Thailand
2
Environmental Technology Program, School of Energy, Environment and Materials, King Mongkut’s University of Technology Thonburi, 126 Pracha Uthit Rd., Bang Mod, Thung Khru, Bangkok 10140, Thailand
*
Author to whom correspondence should be addressed.
Sustainability 2024, 16(10), 4045; https://doi.org/10.3390/su16104045
Submission received: 7 April 2024 / Revised: 4 May 2024 / Accepted: 8 May 2024 / Published: 12 May 2024

Abstract

:
The increasing rate of population growth and urban expansion has led to a higher demand for fossil fuels, which, in turn, directly generate greenhouse gas emissions into the atmosphere. These emissions contribute to environmental problems such as global warming and climate change. This study aims to present the total life-cycle energy analysis (LCEA) of a single-family detached house designed with an energy conservation approach. Using a cradle-to-grave scope, this study quantifies the embodied energy in six stages of the building’s life cycle, i.e., initial, transportation, construction, operational, recurrent, and demolition. An input–output (IO)-based method was employed to construct a Thailand-specific embodied energy coefficient for 36 key building materials. This coefficient was then used to quantify both the initial embodied energy and the recurrent embodied energy in this study. The case-study house was broken down into 13 building materials. Concrete was the most consumed material, followed by fiber–cement, steel, and timber, in that order. However, the results of the embodied energy distribution for these materials revealed that fiber–cement ranked first, accounting for 29%. Steel was next, at 21%, followed by concrete at 18%, and, finally, aluminum at 12%. The case-study house had an initial embodied energy of 7.99 GJ/m² and a total life-cycle energy consumption of 0.66 GJ/m²/year. This study provides valuable information on LCEA for residential buildings, fostering public understanding of energy conservation in the Thai context. Furthermore, this study’s results can be applied to establish energy conservation guidelines for residential buildings. These guidelines can help reduce energy resource depletion, carbon emissions, and environmental problems, ultimately contributing to Thailand’s goal of achieving carbon neutrality by 2050.

1. Introduction

The increasing rate of population growth and expansion of urbanization is estimated to reach 68% by 2050, leading to greater energy demand across all sectors [1]. The construction sector alone accounts for 36% of global energy consumption [1]. Increased energy demands can lead to a higher amount of fossil fuels being needed for energy generation, industrial use to produce goods, and residential use. As is well known, the use of fossil fuels for energy generation releases greenhouse gas emissions into the atmosphere, making it a key factor in environmental problems such as global warming, climate change, ice melting, rising sea levels, and ecological damage. According to the United Nations Environment Programme (UNEP), in 2020, the global construction sector was responsible for 37% of total global carbon dioxide (CO2) emissions. This can be broken down into two main stages, i.e., the operational stage of buildings (27%) and the production stage of building materials (10%) [2]. Research on the life-cycle carbon emissions of residential buildings has found that CO2 emissions are highest during the use phase, followed by the building materials’ production phase [3]. All countries around the world are aware of the importance of these environmental issues. Thailand made a commitment to work towards environmental sustainability by announcing its intention to become carbon-neutral by 2050 at the 26th United Nations Climate Change Conference (COP26). The concept of carbon neutrality refers to the attempt to balance carbon dioxide emissions with the amount removed from the atmosphere, achieved through reducing emissions and carbon offsetting. In Thailand, efforts to reduce carbon emissions are particularly focused on the residential sector, where energy consumption is continuously rising. The data on electricity consumption in 2022 reveal a significant impact of the residential sector, accounting for 27%—the second-largest share of electricity after the industrial sector, at 44.9% [4]. Furthermore, the data show that the projected residential demand in 2037 is 28%, highlighting the growing impact of this sector [5]. These statistical reports indicate the critical need to reduce energy consumption and provide energy efficiency in the residential sector in order to achieve carbon neutrality by 2050.
Reducing energy consumption during the operational phase is a key factor in achieving energy conservation goals for the residential sector. This is because operational energy accounts for a significant portion of a building’s total energy consumption throughout its lifetime [6,7]. Operational energy can be minimized by reducing energy usage across various activities and systems within the building. These include heating, cooling, lighting, ventilation, appliances, and electronic devices [8,9,10]. Efforts to reduce energy consumption by focusing on operational energy have led to the development of low-energy building designs involving the installation of advanced technologies and highly efficient building materials to minimize the building’s energy use. However, while efforts are focused on reducing operational energy in buildings, another type of indirect energy called ‘embodied energy’ is gradually increasing. Embodied energy refers to the energy used for the processes of extracting raw materials, transportation of materials to the manufacturer, and production and demolition of those materials. Embodied energy can be divided into two main categories, i.e., initial embodied energy (IEE) and recurrent embodied energy (REE). IEE includes the energy used for material extraction (cradle-), transportation to the manufacturing site, and manufacturing itself (-to-gate) [8,9,10]. Meanwhile, REE accounts for the energy expended during building maintenance, repairs, replacements, and refurbishments over time, which is influenced by the building’s lifespan and the durability of its materials. Several studies have found that the proportion of embodied energy is rising, particularly in energy-efficient buildings [11,12,13,14]. For example, research has shown that low-energy buildings generally consume less operational energy compared to conventional buildings [15]. However, these low-energy buildings often require more energy-intensive materials and construction processes, leading to a higher proportion of embodied energy [16,17]. Studies suggest that embodied energy can range from 2 to 38% in conventional buildings and from 9 to 46% in low-energy buildings [15]. Some reports indicate proportions of embodied energy as high as 60% [18]. The embodied energy of a building can be significant, equivalent to up to 15 years of operational energy use over its lifespan [9] and 20–50 times the annual operational energy consumption [19]. In low-energy houses, operational energy consumption is reducing, but embodied energy can be increased by up to half of the total life-cycle energy use [20]. This higher embodied energy is often due to the use of additional building materials to reduce operational energy. Therefore, to achieve true energy conservation and reduce the environmental impact, it is crucial to consider energy consumption throughout a building’s entire life cycle. This can be accomplished by quantifying both operational energy and embodied energy.
Enhancing energy efficiency in residential buildings in Thailand is crucial to reducing carbon emissions and achieving carbon neutrality. The Ministry of Energy launched a prototype for an energy-conservative house design, available for public access [21]. This initiative aims to provide a bill of quantities for energy-conservative house design, hoping to arouse interest and encourage the public to use it for the construction of their own homes. Additionally, Thailand projects a target for primary operational energy consumption in single-family detached houses to reach 0.17 GJ/m²/year by 2032 [22]. However, the current energy conservation policies in Thailand primarily focus on reducing operational energy. This approach neglects other stages of a building’s life cycle, such as embodied energy. Ignoring this crucial aspect can hinder the achievement of future sustainability goals. Therefore, life-cycle energy analysis (LCEA), which is a subset of life-cycle assessment (LCA), should be employed to quantify the total energy consumption throughout a building’s lifespan.
Life-cycle assessment (LCA) is a comprehensive approach to analyzing the ‘cradle-to-grave’ environmental footprint of a product, process, or activity, including everything from material extraction and production to use and final disposal or recycling [23,24]. LCA was established by the International Organization for Standardization (ISO); the ISO 14040 framework provides guidelines for conducting LCA studies [25]. In the building sector, LCA has been used since 1990 to assess the environmental impact of building materials, construction processes, and the entire life cycle of buildings [17,26,27,28]. LCA consists of the following four key steps: First, the definition of the goal and scope provides a clear outline of the purpose and establishes the boundaries of the assessment. The second step, life-cycle inventory (LCI) analysis, gathers an inventory of all inputs and outputs associated with the building’s life cycle, including data on energy consumption and material use. Life-cycle impact assessment (LCIA) translates the potential environmental impacts into meaningful indicators. Finally, the interpretation utilizes the data to provide meaningful conclusions [24,25].
LCEA is used to determine the total energy consumption across the building’s entire life cycle [8,29,30]. The European standard ‘Sustainability of construction works—Assessment of environmental performance of buildings—Calculation method’ (EN 15978) provides a clear framework of system boundaries by dividing the building’s life cycle into the following five stages: building material production, construction, use (occupied and operational), end-of-life (demolition and disposal), and a potential reuse, recovery, and recycling stage beyond the system boundaries [31]. Each stage can be further subdivided to provide a better understanding of the system’s boundaries. The LCEA of residential buildings has been explored in various studies, with each defining its system boundaries according to specific research goals. Cradle-to-grave scopes have been employed by some studies to quantify the total energy consumption from raw material extraction to demolition [32,33]. However, other research has excluded demolition energy due to its relatively small contribution, typically ranging from 1% to 3.5% [7] or from 0.1% to 1% [32]. In such cases, demolition energy can be estimated as 3% of the total initial embodied energy [33]. Some studies focus solely on the three main stages of LCEA, i.e., initial, recurrent, and operational energy. These studies, often examining low-energy buildings, aim to understand the impact of energy consumption from building materials (initial and recurrent stages) and operational energy. They may compare energy efficiency after implementing energy-saving measures within buildings [29,34]. Other research prioritizes quantifying only the initial embodied energy and operational energy, justifying this approach based on the minimal energy contribution of other stages [12]. Additionally, some studies concentrate solely on embodied energy to analyze the energy embedded within building materials [35,36].
However, research suggests that the initial embodied energy (IEE) receives the most attention from scholars among the other stages of LCEA. This may arise from two factors, i.e., IEE consumes a significantly larger amount of energy compared to other embodied energy types, and it can be used to assess the impact of building materials on the embodied energy of a building design. Concrete, for instance, accounts for the largest share of building materials by quantity (around 65–75%) [32]. However, its embodied energy contribution is only 19–23%. Conversely, research in Hong Kong [35] found that while concrete is the most widely used material, steel and aluminum rank first and second in terms of embodied energy, respectively. Valuable insights can be gained from quantifying the initial embodied energy.
Three main methods are used for quantifying IEE, i.e., process-based, IO-based, and hybrid analysis. The first method, process-based analysis, is a traditional and widely accepted approach due to its ability to provide accurate results. This method meticulously tracks energy inputs backwards throughout the supply chain, starting from material extraction and continuing to each subsequent stage. However, a significant limitation of this method is the potential unavailability of data at the upstream stages, leading to incomplete results [37,38,39]. Despite this limitation, some researchers [7,32] choose the process-based method because it offers a bottom-up approach that can provide detailed information. The second method, IO-based analysis, overcomes the data limitation of the process-based method by utilizing economic input–output data to estimate energy consumption across various industries. While this method offers comprehensive results and completes the system boundaries, it may provide inaccurate results due to data aggregation [37,38,39]. However, several researchers choose this method for its ability to provide comprehensive results and eliminate truncation errors associated with the process-based method [29,36,40]. The third method, the hybrid method, combines the strengths of both previous methods to deliver more comprehensive and accurate results [19,37,39,41]. Additionally, some research quantifies IEE by collecting embodied energy coefficient values from published databases [33,34,35,42]. For instance, research from Hong Kong [35] utilized the Inventory of Carbon and Energy (ICE) database developed by Hammond and Jones (University of Bath). This database draws on data from the British Isles, Europe, and global averages to construct embodied energy values [43]. The justification for using this approach is that while embodied energy coefficients can vary significantly between countries, data may not be readily available for many regions, including China, Malaysia, and Thailand. Therefore, it becomes necessary to use embodied energy from various sources. Researchers in New Zealand employed embodied energy coefficients reported by Baird G. [44]—a database of embodied energy coefficients developed in New Zealand using the process-based method. Stephan A.’s research [34] quantified the initial embodied energy of a Belgian house using embodied energy coefficients from an Australian database developed through an IO-based hybrid method [45,46,47]. The reasoning behind this choice was that most embodied energy databases in Europe rely on the IO-based hybrid method, which may be insufficient. However, this research emphasized that using embodied energy data from different locations requires caution. While these databases can provide valuable information, it is crucial to be aware of the limitations and variations associated with using embodied energy coefficients. When using these resources, factors such as system boundaries, energy type (primary or secondary), methodology (process-based, input–output, etc.), data source and age, and any limitations reported by the authors should be critically considered [10]. Furthermore, using data from different countries requires caution due to variations in climate zones, energy sources, production technology, and raw material quality [9]. Inappropriate use of embodied energy coefficients can lead to inaccurate results [34].
Building on previous research, this study recognizes the importance of quantifying IEE alongside defining the system boundaries for a building’s LCEA. As mentioned above, using embodied energy coefficients from different locations can introduce errors, and Thailand currently lacks its own embodied energy database. Therefore, this research developed a Thailand-specific embodied energy database using the IO-based method within a cradle-to-gate scope. The IO-based method was chosen for this study because Thailand has insufficient data on energy consumption for the process-based method. However, Thailand does have readily available data on economic input–output tables. Additionally, the hybrid approach was deemed impractical due to the lack of process data in Thailand. In this context, the IO-based method appears to be the most suitable approach for developing embodied energy coefficients. The developed embodied energy database will be made publicly accessible for scholars, practitioners, and building designers to consider the embodied energy impact of various building materials. Subsequently, this research employed the LCEA framework to quantify the total energy consumption of a single-family detached house. The cradle-to-grave scope encompasses all six stages of the house’s life cycle, i.e., initial, transportation, construction, operational, recurrent, and demolition. Notably, the Thailand-specific embodied energy coefficients were applied to quantify both the initial embodied energy and the recurrent embodied energy.
The aims of this research are as follows:
  • Develop a Thailand-specific embodied energy database for 36 key building materials using the IO-based method within a cradle-to-gate scope.
  • Quantify the total energy consumption of a single-family detached house using the LCEA framework within a cradle-to-grave scope, encompassing six stages, i.e., initial, transportation, construction, operational, recurrent, and demolition. The Thailand-specific embodied energy database was applied to quantify both initial and recurrent embodied energy.
This study has the potential to provide valuable information that can guide appropriate energy conservation strategies in the Thai residential building sector. Ultimately, this research contributes to reducing energy depletion and supports Thailand’s goal of achieving carbon neutrality by 2050.

2. Methods and Data

2.1. Quantifying the Embodied Energy Coefficients of Thailand’s Building Materials

There are three main methods for calculating the embodied energy coefficients of building materials. However, based on the available data sources in Thailand, the IO-based method appears to be the most suitable approach for quantifying embodied energy coefficients. Although the IO-based method was the primary method used in this research, the direct energy consumption of eight building materials was also measured and used to determine embodied energy through a hybrid approach. After that, GAP analysis was employed to determine the difference between the results obtained from the process-based method and the hybrid method.

2.1.1. IO-Based Method for Quantifying Embodied Energy Coefficient

The IO-based method is considered to be the most appropriate method to quantify embodied energy coefficients in Thailand’s building materials. This is due to the ready availability of economic data and the ability to provide comprehensive results while being less data-intensive and time-consuming [37,38,39]. While the process-based method is a traditional and widely used approach for calculating embodied energy, limitations on the availability of energy usage data in Thailand make this method unsuitable due to potential truncation issues. A previously developed guideline, specifically designed to quantify embodied energy in Thailand, was adopted and applied to calculate embodied energy coefficients and, further, to construct a Thailand-specific embodied energy database [48]. The system boundary for the embodied energy of building materials is ‘cradle-to-gate’, which includes the energy consumed in the extraction of raw materials, their transportation to the manufacturing site, and the manufacturing of the building materials. This framework is generally used to quantify embodied energy because it directly describes the amount of energy embedded in each material, enabling comparisons of the energy consumption impact. Thailand’s input–output table, consisting of 180 × 180 industry sectors developed by the Office of the National Economic and Social Development Council in 2015, was applied in this study [49]. The purpose of input–output tables is to analyze the relationships between industry sectors and to show how much of each industry’s products are needed by other industries.
Input–output tables were utilized to calculate direct embodied energy coefficients. This was achieved through the construction of an energy input–output matrix. This matrix reflects the amount of energy from the energy supply sector (represented as rows) required to directly produce one unit of an output sector (represented as columns) [37,50]. Additionally, the Leontief inverse matrix was obtained by deriving the energy input–output matrix and used for the calculation of total embodied energy coefficients. The Leontief inverse matrix describes the amount of total energy required (both direct and indirect) to produce one unit of output [37,50]. Equations (1) and (2) were used to calculate the direct embodied energy coefficient (DEC) and the total embodied energy coefficient (TEC), respectively [37], where ‘Den’ represents the ratio of the direct monetary value of the energy supply sector’s input to a specific sector (n) divided by the total output value of that specific sector (n), while ‘Ten’ represents the ratio of the total monetary value of the energy supply sector’s input to a specific sector (n) divided by the total output value of that specific sector (n).
D E C =   e n D e n   ×   e n e r g y   t a r i f f e   ×   P E F e
T E C =   e n T e n   ×   e n e r g y   t a r i f f e   ×   P E F e
From Thailand’s input–output table, the following four energy supply sectors were used to calculate the amount of energy required: coal and lignite, petroleum and natural gas, petroleum refineries, and electricity. These energy supply sectors were used to quantify the embodied energy coefficients of building materials within specific sectors (n). For calculating embodied energy coefficients using the IO-based method, an important parameter called ‘inverse energy tariffs’ (MJ/THB) was applied. This parameter was used to transform the monetary value of the embodied energy coefficients into energy units. The inverse energy tariffs can be determined by dividing the total energy consumption of an energy supply sector by its total output from the input–output table. The total energy consumption data were obtained from the 2015 Energy Balance of Thailand report, published by the Department of Alternative Energy Development and Efficiency (DEDE) of the Ministry of Energy [51]. This study reports the values of embodied energy coefficients in primary energy terms. Primary energy can truly describe the contribution of energy depletion to environmental problems compared to final energy consumption. Therefore, the primary energy factor (PEF) for the four energy supply sectors was calculated using data obtained from the 2015 Energy Balance of Thailand report, published by the DEDE [51]. The PEF was determined by dividing the amount of primary energy consumption by the amount of final energy transformation [37].
The calculated embodied energy coefficients were initially presented in units of energy per monetary value (MJ/THB). For comparison with other research and to directly relate embodied energy to material weight, the units of the embodied energy coefficient were converted to energy per unit weight (MJ/kg). Therefore, the price of building materials plays a crucial role in converting the embodied energy coefficient into energy per unit weight. Following the methodology of a previous study [48], the average prices of building materials were obtained from the 2015 report published by the Bureau of Trade and Economic Indices (CMI) of the Ministry of Commerce [52]. The total embodied energy coefficients (TEC), after being multiplied by the price of building materials, can be used to represent the total embodied energy coefficients of building materials in Thailand. The calculated direct embodied energy coefficients (DEC) were used for quantifying the hybrid embodied energy coefficients (HEC), as further described in Section 2.1.2.

2.1.2. Establishment of Hybrid Embodied Energy Coefficients

As described in Section 2.1.1, the IO-based method is the preferred approach for quantifying the embodied energy coefficients of building materials in Thailand due to its ability to overcome limitations on data collection in the upstream stages and complete the system boundaries. However, to ensure valuable results, direct energy consumption data for eight building materials were collected from domestic reports. The energy consumption of ceramic tiles and bricks was obtained from the Final Report on the Project for the Development of Energy Efficiency in the Ceramics and Brick Industry, Thailand Institute of Scientific and Technological Research (2003) [53]. Similarly, data for plastic pipes were obtained from reports on ‘Energy Conservation for the Plastics Industry by the Department of Alternative Energy Development and Efficiency’ (2006) [54]. The energy consumption of sheet glass, fiberglass, and cement was determined from A Study on Energy Consumption Criteria in the Non-Metallic Industry, Department of Alternative Energy Development and Efficiency (2007) [55]. The research by Juntueng, S. (2006) [56] provided data on steel reinforcement consumption. Finally, the energy consumption of autoclaved aerated blocks was determined from ‘Guidelines for Preparing Product Life Cycle Data: Lightweight Concrete Products Industry, Department of Industrial Works’ (2017) [57].
These processes’ energy consumption values were then used to calculate hybrid embodied energy coefficients, using the hybrid approach developed by Crawford R. [38] as a foundation. We adjusted this hybrid approach to the specific context of Thailand in order to quantify the hybrid embodied energy coefficient of each material, as presented in Equation (3).
H E C =   P E C +   [ T E C   D E C   ×   P r i c e   o f   b u i l d i n g   m a t e r i a l s ]
As shown in Equation (3), the hybrid embodied energy coefficient (HEC) was calculated by combining data from both the process-based method and the IO-based method. The process-embodied energy coefficient (PEC) represents the direct energy consumption of the building materials. To achieve a comprehensive result, the indirect energy consumption obtained from the IO-based method was added to the calculation. The indirect energy can be determined by subtracting the direct embodied energy coefficient (DEC) from the total embodied energy coefficient (TEC). This indirect value can then be multiplied by the price of each material to express the indirect energy component in units of energy per weight.
The calculated hybrid-embodied energy coefficients were then evaluated using GAP analysis [58]. This evaluation method was used to determine the significance of including indirect energy from the IO-based method in the process-based method. This inclusion provided comprehensive and reliable hybrid embodied energy coefficient results. The GAP analysis method is presented in Equation (4).
% G A P =   H E C P E C H E C   ×   100

2.2. Life-Cycle Energy Analysis of a Single-Family Detached House in Thailand

The embodied energy coefficients presented in Section 2.1 were applied to analyze the embodied energy of a single-family detached house in Thailand. This analysis considers both initial embodied energy and recurrent embodied energy. Therefore, the energy consumed during the transportation of building materials to the construction site and the energy consumed for building construction were both calculated in this research. To complete the life-cycle energy analysis (LCEA) scope (cradle-to-grave), operational energy data and the demolition energy calculation approach were obtained from previous studies and included in this research to provide comprehensive LCEA results.

2.2.1. Single-Family Detached House: The Case Study

To promote energy savings, raise awareness, and provide understanding about energy conservation in the residential building sector, the Department of Alternative Energy Development and Efficiency (DEDE) of the Ministry of Energy launched a prototype for an energy-conservative house design and published it for public access [21]. This research uses a single-family detached house published by the DEDE as a case study for quantifying the total life-cycle energy consumption. The results of this research can be used to evaluate the potential for energy conservation, which directly reflects the energy resource depletion in residential buildings.
The building plans and bill of quantities for the case-study house were obtained from a published website [21]. We calculated the total energy consumption of the case-study house by specifically focusing on structural and architectural systems. The case-study house is a 127 m² (internal floor area) single-family detached house designed for a household of four occupants. The house consists of two stories and has a designated 50-year service life. The house is made from a reinforced concrete structure. The floor structure on the ground floor consists of precast concrete slabs (50 mm thick) finished with ceramic tiles. The upper floor is finished with laminate wood flooring. The interior and exterior walls consist of 30 mm autoclaved aerated concrete blocks plastered with cement. Paint is used for the interior walls. For the exterior walls, fiber–cement board cladding is utilized. All windows consist of 6 mm tinted float glass and white aluminum frames. Exterior sun louvers, made of aluminum, are intended to provide shade and heat protection in order to reduce the building’s operational energy consumption. The ceiling of the first floor consists of a 9 mm gypsum board suspended on a galvanized steel frame. The ceiling of the second floor utilizes the same construction but with an additional layer of 76 mm fiberglass insulation covered with reinforced aluminum foil for improved thermal performance. The roof consists of fiber–cement tiles. Table 1 summarizes the main characteristics of the case-study house.

2.2.2. Initial Embodied Energy

The list of building materials and their quantities for the case-study house was extracted from the bill of quantities by taking account of structural and architectural works. The embodied energy coefficients presented in Section 2.1 were employed and multiplied by the corresponding quantities of building materials. The wastage multiplier of building materials was not included in the calculations, as the published quantities in the bill of quantities already include the waste factor.

2.2.3. Transportation Energy

To quantify the transportation energy, we assumed a default transportation distance of 50 km for all building materials delivered to the construction site. This assumption was based on the average travel distances observed for delivering construction materials within metropolitan areas in Bangkok, Thailand. The power series approximation method was employed to quantify the transportation energy. This method has been used to calculate the direct energy consumption at each stage of material production in previous studies [37,39]. Data from an input–output matrix were utilized to establish a ratio of transportation needs per unit of residential building construction. This ratio was calculated by dividing the monetary value of the ‘transportation sector’ input into the ‘residential building construction sector’ by the monetary value of the total output from the ‘residential building construction sector’. The direct embodied energy coefficient (DEC) of the transportation sector was then multiplied by this ratio to obtain the transportation embodied energy coefficient (MJ/THB). To calculate the transportation energy for the specific 50 km distance, this coefficient was multiplied by the total weight of building materials and their transportation rate (THB/ton). The transportation rate was derived from the total cost of transporting materials via a 6-wheel truck (not exceeding 15 tons and considering a diesel fuel price of 28.00–28.99 THB/L), as outlined in the Guidelines, Practices, and Details for Estimating Construction Cost by The Comptroller General’s Department, Ministry of Finance [59].

2.2.4. Construction Energy

The IO-based method was used to quantify the construction energy of the case-study house. The direct embodied energy coefficient obtained from the residential building construction sector can be used to represent the amount of direct energy used to construct the building. In this study, the total wage data from the bill of quantities were applied to represent the embodied energy associated with human labor and the associated machinery.

2.2.5. Recurrent Embodied Energy

In this study, the life cycle of the case-study house is 50 years. During this period, some building materials will need replacement due to variations in the materials’ useful life. To determine the recurrent embodied energy of the house, the service lifetimes of individual building materials were considered. This involved referencing previous research [60,61] and obtaining information from domestic producers. Paints, for example, were assumed to require recurring replacement every 10 years due to their durability and properties, as supported by previous research [60,61]. Similarly, the recurring replacement time for fiberglass was assumed to be 15 years, based on information obtained from domestic producers. The same approach was applied to determine the service lifetimes of all other building materials. Only the recurrent embodied energy of architectural systems, as listed in the bill of quantities, was employed in this analysis. Table 2 presents a list of the building materials requiring replacement and their service lifetimes. The recurrent embodied energy was then calculated by multiplying the quantity of replacement materials by their embodied energy coefficients and the number of replacements needed.

2.2.6. Operational Energy

The operational energy consumption of the case-study house was quantified using OpenStudio Thai Version 2.2.0, a free building energy simulation program developed by the National Renewable Energy Laboratory (NREL). OpenStudio utilizes a plug-in associated with SketchUp Make 2017 and EnergyPlus 8.7.0. SketchUp was used to create a three-dimensional building model. Specific building information was then input into OpenStudio, including weather data, site information, operational schedules, material types, thermal zones, and the air-conditioning system. After all the required information was entered, the EnergyPlus plug-in was used to calculate the annual operational energy consumption. Since Thailand has a warm and tropical climate with minimal seasonal temperature variations compared to other regions, we assumed constant energy consumption behavior throughout the year for the case-study house. The annual operational energy consumption result was obtained from previous research [62]. Subsequently, the primary energy factor (PEF) of electricity, as described in Section 2.1, was used to convert the annual operational energy into primary energy consumption.

2.2.7. Demolition Energy

Due to the insufficient data on demolition energy in Thailand, we utilized data developed by Guan L. [63]. The value of 176 MJ/m² for heavy construction types (e.g., masonry and concrete) reported by Guan L. [63] was multiplied by the gross floor area of the case-study house to represent the demolition energy.

2.2.8. Total Energy Consumption

In this research, the total energy consumption of the case-study house was quantified by summing all embodied energy terms, including initial embodied energy (EEinitial), transportation energy (EEtran), construction energy (EEcon), recurrent embodied energy (EEre), and demolition energy (EEdemo). The annual operational energy (OE), which was converted to primary energy terms, was then multiplied by the 50-year building life cycle and added to the embodied energy components to determine the total life-cycle energy consumption. The LCEA results for the case-study house are reported in primary energy consumption units (GJ) per unit of internal floor area (GJ/m²). Equation (5) presents the calculation of total energy consumption.
L C E A =   E E i n i t i a l + E E t r a n + E E c o n + E E r e + E E d e m o + ( O E × b u i l d i n g   l i f e t i m e )

3. Results

The results of Thailand-specific embodied energy coefficients quantified using the IO-based method and the hybrid approach are presented in Section 3.1. These coefficients were then used to calculate the initial embodied energy and recurrent embodied energy of the case-study house. The LCEA results for the case-study house are presented in Section 3.2.

3.1. Embodied Energy Coefficient Quantification

This study employed inverse energy tariffs for four energy supply sectors and PEFs to calculate the embodied energy coefficients of building materials. The inverse energy tariffs for the four energy supply sectors and PEFs are presented in Table 3.
The inverse energy tariffs range from 0.80 to 8.02 MJ/THB. Coal and lignite, categorized as primary energy sources, give this energy supply the lowest cost, where one unit of monetary value can produce 8.02 MJ of energy. Conversely, electricity, which is secondary energy, has the highest cost due to the transformation process increasing the overall cost. Since coal, lignite, petroleum, and natural gas are primary energy sources, their PEF in this research is assumed to be 1.0. Conversely, petroleum refineries and electricity have PEFs of 1.2 and 2.4, respectively.
This study determined the embodied energy coefficients for 36 key building materials using the IO-based method. These coefficients are presented in Table 4. The embodied energy coefficients in this study were compared with results from previous studies [40,41,43,44,64]. There is a strong correlation between the results in this study and those of previous research, except for a few building materials. Concrete and glass had slightly lower embodied energy coefficients compared to previous studies, while plywood (MDF) had a slightly higher value. These variations may arise from several factors, including differences in industrial production technology, the types of energy fuels used, and methodological and system boundary variations.
The direct energy consumption of eight building materials according to the process-based method, as obtained from domestic reports, was used to calculate the hybrid embodied energy coefficients. These coefficients are presented in Table 5. The embodied energy coefficients from the hybrid method are generally higher than those obtained from direct energy consumption from process data alone. This is because the inclusion of the IO-based method in the hybrid approach can provide more comprehensive results. The results of the hybrid embodied energy coefficients (indicated by ‘*’ in Table 4) were used instead of the results from the IO-based method. GAP analysis was employed as a comparative method to provide comprehensive results quantifying the impact of indirect energy. The percentage difference (%GAP) between the process-based method and the hybrid method is reported in Table 5. The %GAP for the eight building materials ranges from 18 to 98%. Brick presents the highest %GAP, while cement presents the lowest. The variation in %GAP results may result from the truncation of energy consumption data in the upstream stages for each material. Therefore, the lower %GAP for cement may indicate that the direct energy consumption according to the process-based method effectively completed the system boundary for embodied energy quantification. Conversely, a higher %GAP may suggest data truncation during the embodied energy quantification when using the process-based method.

3.2. Life-Cycle Energy Analysis of the Case-Study House

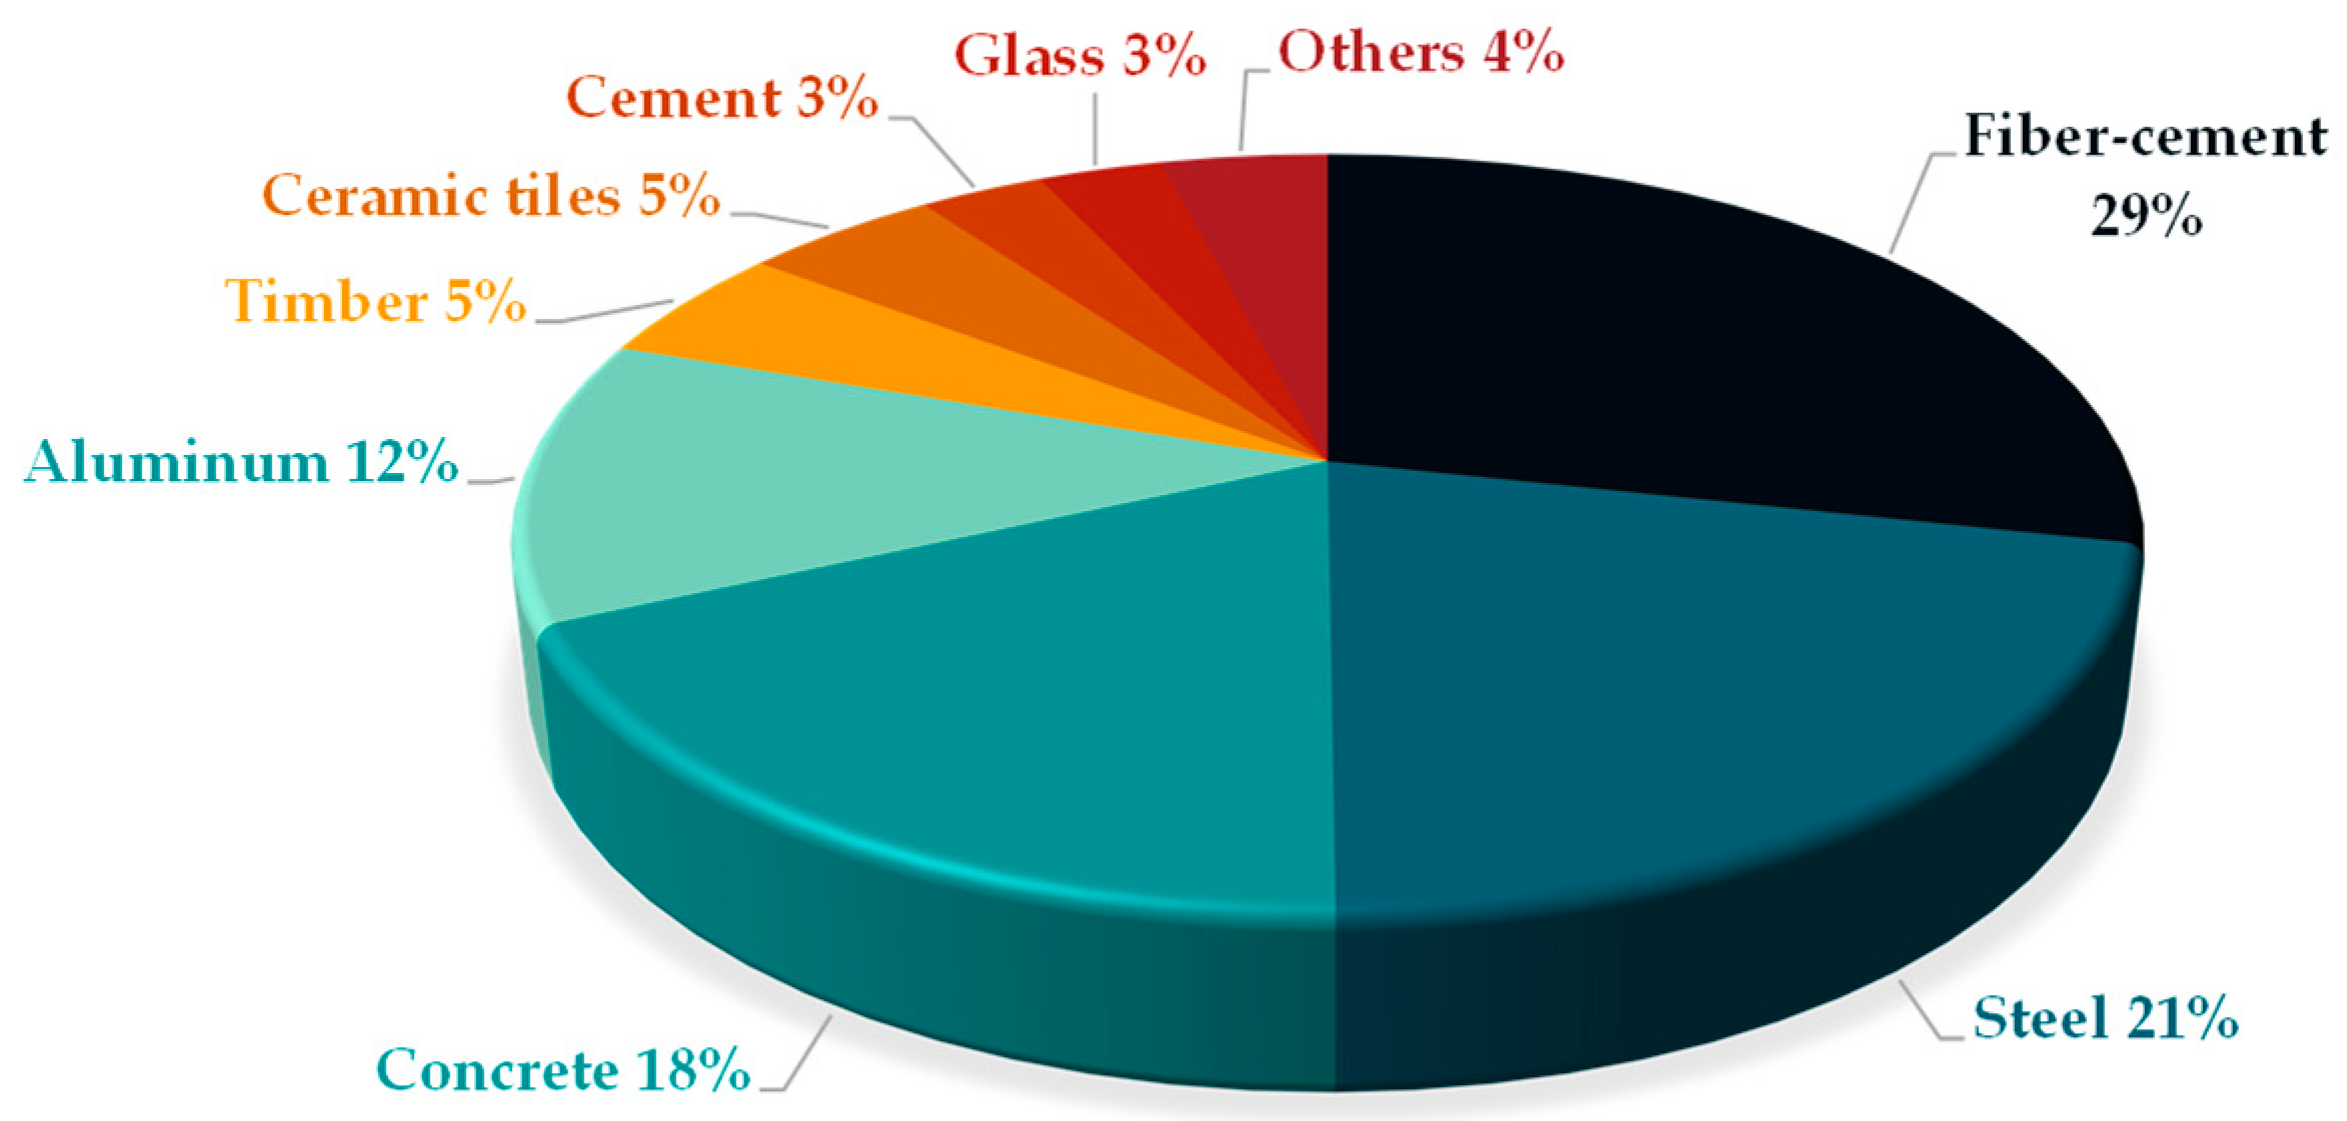
3.2.1. Embodied Energy of Building Materials

The list of main building materials used to construct the case-study house was extracted from the bill of quantities. The quantities of these main materials are presented in Figure 1. Concrete accounts for the largest quantity because the case-study house was designed as a heavy structure using a reinforced concrete frame and autoclaved aerated block walls. Concrete was the main building material by mass, at 263,102 kg, followed by fiber–cement (18,953 kg), steel (15,157 kg), timber (10,097 kg), cement (7029 kg), sand (5745 kg), ceramic tiles (4331 kg), gypsum (1627 kg), glass (875 kg), aluminum (795 kg), plywood (381 kg), paints (133 kg), and plastics (80 kg). Although concrete accounted for the largest quantity, the embodied energy results differed significantly. Figure 2 illustrates the proportions of embodied energy for each building material. When considering embodied energy, fiber–cement has the greatest share, at 29%, followed by steel (21%), and concrete (18%). As shown in Figure 2, aluminum ranks fourth in embodied energy share (12%). This highlights how even a small amount of aluminum can contribute significantly to embodied energy content due to its high embodied energy coefficient. Therefore, based on the results, the main building materials can be categorized into the following three groups:
  • High quantity, low embodied energy coefficient: Concrete can be classified in this category. While concrete has a relatively low embodied energy coefficient, its large quantity consumption can lead to a high embodied energy impact.
  • High quantity, high embodied energy coefficient: Steel and fiber–cement can be categorized in this group. These materials are consumed in large quantities and provide high embodied energy coefficients.
  • Low quantity, high embodied energy coefficient: This group includes materials such as aluminum; while consumed in smaller quantities, their high embodied energy coefficient can still affect the total embodied energy.
The total embodied energy of the building materials represents the initial embodied energy of the case-study house. This value is 1015.3 GJ, which translates to 7.99 GJ/m² for the 127 m² internal floor area.

3.2.2. Effect of Recurrent Embodied Energy

This study determined recurrent embodied energy by dividing the building elements into groups in order to identify their effects on recurrent embodied energy. The amount of recurrent embodied energy for each building element is presented in Figure 3. As shown in Figure 3, ceiling replacement consumes the most embodied energy, at 217.5 GJ, followed by wall replacement at 110.9 GJ and roofing replacement at 46.2 GJ. This high recurrent embodied energy for ceiling replacement is due to the use of fiber–cement panels and fiberglass insulation with aluminum foil, which consume high amounts of embodied energy. Similarly, wall replacements require fiber–cement boards on the exterior walls, contributing to their significant recurrent embodied energy. While paint requires a relatively small quantity, the frequent need for repainting (every ten years) leads to a high cumulative recurrent embodied energy for paint replacement. The total recurrent embodied energy of the case-study house is 450.1 GJ and 3.54 GJ/m². Recurrent embodied energy accounts for 31% of the total embodied energy (as shown in Figure 4). This result shows the importance of recurrent embodied energy in total life-cycle energy consumption.

3.2.3. Total Life-Cycle Energy Consumption of the Case-Study House

The embodied energy includes initial embodied energy (1015.3 GJ), transportation energy (0.5 GJ), construction energy (12.3 GJ), recurrent embodied energy (450.1 GJ), and demolition energy (37.8 GJ). The operational energy consumption over a 50-year lifespan is 4186.5 GJ. The percentage shares of energy consumption are as follows: operational energy (64%), initial embodied energy (24%), and recurrent embodied energy (11%). The sum of transportation, construction, and demolition energy accounts for only 1% of total energy consumption. Figure 5 illustrates the proportion of total life-cycle energy consumption. Table 6 presents a comparison of the LCEA results from this study with those from other studies. The initial embodied energy in this study was 7.99 GJ/m². The initial embodied energy result in this study is lower when compared to the ‘green home’ reported by Fay R. [29], which utilized fiberglass walls and ceiling insulation with additional roof foil insulation, as well as the ‘passive house’ reported by Stephen A. [34], which used polyurethane insulation in the walls, underfloor, and roof, as well as triple-glazed, argon-filled windows. In contrast to this study, fiberglass insulation was only installed under the ceiling. This variation in insulation installation can affect the initial embodied energy. However, when comparing this result with the single-family detached house reported by Adalberth K. [32], the results in this study are higher. This is because the detached single-family house reported by Adalberth K. [32] made use of a wood frame and concrete roof, which have lower embodied energy coefficients. The operational energy and life-cycle energy consumption in this study are generally consistent with the findings of other studies, except for those of Fay R. [29], who found a higher life-cycle energy consumption. This is because Fay R. [29] included recurrent embodied energy in the energy consumption, which accounts for the replacement of building materials and appliances.
Furthermore, the LCEA results from this study were then compared with the statistical data on energy consumption standards for residential houses (single-family houses) developed in 2015 by the Department of Alternative Energy Development and Efficiency (DEDE), Ministry of Energy, Thailand [22]. We found that the average primary operational energy consumption in 2015 was 0.33 GJ/m²/year. This report also projected that the primary operational energy consumption will decrease to 0.17 GJ/m²/year by 2032. The comparison results present a significant difference. This is because this study determined the energy consumption by using a life-cycle energy analysis approach, which accounts for all energy consumed during the building’s lifespan. In contrast, the previous projected reports accounted only for the operational energy consumption during the use phase of the residential building.

4. Discussion

We constructed a database of embodied energy coefficients for 36 key building materials in Thailand. The IO-based method was chosen as a suitable method because Thailand has sufficient data to support it, providing comprehensive results. The direct energy consumption of eight building materials was used to quantify hybrid embodied energy coefficients. Although the hybrid approach is widely accepted as the most suitable method for determining embodied energy coefficients, the limited number of domestic energy consumption reports is an obstacle to providing sufficient embodied energy coefficients using a hybrid approach. Therefore, the IO-based method is the most suitable method for analyzing embodied energy coefficients in Thailand. This method can provide comprehensive results and be used to construct a Thailand-specific embodied energy coefficient database, which can be further applied to determine embodied energy in future studies.
A comparison of the embodied energy coefficients of building materials in this study with the findings of other research studies showed that the results were generally consistent. Only a few materials showed different results, which may have been due to differences in analysis methods, system boundaries, energy sources used, and production technologies [10,33,34]. However, using embodied energy coefficients derived from domestic data can provide more reliable results. This is because using embodied energy coefficients from other sources may result in errors due to differences in analysis methods and the variable parameters used in the calculation, such as inverse energy tariffs and PEFs, which are country-specific values that directly reflect energy resource consumption [9]. The results of the initial embodied energy from this study show that concrete is consumed in the largest quantity, followed by fiber–cement and steel. However, while concrete has the largest quantity among the materials used, the analysis showed that fiber–cement consumes the highest embodied energy, followed by steel and concrete. Aluminum was also identified as another material with a high embodied energy content. The results of embodied energy consumption can inform decision-making by guiding the selection of appropriate materials for building design. Additionally, these results can be used to raise awareness and promote caution during the construction stage to minimize material waste, which directly impacts embodied energy depletion. In addition to initial embodied energy, recurrent embodied energy is another important factor affecting the life-cycle energy consumption of the case-study house. The amount of recurrent embodied energy depends on the type of replacement materials and the number of replacements required throughout the building’s lifetime. The recurrent embodied energy in this research came from the replacement of fiberglass insulation and fiber–cement in the ceiling, roofing, and exterior walls. Therefore, to reduce recurrent embodied energy, it is crucial to select appropriate replacement building materials with appropriate embodied energy coefficients. The development of building materials by focusing on their properties may not achieve the desired energy conservation in the building. The development of building materials by enhancing their durability is essential, as this can reduce the amount of recurrent embodied energy in the building.
Aluminum is another material that has high embodied energy, even when used in small quantities. In the case-study house, aluminum is used for sun louvers. To reduce life-cycle energy consumption and achieve the design of an energy-conservative house, the use of aluminum should be applied with caution. Timber can be a viable alternative for sun shading due to its similar properties and lower embodied energy coefficient compared to aluminum. Research by Peng J. [65] demonstrated that timber can be used as a shading device and offers the lowest indoor air temperature compared to aluminum and concrete. Additionally, vertical green walls can be used as an alternative approach to create sun shading around the house [66]. However, it is important to note that aluminum can be 100% recyclable [67]. The use of aluminum may become part of a closed-loop society and be associated with the concept of a circular economy, which the global community should strive towards [68,69].
The LCEA results from this research (0.66 GJ/m²/year) were then compared with the statistical data of energy consumption standards for residential houses (single-family houses) developed in 2015 by the Department of Alternative Energy Development and Efficiency (DEDE), Ministry of Energy [22]. The projected primary operational energy consumption for 2032 is 0.17 GJ/m²/year. Understanding life-cycle energy analysis is essential for achieving energy conservation in the residential building sector. This understanding can lead to the construction of reasonable energy conservation guidelines that can be effectively applied to the public.
In the context of Thailand, the understanding of life-cycle energy analysis throughout the building’s life cycle should be emphasized and published to the public and those responsible for setting guidelines or measures for energy conservation in residential buildings. This knowledge could be used to achieve effective energy conservation in residential buildings. Finally, life-cycle energy analysis can provide comprehensive improvements in energy conservation, reduce energy resource depletion, and help Thailand achieve its goal of carbon neutrality by 2050.

5. Conclusions

This study developed a Thailand-specific embodied energy coefficient database using the IO-based method due to the readily available economic data reports in Thailand. The database encompasses 36 key building materials within a cradle-to-gate scope. Additionally, for eight building materials, energy consumption data were collected from domestic reports and used to calculate hybrid embodied energy coefficients. These hybrid coefficients were then incorporated into the Thailand-specific database. A single-family detached house served as a case study to quantify total energy consumption throughout its life cycle using the LCEA approach. The cradle-to-grave system boundary considered six stages, i.e., initial, transportation, construction, operational, recurrent, and demolition. Notably, the Thailand-specific embodied energy coefficient database was used to calculate the initial and recurrent embodied energy of the case-study house, which can be broken down into 13 building materials. Concrete was the most used material, followed by fiber–cement, steel, and timber, in that order. However, the embodied energy distribution results showed a different picture, i.e., fiber–cement ranked first, followed by steel, concrete, and aluminum, in that order. The case-study house had an initial embodied energy of 7.99 GJ/m² and a total life-cycle energy consumption of 0.66 GJ/m²/year.
This research offers valuable recommendations for the quantification and implementation of embodied energy in LCEAs for residential buildings. First, the embodied energy of building materials should be a crucial parameter in material selection. Those with lower embodied energy coefficients should be prioritized, while those with higher embodied energy coefficients should be used properly. Second, building materials’ development should focus not only on material properties but also on the energy efficiency of the production process, so as to minimize embodied energy. Third, knowledge about embodied energy and life-cycle energy analysis should be disseminated to the public in order to promote an understanding of energy conservation in residential buildings. Finally, the establishment of guidelines or policies on energy conservation should mandate the determination of embodied energy and total life-cycle energy consumption throughout a building’s life cycle. This is because these factors directly impact energy resource depletion, which has environmental consequences.
The IO-based method applied to quantify embodied energy and life-cycle energy consumption for the case-study house relied on data sources published in 2015. Using outdated data may introduce inherent errors. However, using domestic data provides more reliable results than using data from another region. Data obtained domestically can directly reflect energy resource depletion and production technology efficiency within the country, effectively contributing to Thailand’s energy conservation efforts.

Author Contributions

Conceptualization, N.S., K.K. and S.C.; data curation, N.S.; formal analysis, N.S.; investigation, N.S.; methodology, N.S., K.K. and S.C.; project administration, K.K. and S.C.; supervision, K.K. and S.C.; writing—original draft, N.S.; writing—review and editing, K.K. and S.C. All authors have read and agreed to the published version of the manuscript.

Funding

This research received no external funding.

Institutional Review Board Statement

Not applicable.

Informed Consent Statement

Not applicable.

Data Availability Statement

Data are available upon request.

Acknowledgments

The authors are grateful to the School of Energy, Environment and Materials at King Mongkut’s University of Technology Thonburi for making this research possible. Additionally, the authors would like to thank the Office of the National Economic and Social Development Council, the Department of Alternative Energy Development and Efficiency, the Ministry of Commerce, the Department of Industrial Works, and the Comptroller General’s Department for providing valuable information support.

Conflicts of Interest

The authors declare no conflicts of interest.

Abbreviations

DECDirect embodied energy coefficient
EEEmbodied energy
HECHybrid embodied energy coefficient
IEEInitial embodied energy
IOInput–Output
LCALife cycle assessment
LCEALife cycle energy analysis
LCILife cycle inventory
LCIALife cycle impact assessment
OEOperational energy
PECProcess-embodied energy coefficient
PEFPrimary energy factor
REERecurrent embodied energy
TECTotal embodied energy coefficient

References

  1. Schenk, D.; Amiri, A. Life Cycle Energy Analysis of Residential Wooden Buildings versus Concrete and Steel Buildings: A Review. Frontiers in Built Environment. Front. Media 2022, 8, 975071. [Google Scholar] [CrossRef]
  2. Huang, Z.; Zhou, H.; Miao, Z.; Tang, H.; Lin, B.; Zhuang, W. Life-Cycle Carbon Emissions (LCCE) of Buildings: Implications, Calculations, and Reductions. Engineering 2024, in press. [Google Scholar] [CrossRef]
  3. Hu, F.; Zheng, X. Carbon Emission of Energy Efficient Residential Building. Procedia Eng. 2015, 121, 1096–1102. [Google Scholar] [CrossRef]
  4. Information and Communication Technology Center. Energy Situation 2022; Information and Communication Technology Center: Bangkok, Thailand, 2022. [Google Scholar]
  5. Research Institute and Consultancy; Thammasat University. The Forecasting Housing Needs and Affordability for Thailand 2017–2037; Thammasat University: Bangkok, Thailand, 2017. [Google Scholar]
  6. Crowther, P. Design for Disassembly to Recover Embodied Energy. In The 16th Annual Conference on Passsive and Low Energy Architecture; Australian University: Brisbane, Australia, 1999. [Google Scholar]
  7. Monteiro, H.; Fernández, J.E.; Freire, F. Comparative Life-Cycle Energy Analysis of a New and an Existing House: The Significance of Occupant’s Habits, Building Systems and Embodied Energy. Sustain. Cities Soc. 2016, 26, 507–518. [Google Scholar] [CrossRef]
  8. Dixit, M.K.; Fernández-Solís, J.L.; Lavy, S.; Culp, C.H. Identification of Parameters for Embodied Energy Measurement: A Literature Review. Energy Build 2010, 42, 1238–1247. [Google Scholar] [CrossRef]
  9. Dixit, M.K.; Fernández-Solís, J.L.; Lavy, S.; Culp, C.H. Need for an Embodied Energy Measurement Protocol for Buildings: A Review Paper. Renew. Sustain. Energy Rev. 2012, 16, 3730–3743. [Google Scholar] [CrossRef]
  10. Cabeza, L.F.; Rincón, L.; Vilariño, V.; Pérez, G.; Castell, A. Life Cycle Assessment (LCA) and Life Cycle Energy Analysis (LCEA) of Buildings and the Building Sector: A Review. Renew. Sustain. Energy Rev. 2014, 29, 394–416. [Google Scholar] [CrossRef]
  11. Plank, R. The Principles of Sustainable Construction. IES J. Part A Civ. Struct. Eng. 2008, 1, 301–307. [Google Scholar] [CrossRef]
  12. Gustavsson, L.; Joelsson, A. Life Cycle Primary Energy Analysis of Residential Buildings. Energy Build 2010, 42, 210–220. [Google Scholar] [CrossRef]
  13. Davies, P.J.; Emmitt, S.; Firth, S.K. Challenges for Capturing and Assessing Initial Embodied Energy: A Contractor’s Perspective. Constr. Manag. Econ. 2014, 32, 290–308. [Google Scholar] [CrossRef]
  14. Copiello, S. Economic Implications of the Energy Issue: Evidence for a Positive Non-Linear Relation between Embodied Energy and Construction Cost. Energy Build 2016, 123, 59–70. [Google Scholar] [CrossRef]
  15. Sartori, I.; Hestnes, A.G. Energy Use in the Life Cycle of Conventional and Low-Energy Buildings: A Review Article. Energy Build 2007, 39, 249–257. [Google Scholar] [CrossRef]
  16. Su, X.; Tian, S.; Shao, X.; Zhao, X. Embodied and Operational Energy and Carbon Emissions of Passive Building in HSCW Zone in China: A Case Study. Energy Build 2020, 222, 110090. [Google Scholar] [CrossRef]
  17. Ramesh, T.; Prakash, R.; Shukla, K.K. Life Cycle Energy Analysis of Buildings: An Overview. Energy Build 2010, 42, 1592–1600. [Google Scholar] [CrossRef]
  18. Shadram, F.; Johansson, T.D.; Lu, W.; Schade, J.; Olofsson, T. An Integrated BIM-Based Framework for Minimizing Embodied Energy during Building Design. Energy Build 2016, 128, 592–604. [Google Scholar] [CrossRef]
  19. Crawford, R.H.; Treloar, G.J. Validation of the Use of Australian Input-Output Data for Building Embodied Energy Simulation. In Proceedings of the 8th International Building Performance Simulation Association Conference, Eindhoven, The Netherlands, 1 January 2003. [Google Scholar]
  20. Thormark, C. Energy and Resources, Material Choice and Recycling Potential in Low Energy Buildings. In Proceedings of the CIB Conference SB07 Sustainable Construction, Materials and Practices, Lisbon, Portugal, 12–14 September 2007. [Google Scholar]
  21. Department of Alternative Energy Development and Efficiency. Study on Energy Efficiency Criteria and Prototype Development for Residential Buildings. Available online: https://www.aad.kmitl.ac.th/dede/ (accessed on 1 March 2024).
  22. Department of Alternative Energy Development and Efficiency. A Study of Energy Efficiency Criteria in Residential Buildings and the Development of an Energy-Efficient House Prototype; Department of Alternative Energy Development and Efficiency: Bangkok, Thailand, 2015. [Google Scholar]
  23. Joshi, S. Product Environmental Life—Cycle Assessment Using Input—Output Techniques. J. Ind. Ecol. 1999, 3, 95–120. [Google Scholar] [CrossRef]
  24. Ortiz, O.; Castells, F.; Sonnemann, G. Sustainability in the Construction Industry: A Review of Recent Developments Based on LCA. Constr. Build Mater. 2009, 23, 28–39. [Google Scholar] [CrossRef]
  25. ISO 14040:2006; Environmental Management—Life Cycle Assessment—Principles and Framework. International Organization for Standardization (ISO): Geneva, Switzerland, 2006.
  26. Zabalza Bribián, I.; Aranda Usón, A.; Scarpellini, S. Life Cycle Assessment in Buildings: State-of-the-Art and Simplified LCA Methodology as a Complement for Building Certification. Build Environ. 2009, 44, 2510–2520. [Google Scholar] [CrossRef]
  27. Sharma, A.; Saxena, A.; Sethi, M.; Shree, V. Life Cycle Assessment of Buildings: A Review. Renew. Sustain. Energy Rev. 2011, 15, 871–875. [Google Scholar] [CrossRef]
  28. Nwodo, M.N.; Anumba, C.J. A Review of Life Cycle Assessment of Buildings Using a Systematic Approach. Build Environ. 2019, 162, 106290. [Google Scholar] [CrossRef]
  29. Fay, R.; Treloar, G.; Iyer-Raniga, U. Life-Cycle Energy Analysis of Buildings: A Case Study. Build. Res. Inf. 2000, 28, 31–41. [Google Scholar] [CrossRef]
  30. Huberman, N.; Pearlmutter, D. A Life-Cycle Energy Analysis of Building Materials in the Negev Desert. Energy Build 2008, 40, 837–848. [Google Scholar] [CrossRef]
  31. BS EN 15978:2011; Sustainability of Construction Works. Assessment of Environmental Performance of Buildings. Calculation Method. British Standards Institution: London, UK, 2011. Available online: https://www.en-standard.eu/bs-en-15978-2011 (accessed on 1 April 2024).
  32. Adalberth, K. Energy Use during the Life Cycle of Single-Unit Dwellings: Examples. Build Environ. 1997, 32, 321–329. [Google Scholar] [CrossRef]
  33. Pinky Devi, L.; Palaniappan, S. A Case Study on Life Cycle Energy Use of Residential Building in Southern India. Energy Build 2014, 80, 247–259. [Google Scholar] [CrossRef]
  34. Stephan, A.; Crawford, R.H.; de Myttenaere, K. A Comprehensive Assessment of the Life Cycle Energy Demand of Passive Houses. Appl. Energy 2013, 112, 23–34. [Google Scholar] [CrossRef]
  35. Chen, T.Y.; Burnett, J.; Chau, C.K. Analysis of Embodied Energy Use in the Residential Building of Hong Kong. Energy 2001, 26, 323–340. [Google Scholar] [CrossRef]
  36. Nässén, J.; Holmberg, J.; Wadeskog, A.; Nyman, M. Direct and Indirect Energy Use and Carbon Emissions in the Production Phase of Buildings: An Input-Output Analysis. Energy 2007, 32, 1593–1602. [Google Scholar] [CrossRef]
  37. Treloar, G.J. A Comprehensive Embodied Energy Analysis Framework. Ph.D. Thesis, Deakin University, Melbourne, Australia, 1998. [Google Scholar]
  38. Crawford, R.H. Using Input-Output in Life Cycle Inventory Analysis. Ph.D. Thesis, Daekin University., Melbourne, Australia, 2004. [Google Scholar]
  39. Dixit, M.K. Embodied Energy Calculation: Method and Guidelines for a Building and Its Constituent Materials. Ph.D. Thesis, Texas A&M University, College Station, TX, USA, 2013. [Google Scholar]
  40. Kofoworola, O.F.; Gheewala, S.H. Life Cycle Energy Assessment of a Typical Office Building in Thailand. Energy Build 2009, 41, 1076–1083. [Google Scholar] [CrossRef]
  41. Dixit, M.K. Embodied Energy Analysis of Building Materials: An Improved IO-Based Hybrid Method Using Sectoral Disaggregation. Energy 2017, 124, 46–58. [Google Scholar] [CrossRef]
  42. Mithraratne, N.; Vale, B. Life Cycle Analysis Model for New Zealand Houses. Build Environ. 2004, 39, 483–492. [Google Scholar] [CrossRef]
  43. Circular Ecology. Embodied Carbon—The ICE Database. Available online: https://circularecology.com/ (accessed on 5 April 2024).
  44. Baird, G.; Alcorn, A.; Haslam, P. The Energy Embodied in Building Materials—Updated New Zealand Coefficients and Their Significance. IPENZ Trans. 1997, 24, 46–54. [Google Scholar]
  45. Treloar, G.J. Extracting Embodied Energy Paths from Input–Output Tables: Towards an Input–Output-Based Hybrid Energy Analysis Method. Econ. Syst. Res. 1997, 9, 375–391. [Google Scholar] [CrossRef]
  46. Treloar, G.J.; Love, P.E.D.; Faniran, O.O.; Iyer-Raniga, U. A Hybrid Life Cycle Assessment Method for Construction. Constr. Manag. Econ. 2000, 18, 5–9. [Google Scholar] [CrossRef]
  47. Treloar, G.J.; Love, P.E.D.; Holt, G.D. Using National Input/Output Data for Embodied Energy Analysis of Individual Residential Buildings. Constr. Manag. Econ. 2001, 19, 49–61. [Google Scholar] [CrossRef]
  48. Sangngamratsakul, N.; Kubaha, K. Embodied Energy Analysis of Building Materials in Thailand: The Quantification and Guideline Using Input-Output Analysis Method. In Proceedings of the 6th International Conference on Business and Industrial Research, ICBIR 2021—Proceedings, Bangkok, Thailand, 20–21 May 2021. [Google Scholar] [CrossRef]
  49. Office of the National Economic and Social Development Council. Input-Output Tables (I-O Tables). Available online: https://www.nesdc.go.th/ (accessed on 1 March 2024).
  50. Miller, R.E.; Blair, P.D. Input-Output Analysis: Foundations and Extensions, 2nd ed.; Cambridge University Press: Cambridge, UK, 2009. [Google Scholar] [CrossRef]
  51. Department of Alternative Energy Development and Efficiency; Ministry of Energy. Thailand Energy Balance 2015. Available online: https://oldwww.dede.go.th/ewt_news.php?nid=47341 (accessed on 1 March 2024).
  52. Ministry of Commerce. Bureau of Trade and Economic Indices. Available online: http://www.indexpr.moc.go.th/PRICE_PRESENT/ (accessed on 1 March 2024).
  53. Thailand Institute of Scientific and Technological Research. Final Report on the Project for the Development of Energy Efficiency in the Ceramics and Brick Industry; Thailand Institute of Scientific and Technological Research: Bangkok, Thailand, 2003. [Google Scholar]
  54. Department of Alternative Energy Development and Efficiency. Energy Conservation for the Plastics Industry; Department of Alternative Energy Development and Efficiency: Bangkok, Thailand, 2006. [Google Scholar]
  55. Department of Alternative Energy Development and Efficiency. A Study on Energy Consumption Criteria in the Non-Metallic Industry; Department of Alternative Energy Development and Efficiency: Bangkok Thailand, 2007. [Google Scholar]
  56. Juntueng, S.; Towprayoon, S.; Chiarakorn, S. Energy and Carbon Dioxide Intensity of Thailand’s Steel Industry and Greenhouse Gas Emission Projection toward the Year 2050. Resour. Conserv. Recycl. 2014, 87, 46–56. [Google Scholar] [CrossRef]
  57. Department of Industrial Works. Guidelines for Preparing Product Life Cycle Data: Lightweight Concrete Products Industry; Department of Industrial Works: Bangkok, Thailand, 2017. [Google Scholar]
  58. Crawford, R.H. Validation of the Use of Input-Output Data for Embodied Energy Analysis of the Australian Construction Industry. J. Constr. Res. 2005, 6, 71–90. [Google Scholar] [CrossRef]
  59. The Comptroller General’s Department. Guidelines, Practices, and Details for Estimating Construction Cost; The Comptroller General’s Department: Bangkok, Thailand, 2017. [Google Scholar]
  60. Treloar, G.; Fay, R.; Love, P.E.D.; Iyer-Raniga, U. Analysing the Life-Cycle Energy of an Australian Residential Building and Its Householders. Build. Res. Inf. 2000, 28, 184–195. [Google Scholar] [CrossRef]
  61. Crawford, R.H.; Czerniakowski, I.; Fuller, R.J. A Comprehensive Framework for Assessing the Life-Cycle Energy of Building Construction Assemblies. Archit. Sci. Rev. 2010, 53, 288–296. [Google Scholar] [CrossRef]
  62. Nitsunkit, S. Embodied Energy of Energy-Efficient Houses in Thailand. Master’s Thesis, King Mongkut’s University of Technology Thonburi, Bangkok, Thailand, 2018. [Google Scholar]
  63. Guan, L.; Walmsely, M.; Chen, G. Life Cycle Energy Analysis of Eight Residential Houses in Brisbane, Australia. Procedia Eng. 2015, 121, 653–661. [Google Scholar] [CrossRef]
  64. Crawford, R.; Stephen, A.; Prideaux, F. Environmental Performance in Construction (EPiC) Database. Available online: https://melbourne.figshare.com/projects/Environmental_Performance_in_Construction_EPiC_Database/68177 (accessed on 1 March 2024).
  65. Peng, J.; Aziz, T.I.S.T.; Leng, P.C. The Exploration of Energy Efficient Material for Shading Devices in Tropical Climates. Chem. Eng. Trans. 2023, 106, 301–306. [Google Scholar] [CrossRef]
  66. Campiotti, C.A.; Gatti, L.; Campiotti, A.; Consorti, L.; De Rossi, P.; Bibbiani, C.; Muleo, R.; Latini, A. Vertical Greenery as Natural Tool for Improving Energy Efficiency of Buildings. Horticulturae 2022, 8, 526. [Google Scholar] [CrossRef]
  67. The Aluminum Association. Aluminum’s Sustainability Infinitely Recyclable. Uniquely Sustainable. Available online: https://www.aluminum.org/sustainability (accessed on 1 April 2024).
  68. Kvande, H. The Aluminum Smelting Process. J. Occup. Environ. Med. 2014, 56, S2–S4. [Google Scholar] [CrossRef] [PubMed]
  69. Brough, D.; Jouhara, H. The Aluminium Industry: A Review on State-of-the-Art Technologies, Environmental Impacts and Possibilities for Waste Heat Recovery. Int. J. Thermofluids 2020, 1–2, 100007. [Google Scholar] [CrossRef]
Figure 1. The quantity of building materials used in the case-study house.
Sustainability 16 04045 g001
Figure 2. The percentage share of embodied energy in each building material.
Sustainability 16 04045 g002
Figure 3. Recurrent embodied energy of building elements.
Sustainability 16 04045 g003
Figure 4. The percentage share of recurrent embodied energy compared to initial embodied energy.
Sustainability 16 04045 g004
Figure 5. The percentage share of life-cycle energy consumption for the case-study house.
Sustainability 16 04045 g005
Table 1. Main characteristics of the case-study house.
CharacteristicsDescription
Building lifetime50 years
Gross floor area215 m2
Internal floor area127 m2
Number of occupants4
StructureReinforced concrete structure
Envelop30 mm autoclaved aerated blocks plastered with cement and painted (interior wall)
30 mm autoclaved aerated blocks cladded with fiber–cement board (exterior wall)
Window6 mm tinted float glass and white aluminum frames
Ceiling9 mm gypsum board suspended on a galvanized steel frame with a 76 mm fiberglass
insulation covered with reinforced aluminum foil (insulation used for the 2nd floor)
RoofFiber–cement roof tiles
Table 2. List of building materials requiring replacement.
Material NameUseful Life * (Year)Number of ReplacementsDescription of Materials Used
Paint104External walls and internal walls
Fiberglass (aluminum foil)153Insulation
Ceramic tiles251Flooring and internal walls
Roof tiles251Roofs
Plywood (MDF)251Flooring, doors, and stairs
Timber251Flooring, doors, and stairs
Plastics251Doors
Fiber–cement panel301External walls and ceilings
Gypsum board301Ceilings
* Based on Treloar G. [60] and Crawford R. [61].
Table 3. The inverse energy tariffs and primary energy factor used in this research.
Energy Supply SectorInverse Energy Tariffs (MJ/THB)PEF
Coal and lignite8.021.0
Petroleum and natural gas3.291.0
Petroleum refineries1.811.2
Electricity0.802.4
Table 4. Thailand-specific embodied energy coefficients (MJ/kg).
No.Building MaterialThis StudyPrevious Studies 1,2,3,4,5
1Aluminum156.6167.9–295
2Brick 1.78 *1.86–4.8
3Cement 4.34 *3.6–7.8
4Fiber–cement panels16.339.5–18.30
5Fiber–cement (roof tiles)11.479.5–18.30
6Ceramic tiles 11.04 *2.2–18.9
7Concrete (general)0.600.75–1.1
8Concrete blocks0.640.59–2.6
9Autoclaved aerated block 4.11 *3.50 3, 8.5 5
10Concrete 180 ksc (cylinder)0.570.70–1.3
11Concrete 210 ksc (cylinder)0.580.74 3
12Concrete (roof tiles)1.960.81 4, 4.3 5
13Concrete slab (hollow core)1.101.50 3, 2.0 4
14Granite12.680.70 1, 11.00 3
15Glass (general) 14.1915.00–28.5
16Glass (toughened)23.4623.50–29.8
17Fiberglass 63.14 *30.3–57.5
18Fiberglass (aluminum foil)79.98NA
19Gypsum board6.643.31–21.1
20Gypsum board (moisture resistance)9.57NA
21Nails15.86NA
22Paints (general)70.8267.4–90.4
23Waterborne paint54.4659.00–111
24Solventborne paint87.1981.5–124
25Plastic pipe (general) 63.88 *98.2 (general) 2
80.50 (general) 3
70.0 (PVC) 4
76.3 (PVC) 5
26Plywood (general)12.747.0–15.00
27Plywood (medium-density fiberboard; MDF)16.807.0–11.9
28Rock (crushed)0.180.08–3.0
29Rubber floor tiles15.22NA
30Sand0.140.08–0.34
31Soil0.100.45 3
32Steel (reinforcement) 12.81 *11.1–32.0
33Steel (section)18.0921.50–38.8
34Steel binding wires15.90NA
35Timber (hardwood)7.162.0–10.00
36Timber (medium hardwood)5.021.6–10.00
* Embodied energy coefficient obtained from the hybrid method. 1 Based on Kofoworola F [40]. 2 Based on Dixit M. [41]. 3 Based on the ICE database [43]. 4 Based on Baird G. [44]. 5 Based on Australia’s EPiC database [64]. NA: not available (i.e., unavailable data on the embodied energy coefficient).
Table 5. %GAP analysis of embodied energy coefficients between the process-based and hybrid methods.
Building MaterialEmbodied Energy Coefficients (MJ/kg)%GAP
Process-Based Hybrid
Brick0.032 11.7898
Plastic pipe1.65 263.8897
Steel reinforcement2.10 412.1883
Fiberglass22.15 363.1465
Autoclaved aerated block1.98 54.1152
Ceramic tiles5.31 111.0452
Glass8.78 314.1938
Cement3.54 34.3418
1 Based on [53]. 2 Based on [54]. 3 Based on [55]. 4 Based on [56]. 5 Based on [57].
Table 6. Comparison of LCEA results with other studies.
Case StudiesLife Cycle Energy ConsumptionCountry
Initial Embodied EnergyOperational EnergyLCEA
(GJ/m2)(GJ/m2/year)(GJ/m2/year)
This study7.990.420.66Thailand
Fay R. [29] 14.10.301.52Australia
Stephen A. [34] 19.170.400.88Belgium
Adalberth K. [32]2.92–3.670.46–0.530.55–0.63Sweden
Disclaimer/Publisher’s Note: The statements, opinions and data contained in all publications are solely those of the individual author(s) and contributor(s) and not of MDPI and/or the editor(s). MDPI and/or the editor(s) disclaim responsibility for any injury to people or property resulting from any ideas, methods, instructions or products referred to in the content.

