Article

A Cross-Citation-Based Model for Technological Advancement Assessment: Methodology and Application

Guangdong Provincial Key Laboratory of Intelligent Transportation System, School of Intelligent Systems Engineering, Sun Yat-sen University, Shenzhen 518000, China
*
Author to whom correspondence should be addressed.
Sustainability 2024, 16(1), 435; https://doi.org/10.3390/su16010435
Submission received: 19 November 2023 / Revised: 26 December 2023 / Accepted: 28 December 2023 / Published: 4 January 2024

Abstract

:
Assessing technological advancements is crucial for the formulation of science and technology policies and making well-informed investments in the ever-evolving technology market. However, current assessment methods are predominantly geared towards mature technologies, limiting our capacity for a systematic and quantitative evaluation of emerging technologies. Overcoming this challenge is crucial for accurate technology evaluation across various fields and generations. To address this challenge, we present a novel approach that leverages bibliometrics, specifically paper citation networks, to gauge shifts in the flow of knowledge throughout the technological evolution. This method is capable of discerning a wide array of trends in technology development and serves as a highly effective tool for evaluating technological progress. In this paper, we showcase the accuracy and applicability of this approach by applying it to the realm of mobile communication technology. Furthermore, we provide a comparative analysis of its quantitative results with other conventional assessment methods. The practical significance of our model lies in providing a nuanced understanding of emerging technologies within a specific domain, enabling informed decisions, and fostering strategic planning in technology-oriented fields. In terms of originality and value, this model serves as a comprehensive tool for assessing technological progress, quantifying emerging technologies, facilitating the evaluation of diverse technological trajectories, and efficiently informing technology policy-making processes.

1. Introduction

In today’s rapidly evolving society, the emerging technologies are reshaping our lives at an unprecedented pace. From artificial intelligence to advancements in the realm of networking, modern breakthroughs are propelling us into uncharted territories, expanding the possibilities of what we can achieve. This dynamic interplay between society and technology is redefining the very fabric of our existence. Emerging technologies are widely regarded as crucial drivers of societal and economic advancement. Accurately assessing the progress and relative advantages of emerging technologies is instrumental in determining optimal technological pathways, formulating rational resource allocation strategies, and identifying key research priorities. As such, evaluating and forecasting various technologies, understanding technological progress and trends, and identifying dynamic areas of technological development are essential. However, existing methods for technology assessment often stem from the inherent characteristics of the technology itself, rendering them less adaptable when applied to different technologies. In contrast, data mining methods utilize technology-related data to assess patterns within the data, offering a more universally applicable approach that is not limited to addressing specific issues associated with the technology. This paper introduces a novel method using technological knowledge flows (TKFs) as a reliable proxy, leveraging citation information from technology-related scientific papers. Unlike traditional citation analyses that predominantly focus on patents, this study emphasizes the magnitude of mutual citations between technologies, with a specific emphasis on using scientific paper data for a more effective exploration of these mutual citations. This innovative approach provides a solution to the challenges associated with existing methods and presents a fresh perspective on technology assessment.
Section 2 comprises a comprehensive literature review. In Section 3, we delineate the sources and data processing methods, culminating in the formulation of a technology assessment model. Utilizing mobile communication technology (specifically, 2G–6G) as an illustrative example, Section 4 delves into the analysis of the assessment model’s applicability. Section 5 introduces alternative technology assessment methods for comparative performance evaluation against our cross-citation-based assessment model. Section 6 synthesizes the assessment results, providing a succinct summary of the assessment model and a nuanced analysis of potential limitations and avenues for improvement.

2. Literature Review

2.1. Emerging Technologies Identification

Identifying the direction of emerging technologies is crucial for enterprises to achieve “overtaking on curves” and reverse competitive situations. It also provides important references and insights for technology planning management, recognition of high-tech industries, and formulation of corporate development plans. Emerging technology identification methods can be broadly classified into four categories: domain expert analysis, technological feature perspective, market product perspective, and scientific information mining perspective [1].
Domain expert analysis is an essential and traditional subjective judgment method widely used in current research. Based on the opinions of 58 experts, Ronzhyn et al. [2] predicted that the development directions of future emerging technologies would include the Internet of Things, artificial intelligence, virtual reality, augmented reality, and big data technologies. Stoiciu et al. [3] in the field of energy technology, consulted experts to construct potential emerging technology identification criteria, had experts from different knowledge backgrounds score new technologies, and ultimately identified emerging technologies in the energy sector.
Technological features are crucial differentiators between emerging technologies and others. Several scholars propose various approaches to identify emerging technologies by exploring computable features. Keller et al. [4] attempted a comprehensive method based on multiple technological features to assess emerging technologies. Guo et al. [5] constructed ten indicators representing technological multidimensional features from three dimensions: technological features, market dynamics, and external environment. They connected indicators, assigned weights based on their connectivity, and identified emerging technologies by calculating composite scores.
Consumer and market demands drive technological development, determining the direction and pace of innovation. Therefore, the dynamic changes in market, user, and product performance requirements have a significant impact on implicit or explicit influences on technological innovation and mutation. Sun et al. [6] based on the relationship between product development and technological evolution, predicted emerging technologies by deriving technological evolution paths and combining TRIZ evolutionary path theory. Anderson et al. [7] proposed a TFDEA (Technology Forecasting using Data Envelopment Analysis) model centered on product performance improvement to achieve technology forecasting by predicting future breakthroughs in technological performance.
The perspective of scientific information mining for emerging technology identification involves using relevant patents, scientific papers, and other data sources. Jia et al. [8] through CiteSpace software analyzed keyword co-occurrence networks and keyword frequency changes to construct an emerging technology identification framework from the perspective of technological frontiers. Dotsika et al. [9] introduced a paper-based potential emerging technology prediction method, identifying technology trends, discovering new themes, and tracking evolution through keyword co-occurrence and visualization analysis. When statistically and visually analyzing data, attention is focused on themes, knowledge structures, and temporal features, mainly utilizing network analysis for emerging technology identification.

2.2. Technology Assessment

Currently, the methods employed for identifying emerging technologies primarily rely on qualitative approaches. The research objective of this paper is to quantitatively assess emerging technologies through a technological evaluation methodology. This not only allows for cross-validation of results obtained using current qualitative methods for identifying emerging technologies, but also enables the quantitative measurement of the technological gap between emerging and traditional technologies after their identification.
Technology assessment has long been a major concern in various fields and is one of the core research directions in technology management. The main methods currently used for technology assessment include the Delphi method, scenario analysis, and decision analysis. The Delphi method is a questionnaire-based method that organizes and shares opinions through feedback. It has four distinct characteristics: anonymity, iterative nature, feedback, and statistical “group response”. Breiner et al. [10] discussed the significance of evaluation and forecasting, and reviewed the historical development of the Delphi method as a representative method of evaluation and forecasting, and briefly described the general process of Delphi method. As time goes by, some new Delphi methods have gradually evolved. Dawood et al. [11] developed a fuzzy Delphi method consisting of three steps: usability criteria analysis, fuzzy Delphi analysis, and usability evaluation model development. Alharbi et al. [12] proposed a variant of the Delphi method using triangular fuzzy numbers with a similar communication method to experts but a different evaluation process. Salais-Fierro et al. [13] established a hybrid approach combining expert judgment with demand forecasting generated from historical data for use in the automotive industry. Štilić et al. [14] presented an expert-opinion-based evaluation framework, utilizing Z-numbers and the fuzzy logarithm methodology of additive weights (LMAW), to assess the sustainability of TEL approaches. Wang et al. [15] employed a mixed multi-criteria decision-making (MCDM) framework based on the Delphi method, analytic network process (ANP), and priority sequence technique to investigate the functionality of artificial intelligence tools in the construction industry. This research utilized a fuzzy scenario and assessed similarity to the ideal solution through the Technique for Order of Preference by Similarity to Ideal Solution (TOPSIS). Suominen et al. [16] emphasized the significance of contextual factors in expert responses, even in the context of extremely global issues such as the development of science and technology. It was proposed that quantitative data can serve as a crucial contextual tool for interpreting the outcomes of expert opinions.
Scenario analysis is a widely used method for technology assessment in many management fields and is particularly valuable for assessing technology. Winebrake et al. [17] applied a analytic hierarchy process (AHP) in conjunction with perspective-based scenario analysis (PBSA) to assess five fuel processor technology alternatives across multiple criteria and perspectives of decision-makers. Banuls et al. [18] argued that traditional approaches to assessing technological opportunities often considered the future impact of each technology in isolation. In response, they proposed a scenario-based assessment model (SBAM) that enables decision-makers to measure the impact of technology interactions within a technology portfolio. The methodological framework of SBAM incorporates elements of AHP, cross-impact method (CIM), and the Delphi Method. More recently, Guo et al. [19] developed four distinct scenarios incorporating different policy considerations: a baseline scenario, a subsidy scenario, a low carbon price scenario, and a high carbon price scenario. The objective was to assess and determine energy-efficient technology pathways across the entire supply chain. Hussain et al. [20] constructed five scenarios using end-user and econometric approaches. Gómez-Sanabria et al. [21] included key governance variables in their analysis of different scenarios to assess the potential impacts of greenhouse gases from seven wastewater treatment options in the Indonesian fish processing industry. To make scenarios more realistic, de Gelder et al. [22] proposed a scenario representativeness (SR) metric based on Wasserstein distance that quantifies how well generated parameter values represent real scenarios while covering actual changes found in real scenarios. Ghazinoory et al. [23] categorized evaluations into three types: pre-assessment, mid-term assessment, and post-assessment. Pre-assessment occurs during scenario generation, mid-term assessment during scenario transition, and post-assessment after scenario transition. Kanama et al. [24] developed and evaluated a novel technology foresight method by combining a focused approach on the Delphi method and scenario writing. This method proves beneficial for decision-making in the development of strategic initiatives and policies.
Decision analysis methods have also been applied to technology assessments. The decision analysis approach for technology assessment typically involves two steps: developing a decision analysis framework and ranking the performance of each technology in the study area using the constructed framework. Lough et al. [25] pioneered a synthesis of TA, group idea generation techniques, and decision analysis within the context of electricity utility planning. Nguyen et al. [26] introduced a five-task methodology designed to evaluate information technology, with the aim of elucidating the societal controversies surrounding technological innovations. Berg et al. [27] introduced a value-oriented policy generation methodology for TA, consisting of a six-step assessment procedure involving goal clarification, goal realization status, analysis of conditions, projection of developments, identification of policy options, and synthesis and evaluation of policy options. McDonald et al. [28] conducted assessments of energy technologies based on learning curve dynamics. More recently, Liang et al. [29] developed a fuzzy group decision support framework for prioritizing the sustainability of alternative fuel-based vehicles. Dahooie et al. [30] used a fuzzy multi-attribute decision-making (F-MADM) method to rank interactive television technologies. To enhance the credibility of decision analysis results, other tools can be incorporated into the decision analysis framework. Zeng et al. [31] proposed a fuzzy group decision support framework and introduced a Pythagorean fuzzy aggregation operator to compensate for existing shortcomings and enhance credibility. They demonstrated the complete process of their multi-criteria decision-making (MCDM) model by evaluating unmanned ground transportation technology and conducting comparative and sensitivity analyses. Dahooie et al. [32] proposed an integrated framework based on sentiment analysis (SA) and MCDM technology using intuitionistic fuzzy sets (IFS). They evaluated and ranked five cell phone products using online customer reviews (OCR) on Amazon.com to illustrate the usability and usefulness of OCR. Lizarralde et al. [33] proposed an assessment and decision model for one or several technologies based on the MIVES (Integrated Model of Value for Sustainability Evaluations) method. Huang et al. [34] introduced a novel three-way decision model designed to address decision problems involving multiple attributes. Du et al. [35] proposed a dynamic multi-criteria group decision-making method with automatic reliability and weight calculation.
Through a review of the three technology assessment methods (i.e., the Delphi method, scenario analysis, and decision analysis), it is clear that these methods have been applied in various fields. However, they still have some inherent limitations. The Delphi method lacks communication of ideas and may be subject to subjective bias and a tendency to ignore minority opinions. This can lead to assessment results that deviate from reality and are influenced by the organizer’s subjectivity. Scenario analysis is time consuming and costly and relies on assumptions that are still in flux, which can affect the reliability of results. Although this method has an objective basis, it relies heavily on the analyst’s assumptions about data and is therefore influenced by their value orientation and subjectivity. The decision analysis method has a limited scope of use and cannot be applied to some decisions that cannot be expressed quantitatively. The determination of the probability of occurrence of various options is sometimes more subjective and may lead to poor decisions.
All the three methods, the Delphi method, scenario analysis, and decision analysis, belong to technology mining methods. Technology mining methods assess technology from the perspective of the technology itself, while data mining methods use data related to the technology for assessment. The key difference between these two approaches is that technology mining is problem-oriented and past studies have focused on the technology itself [36,37] rather than directly searching for patterns in data. In this work, we introduce technology-related data for use in technology assessment analysis. Of course, some scholars have tried to use bibliometric methods [38,39,40,41], but the methods involve too many indicators and may only be applicable to some fields, which is not conducive to extending to other fields.
To overcome the aforementioned limitations, a concept of technological knowledge flows (TKFs) can be utilized because the citation information on the scientific paper or patent has been considered a reliable proxy for TKF [42]. Analyzing technology through citation analysis is a common practice, with past scholars typically utilizing patent data for this purpose. By examining the correlation between highly cited patents and emerging technologies, researchers have sought to uncover the developmental trends of technology [43,44]. Additionally, some scholars have observed that in citation analysis, scientific paper and patents convey remarkably similar information regarding technology, whether in terms of temporal distribution or the degree of association with specific technologies [45,46]. In recent years, a substantial number of scholars have continued to investigate technology through the concept of knowledge flow in their research [42,47,48,49]. Park et al. [42] proposed a future-oriented approach to discovering technological opportunities for convergence using patent information and a link prediction method in a directed network. Chen et al. [47] tested the hypothesis that patent citations indicate knowledge linkage by measuring text similarities between citing-cited patent pairs and finds that examiner citations are a better indicator of knowledge linkage than applicant citations. Żogała-Siudem et al. [48] introduced a reparametrized version of the discrete generalized beta distribution and power law models that preserve the total sum of elements in a citation vector, resulting in better predictive power and easier numerical fitting. It is worth noting that, when employing citation analysis to explore mutual citations among technologies, both patents and scientific paper hold equal importance. However, this article diverges from conventional citation analysis approaches, focusing instead on the interplay of mutual citations between technologies. Notably, scientific papers prove to be the more effective resource for studying mutual citations. Consequently, this study relies on the selection of scientific paper data to drive its research objectives.
The interconnectedness between science and technology stands as a symbiotic relationship that mutually reinforces their progress. Fundamental scientific research constitutes a pivotal pursuit, serving as the foundational bedrock for the advancement of technology. Conversely, technology plays a profound role in shaping scientific research. Modern technology empowers scientists with high-resolution instruments and precision equipment, granting access to intricate data that was once inaccessible. For instance, astronomers can plumb the depths of the universe through sophisticated telescopes and detectors, while biologists accelerate genome analysis via high-throughput sequencing techniques. This dynamic interplay between contemporary science and technology initiates a virtuous cycle, with each propelling the other forward, thereby enhancing our understanding of the natural world and fostering technological innovation.
Within this context, scholarly papers assume a pivotal role in communicating the outcomes of scientific research. By disseminating their discoveries, insights, methodologies, and results through academic journals and conference proceedings, researchers contribute to the dissemination of cutting-edge scientific insights and the expansion of technological boundaries. As research extends beyond mere journal articles, its comprehensive knowledge structure takes form through the intricate web of references between these articles. These cross-citation relationships can reflect technological development to some extent [50]. In this paper, we explore technology advancement assessment from the perspective of knowledge flow by analyzing paper data and their cross-citation relationships.

3. Data and Models

The research methodology employed in this study is shown in Figure 1 and comprises two main components: (1) Data collection and pre-processing, and (2) Cross-citation calculation and model formulation. The initial stage involves retrieving potentially relevant papers from the Web of Science core database using key search terms pertaining to the specific technical domain. Subsequently, the collected papers are refined using a binary classifier that employs term frequency to differentiate between relevant and irrelevant sources. The initial step encompasses retrieving potentially pertinent papers from the Web of Science core database by employing key search terms aligned with the specific technical domain of interest. The collected paper is then refined using a binary classifier, which utilizes term frequency to discern between relevant and irrelevant papers. The subsequent step involves computing cross-citations among corresponding papers for each technology within the domain, resulting in the creation of a cross-citation matrix. Subsequently, a technology assessment model is proposed that incorporates the cross-citation matrix to generate advanced assessment results for each technology.

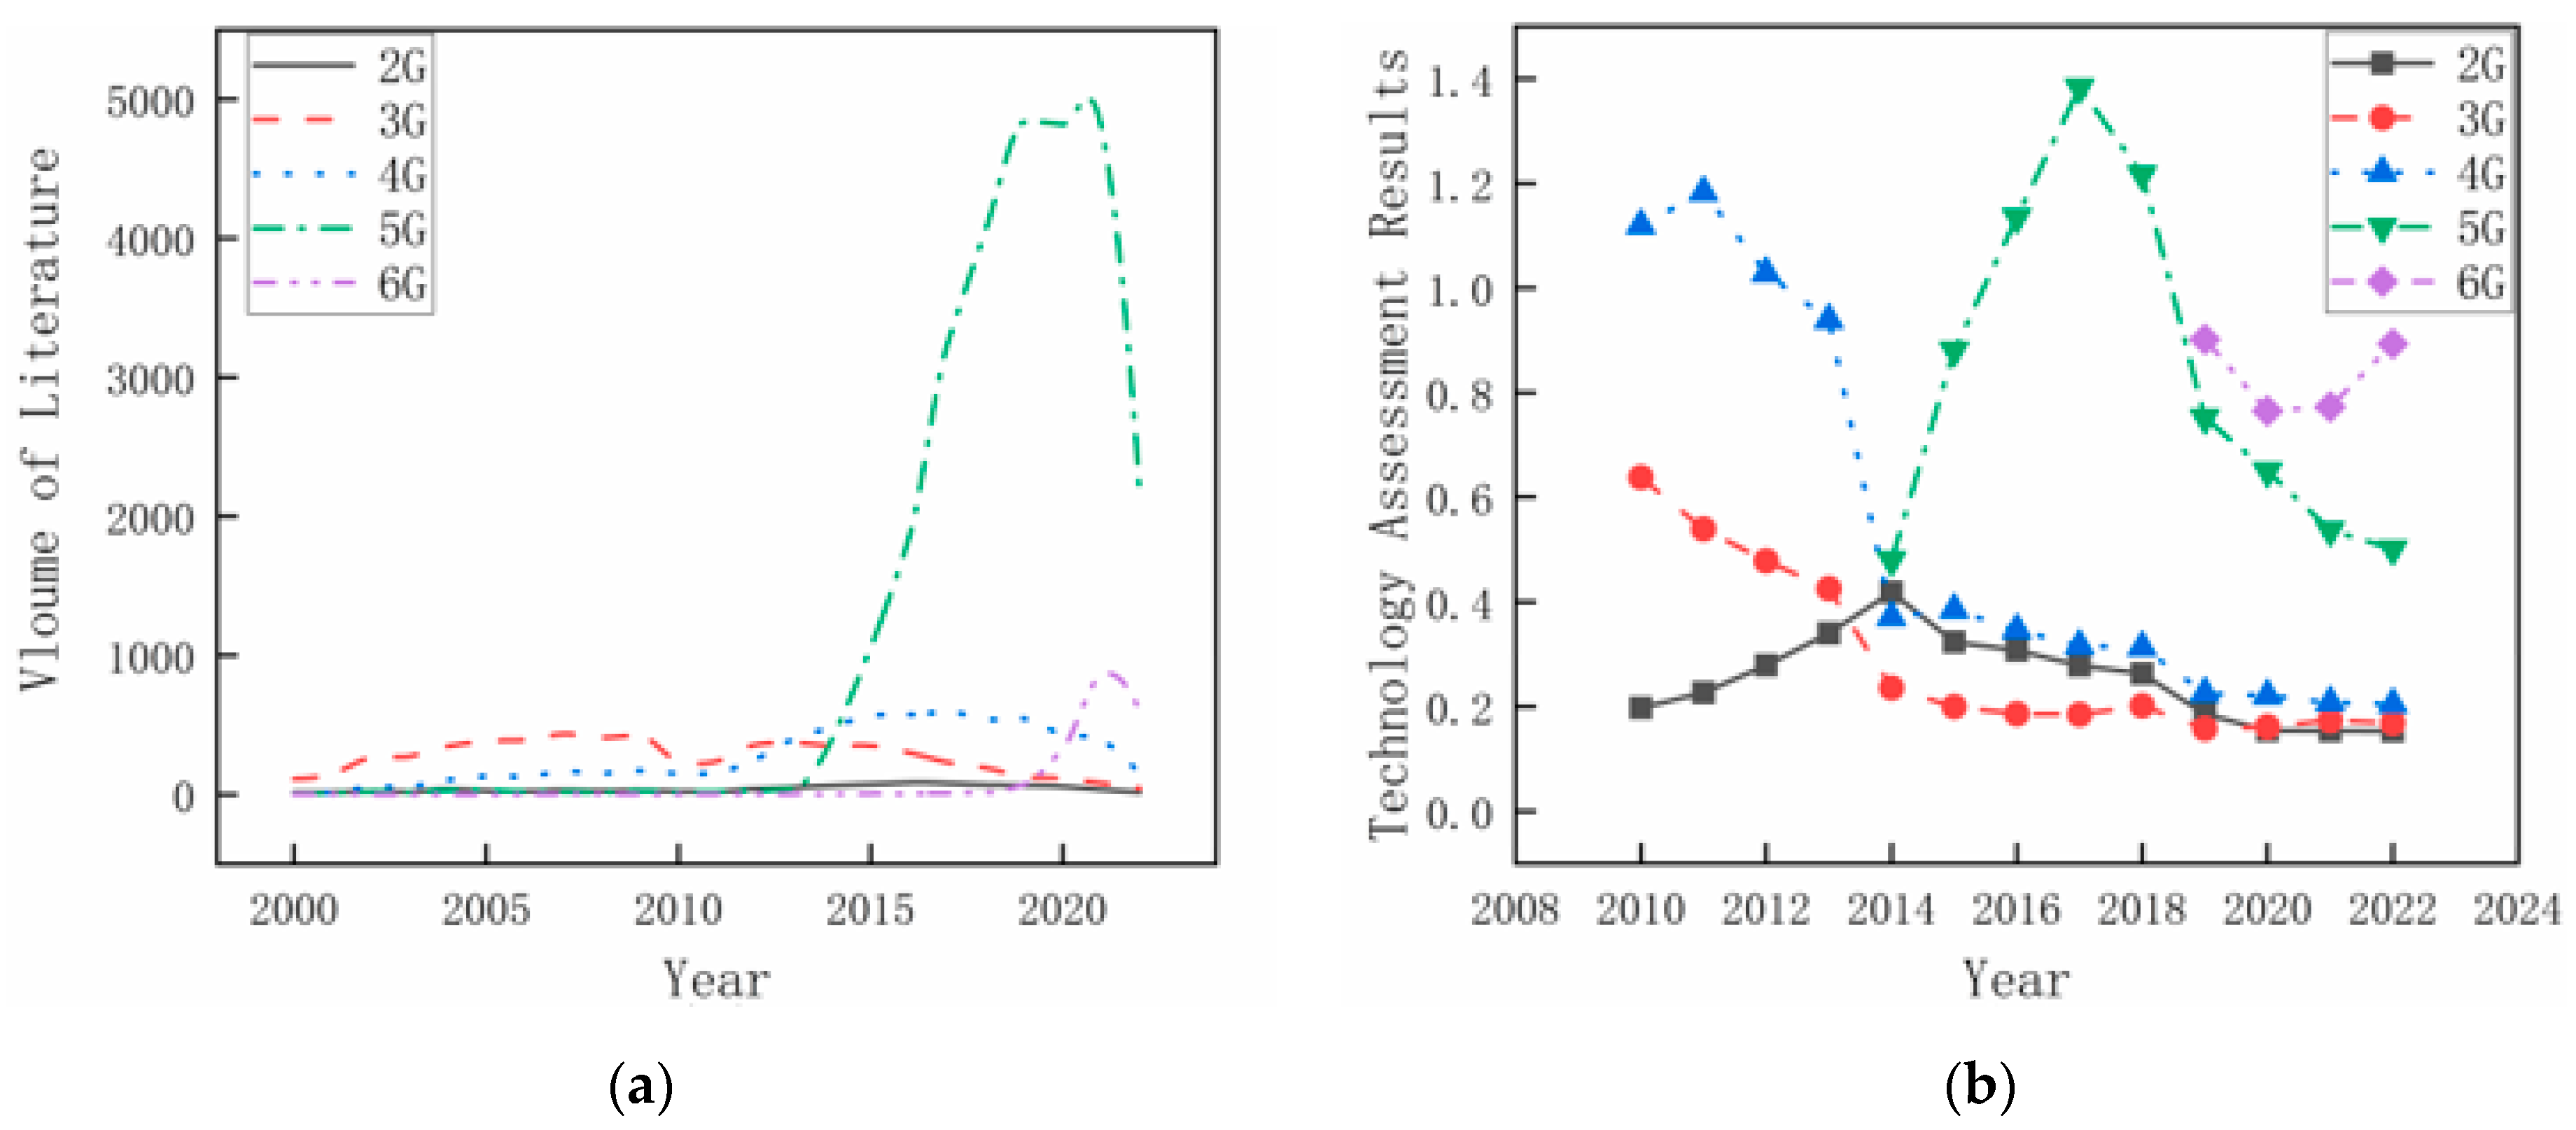
3.1. Data Collection and Pre-Processing

Web of Science, maintained by Clarivate Analytics, is a citation database encompassing over 34,000 peer-reviewed journals worldwide across a diverse range of academic disciplines, including natural sciences, social sciences, and humanities. For this paper, all research data is sourced from the Web of Science database due to its comprehensiveness and reliability. The way to obtain paper data in this paper is by keyword search. All papers retrieved from the database was exported as txt files for further data processing. However, the paper obtained by keyword search alone will have a lot of interfering data, which is because many articles simply mention that the keyword will also be retrieved or some keywords have multiple layers of meaning, and the papers with all the meanings involved in the keyword will be retrieved by keyword search. The authenticity of the data has a great impact on the data processing results and also on the final conclusions. Therefore, it is a critical task to filter the target papers from the papers obtained by keyword search. Here, we improve a support vector machine (SVM) approach [51] to perform the relevant/irrelevant dichotomous classification of the papers retrieved through keywords:
Step 1: Text Preprocessing. In this stage, the abstract section of the paper is exclusively extracted and subjected to a series of preprocessing steps such as division, deactivation, and normalization. This process aims to enhance the quality and readability of the text.
Step 2: Feature Extraction. The text information is transformed into numerical vectors using the bag-of-words model, Term Frequency-Inverse Document Frequency (TF-IDF), and other techniques. These numerical vectors serve as input features for the SVM model.
Step 3: Model Training. Researchers manually annotate a subset of paper to facilitate model training. It should be noted that during the labeling process, we encountered instances where certain documents were associated with multiple technologies. This phenomenon arose due to the fact that some documents addressed multiple topics within their scope. However, it is important to emphasize that this situation does not exert any influence on the findings or conclusions presented in this paper. In the second round of testing, randomly selected annotated papers ensure the accuracy of the labeled papers dataset. The ratio of relevant papers to irrelevant papers is 1:1, and 80% of the papers are selected randomly for training, while the remaining 20% is reserved for classification effect evaluation. The SVM model is trained using the labeled paper dataset to determine the hyperplane with the maximum interval on the feature space for separating the relevant and irrelevant paper. The kernel function is chosen as the linear kernel function, with a penalty factor of C = 1.0.
Step 4: Model Evaluation. The performance of the SVM model in terms of classification and generalization abilities on unknown data is evaluated using cross-validation, confusion matrix, accuracy, recall, and other relevant metrics.
Step 5: Document Classification. The trained SVM text classification model is applied to all the papers, and papers judged as relevant are labeled with “1”, while those deemed irrelevant are labeled with “0”. Only papers labeled “1” are retained for later cross-citation calculation.
The training sample size in Step 3 also has a great impact on the model training, so the sample size for SVM classifier learning is determined before the parameters are determined. In this paper, the SVM classifier is trained using different number of sample sizes for each technique separately. The resulting classifiers are then used to classify all papers corresponding to each technique separately. The selection of the sample size is determined by the stability of the classification situation, and the formula for quantifying the stability of the classification effect is shown in Equation (1):
σ n = ω i n ω i n 100 / P i ,         n > 100
where σ n denotes the degree of classification stability of papers using the SVM classifier. ω i ( n ) notes the number of target paper obtained after classification using SVM classifier when the training sample size is n. P i denotes the initial amount of papers corresponding to technology i .
In this paper, we assume that the classification effect is sufficiently stable and meets our requirements when σ n is less than 0.01.

3.2. Cross-Citation Calculation and Model Formulation
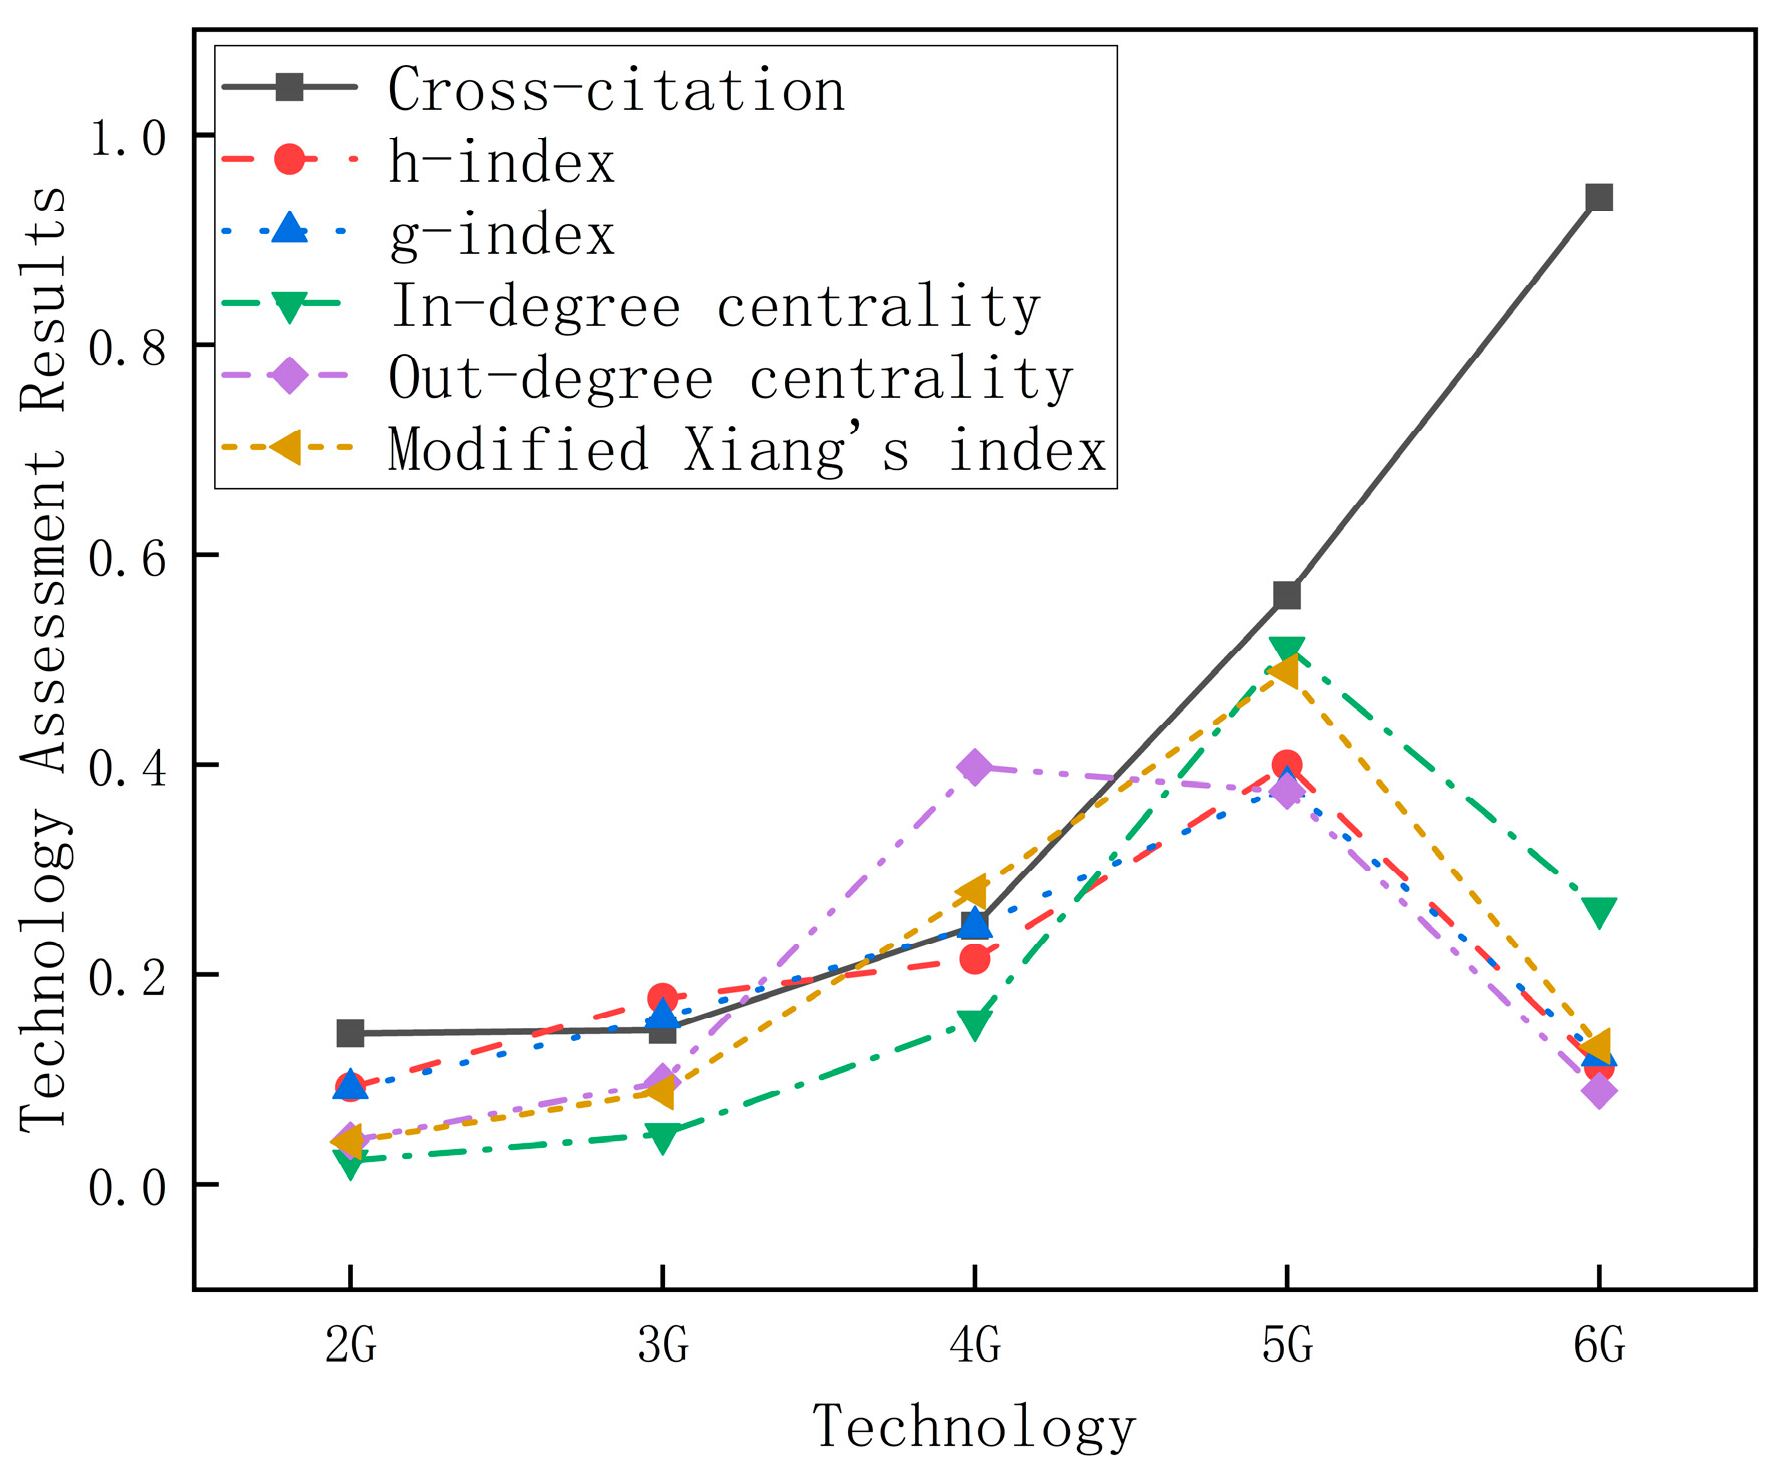
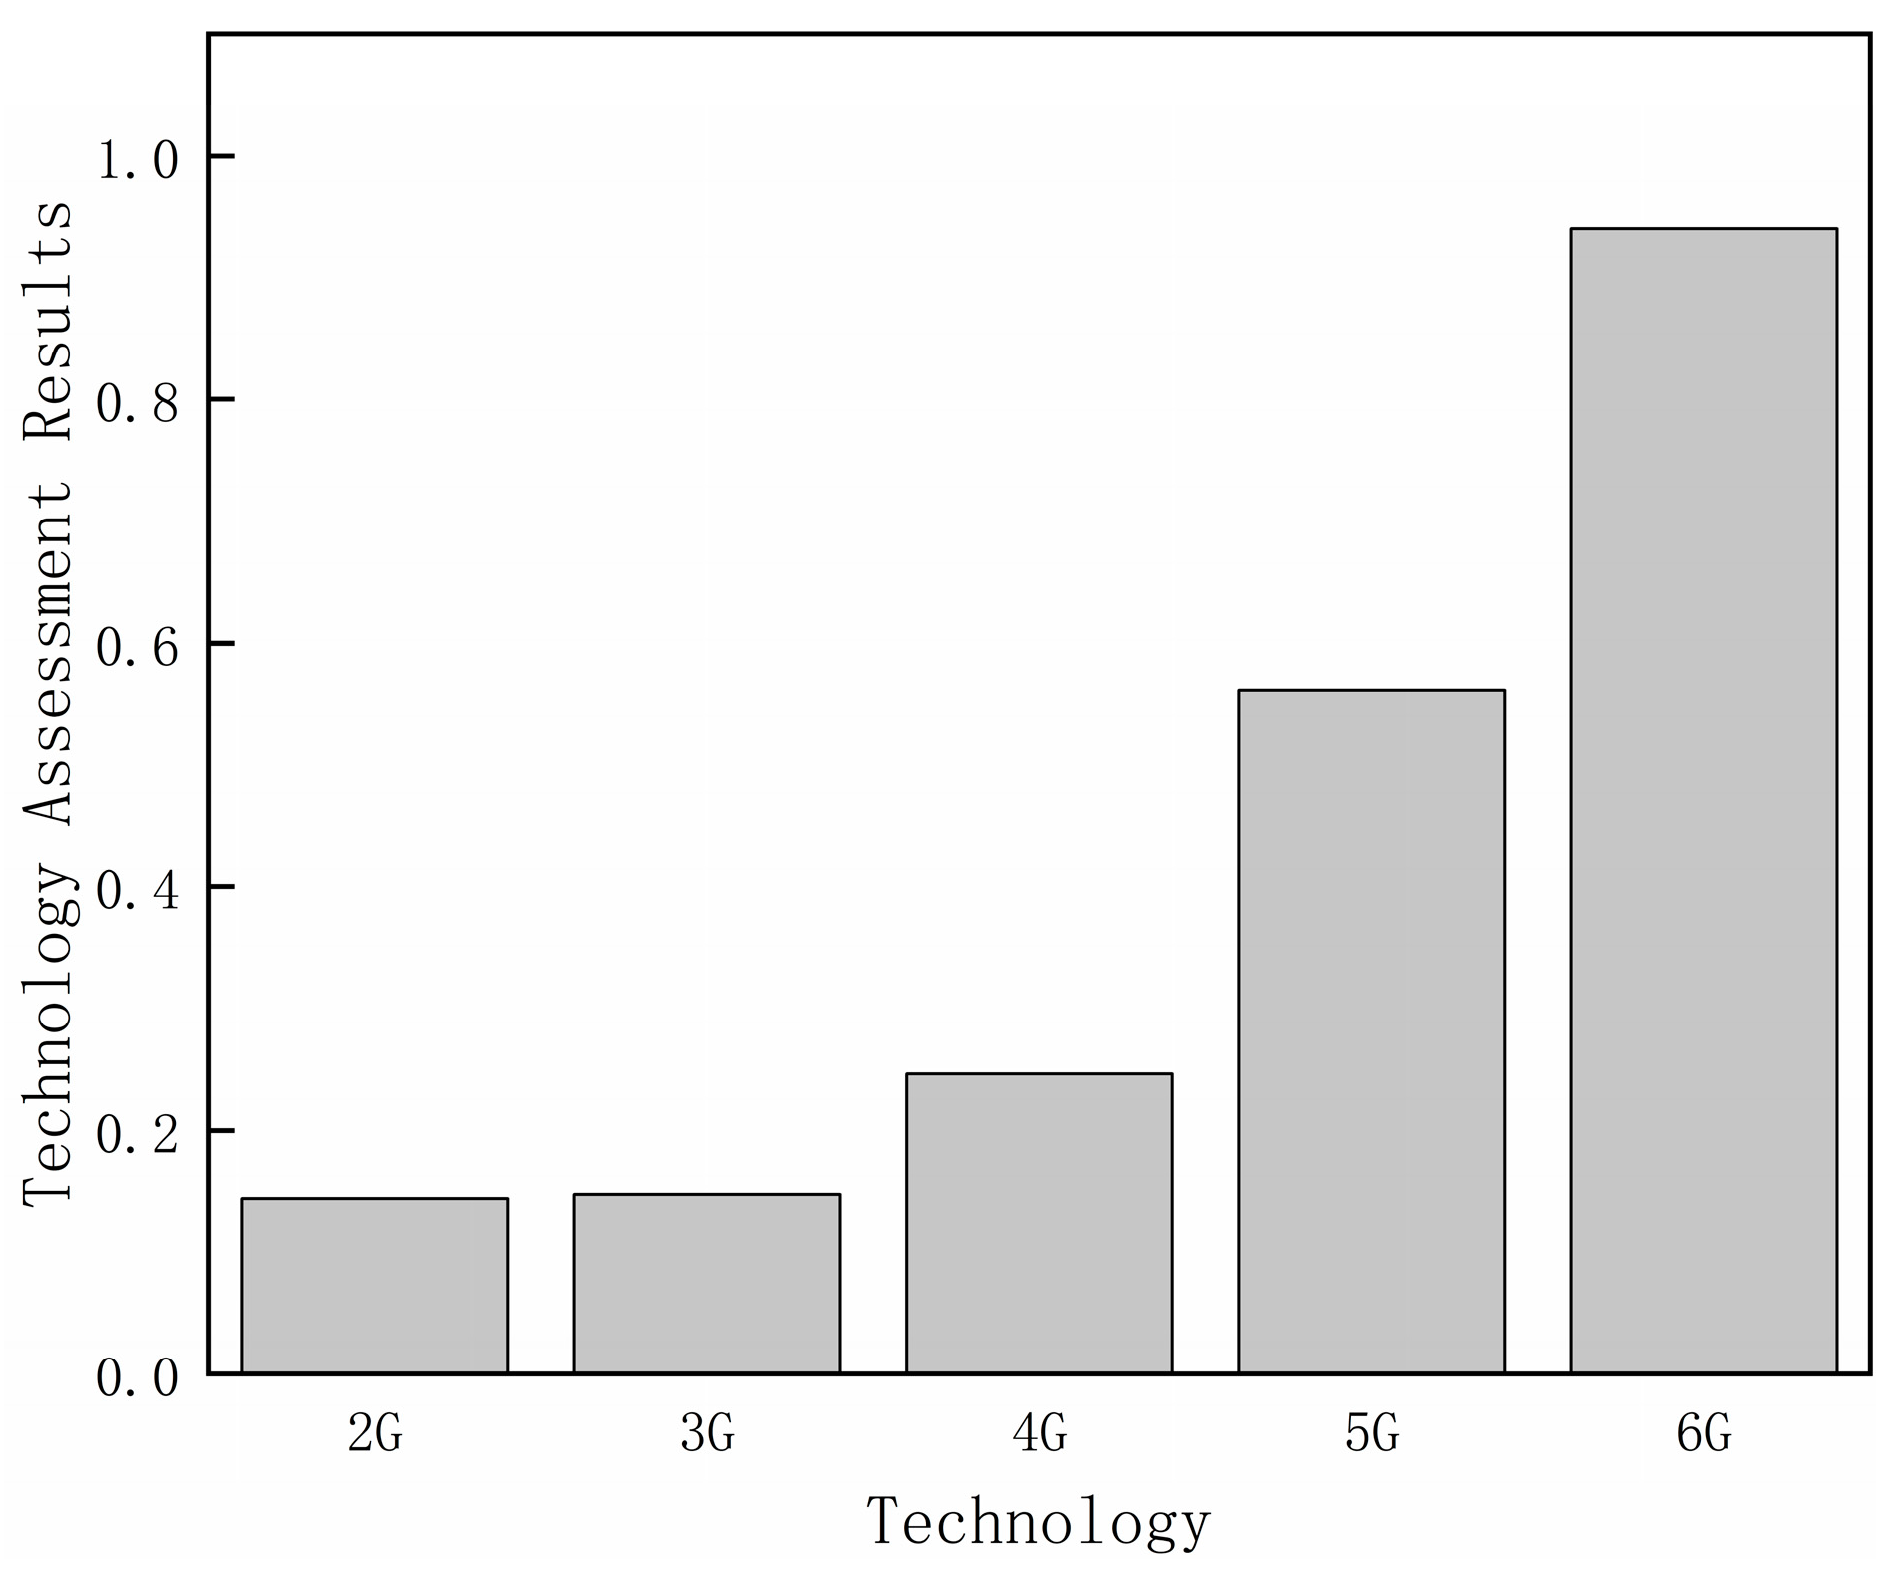
In the previous step, we preprocessed the target paper for cross-citation analysis. To obtain cross-citation data between papers corresponding to two technologies, we developed a Python script. Firstly, we extracted the DOI for each paper corresponding to technology   i and placed them all into set S i . Next, we extracted the DOIs for all references in papers corresponding to technology j and placed them all into set S j . S i m represents the m-th element in the set S i , and S j n represents the n-th element in the set S j . The citation relationship between papers associated with technology i and technology j is expressed by Equation (2), where d m n i j denotes the citation link between the two technologies. d m n i j = 1 signifies that papers on technology j cite papers on technology i . Conversely, d m n i j = 0 indicates no citation relationship, as papers and DOIs have a one-to-one correspondence. The fundamental premise of the technology assessment method presented in this paper is to evaluate the progress of specific technologies by examining the mutual citation relationships between documents related to them. Therefore, while the primary focus of this study is paper analysis, the ultimate purpose is to assess the technological advancement of specific technologies cited in the papers.
d m n i j = 1 0 ,     if     S i m = S j n otherwise
According to the citation relationship between technology i and technology j shown in Equation (2). The citation number C i j of technology j from technology i is calculated as follows:
C i j = Σ m = 1 | S i | Σ n = 1 | S j | d m n i j
The concept of cross-citation is key to our approach: the frequency with which technology i cites technology j is calculated, providing a measure of interconnectivity. Employing the formula outlined in Equation (3), we extrapolate this two-way cross-citation to encompass multiple technologies within a particular field. Consequently, we assemble a cross-citation matrix for all technologies under investigation (Table 1). In this matrix, t i represents technology i , while C i j indicates the number of times all relevant documents derived from technology j are cited by all relevant documents derived by technology i through keywords in the web of science. The subsequent analysis of this matrix facilitates a comprehensive assessment of technological advancement.
Scientific paper plays an indispensable role in portraying scientific and technological evolution, serving as the building blocks of human knowledge. Each subsequent publication references its predecessors, embodying the progressive accumulation of knowledge over time. Citation count within scientific publications not only acknowledges the intellectual debt to previous works but also establishes the context for the knowledge continuum [52,53]. Consequently, citations have become the backbone of bibliometric studies, enabling the appraisal of technological development, research performance, and the mapping of knowledge evolution or technological trajectories.
Cross-citation relationships, in particular, capture the dynamics of technological convergence and diffusion. Technological convergence manifests through backward citations (references), while diffusion is mirrored through forward citations (cited paper). The extent of knowledge integration and dissemination is thus represented by the degree of entry and exit within the citation-constructed knowledge network [54].
In-degree index r i refers to the number of times paper i cites other papers. A higher in-degree indicates that paper i cites more other papers, representing a greater momentum of knowledge convergence from other sources to paper i
r i = j = 1 ,   j i k C i j
where k denotes number of technologies.
Out-degree index c i refers to the number of times paper i is cited by other papers. A higher out degree indicates that paper i is cited more by other papers, representing a greater momentum of knowledge diffusion from paper i to other sources.
c i = j = 1 ,   j i k C j i
Hypothesis 1. 
For any two technologies  i  and j , if C i j  (the citation count from technology i  to technology   j ) exceeds C j i , it implies that technology i  may be more advanced than technology j . This is mathematically represented as:
Z i > Z j ,     i f     C i j > C j i
where  Z i ,  Z j  denotes the advancement value of technology  i  and  j , respectively.
This assumption takes its cue from the inherent properties of knowledge fusion and diffusion reflected in the out-degree centrality of citation networks. If technology i cites technology j more frequently than vice versa, then technology i is deemed more advanced. This observation is attributed to the premise that technology i harnesses the salient features of technology j to instigate a technological leap, thereby engendering a more sophisticated and advanced technology.
Following Hypothesis 1, we measure the level of technological advancement by analyzing the citation ratios within the papers associated with each technology. When assessing the technological advancement of two individual technologies, the ratio can be directly employed for quantification. However, in the case of multiple technologies, considering the mutual influence among them, quantifying the technological advancement of a specific technology entails summing the ratios of pairwise mutual citations between the corresponding paper of that technology and all other technologies. Moreover, to account for potential disparities in citation volumes among technologies and mitigate the impact of scale effects, we have introduced the logarithmic function.
When considering two technologies, their respective advancement can be discerned by their cross-citation ratio. However, for three or more technologies, the advancement measure cannot be deduced from the cross-citation ratios alone. Instead, a matrix of cross-citations is formed, as depicted in Table 1. To take advantage of the collective information of all technologies, the technological advancement index Z i is derived as follows:
Z i = 1 k 1 · i = 1 ,     i j k C i j + 1 C j i + 1 · lo g a C i j C j i + b /   i = 1 ,     i j k lo g a C i j C j i + b ,                   k 2
In this study, we account for the scale effect of a technology by computing the number of associated articles, while self-citation effect is omitted. Note that the value of parameter a does not influence the final outcomes of the technological advancement.
Proof 1. 
Z i = 1 k 1 · i = 1 ,     i j k C i j + 1 C j i + 1 · lo g a C i j C j i + b /   i = 1 ,     i j k lo g a C i j C j i + b = 1 k 1 · i = 1 ,     i j k C i j + 1 C j i + 1 · ln C i j C j i + b / ln a /   i = 1 ,     i j k ln C i j C j i + b / ln a = 1 k 1 · i = 1 ,     i j k C i j + 1 C j i + 1 · ln C i j C j i + b /   i = 1 ,     i j k ln C i j C j i + b
As a result, Z i remains the same regardless of the value of a . □
Parameter b is used to prevent negative scale effects when the reference between technologies is 0. For ease of calculation, both a and b are set to 2 in the formula.

4. Results

In this paper, we analyze the field of mobile communication technology for technology assessment. We chose this field for two main reasons. First, mobile communication technology has been a significant achievement in the development of electronic computers and the mobile internet. Over the past half-century, it has profoundly impacted various aspects of society including lifestyle, production, work, entertainment, politics, economy and culture. It is one of major technologies that have changed the world. Second, mobile communication technologies include 2G, 3G, 4G, 5G, and 6G technologies. The progression of these five technologies is relatively intuitive and clear which makes it convenient to verify the technology assessment method presented in this paper.
For this article, we selected data from published papers in the category of mobile communication technologies. The data was sourced from the Web of Science core database. The keywords used in the search were “2G”, “3G”, “4G”, “5G”, and “6G”. We acknowledge the potential for increasing the recall rate by incorporating keywords for each technology. However, after experimenting with the addition of keywords, we have opted to maintain the current approach using a single keyword. This decision is primarily based on the following considerations: Firstly, the existing retrieval strategy has already provided a sufficient dataset to fulfill the requirements of our experimentation. Secondly, the inclusion of additional keywords carries the risk of introducing a substantial amount of irrelevant data, which in turn significantly complicates the data preprocessing phase. It is important to emphasize that the quality of data preprocessing directly impacts the quality of the final technical evaluation results; the types of paper selected were conference proceedings, review papers, and online publications; the web of science categories selected were Engineering Electrical Electronic and Telecommunications; the publishers selected were IEEE, Elsevier and Springer Nature; the period from 2000 to 2022. The data was exported on 30 August 2022. Table 2 shows the amount of data collected using a search style for mobile communication technologies.
Since the number of papers for the five technologies from 2G to 6G varies significantly, this paper first determines the sample size to be used for SVM classifier learning. We trained the SVM classifier using different sample sizes for each of these five technologies. The resulting classifiers were then used to classify all paper corresponding to each technology. We calculated the variation of classification effect with sample size for paper corresponding to each technology using Equation (1). Figure 2 shows a schematic diagram of how the number of classified documents stabilizes with training sample size.
From Figure 2, we found that the classification effects of all five technologies stabilize (i.e., σ n < 0.01 ) when the sample size exceeds 700 (350 relevant papers and 350 irrelevant papers). In this paper, we uniformly chose a classification sample size of 1000 for all five technologies. We conducted 10 randomized experiments for each technology and calculated the average accuracy of these classifications. Table 3 shows the average accuracy of the 10 classifications for each technology.
Table 3 shows that using SVM to classify relevant and irrelevant paper for the five technologies is very effective. The classified paper can be used for subsequent cross-citation analysis.
We calculated the two-citation intercalation between each technology in the field of mobile communication technology using Equation (3). After obtaining the two-citation intercalation between all technologies, we generated a paper cross-citation matrix for mobile communication technology as shown in Table 4.
The matrix of interleaved quantities is entered from Table 4 into the technology assessment model corresponding to Equation (7) in this paper. This allowed us to obtain quantitative results for the advancement of each mobile communication technology as shown in Figure 3. When quantified using all years of papers, the results for technological advancement of mobile communication technologies align with our expectations in terms of size relationships. Additionally, we found that the technology assessment gap between 4G, 5G, and 6G is significantly higher than that between 2G, 3G, and 4G. This is because our paper quantifies relative technological sophistication and the latest mobile communication technologies (5G and 6G) are much more sophisticated than earlier generations (2G, 3G, and 4G).
To discern the temporal development trend of each technology, we conducted a year-by-year quantification of mobile communication technologies, initially counting the volume of relevant papers as displayed in Figure 4a. To mitigate the instability in technology assessment results due to sparse paper data, the commencement year for the assessment was set at 2010, where papers spanning 2000–2010 was considered. Moreover, the inception year needed to satisfy the condition that the annual volume of papers reached at least 1% of the technology’s total papers volume. Upon fulfilling these criteria, the assessment’s inception year was thus established as 2010 for 2G, 3G, and 4G, 2014 for 5G, and 2019 for 6G. The ensuing technology assessment results for mobile communication technologies over time are depicted in Figure 4b.
As inferred from Figure 4a, the paper volume for 2G to 4G technologies has peaked and is currently in decline, whereas the paper volume for 5G and 6G continues to exhibit a year-on-year growth. The diminished volume of paper in 2022 can be attributed to the data cut-off point on 30 August 2022, which precludes a full year’s worth of paper for 2022. Presently, the research interest in 5G markedly outstrips that of other technologies.
Turning to Figure 4b, we executed the technology assessment for the five technologies from 2010–2021, yet the 2010 technology assessment results are only applicable to 2G, 3G, and 4G. This limitation is rooted in the non-simultaneous emergence of the five technologies; only 2G, 3G, and 4G were accessible in 2010, with subsequent technologies entering the scene as time progresses (5G in 2014 and 6G in 2019). When a nascent technology is introduced into the assessment, it typically gains an immediate edge. This phenomenon stems from our cross-citation-based methodology, which lends an advantage to emerging technologies that frequently cite pre-existing ones. Concurrently, the introduction of an emergent technology may impact (typically negatively) the assessment of extant technologies. For instance, upon the entry of 5G in 2014, a sharp decline was observed in 4G’s assessment results, and a similar trend followed in 2019 when 6G entered the assessment, causing a significant dip in 5G’s results.
This pattern can be attributed to our methodology, which hinges on technology cross-citation as a quantitative metric. Intriguingly, the impact of emerging technologies on varying technological advancement values is not uniform. This variation is due to the fact that emerging technologies predominantly cite the most recent generation of technologies in their research, influencing the assessment results of preceding generation technologies in the process. Despite this, our methodology maintains a high accuracy in identifying the most advanced technologies. In fact, the highest technological assessment values from 2010 to 2021 consistently align with the most advanced technologies in practical use.
The following quantitative analysis of technological advancement using other relevant bibliometric methods further validates the reliability of the quantitative approach in this paper.

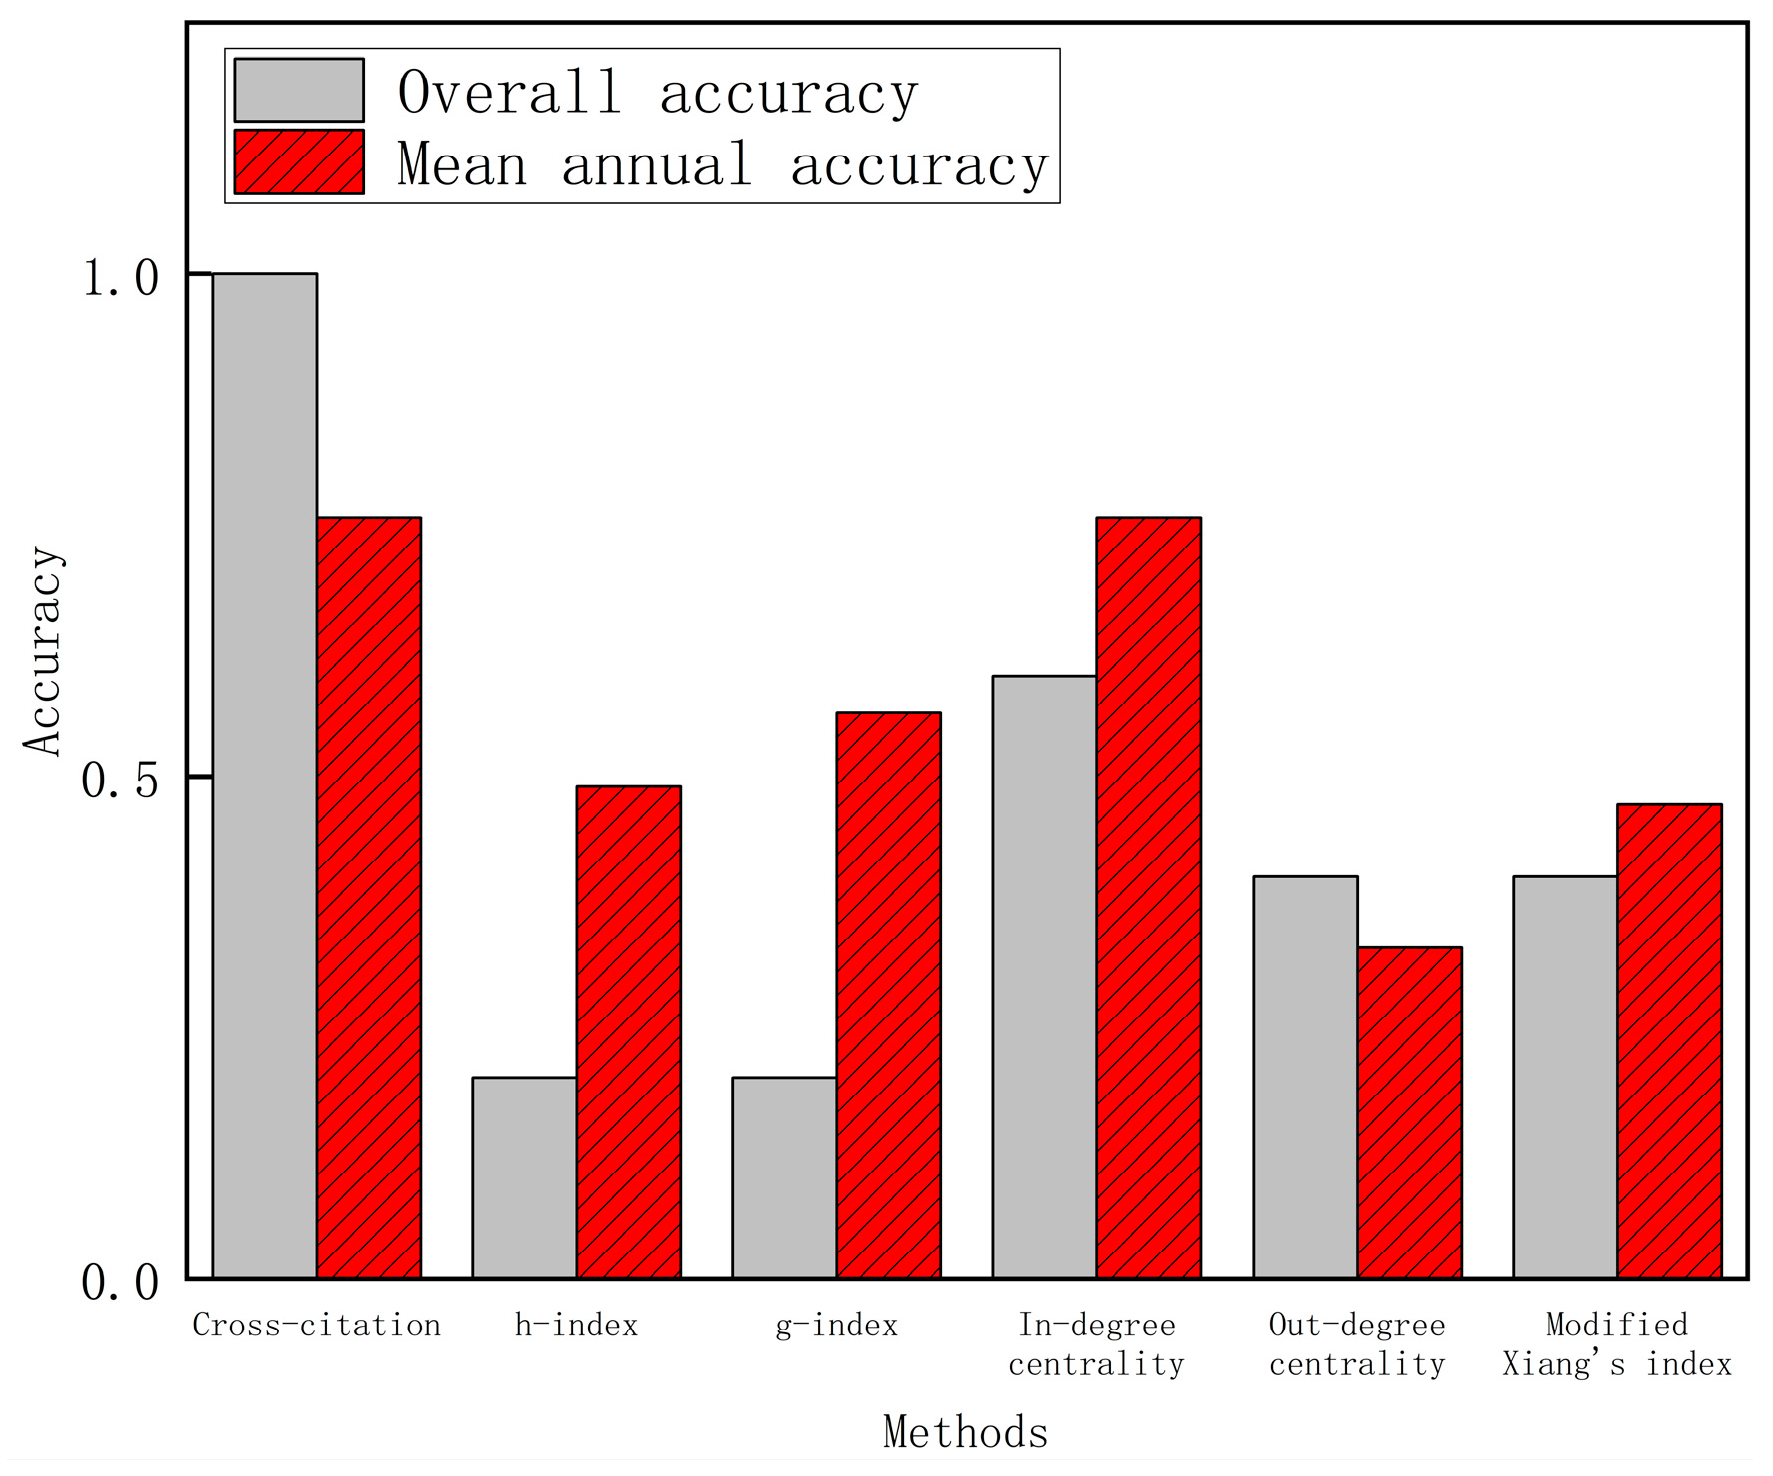
5. Comparative Analysis

To better analyze the characteristics of our proposed method, several technology assessment methods based on citation analysis are introduced to quantitatively analyze mobile communication technology. We compared the quantitative results to illustrate the advantages of our proposed method and its implications for technology assessment and forecasting work.

5.1. Method Introduction

Citation analysis has emerged as a prevalent tool in bibliometric research, serving to evaluate technological advancements, research performance, and the progression of knowledge or technological trajectories. Gutiérrez-Salcedo et al. [55] employed the h-index and g-index to delineate research focal points and technological trends. Acosta et al. [56] examined the relationship between scientific and technological growth across Spain’s regions by analyzing the links between science and technology through scientific citations in patent. Hall et al. [57] posited that, among all patent-related indicators, patent citations offer a more suitable measure for appraising market value. Stuart et al. [58] utilized patent citations to gauge technological progress and technology transfer within companies.
In knowledge networks developed via citation connections, increased centrality signifies a greater number of connections to network participants. Brass et al. [59] contended that, from an organizational behavior standpoint, an individual with higher centrality in a social network wields greater power. The network nodes directly linked to a specific node reside within that node’s domain. The quantity of neighboring nodes is termed node degree or connectivity degree. Brooks et al. [60] asserted that node degree is proportional to the likelihood of acquiring resources. Node degree represents the extent of a node’s participation in the network, serving as the foundational concept for measuring centrality. In his 2010 study, Lee evaluated the significance of technology by constructing a patent citation network to compute out-degree and in-degree centrality [54]. In the present paper, we adopt Lee’s methodology to assemble a complex network of paper citations encompassing five technologies (2G to 6G). Subsequently, we calculate the degree centrality for each technology to quantify it, and compare our findings with those obtained using our proposed method.
(1) h-index. The retrieved papers for a specific technology are ordered based on their citation frequencies. The h-index associated with the technology is defined as the value of h , such that the top h papers each have a citation frequency of at least h , while the citation frequency of the ( h + 1 ) th paper is less than ( h + 1 ) . Denoting the citation frequency of the h-th paper as x i , the mathematical representation of the h-index can be expressed as
h = max i : x i i
The h-index adeptly merges two key indicators, namely the number of publications associated with a particular technology and the citation frequency reflecting the paper’s quality. This approach overcomes the limitations of relying solely on a single indicator to quantify technological advancement.
(2) g-index. Similarly, the g-index considers the retrieved paper of technology ranked by citation frequency. The g-index is defined for a given technology such that the total number of citations garnered by the top g papers is no less than g 2 , while the total number of citations for the g + 1 th paper is less than g + 1 2 . The mathematical representation of the g-index can be expressed as
g = max i : x i i 2
(3) In-degree centrality. The ratio of the number of references to other paper in paper i to the total number of references to other papers in all paper. The higher the centrality of entry, the greater the momentum of knowledge integration from other paper to paper i . The higher the centrality of entry, the greater the momentum of knowledge integration from other papers to paper i .
r i = r i / i = 1 k r i
(4) Out-degree centrality. The ratio of the number of citations of paper i by other papers to the total number of citations of all paper. The higher the centrality, the greater the momentum of knowledge dissemination from paper i to other papers.
c i = c i / i = 1 k c i
(5) Modified Xiang’s index. Xiang employs novelty, technological breakthrough, and potential scientific impact as three metrics for measuring emerging technologies, combining the normalized values of these three indicators to derive the technology assessment results. It is important to note that the potential scientific impact metric involves expert ratings of the technology topic; therefore, we only consider the normalized values of the first two indicators for comparison. Additionally, for enhanced comparability, this study selects paper data consistent with the data type chosen in this research. The specific formula is as follows [61]:
D T = α × 1 t F γ + 1 + β × i n p C T i n p
where D T represents the outcome of the technical assessment, and α and β are adjustment coefficients for tuning the weights of each indicator. This study adopts the recommended weights by Xiang, with α set to 0.25/0.65 and β set to 0.4/0.65. t represents the current year, F γ represents the starting year of the target technology. paper i is the target paper, and paper p is the backward citation paper of paper i . C T i represents the count of citations in paper p that reference paper i , and n p represents the total number of paper p .
Although the h-index, g-index, out-degree centrality, and in-degree centrality are typically not directly employed for technical evaluations, they do hold relevance. The h-index and g-index are commonly utilized to gauge academic influence, while the centrality metrics within the scientific paper citation network reflect the importance of research contributions, a factor closely intertwined with technological progress. This allows us to assess the advanced nature of a specific technology based on its academic influence and the significance of associated paper. The modified Xiang’s index approach involves selecting indicators relevant to the technology and conducting a comprehensive calculation by allocating weights to the chosen indicators. In light of our technology evaluation results, we can now compare them with the outcomes obtained through the five methods mentioned above.

5.2. Results Comparison

The assessment outcomes employing the h-index and g-index are illustrated in Figure 5a,b. To enhance comparability, we transformed the h-index and g-index for each technology into percentages relative to the collective h-index and g-index for all five technologies.
Figure 5a,b indicate that the h-index and g-index provide accurate technological progression measures for technologies with a longer developmental duration, such as 2G to 5G. Nevertheless, for 6G, a technology with a shorter developmental timeline, the outcomes diverge from reality due to the restricted volume of paper. The quantification results of mobile communication technology using in-degree centrality are delineated in Figure 5c,d. These figures reveal that while in-degree centrality proves effective in quantifying technologies like 2G, 3G, and 4G, it underperforms for 5G and 6G, as evidenced by marked discrepancies with the actual situation. When resorting to out-degree centrality solely for the quantification of mobile communication technologies, the size relationship of the quantification outcomes over time appears distorted, leading to subpar quantification.
The technology assessment results using the modified Xiang’s Index method are illustrated in Figure 5e. The assessments for 2G and 3G appear reasonable, with 4G showing a deceleration in development speed following the emergence of 5G. The development trend for 5G exhibits a recent rapid growth. However, a notable deviation is observed in the assessment of 6G technology. While it initially led the evaluation in the first year of inclusion in 2019, it has since experienced a continuous decline. This discrepancy with reality is primarily attributed to the relatively recent appearance of paper on 6G technology. The technological breakthrough indicator for 6G is notably lower due to its limited citations compared to other technologies, coupled with the explosive growth in the paper on 5G in recent years.
Figure 6 contrasts the results obtained by each technology assessment method for 2G–6G technologies over the entire duration. The method proposed in this study yielded reasonably accurate results; however, the assessment rankings obtained through the use of five other methods failed to precisely reflect the actual scenario. This inaccuracy is particularly notable in the 6G assessment results, which are deemed inferior among the 2G–6G technologies when gauged using the other five methods, i.e., h-index, g-index, In-degree centrality, Out-degree centrality, and modified Xiang’s index. Specifically, 4G is prioritized when using in-degree centrality for technology assessment, while the remaining four methods consistently favor 5G. This inconsistency is ascribed to the five alternate technology assessment methods’ reliance on the quantity of publications and citations (both citation and cited quantities). Conversely, our study introduces a cross-citation method that examines technology from the perspective of knowledge flow, yielding a more agile and precise assessment.
Figure 7 illustrates the aggregate accuracy and mean annual accuracy of the ranking, resulting from the implementation of our proposed method in conjunction with the other four assessment techniques. As can be observed in Figure 7, the highest accuracy rates are realized when employing the method proposed in this paper. Particularly, our method, paired with in-degree centrality, delivers optimal results in terms of mean annual accuracy. Of significance is the remarkable overall accuracy, reaching a 100% score, yielded by our cross-citation-based method, a figure considerably superior to the other four methods.
Upon utilizing the five methods of h-index, g-index, in-degree centrality, out-degree centrality, and modified Xiang’s index for technology assessment, the average level of overall and mean annual accuracy falls short when compared to our cross-citation-based approach. This stems from the fact that an accurate measure of technological progression using h-index and g-index requires an extended duration of technological development and an ample corpus of papers. Conversely, the singular reliance on access centrality in quantifying technological progress presents an inherent bias. More citations to a technology’s papers signify stronger diffusion momentum, while more citations to other paper suggest a stronger convergence momentum. Nevertheless, neither diffusion nor convergence momentum directly corresponds with technological advancement. The modified Xiang’s index method has introduced temporal indicators, the technology breakthrough metric places greater emphasis on the citation count of the paper, neglecting the quantity of paper citing other publications.
Our proposed cross-citation-based approach addresses these issues by integrating cited and citing data to measure technological advancement, employing a blend of diffusion and convergence momentum. The primary innovation of our method lies in its ability to identify the optimal technology in a given field for each period, boasting an impressive 100% accuracy rate and high stability, thereby outperforming alternative methods.

6. Conclusions and Prospect

6.1. Conclusions

In this paper, we conduct a technology assessment by analyzing the cross-citations among the paper associated with each technology. This approach enables us to identify the relative advantages of emerging technologies within a specific domain and forecast the future development trends of various technologies in that field. The proposed technology assessment model based on cross-citation integrates both out-degree and in-degree metrics, addressing the limitations associated with solely using either out-degree or in-degree for technological assessment. Simultaneously, it resolves challenges posed by the stringent requirements for paper accumulation when employing h-index and g-index in technological assessments. It is noteworthy that the relatively nascent modified Xiang’s index method, despite introducing a temporal dimension to characterize technological novelty, encounters similar limitations as using out-degree centrality alone when relying solely on the citation quantity for the technological breakthrough metric. Cross-citation effectively mitigates the drawbacks associated with the aforementioned five methods. While the technological quantification approach presented in this paper exhibits significant advantages, it is not without certain limitations.
On the one hand, the publication of paper generally appears several months later than the technology recorded on the paper record, which creates a time gap between the paper record and the technology development. On the other hand, technology development is influenced by scientific, technological, social, economic, and policy factors. It’s important to note that not all of these factors can be considered when evaluating the technology using the method described in this paper.
The premise of quantifying technological advancement based on the amount of cross-citation is that there are at least two technologies, and the quantification formula in this paper cannot be quantified in the face of a single technology. In the future, we can try to integrate more factors related to technological relevance in the quantification work to optimize the quantification results of technological advancement.
Since the data source of this paper is the scientific paper, this leads to the fact that, the technology quantification work done in this paper can only quantify the past tense, and the method cannot be implemented for the quantification results of the existing technologies at a certain period in the future.

6.2. Prospect

The quantification of technology through cross-citations among paper is not effective in individual cases due to the reasons mentioned above, but it is one of the influential and effective methods in technology quantification work. To overcome these limitations, other evaluation indicators that have an impact on technological advancement can be considered with cross-citation as the main indicator.
Time-series analysis. The novelty of technology, as a crucial indicator for assessing technological advancements, can be incorporated into our technology evaluation through time series analysis, enhancing the robustness and rationality of our assessment results.
Hot spots of technological development. Journals and magazines have collected various technical paper according to the principle of discipline classification or theme, and through the comparative analysis of the changes in the volume of its various types of paper or to understand the increase or decrease in the category and the reasons, from which to study the focus of technological development and the frontier of possible breakthroughs.
In addition, this paper has analyzed the change in the quantitative results of mobile communication technology with the year, and the next step can predict the technological advancement of existing technologies after 5 years and 10 years based on the technology assessment results of existing years.

Author Contributions

Conceptualization: Y.X. and S.T.; Methodology: Y.X. and S.T.; Formal Analysis: S.T.; Writing—Original Draft: S.T.; Writing—Review and Editing: Y.X.; Project Administration: M.C.; Funding Acquisition: M.C. All authors have read and agreed to the published version of the manuscript.

Funding

The paper was funded by the National Key R&D Program of China [grant number 2020YFB1600400].

Institutional Review Board Statement

Not applicable.

Informed Consent Statement

Not applicable.

Data Availability Statement

Data are contained within the article.

Conflicts of Interest

The authors declare no conflict of interest.

References

  1. Zhang, J.; Wang, Q.; Qiu, M. Review of Studies Identifying Disruptive Technologies. Data Anal. Knowl. Discov. 2022, 6, 12–31. [Google Scholar] [CrossRef]
  2. Ronzhyn, A.; Wimmer, M.A.; Spitzer, V.; Pereira, G.V.; Alexopoulos, C. Using Disruptive Technologies in Government: Identification of Research and Training Needs. In Proceedings of the 18th IFIP WG 8.5 International Conference on Electronic Government (EGOV), San Benedetto Del Tronto, Italy, 2–4 September 2019; University of Camerino: San Benedetto Del Tronto, Italy, 2019; pp. 276–287. [Google Scholar]
  3. Stoiciu, A.; Szabo, E.; Totev, M.; Wittmann, K.; Hampl, N. Assessing the Disruptiveness of New Energy Technologies—An Ex-Ante Perspective; WU Vienna University of Economics and Business: Wien, Vienna, 2014. [Google Scholar]
  4. Keller, A.; Hüsig, S. Ex ante identification of disruptive innovations in the software industry applied to web applications: The case of Microsoft’s vs. Google’s office applications. Technol. Forecast. Soc. Chang. 2009, 76, 1044–1054. [Google Scholar] [CrossRef]
  5. Guo, J.; Pan, J.; Guo, J.; Gu, F.; Kuusisto, J. Measurement framework for assessing disruptive innovations. Technol. Forecast. Soc. Chang. 2019, 139, 250–265. [Google Scholar] [CrossRef]
  6. Sun, J.; Gao, J.; Yang, B.; Tan, R. Achieving disruptive innovation-forecasting potential technologies based upon technical system evolution by TRIZ. In Proceedings of the 2008 4th IEEE International Conference on Management of Innovation and Technology, Bangkok, Thailand, 21–24 September 2008; pp. 18–22. [Google Scholar]
  7. Anderson, T.R.; Daim, T.U.; Kim, J. Technology forecasting for wireless communication. Technovation 2008, 28, 602–614. [Google Scholar] [CrossRef]
  8. Jia, W.; Xie, Y.; Zhao, Y.; Yao, K.; Shi, H.; Chong, D. Research on disruptive technology recognition of China’s electronic information and communication industry based on patent influence. J. Glob. Inf. Manag. 2021, 29, 148–165. [Google Scholar] [CrossRef]
  9. Dotsika, F.; Watkins, A. Identifying potentially disruptive trends by means of keyword network analysis. Technol. Forecast. Soc. Chang. 2017, 119, 114–127. [Google Scholar] [CrossRef]
  10. Breiner, S.; Cuhls, K.; Grupp, H. Technology foresight using a Delphi approach: A Japanese-German co-operation. RD Manag. 1994, 24, 141–153. [Google Scholar] [CrossRef]
  11. Dawood, K.A.; Sharif, K.Y.; Ghani, A.A.; Zulzalil, H.; Zaidan, A.A.; Zaidan, B.B. Towards a unified criteria model for usability evaluation in the context of open source software based on a fuzzy Delphi method. Inf. Softw. Technol. 2021, 130, 15. [Google Scholar] [CrossRef]
  12. Alharbi, M.G.; Khalifa, H.A. Enhanced Fuzzy Delphi Method in Forecasting and Decision-Making. Adv. Fuzzy Syst. 2021, 2021, 6. [Google Scholar] [CrossRef]
  13. Salais-Fierro, T.E.; Saucedo-Martinez, J.A.; Rodriguez-Aguilar, R.; Vela-Haro, J.M. Demand Prediction Using a Soft-Computing Approach: A Case Study of Automotive Industry. Appl. Sci. 2020, 10, 829. [Google Scholar] [CrossRef]
  14. Stilic, A.; Puska, E.; Puska, A.; Bozanic, D. An Expert-Opinion-Based Evaluation Framework for Sustainable Technology-Enhanced Learning Using Z-Numbers and Fuzzy Logarithm Methodology of Additive Weights. Sustainability 2023, 15, 12253. [Google Scholar] [CrossRef]
  15. Wang, K.; Ying, Z.; Goswami, S.S.; Yin, Y.; Zhao, Y. Investigating the Role of Artificial Intelligence Technologies in the Construction Industry Using a Delphi-ANP-TOPSIS Hybrid MCDM Concept under a Fuzzy Environment. Sustainability 2023, 15, 11848. [Google Scholar] [CrossRef]
  16. Suominen, A.; Hajikhani, A.; Ahola, A.; Kurogi, Y.; Urashima, K. A quantitative and qualitative approach on the evaluation of technological pathways: A comparative national-scale Delphi study. Futures 2022, 140, 102967. [Google Scholar] [CrossRef]
  17. Winebrake, J.J.; Creswick, B.P. The future of hydrogen fueling systems for transportation: An application of perspective-based scenario analysis using the analytic hierarchy process. Technol. Forecast. Soc. Chang. 2003, 70, 359–384. [Google Scholar] [CrossRef]
  18. Banuls, V.A.; Salmeron, J.L. A Scenario-Based Assessment Model—SBAM. Technol. Forecast. Soc. Chang. 2007, 74, 750–762. [Google Scholar] [CrossRef]
  19. Guo, Y.; Yu, Y.D.; Ren, H.T.; Xu, L. Scenario-based DEA assessment of energy-saving technological combinations in aluminum industry. J. Clean. Prod. 2020, 260, 11. [Google Scholar] [CrossRef]
  20. Hussain, A.; Perwez, U.; Ullah, K.; Kim, C.H.; Asghar, N. Long-term scenario pathways to assess the potential of best available technologies and cost reduction of avoided carbon emissions in an existing 100% renewable regional power system: A case study of Gilgit-Baltistan (GB), Pakistan. Energy 2021, 221, 14. [Google Scholar] [CrossRef]
  21. Gómez-Sanabria, A.; Zusman, E.; Höglund-Isaksson, L.; Klimont, Z.; Lee, S.Y.; Akahoshi, K.; Farzaneh, H.; Chairunnisa. Sustainable wastewater management in Indonesia’s fish processing industry: Bringing governance into scenario analysis. J. Environ. Manag. 2020, 275, 9. [Google Scholar] [CrossRef]
  22. de Gelder, E.; Hof, J.; Cator, E.; Paardekooper, J.P.; Op den Camp, O.; Ploeg, J.; de Schutter, B. Scenario Parameter Generation Method and Scenario Representativeness Metric for Scenario-Based Assessment of Automated Vehicles. IEEE Trans. Intell. Transp. Syst. 2022, 23, 18794–18807. [Google Scholar] [CrossRef]
  23. Ghazinoory, S.; Saghafi, F.; Kousari, S. Ex-post evaluation of scenarios: The case of nanotechnology societal impacts. Qual. Quant. 2016, 50, 1349–1365. [Google Scholar] [CrossRef]
  24. Kanama, D. A Japanese experience of a mission-oriented multi-methodology technology foresight process: An empirical trial of a new technology foresight process by integration of the Delphi method and scenario writing. Int. J. Technol. Intell. Plan. 2010, 6, 253–267. [Google Scholar] [CrossRef]
  25. Lough, W.T.; White, K.P., Jr. A technology assessment methodology for electric utility planning in the United States. Technol. Forecast. Soc. Chang. 1988, 34, 53–67. [Google Scholar] [CrossRef]
  26. Nguyen, N.T.; LobetMaris, C.; Berleur, J.; Kusters, B. Methodological issues in information technology assessment. Int. J. Technol. Manag. 1996, 11, 566–580. [Google Scholar]
  27. Berg, M.; Chen, K.; Zissis, G. A value-oriented policy generation methodology for technology assessment. Technol. Forecast. Soc. Chang. 1976, 8, 401–420. [Google Scholar] [CrossRef]
  28. McDonald, A.; Schrattenholzer, L. Learning curves and technology assessment. Int. J. Technol. Manag. 2002, 23, 718–745. [Google Scholar] [CrossRef]
  29. Liang, H.; Ren, J.; Lin, R.; Liu, Y. Alternative-fuel based vehicles for sustainable transportation: A fuzzy group decision supporting framework for sustainability prioritization. Technol. Forecast. Soc. Chang. 2019, 140, 33–43. [Google Scholar] [CrossRef]
  30. Dahooie, J.H.; Qorbani, A.R.; Daim, T. Providing a framework for selecting the appropriate method of technology acquisition considering uncertainty in hierarchical group decision-making: Case Study: Interactive television technology. Technol. Forecast. Soc. Chang. 2021, 168, 20. [Google Scholar] [CrossRef]
  31. Zeng, S.Z.; Zhang, N.; Zhang, C.H.; Su, W.H.; Carlos, L.A. Social network multiple-criteria decision-making approach for evaluating unmanned ground delivery vehicles under the Pythagorean fuzzy environment. Technol. Forecast. Soc. Chang. 2022, 175, 19. [Google Scholar] [CrossRef]
  32. Dahooie, J.H.; Raafat, R.; Qorbani, A.R.; Daim, T. An intuitionistic fuzzy data-driven product ranking model using sentiment analysis and multi-criteria decision-making. Technol. Forecast. Soc. Chang. 2021, 173, 15. [Google Scholar] [CrossRef]
  33. Lizarralde, R.; Ganzarain, J. A Multicriteria Decision Model for the Evaluation and Selection of Technologies in a R&D Centre. Int. J. Prod. Manag. Eng. 2019, 7, 101–106. [Google Scholar] [CrossRef]
  34. Huang, X.; Zhan, J.; Sun, B. A three-way decision method with pre-order relations. Inf. Sci. 2022, 595, 231–256. [Google Scholar] [CrossRef]
  35. Du, Y.-W.; Zhong, J.-J. Dynamic multicriteria group decision-making method with automatic reliability and weight calculation. Inf. Sci. 2023, 634, 400–422. [Google Scholar] [CrossRef]
  36. Kamble, S.J.; Singh, A.; Kharat, M.G. Life cycle analysis and sustainability assessment of advanced wastewater treatment technologies. World J. Sci. Technol. Sustain. Dev. 2018, 15, 169–185. [Google Scholar] [CrossRef]
  37. Gill, A.Q.; Bunker, D. Towards the development of a cloud-based communication technologies assessment tool: An analysis of practitioners’ perspectives. Vine 2013, 43, 57–77. [Google Scholar] [CrossRef]
  38. Melchiorsen, P.M. Bibliometric differences—A case study in bibliometric evaluation across SSH and STEM. J. Doc. 2019, 75, 366–378. [Google Scholar] [CrossRef]
  39. Wang, Y.Q.; Chen, Y.; Wang, Z.Q.; Wang, K.; Song, K. A Novel Metric for Assessing National Strength in Scientific Research: Understanding China’s Research Output in Quantum Technology through Collaboration. J. Data Inf. Sci. 2022, 7, 39–60. [Google Scholar] [CrossRef]
  40. Almufarreh, A.; Arshad, M. Promising Emerging Technologies for Teaching and Learning: Recent Developments and Future Challenges. Sustainability 2023, 15, 6917. [Google Scholar] [CrossRef]
  41. Zhang, W.; Yang, Y.T.; Liang, H.G. A Bibliometric Analysis of Enterprise Social Media in Digital Economy: Research Hotspots and Trends. Sustainability 2023, 15, 12545. [Google Scholar] [CrossRef]
  42. Park, I.; Yoon, B. Technological opportunity discovery for technological convergence based on the prediction of technology knowledge flow in a citation network. J. Informetr. 2018, 12, 1199–1222. [Google Scholar] [CrossRef]
  43. Carpenter, M.P.; Narin, F.; Woolf, P. Citation rates to technologically important patents. World Pat. Inf. 1981, 3, 160–163. [Google Scholar] [CrossRef]
  44. Carpenter, M.P.; Cooper, M.; Narin, F. Linkage between basic research literature and patents. Res. Manag. 1980, 23, 30–35. [Google Scholar] [CrossRef]
  45. Narin, F.; Noma, E. Is technology becoming science? Scientometrics 1985, 7, 369–381. [Google Scholar] [CrossRef]
  46. Narin, F.; Hamilton, K.S.; Olivastro, D. The increasing linkage between US technology and public science. In Proceedings of the 22nd AAAS Science and Technology Policy Colloquium, Washington, DC, USA, 23–25 April 1997; American Association for the Advancement of Science: Washington, DC, USA, 1997; pp. 101–121. [Google Scholar]
  47. Chen, L.X. Do patent citations indicate knowledge linkage? The evidence from text similarities between patents and their citations. J. Informetr. 2017, 11, 63–79. [Google Scholar] [CrossRef]
  48. Zogala-Siudem, B.; Cena, A.; Siudem, G.; Gagolewski, M. Interpretable reparameterisations of citation models. J. Informetr. 2023, 17, 11. [Google Scholar] [CrossRef]
  49. van Raan Anthony, F.J. Patent Citations Analysis and Its Value in Research Evaluation: A Review and a New Approach to Map Technology-relevant Research. J. Data Inf. Sci. 2017, 2, 13–50. [Google Scholar] [CrossRef]
  50. Hammarfelt, B. Linking science to technology: The “patent paper citation” and the rise of patentometrics in the 1980s. J. Doc. 2021, 77, 1413–1429. [Google Scholar] [CrossRef]
  51. Venugopalan, S.; Rai, V. Topic based classification and pattern identification in patents. Technol. Forecast. Soc. Chang. 2015, 94, 236–250. [Google Scholar] [CrossRef]
  52. Jaffe, A.B.; Trajtenberg, M.; Henderson, R. Geographic localization of knowledge spillovers as evidenced by patent citations. Q. J. Econ. 1993, 108, 577–598. [Google Scholar] [CrossRef]
  53. Chang, S.B.; Lai, K.K.; Chang, S.M. Exploring technology diffusion and classification of business methods: Using the patent citation network. Technol. Forecast. Soc. Chang. 2009, 76, 107–117. [Google Scholar] [CrossRef]
  54. Lee, P.C.; Su, H.N.; Wu, F.S. Quantitative mapping of patented technology—The case of electrical conducting polymer nanocomposite. Technol. Forecast. Soc. Chang. 2010, 77, 466–478. [Google Scholar] [CrossRef]
  55. Gutiérrez-Salcedo, M.; Martínez, M.A.; Moral-Munoz, J.A.; Herrera-Viedma, E.; Cobo, M.J. Some bibliometric procedures for analyzing and evaluating research fields. Appl. Intell. 2018, 48, 1275–1287. [Google Scholar] [CrossRef]
  56. Acosta, M.; Coronado, D. Science-technology flows in Spanish regions—An analysis of scientific citations in patents. Res. Policy 2003, 32, 1783–1803. [Google Scholar] [CrossRef]
  57. Hall, B.H.; Jaffe, A.; Trajtenberg, M. Market value and patent citations. Rand J. Econ. 2005, 36, 16–38. [Google Scholar]
  58. Stuart, T.E.; Podolny, J.M. Local search and the evolution of technological capabilities. Strateg. Manag. J. 1996, 17, 21–38. [Google Scholar] [CrossRef]
  59. Brass, D.J.; Burkhardt, M.E. Centrality and Power in Organizations. In Proceedings of the Conference on Networks and Organizations: Structure, Form and Action, Boston, MA, USA, 1990; Harvard Business School Press: Boston, MA, USA, 1992; pp. 198–213. Available online: https://webofscience.clarivate.cn/wos/alldb/full-record/WOS:A1992BX72H00008 (accessed on 9 November 2023).
  60. Brooks, B.A. The Strength of Weak Ties. Nurse Lead. 2019, 17, 90–92. [Google Scholar] [CrossRef]
  61. Xiang, M.; Fu, D.; Lv, K. Identifying and Predicting Trends of Disruptive Technologies: An Empirical Study Based on Text Mining and Time Series Forecasting. Sustainability 2023, 15, 5412. [Google Scholar] [CrossRef]
Figure 1. The schematic diagram illustrating the methodology of this study.
Sustainability 16 00435 g001
Figure 2. The relationship between the stability of mobile communication technology classification and sample size.
Sustainability 16 00435 g002
Figure 3. Mobile Communication Technology Assessment Results.
Sustainability 16 00435 g003
Figure 4. Results of mobile communication technology over the years. (a) Paper volume (b) Technology assessment.
Sustainability 16 00435 g004
Figure 5. Technology assessment results of mobile communication technologies using h-index (a), g-index (b), In-degree centrality (c), Out-degree centrality (d), and modified Xiang’s index (e) methods.
Sustainability 16 00435 g005
Figure 6. Comparison of the outcomes procured by each technology assessment method throughout the entire duration.
Sustainability 16 00435 g006
Figure 7. The overall accuracy and mean annual accuracy of technology assessment ranking.
Sustainability 16 00435 g007
Table 1. Cross-citation matrix of paper corresponding to technology.
t 1 t 2 t i t j
t 1 - C 1 2 C 1 i C 1 j
t 2 C 2 1 - C 2 i C 2 j
-
t i C i 1 C i 2 - C i j
-
t j C j 1 C j 2 C j i -
Table 2. The initial volume of papers was retrieved by search formula for mobile communication technology.
Technology2G3G4G5G6G
Volume of
Papers
51527967786633,0505281
Table 3. Average of 10-test accuracy of the five technologies on the SVM classifier.
Technology2G3G4G5G6G
Accuracy0.98670.93670.99600.97670.9965
Table 4. Matrix of paper cross-citations corresponding to mobile communication technologies.
2G3G4G5G6G
2G-4172312596
3G451-74273024
4G4031427-4132110
5G739227113,729-2159
6G17545255819-
Disclaimer/Publisher’s Note: The statements, opinions and data contained in all publications are solely those of the individual author(s) and contributor(s) and not of MDPI and/or the editor(s). MDPI and/or the editor(s) disclaim responsibility for any injury to people or property resulting from any ideas, methods, instructions or products referred to in the content.

