Abstract
Life cycle assessment (LCA) plays an increasingly important role in environmental management, particularly in promoting energy and carbon-conscious practices across various disciplines. This review provides an overview of the latest innovations and potential benefits of integrating LCA into ecological slope treatment strategies. This study explores new developments in LCA methodology and its application to slope treatment, aiming to improve the integration of infrastructure development and environmental stewardship. Through an extensive review of over 120 peer-reviewed journal articles and a critical analysis of the intersection of LCA with slope treatment, this paper identifies innovative techniques that have the potential to significantly reduce the environmental impact of slope management. The review emphasizes advanced LCA practices that quantify and mitigate carbon emissions throughout the life cycle stages of slope treatments. Key findings demonstrate that LCA enhances the methodological rigor in assessing ecosystem services and impacts, and reveals new strategies that emphasize the importance of ecological considerations in infrastructure projects. Future research directions focus on refining LCA data acquisition and promoting a standardized knowledge base to support precision in ecological impact assessments. In conclusion, the adoption of LCA in slope treatment is imperative for aligning industry practices with global sustainability targets, emphasizing the importance of integrating uncertainty analysis and long-term impact assessments to bolster the credibility of LCA outcomes.
1. Introduction
Transportation infrastructure development plays a crucial role in connecting communities and facilitating global economic growth. However, the construction of such infrastructure often involves extensive excavation and landfill activities in mountainous regions [1]. These activities can have a profound impact on the original landscapes and contribute to potential geological disasters, further exacerbating the degradation of the ecological environment and ecosystem [2]. Traditional slope treatment approaches have primarily focused on immediate mechanical stabilization, with little consideration for the long-term ecological or social consequences [3]. Consequently, many of these practices have inadvertently transferred environmental burdens to different times and locations.
In light of growing concerns regarding climate change and the finite availability of natural resources, it is imperative that modern slope treatment practices align with the principles of sustainable development. The attainment of environmentally sound, economically viable, and socially equitable infrastructure necessitates a holistic and long-term perspective on the impacts and tradeoffs associated with projects [4]. Life cycle assessment (LCA) has emerged as a standardized framework for comprehensively evaluating the environmental impact of products, processes, and technologies throughout their entire life cycle [5]. By quantifying resource use, emissions, and other environmental issues associated with a system from raw material extraction to its disposal, LCA aims to prevent the shifting of problems among assessment boundaries or phases [6]. Against the backdrop of global energy conservation and carbon reduction efforts, LCA research has found widespread application in fields such as the chemical industry, civil engineering, agriculture, material science, and biological science [7]. However, despite the rapid proliferation of LCA studies across many industries, its application in geotechnical engineering domains like slope treatment has remained limited.
With an increasing awareness and emphasis on ecological and environmental preservation, the focus of slope treatment has shifted towards maximizing both ecological and economic benefits [8]. Ecological slope treatment technologies concentrate on vegetation planting and ecosystem restoration to achieve slope stability and environmental protection. These technologies are widely employed worldwide, and include artificial vegetation [9], planting bags [10], hydraulic spray seeding [11], grass planting technology [12], frame engineering [13], ecological vegetation restoration technology [14], and three-dimensional vegetation network technology [15]. Additionally, four innovative slope treatment technologies have emerged: willow pole planting, fiber-reinforced soil, electric geosynthesis, and particle filler replacement (control) [16]. To further enhance the assessment and design of slope treatment strategies, the systematic and rigorous application of life cycle assessment (LCA) holds substantial promise. LCA offers a comprehensive framework for evaluating the environmental performance of slope treatment solutions. By considering multiple impacts and phases, LCA can help maximize overall environmental performance, minimize externalized costs, and reveal previously hidden tradeoffs between stabilization solutions. Existing LCA research on slope treatment has generally focused narrowly on specific techniques or phases, rather than holistically appraising entire life cycles [17]. Methodological issues like inconsistent system boundary definitions, data gaps, and lack of consensus on impact assessment models also constrain robust multi-study comparisons [18]. These shortcomings impair industry understanding of slope treatment environmental tradeoffs and hinder transition towards optimized eco-efficient solutions.
The specific aim of this paper is to present the latest developments and expected advantages of utilizing life cycle assessment (LCA) for slope treatment. The authors of this study concentrated on literature containing keywords such as “LCA”, “slope treatment”, “ecological slope”, “carbon emission”, “environmental management”, and “sustainable development”. Several reputable scientific databases, including “Web of Science”, “Google Scholar”, “Science Direct”, “Science Citation Index”, and Scopus, were utilized for the literature search. More than 120 publications on LCA in slope treatment have been reviewed in this study, covering LCA aspects, various slope treatment technologies, carbon emission studies, and future directions.
This study provides a comprehensive review of the research progress in applying LCA to slope treatment. The concept, development, and application of LCA are introduced in detail. The research status of slope treatment is summarized, with a focus on engineering slope treatment and ecological slope treatment. Different ecological slope treatment technologies in China and other countries are compared. Additionally, the paper presents the research status of carbon emissions throughout the entire life cycle of slope treatment, covering carbon emission sources, carbon emission accounting methods, and points of carbon dioxide emission reduction in the three stages of slope treatment. Finally, the study identifies existing problems, environmental challenges, and further research directions in the application of LCA to slope treatment.
By rigorously evaluating slope treatment options systemically over full lifecycles, LCA offers immense potential to realize sustainable infrastructure. Its transparent, science-based approach could pave the way towards aligning geotechnical engineering with wider environmental protection goals. With further refinement and standardization of LCA methods tailored toward slope stabilization challenges, more optimal solutions may emerge which maximize environmental, social and economic benefits across project lifespans and affected regions. This comprehensive review aims to advance the understanding and application of LCA in slope treatment assessment as a key step towards sustainability in civil engineering works.
2. Research Status of Life Cycle Assessment
2.1. Framework of Life Cycle Assessment
According to the Environmental Management Life Cycle Assessment Principles and Framework (ISO14040-2006), life cycle assessment (LCA) was defined as a four-step process [19,20]. The LCA process was required to have continuity and relevance, as illustrated in Figure 1.
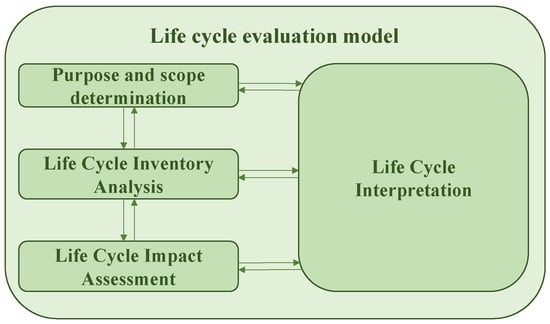
Figure 1.
Theoretical framework of life cycle assessment.
Step 1: Purpose and Scope Determination. The initial step in LCA involves analyzing the research subject and establishing the research objectives and system boundaries. This step provides the foundation for subsequent work, ensuring the effective evaluation of the product system and the accuracy of the final assessment results [21].
Step 2: Life Cycle Inventory Analysis. Inventory analysis is a critical aspect of LCA, covering every stage of the research subject’s life cycle. It entails considerations such as material and energy consumption, transportation, recycling, maintenance, and final disposal. Raw material and energy consumption are typically utilized as input parameters, while the corresponding output generally pertains to the amount of pollutants released into the environment [22].
Step 3: Life Cycle Impact Assessment. The inventory data obtained in Step 2 quantitatively examine the global warming potential (GWP), eutrophication potential (EP), photochemical ozone generation potential (POCP), and acidification potential (AP) of the product system [23]. When conducting carbon footprint research using LCA, the data from each stage are categorized and evaluated, and the carbon emission results are combined with the carbon emission factors to establish a carbon emission calculation model, culminating in a quantitative conclusion.
Step 4: Life Cycle Interpretation. Based on the findings from the previous steps, the interpretation phase involves evaluating and analyzing the carbon emissions resulting from resource or energy consumption and waste generation. The objective is to identify the reasons behind the results and propose improvement measures to mitigate the impact of carbon emissions. The ISO 14043 standard [24] outlines three elements of life cycle interpretation: identification of significant issues, assessment, and recommendations [25].
2.2. Application of Life Cycle Assessment in Slope Engineering
The utilization of life cycle assessment in slope engineering provides a comprehensive evaluation of the environmental impact throughout the entire life cycle of the project, encompassing the design, construction, operation, and dismantling stages of slope engineering. Through quantitative analysis of energy consumption, material utilization, waste generation, and environmental emissions, the environmental impact of the project is thoroughly assessed.
Life cycle assessment serves as a valuable tool for engineers and decision-makers, enabling them to make more sustainable and environmentally friendly decisions at various stages of slope engineering. Through quantitative evaluation, it is possible to pinpoint the stages with significant environmental impacts and implement corresponding improvement measures to mitigate adverse effects.
Regarding LCA in slope treatment techniques, a comparative LCA of four innovative highway slope-remediation techniques was conducted, including traditional concrete filling, bioengineering, geogrids, and geobags [17]. The findings revealed that bioengineering and geogrids have the lowest environmental impact, while concrete filling exhibits the highest environmental impact. Winter, et al. [26] evaluated the LCA of three innovative rock and soil slope-remediation techniques, encompassing self-healing concrete, biochar, and microbial cement. The results demonstrated that self-healing concrete and biochar have lower environmental impacts, while microbial cement exhibits a higher environmental impact.
In terms of LCA in slope materials, Cordi, et al. [27] conducted an analysis of the environmental lifecycle performance of recycled materials in sustainable slope engineering, encompassing recycled concrete, recycled asphalt, recycled glass, and recycled tires. The findings demonstrated that recycled materials can notably reduce energy consumption, greenhouse gas emissions, and water resource utilization, compared to traditional materials. Similarly, Frischknecht, et al. [28] compared the LCA of geosynthetic materials with traditional construction materials, including geotextiles, geomembranes, geonets, and geocells. The results revealed that geosynthetic materials can significantly decrease energy consumption, greenhouse gas emissions, and waste generation, in comparison to traditional materials.
In terms of LCA in slope design schemes, Storesund, et al. [29] compared the lifecycle impacts of concrete retaining walls and bioengineering slopes, incorporating energy consumption, greenhouse gas emissions, water resource utilization, and ecological risks. The findings indicated that bioengineering slopes can notably reduce environmental impacts, in contrast to concrete retaining walls. Furthermore, Zhang, et al. [30] compared the environmental impacts of two different expansive soil slope-stabilization techniques, encompassing vegetation cover and soil anchors. The results demonstrated that vegetation cover can significantly decrease energy consumption, greenhouse gas emissions, and water resource utilization, compared to soil anchors.
In slope lifecycle cost analysis (LCCA), Samuelsson, et al. [31] reviewed the application of LCA and LCCA in geotechnical engineering, identifying research gaps and challenges. They emphasized that LCA and LCCA can provide more comprehensive information for decision-making in geotechnical engineering but necessitate further development and standardization of data, methods, and tools. Similarly, VandenBerge, et al. [32] introduced the application of sustainability in soil structures, including LCA and LCCA. They suggested that LCA and LCCA can offer more choices and optimizations for the design, construction, and maintenance of soil structures, but require more case studies and sharing of practical experience.
In LCA of slope bioengineering, Hoerbinger and Obriejetan [33] developed an LCA-based environmental assessment model to evaluate bioengineering measures on infrastructure slopes, encompassing vegetation cover, willow weaving, and plant stakes. The results indicated that bioengineering measures can significantly reduce energy consumption, greenhouse gas emissions, and water resource utilization, compared to traditional measures, but underscored the need to consider maintenance and the lifespan of bioengineering measures.
3. Development of Slope Treatment Technologies
The technology for slope treatment has evolved progressively, from traditional engineering methods to the integrated approach of ecological slope treatment, which incorporates ecological considerations [34]. Through the integration of vegetation and engineering measures, ecological slope treatment technology improves slope stability, reduces soil erosion, enhances ecological conditions, and offers cost-effectiveness and sustainability advantages [35]. This advancement has presented a comprehensive and environmentally friendly solution for slope treatment, providing a more holistic and ecologically sound approach to addressing slope protection design [36,37].
3.1. Engineering Slope Treatment Technology
Engineering protection refers to the use of inorganic materials, such as sand, cement, and lime, for slope stabilization. When plant-based protection methods are not suitable, particularly for rock slopes, engineering protection techniques are utilized [38]. The primary methods of engineering protection include mortar plastering [39], pointing or spraying [40], and stone slope treatment or the use of facing walls [41]. Figure 2 presents the main engineering protection technologies of slope, currently. By employing inorganic materials and employing appropriate construction techniques, these methods offer structural support and enhance the overall safety of the slopes.
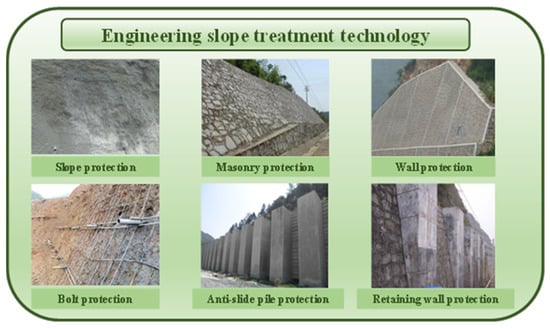
Figure 2.
Engineering slope treatment technology.
- 1.
- Slope surface protection
Slope treatment technologies are applicable to slopes that experience severe weathering of surface rock strata and are prone to erosion caused by rainfall. The main methods of slope treatment are plastering protection, hammer protection, and shotcrete protection, which are described as follows.
- (a)
- Plastering protection: this method involves applying a layer of plastering, typically 3 cm to 7 cm thick, on the slope surface. It effectively reduces the impact of external natural factors on the slope’s structural integrity, thereby extending its safe service life. Plastering protection is suitable for high-grade highways where the slopes consist of easily weathered soft rock [42].
- (b)
- Hammer protection: similar to plastering protection, this method also includes the application of a layer of plastering on the slope surface. However, prior to the additional plastering, the slope surface is hammered and compacted, and the additional plastering layer is thicker, ranging from 10 cm to 15 cm. The beating process enhances the density of the slope, making it more resistant to erosion caused by rain. This method is suitable for soil slopes and rock slopes that are susceptible to rain erosion and have experienced surface weathering.
- (c)
- Shotcrete protection: shotcrete involves spraying mortar and concrete onto the slope surface, to strengthen the overall structure and protect it from the erosive effects of wind and rain. However, this method may disrupt the natural landscape surrounding the highway, and it can be costly. Shotcrete protection is suitable for slopes with fractured surfaces, dense cracks, gaps, and unstable structures [42].
- 2.
- Stone masonry protection
Masonry protection methods primarily include mortar masonry, dry rubble, and protective walls [43], which are described as follows.
- (a)
- Mortar rubble protection: this method is commonly used in slope treatment for high-grade highways. It involves filling the gaps among the rubble with cement mortar, creating a compact and complete engineering protection structure that effectively safeguards the slope structure.
- (b)
- Dry rubble protection: in this method, rubble with regular shapes is stacked on the slope surface to stabilize the slope structure. It is suitable for situations involving large-scale filling and excavation, significant slope deformation, and slopes composed of soft rock or soil.
- (c)
- Facing wall protection: a facing wall refers to a wall constructed on an excavated slope or a soft rock slope with a high degree of fragmentation, using mortar rubble. This method applies to slopes with severe weathering, soft rock slopes, and slopes with significant fragmentation.
- 3.
- Anchor rod protection
A rock drilling machine is employed to vertically bore a hole into the slope, reaching the stable bedrock area within. Subsequently, an anchor rod is inserted, and cement mortar is injected into the hole to establish a cohesive connection between the anchor rod and the slope structure [44]. This technique aims to enhance the strength of the slope structure. Specifically designed for high-grade highway slopes characterized by pronounced rock-mass structure separation, a fragmented layered surface, and a steep inclination near the base of the side slope, this protection technology proves suitable.
- 4.
- Anti-slide pile protection
At the designated location along the side slope, anti-slide piles are strategically installed to traverse the sliding surface and extend into the stable soil body beneath the lower portion. This arrangement serves to fortify the side slope and mitigate the risk of sliding. The implementation of anti-slide pile protection is prevalent in highway slopes characterized by deep sliding zones and substantial landslide thrust. This method offers several advantages, including minimal equipment requirements, convenient construction, high resistance against sliding forces, limited excavation requirements, and minimal secondary damage [45].
- 5.
- Retaining-wall protection
The principle behind retaining-wall protection lies in the ability of the wall to resist the sliding forces generated by the loose soil, by utilizing its own weight and structural design. As a result, retaining walls are typically positioned at the leading edge and appropriate corners of slopes, which are prone to landslides due to the relatively loose nature of the slope soil [46]. Retaining walls come in various types, including anchor rod, cantilever, gravity, column plate, and soil-nailing walls. The selection and construction of a specific type depend on the characteristics of the slope section being protected. Consequently, retaining wall protection is widely employed in the engineering of slope treatment for high-grade highways.
In the field of slope treatment technology, traditional engineering methods have a long history of development. These methods are well-established in theory and practical application, representing a significant approach to slope treatment, both domestically and internationally [47]. Although the engineering protection can ensure slope stability, the methods possess certain drawbacks, including complex construction procedures, lengthy construction periods, high costs, and challenging maintenance. Specifically, the use of hardened slopes in engineering protection significantly reduces water permeability, leading to increased slope runoff. This runoff can accelerate soil erosion and undermine the overall stability of the slope treatment structure [48]. Moreover, the hardened slopes hinder water and soil conservation, reduce the soil’s capacity to retain water, and fail to replenish groundwater, resulting in declining groundwater levels, over time. Furthermore, such slopes impede the exchange of materials and energy between soil and water, leading to environmental degradation and a decrease in biodiversity [49]. In summary, the traditional engineering protections lack favorable economic and ecological benefits, and do not align with the principles of green and sustainable development advocated by the contemporary society.
3.2. Ecological Slope Treatment Technology
The ecological slope treatment technology not only enhances slope stability, but also reduces costs, promotes environmental sustainability, and achieves a harmonious integration of economy, ecology, and aesthetics. The key aspect of this technology is harnessing the mechanical and hydrological effects of plants to achieve slope treatment, stabilization, ecological restoration, and preservation.
The mechanical effect of plants is manifested in the reinforcement of shallow and deep roots. The shallow roots intertwine within soils and create a three-dimensional reinforcement network, which increases the bond strength of soils and enhances the stability of shallow soils on slopes [50]. Deep roots act as anchoring elements, growing vertically through the loose weathering layer until reaching the deep rock structure. The deep roots exhibit a high tensile and shear strength, similar to prestressed anchors. The interaction between roots, the root–soil contact surface, and soils forms a stable composite structure [51], which enhances the load-carrying capacity of soils, prevents slope sliding and cracking, and significantly improves the soil deformation [52].
The hydrological influence of plants also plays a critical role in slope stabilization. Plants intercept high-velocity raindrops, thereby mitigating or eliminating the erosive impact of raindrop splash [53]. This interception effectively captures rainfall and reduces surface runoff, leading to a decrease in erosion and soil loss. Furthermore, plant roots absorb water and decrease pore water pressure through transpiration, thereby enhancing slope stability and overall performance [54]. Currently, ecological slope treatments are commonly classified into artificial-grass-planting slope treatment, spray-seeding grass-planting slope treatment, and skeleton-grass-planting slope treatment, based on the type of seeding utilized [55,56,57]. Figure 3 presents the common ecological slope treatment technologies.
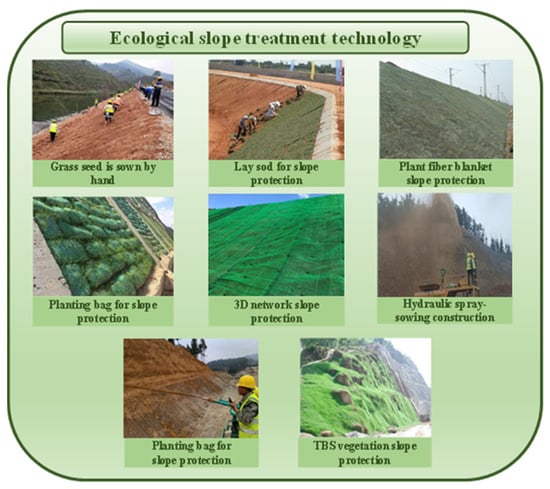
Figure 3.
Ecological slope-treatment technology.
- 1.
- Artificial plant protection
The artificial-vegetation protection method encompasses various techniques, including artificial-sowing and -grass planting, paving-turf slope treatment, plant-fiber-blanket slope treatment, vegetation-bag slope treatment, and three-dimensional-net slope treatment.
- (a)
- Artificial-sowing and -grass planting: this technique involves evenly spreading seeds on the slope and covering them with soil. When the slope soil conditions are favorable in terms of temperature and humidity, the seeds germinate, take root, and eventually establish a plant community on the slope, achieving the objective of vegetation restoration. This method is suitable for low-height soil slopes with a gentle incline [58].
- (b)
- Paving-turf slope treatment: in this approach, a well-cultivated lawn is directly transplanted onto the slope surface, rapidly greening the slope. This method is commonly employed for greening urban-road slopes.
- (c)
- Plant-fiber-blanket slope treatment: agricultural waste materials such as rice husk, wheat husk, straw scale, and hemp fiber are combined with plant seeds, nutrients, special paper, and shaping net to produce an ecological slope treatment material that can be applied to cover the slope surface. This technique is suitable for soil slopes with a gentle incline and a flat slope surface [59].
- (d)
- Vegetation-bag slope treatment: non-woven fabric bags are filled with a specific proportion of plant seeds, fertilizer, water-retaining agents, sand, stones, and other fillers, to create vegetation bags. These bags are then stacked on the slope, allowing the seeds inside to germinate and facilitate slope greening [60].
- (e)
- Three-dimensional-net slope treatment: this method involves excavating a shallow ditch in the slope and casting grass seeds into the ditch, followed by covering the seeds with a three-dimensional net. As the grass grows and takes root beneath the net, stabilizing the slope, soil is applied to cover the three-dimensional net. Finally, a new soil layer is sprayed with grass. Once the grass roots on both sides of the three-dimensional net intertwine to form a network, the slope achieves both greening and stabilization objectives, simultaneously [61]. This technique is suitable for soil slopes and rock slopes with significant weathering.
- 2.
- Protection of spray-seeding plants
Spray-seeding vegetation protection involves the application of a mixture comprising fertilizer, soil, plant seeds, adhesive, water, and other materials. This mixture is sprayed onto the slope using specialized equipment. Hydraulic-spray-seeding vegetation slope treatment, soil-spray-seeding vegetation slope treatment, TBS-vegetation slope treatment, and spray mixed-vegetation slope treatment all fall under the category of spray-seeding vegetation protection [62].
- (a)
- Hydraulic-spray-planting slope treatment: this technique utilizes a hydraulic spray machine to apply a mixture of plant seeds, fertilizer, water-retaining agent, adhesive, soil, and water, onto the slope surface. The sprayed slope is then covered with non-woven fabric, for maintenance. Although this technology offers high efficiency through mechanical construction, controlling the mixing ratio of the liquid mixture can be challenging, and construction is susceptible to weather conditions. It is suitable for slopes with gentle terrain and good soil quality [63,64].
- (b)
- Soil-spray-planting slope treatment: similar to hydraulic-spray-planting slope treatment, this technique also employs hydraulic-spray-seeding technology. The slope treatment process involves two steps [65]. Firstly, soils, binders, and water-retaining agents are mixed in a certain proportion to create a guest soil, which is then sprayed onto the slope surface, using a hydraulic press. This improves the slope surface, making it suitable for plant growth. Subsequently, a new mixture of plant seeds, fertilizer, soil, water-retaining agent, and binder, is sprayed onto soils. Compared to hydraulic-spray planting and slope-treatment technology, this method enhances the growing environment for slope plants, and has a wider application range. However, due to its high water consumption, complex construction technology, and high cost, this method is not suitable for areas with cold climates and arid conditions [66].
- (c)
- TBS-vegetation slope treatment: this technique involves the preparation of a thick-layer-base material mixture using plant seeds, soil, coarse and fine fibers, organic matter, biological bacterial fertilizer, full-price slow-release fertilizer, water, water-retaining agent, disinfectant, and pH regulator. The mixture is uniformly sprayed onto the slope surface using concrete sprayers, which can provide a solid foundation for vegetation growth on slopes. This method is suitable for weathered rock slopes with gentle inclines and slopes with poor soil conditions [67].
- (d)
- Spray-mixed-planting slope treatment: this technique, namely planting-concrete slope treatment, involves the mixture of soil, plant seeds, fertilizer, organic matter, water-retention materials, bonding materials, and water, in specific proportions. This meticulously prepared blend is then skillfully applied onto the slope surface using a concrete jet, resulting in the formation of a consolidated layer with a uniform thickness of approximately 10 cm and strategically placed continuous gaps [68]. The primary objective of this technique is to foster the growth of vegetation within these gaps, thereby facilitating the greening of slopes. However, it is imperative to acknowledge that the widespread implementation of this technology has encountered various technical challenges, encompassing the optimization of the mixture composition, enhancement of adhesion and bonding properties, promotion of seed germination and growth, and establishment of long-term maintenance strategies.
- 3.
- Skeleton slope treatment
Skeleton slope treatment, also referred to as framework slope treatment, is a method used to stabilize slope structures. It involves the construction of a regular framework on the slope surface, using concrete or mortar rubble. This framework provides structural support and helps prevent slope instability. Once the framework has fully cured, the exposed areas of the slope, excluding the framework structure, are treated by spraying grass and laying sod. This vegetation helps to enhance the slope’s stability and aesthetics. This technique is particularly suitable for soil or rock slopes with a moderate incline and a certain height [45,69,70,71].
Ecological slope-treatment technology has indeed gained recognition and widespread adoption globally, due to its sustainable and environmentally friendly approach to slope stabilization and restoration. The benefits it offers, such as enhanced slope stability, reduced erosion, improved water management, and optimized visual perception, have contributed to its popularity. In the United States, the implementation of ecological slope-treatment technology has reached a significant level, with nearly 60% of roads and riverbanks adopting this approach for slope control [72]. Japan, with its well-established and mature ecological slope-treatment technology, has consistently been a leader in the field, showcasing numerous successful cases. China started researching this technology relatively late, but has made significant progress since then. China introduced advanced geotechnical materials for grass slope treatment in 1993, and subsequently developed a range of geotechnical products, including geogrids, geocell chambers, and three-dimensional vegetation nets. These products have been effectively utilized in slope treatment projects, leading to remarkable benefits and substantial advancements in China’s ecological slope treatment [73]. The global adoption and continuous development of ecological slope-treatment technology demonstrate its effectiveness and potential for addressing slope-stability challenges, while promoting sustainable practices and environmental preservation.
3.3. Evaluation of Ecological Benefits
Ecological slope-treatment technology has emerged as a promising approach for slope treatment, offering significant ecological benefits and promoting a more harmonious coexistence between human activities and the natural environment. Du [74] conducted a comprehensive study combining engineering practice and slope ecological-protection theory. Through the analysis of the characteristics of the slope, he proved that the implementation of ecological slope-treatment technology, according to local conditions, effectively improves the stability of the slope, inhibits soil erosion, reduces the cost of slope treatment engineering, and improves the ecological environment along the slope. This approach has been shown to produce positive economic, ecological, and social outcomes. To quantify the benefits of slope ecological protection, Yang, et al. [75] established a comprehensive evaluation index system of ecological restoration effects by using the fuzzy analytic hierarchy process. In this way, the effects of different ecological restoration methods can be quantified, and the effects of ecological restoration projects can be evaluated. The results show that the quantitative evaluation results obtained from the ecological-restoration comprehensive evaluation system are consistent with the observational analysis results, which proves the effectiveness of the evaluation system. In practical applications, De-yong, et al. [76] successfully applied 3D geonet technology to actual slope-restoration projects. Their results show that this method has good overall consolidation and soil consolidation effects at different stages of vegetation growth. Similarly, Fox, et al. [77] adopted the technology of mixed sowing of different grass species to establish a vegetation slope-treatment structure and effectively control the harm of soil erosion. These studies together demonstrate the effectiveness of ecological slope-treatment techniques in promoting slope stability, reducing erosion, and improving ecological conditions.
Ecological slope-treatment technology offers a more holistic approach, by integrating vegetation, concrete, and soil into a unified system. One of the key advantages of ecological slope-treatment technology lies in its ability to reinforce the soil and enhance slope stability. By combining vegetation with concrete and soil, a robust soil-fixing ecosystem is established. This ecosystem not only prevents soil erosion, but also strengthens the overall structure of the slope. The interplay between vegetation, concrete, and soil creates a self-sustaining system that supports long-term slope stability. Therefore, by emphasizing the ecological benefits, ecological slope-treatment technology offers a more sustainable and environmentally conscious solution for slope management.
4. Current Research Status of Life Cycle Carbon Emission at Slope
4.1. Determination of Objectives and Scope
4.1.1. Evaluation Purpose
The primary objective of conducting a LCA is to quantify the environmental impact of carbon emissions associated with slope treatment. The aim is to establish a theoretical foundation for studying carbon emissions in slope treatment, facilitating the development of tailored energy-saving and carbon-reducing strategies for different stages of the slope-treatment life cycle. Specific strategies are proposed within this method, to provide guidance for enterprises in making sustainable choices throughout the slope ecological design, raw material selection, production, transportation, and utilization processes. These strategies have been designed to achieve optimal outcomes in terms of energy-saving and carbon reduction. By implementing these strategies, enterprises can effectively reduce their carbon footprint and minimize the environmental impact of slope treatment. This approach fosters a more responsible and eco-friendly approach to slope management, aligning with the broader goals of mitigating climate change and promoting sustainable development.
4.1.2. Functional Units
The functional unit is determined to establish a unified measurement unit for each stage of the entire life cycle of slope treatment, enabling comparability between stages. This quantified measure represents a product’s function or performance characteristic. By determining the functional unit, parameters can be consistently measured and evaluated throughout the life cycle of slope treatment, ensuring comparability between stages. This allows for accurate assessments of environmental impacts and resource consumption [17]. The use of a standardized functional unit facilitates meaningful comparisons between different stages of slope treatment. It enables decision makers to evaluate the sustainability and efficiency of alternative options or scenarios, such as construction, operation, maintenance, and disposal, using a unified measurement metric.
4.1.3. System Boundaries
Once research objectives have been identified, it is important to consider the necessary steps for conducting LCA and the key details to be addressed at each stage of the identification process. The boundary is a critical aspect that should be taken into account. The selection of an appropriate scope for data collection will have implications for the subsequent analysis of data sets with varying levels of detail. Furthermore, as the data collation process for the research object undergoes repeated revisions and supplements, new foundational data will emerge as the research deepens, necessitating adjustments to the research’s system boundary, to align with its objectives [78].
The complete life cycle of the ecological slope management project is from cradle to grave. At this time, the boundary of the system mainly includes the raw material stage, the construction stage, the operation and maintenance stage, and the demolition and recycling stage. Among them, the raw material stage and the construction stage can be combined into the construction stage. The main construction process of ecological slope construction is shown in Figure 4. The specific process of different construction processes in the construction stage is different. Taking artificial grass planting and slope protection as an example, a construction-phase framework diagram is shown in Figure 5.
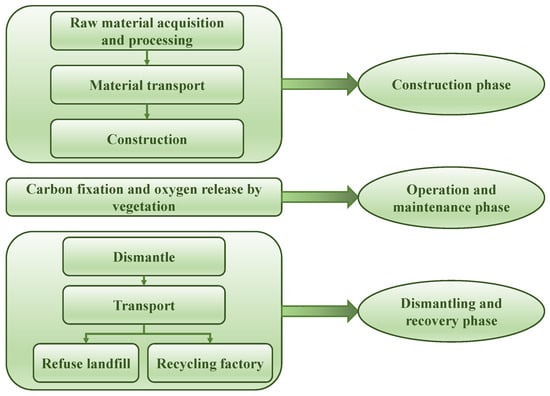
Figure 4.
Construction-phase framework diagram.

Figure 5.
Artificial-grass-slope protection construction-process flow chart.
4.2. Life Cycle List Analysis of Slope Treatment
4.2.1. Source of Carbon Emission during the Life Cycle of Slope Treatment
During the process of ecological slope treatment, the maintenance period assumes a crucial role. Currently, slope treatment projects often encounter common issues, such as excessive construction intensity and neglect of maintenance [79]. Despite significant investments in manpower and resources for the initial slope bias during construction of expressways, the survival rate of planted vegetation is low, and the species diversity is limited due to the plants’ weak resilience in harsh environments. Consequently, the greening effectiveness of slope treatment is compromised. Therefore, to ensure the survival of vegetation, greater attention should be given to protection management. However, it should be noted that the maintenance period primarily relies on manual labor, making it challenging to calculate carbon emissions. In addition, there are no examples of demolition in the ecological slope-treatment project, so the environmental impact during maintenance and demolition is not considered. At this time, the system boundary of life cycle assessment is called from cradle to gate. Therefore, the focus is on the carbon emissions generated during the construction stage (including the acquisition and processing of raw materials, the transportation of materials, and the construction process) and the operation stage.
The construction period of ecological slope projects can be divided into five steps: (a) Acquisition and disposal of raw materials and recycled materials: raw materials and second-hand materials (such as recycled steel) are obtained from the natural environment and processed or manufactured into usable products before being utilized. (b) Transport raw materials and recycled materials to processing plants or temporary storage bins on site. (c) Construction support works, which encompass the excavation and removal of damaged materials, as well as site clearing, involving the removal of vegetation. (d) Transport the processed materials to the construction site and transport the equipment. Consider the different distances between the processing plant and the construction site and the differences in carbon emissions between different means of transport. (e) Materials are placed and installed at the construction site.
4.2.2. Determination of Carbon Emission Factors
- 1.
- Carbon emission factor of fossil energy
The energy carbon emission factor represents the quantity of carbon emissions produced per unit mass of energy consumed. It is a significant factor influencing carbon emissions [80]. Table 1 provides the carbon emission factors for several readily available fossil fuels.

Table 1.
Carbon emission factors of fossil energy.
- 2.
- Carbon emission factor of building materials
The carbon emissions associated with building materials can vary, depending on factors such as the production process, transportation, and the carbon content of the material itself. Due to the extensive variety of building materials available, only the carbon emission factors of commonly used ones are provided. Table 2 presents examples of frequently employed building materials, along with their approximate carbon emission factors [81,82,83].
Table 2.
Carbon emission factors of some common building materials.
The carbon emission factors for the main building materials have been sourced from multiple references. The Standard for Calculation of Carbon Emissions in Buildings (GBT 51366-2019) [84] has contributed to a portion of these factors. The SimaPro 9.1 database has been utilized to select certain carbon emission factors, while others have been obtained through the literature. It is important to note that the carbon emission factors marked with an asterisk (*) have been chosen from the SimaPro 9.1 database, those marked with a hash symbol (#) have been obtained through the literature, and the remaining unmarked carbon emission factors have been derived from the Standard for Calculation of Building Carbon Emissions (GBT 51366-2019).
- 3.
- Transportation carbon emission factor
Table 3 presents the carbon emission factors for various transportation modes commonly used in China [85,86]. These transportation links play a vital role in connecting multiple stages throughout the life cycle, which includes the transportation of raw materials to the construction site during the production and transportation of materials, the use of construction vehicles, and daily operations throughout the construction stage. These carbon emission factors provide insight into the carbon emissions associated with these transportation modes.
Table 3.
Carbon emission factors of various transportation modes (kgCO2/(t·km)).
- 4.
- Carbon emission factor of construction machinery
Table 4 displays the energy carbon emission factors for common construction machinery [87]. The energy consumed by construction machinery primarily involves electricity, gasoline, and diesel. Electricity consumption is measured in kilowatt-hours (kW·h), while gasoline and diesel consumption are measured in kilograms (kg). In this study, the energy consumption for each shift of the main construction machinery is determined based on the Standard for Calculation of Building Carbon Emissions (GBT 51366-2019). The carbon emissions from construction machinery are then calculated by combining the consumption data with the corresponding energy carbon emission factors. These factors provide insights into the carbon emissions associated with the energy consumption of various construction machinery.
Table 4.
Carbon emission factors of common construction machinery energy.
4.3. Life Cycle Impact Assessment and Interpretation of Slope Treatment
Environmental impact assessment serves as the central component of life cycle assessment, encompassing the classification and quantification of environmental impacts derived from inventory analysis results, which encompass resource utilization, energy consumption, and environmental releases. This process establishes a fundamental basis for interpreting life cycle outcomes [88]. Following the CML2001 model, the assessment of environmental impact involves classification, characterization, standardization, and weighting. Accordingly, the green environmental-protection performance of ecological slope treatment during the construction period can be evaluated by adhering to these evaluation steps.
4.4. Accounting Method
4.4.1. Calculation Method of Carbon Emissions
Currently, carbon emission calculation methods are generally categorized into four types: the actual measurement method, material balance algorithm, emission coefficient method, and input–output method [89,90]. The characteristics of the four methods are shown in Table 5.
Table 5.
The characteristics of the four methods are compared and analyzed.
- 1.
- Actual measurement method
This involves the control and measurement of carbon emissions by the supervisory department. Subsequently, the total carbon emissions are calculated, based on established scientific specifications [91]. The calculation formula of this method is shown in Equation (1):
where G is CO2 emissions, K is the unit emission coefficient, Q is the air flow rate, and C is the concentration of CO2. In this method, a scientific and rational measurement of resources, energy consumption, and gas emissions is essential. Therefore, the selection of monitoring samples must meet high standards. If the samples fail to meet the accuracy and representativeness requirements, the monitoring data will lose their significance. It is crucial to ensure that the chosen monitoring samples accurately represent the overall carbon emissions of the system or process under consideration. This necessitates careful consideration of factors such as sample size, location, and diversity, to achieve a representative and reliable measurement. By adhering to these requirements, the monitoring data can provide meaningful insights into the carbon emissions of the assessed entity.
The actual measurement method is currently not widely applied. Wang and Gu [92] have highlighted the significant impact of crop variations in different agricultural regions on carbon emissions from the land. To ensure the accuracy of research findings, it is recommended to utilize the actual measurement method for data collection. Chao, et al. [93] calculated using the measured method, and obtained the data that can reflect the current level of the comprehensive average CO and NOx emission factors of urban underground road traffic flow in China. However, it is important to consider the observations made by the Organization for Economic Cooperation and Development (OECD) in a 1997 document. They emphasized that, while field measurement offers precise data and simplified measurement procedures, it is crucial to address the challenges associated with data measurement, collection, and the costs involved when selecting carbon emission measurement methods [94]. Therefore, the actual measurement method is valuable for capturing accurate data, but its application may be limited, due to factors such as variations in crop types, the nature of emission sources, and the associated challenges in data collection and cost considerations.
- 2.
- Material balance algorithm
The material balance algorithm is a scientific measurement method that relies on the principle of mass conservation [95]. It calculates the proportion of substances consumed for gas replacement, removal, or meeting additional consumption during equipment operation. This method considers newly produced chemical substances or new equipment, on an annual basis. In many cases, especially when direct monitoring is impractical or costly, the material balance algorithm provides a more accurate and user-friendly approach for calculating emission data. The formula for calculating emissions using the material balance algorithm is shown in Equation (2). By applying this formula, accurate emission data can be obtained by considering the proportion of the consumed substance. The material balance algorithm is particularly useful when direct measurements are not feasible or when cost constraints limit the use of actual measurement methods.
where Gput represents the total amount of input materials in the accounting process, Gproduct represents the total output obtained in the accounting process, and Glost represents the total loss caused by the conversion between the two.
The material balance algorithm has found widespread application in calculating greenhouse gas emissions from specific facilities or processes. For instance, the Earth Environment Institute (IGES) utilized the material balance algorithm in 2006 to estimate carbon emissions resulting from chemical energy [96]. Liu, et al. [97] employed a combination of the actual measurement method and the material balance algorithm to calculate carbon emissions from cement production, raw material processing, fossil energy combustion, and other fuel combustion in China from 1950 to 2013. Schwarzböck, et al. [98] utilized the material balance method to calculate carbon emissions from 10 waste-incineration power plants in Austria. Singh, et al. [99] applied this method to calculate the carbon footprint of wastewater treatment plants of various sizes and technical levels, based on energy consumption.
The material balance algorithm offers several advantages, including its simplicity, ease of data collection, and low workload. Calculation results are derived from apparent energy consumption and equipment analysis outcomes. However, it is important to note that statistical errors may arise, due to the reliance on these factors. Therefore, it is crucial to ensure the accuracy of the data used in the calculations to minimize such errors. Despite its advantages, the material balance algorithm also has limitations. It assumes steady-state conditions and necessitates accurate data on substance consumption and emission factors. Moreover, its suitability may be limited in systems with complex or dynamic processes. These considerations should be taken into account when applying the material balance algorithm for emissions calculations.
- 3.
- Emission coefficient method
The carbon emission factor method is widely used for calculating greenhouse gas emissions, and involves the relationship between activity levels and emissions from sources of various sizes. This method relies on known carbon emission factors, and is currently the most commonly used approach for carbon emission accounting [100]. Essentially, it involves the compilation of greenhouse gas inventories using emission factors derived from the material balance algorithm, actual measurement method, or default values for greenhouse gas emissions. The formula is shown in Equation (3).
where G represents the total amount of carbon dioxide emissions converted from different greenhouse gases; A represents the emission data generated during production and operation activities, which are mainly derived from the statistical or monitoring data of the National Bureau of Statistics or other research and census processes; and K represents the emission factors of different greenhouse gases converted into carbon dioxide.
The Guidelines for National Greenhouse Gas Inventories, published by the United Nations Intergovernmental Panel on Climate Change (IPCC), offer comprehensive and current guidelines for emission factors related to various emission sources [90]. These guidelines are considered a valuable resource for countries seeking to develop their greenhouse gas inventories, providing standardized methods for estimating emissions. In addition to the IPCC guidelines, a range of widely used sources exist for emission factor data. Notable examples include the International Energy Agency (IEA) and the National Climate Strategy Center [101,102,103]. These organizations serve as channels for accessing emission factor data, which is frequently utilized for emissions calculations. Table 6 provides a compilation of these diverse data sources, presenting their respective emission factors. It serves as a convenient reference for users seeking to access and apply emission factor data from these sources.
Table 6.
Emission factor values are mainly obtained from these sources.
- 4.
- Input–output method
The input–output (I-O) method is a valuable approach that utilizes the quantitative relationship between input and output within an economic system to calculate carbon emissions across various industries [104,105]. This method has gained prominence in environmental economics research since its introduction in 1970 [106], and it has been widely employed by scholars to measure carbon emissions using an input–output framework. For instance, Tunç, et al. [107] conducted a study using the input–output method to examine the CO2 emissions of different industries in Turkey. By applying this method, they were able to analyze the carbon emissions associated with each industry, and gain insights into their relative contributions to the overall emissions. Zhang, et al. [108] focused on updating and processing the input–output table data from 2002 to 2011, using the RAS method. Their research revealed that urban residents’ consumption played a significant role in generating indirect carbon emissions, impacting both urban and rural areas. By employing the input–output method, they were able to identify the key drivers of emissions, and provide valuable insights for policymakers and stakeholders. Wang, et al. [109] highlighted the strengths of the input–output method in measuring and studying the influencing factors of national or industrial carbon emissions at a macro level. This method effectively combines complex economic connotations with intuitive mathematical expressions, enabling a comprehensive understanding of the relationships between industries and their emissions. While the input–output method may be considered less accurate compared to other approaches, it offers several advantages, including its simplicity in calculation and lower operating costs. These factors make it an attractive option for conducting large-scale assessments of carbon emissions across industries.
Therefore, the input–output method provides a valuable tool for understanding the interconnectedness of industries and their carbon emissions. It offers a simpler yet insightful approach for measuring and analyzing emissions, contributing to the broader efforts in addressing climate change and formulating effective mitigation strategies.
4.4.2. Carbon-Emission-Calculation Model for Different Stages
Based on the relevant literature, the mathematical model for calculating carbon emission in the life cycle of ecological slope treatment is obtained, as shown in Equation (4) [110,111]:
where E represents the total carbon emission in the whole life cycle; E1 represents the carbon dioxide emission generated by the building materials in the project during the production stage; E2 represents the carbon dioxide emission generated by the building materials in the project during the transportation stage; E3 represents the carbon emission during the construction stage of the project; and E4 represents the carbon emission during the operation stage of the project.
- 1.
- Carbon-emission-calculation model at the production stage
The mathematical model for calculating the carbon emission of building materials at the production stage is shown in Equation (5):
where Di represents the amount of each building material used in the project, Ki represents the carbon emission factor of the building materials involved in the project, and n represents the total number of all building materials in the project.
In slope-treatment projects, various building materials are used during the production stage. To simplify the calculation process, it is common to select a few building materials that contribute significantly to the overall emissions, for calculation purposes. This can be determined by considering factors such as the carbon content of the materials, the energy-intensive processes involved in their production, and their overall usage in the project. By accurately identifying and including the building materials with substantial emissions, the carbon footprint of the slope-treatment project can be reasonably estimated, providing valuable insights for environmental evaluation and decision making.
- 2.
- Calculation model of carbon emission in building-material-transportation stage
During the transportation stage of building materials for slope-treatment projects, the main building materials are typically transported from the production or sales site to the construction site. This transportation process involves various modes, including railways, highways, waterways, and others. These modes consume fossil energy and give rise to carbon dioxide emissions. To account for the carbon emissions associated with transportation, it is necessary to consider the transportation distance of the building materials, which can be obtained from the List of Road Construction Materials along the Line provided in engineering construction drawings.
Once the transportation distance is determined, it is multiplied by the appropriate carbon emission factor for the specific transportation mode employed (e.g., railways, highways). This multiplication allows for the estimation of carbon emissions resulting from the transportation of the building materials [112]. Reliable sources, such as transportation-emission databases or environmental-impact-assessment guidelines, provide the carbon emission factors for different transportation modes.
The calculation model for carbon emissions at the transportation stage of building materials is shown in Equation (6).
where Di represents the quantity of each building material used in the project; Li represents the transportation distance of building materials involved in the project/km; K represents the carbon emission coefficient of various traffic types; and n represents the total number of all building materials in the project.
- 3.
- Carbon-emission-calculation model at the construction stage
During the construction of various ecological slopes, carbon dioxide emissions primarily result from the energy consumption of construction equipment. This energy consumption mainly comes from fuel oil and electric energy, making these two types of energy the primary factors for evaluating carbon emissions [113].
The carbon-emission mathematical model of the project at the construction stage is shown in Equation (7).
where Fi represents the amount of oil or electric energy consumed by different construction equipment in unit time; Hi represents the service time of different construction equipment; Pi represents the carbon emission coefficient of energy consumed by different construction equipment; and n represents the total amount of construction equipment used.
- 4.
- Carbon-emission-calculation model at operation stage
During the operation stage, carbon dioxide absorption and oxygen release occur through the process of photosynthesis when the slope is covered with soil and grass is planted. This process is known as the carbon-fixation capacity of vegetation. The total amount of carbon dioxide absorbed by plants can be calculated based on the annual carbon-fixation rate of the vegetation [114].
The calculation model of carbon emission at the operation stage is shown in Equation (8).
where C represents the annual carbon sequestration of plants with the unit of kg/(m2·y), S represents the vegetation area of the slope surface with the unit of m2, and Y represents the service life of the retaining structure with the unit of a year.
4.5. Key Points of Emission Reduction
The significant contribution of carbon emissions from ecological slope-treatment projects can be attributed to the construction stage and the operation stage. To effectively reduce carbon emissions, it is crucial to adopt new materials and minimize the transportation distance of these materials. This focus on adopting new materials and optimizing transportation logistics plays a key role in achieving energy conservation and emission-reduction goals within such projects [115]. By utilizing materials with lower carbon footprints or sourcing materials from closer locations, the overall carbon emissions associated with the project can be reduced. Furthermore, this underscores the importance of considering the environmental impact throughout the entire lifecycle of the project, encompassing the construction stage and the operation stage.
4.5.1. Emission-Reduction Strategies at the Construction Stage
- 1.
- Selection of slope treatment type
The selection of slope treatment technology significantly influences carbon emissions in ecological slope construction. Different technologies involve varying construction processes and material requirements, leading to different carbon emissions. Carefully choosing the appropriate slope treatment type, based on the slope conditions, can effectively reduce carbon emissions.
- 2.
- Vegetation selection
Different types of vegetation have varying capacities for carbon fixation and oxygen release. Considering the quality of the slope soil, it is advisable to select vegetation that is suitable, easy to grow, and possesses strong carbon-fixation capabilities. This selection can contribute to the effective reduction in carbon emissions.
- 3.
- Strengthen new production technology and select new materials
Enhancing the utilization of new production technologies and selecting innovative materials can significantly reduce production losses, resource and energy consumption, as well as pollution emissions. Adopting advanced production techniques and materials can effectively minimize the overall carbon footprint associated with ecological slope construction.
Therefore, reducing carbon emissions during the ecological slope-construction stage requires strategically selecting slope treatment types, choosing vegetation with strong carbon-fixation capabilities, and embracing new production technologies and materials. These measures collectively contribute to the reduction in carbon emissions, and support the goal of achieving energy conservation and emission reduction in ecological slope-treatment projects.
Figure 6, Figure 7, Figure 8, Figure 9, Figure 10 and Figure 11 illustrates the process flow chart of various types of ecological slopes at the construction stage.
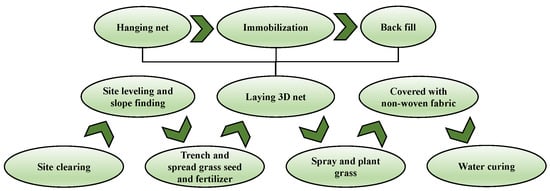
Figure 6.
3D vegetation-network slope-protection construction-process diagram.
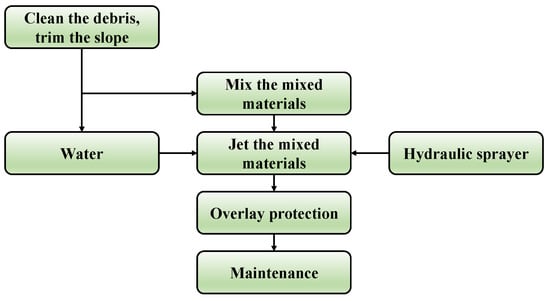
Figure 7.
Hydraulic-spray-planting grass-slope-protection construction-process flow chart.
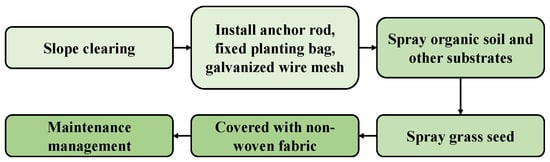
Figure 8.
Flow chart of construction process of slope protection by spraying grass on guest soil.
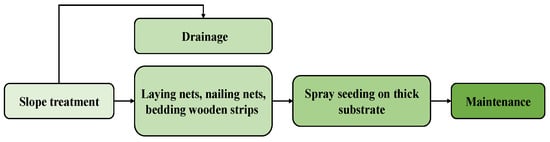
Figure 9.
TBS planting and slope-protection construction-process flow chart.
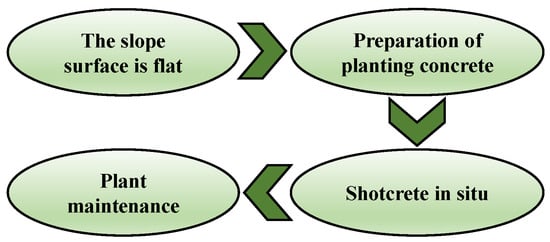
Figure 10.
Flow chart of shotcrete-slope-protection construction process.
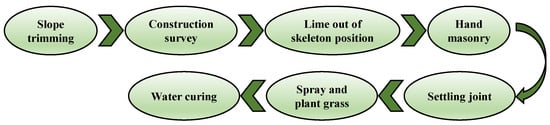
Figure 11.
Skeleton-planting grass-slope-protection construction-process flow chart.
4.5.2. Emission Reduction Strategy at the Transportation Stage
Emission reduction strategies at the transportation stage encompass optimizing delivery distances, enhancing energy efficiency in transportation where feasible, and implementing sustainable construction practices. These measures facilitate the overall reduction in carbon emissions, and align with the objective of achieving energy conservation and emission reduction in ecological slope-treatment projects.
- 1.
- Optimize the delivery distance
Numerous studies have investigated the environmental impact of various transportation methods for minimizing greenhouse gas emissions during transportation. Maximizing the use of locally processed materials and minimizing transportation distances can effectively reduce carbon emissions generated during transportation.
- 2.
- Improve the energy-saving capacity of transportation means
During the transportation stage, carbon emissions are chiefly influenced by transportation mode and distance, assuming a constant material quantity. Reducing the volume of these two factors is pivotal for emission reduction at the transportation stage. Scholars have proposed three approaches for carbon reduction (AIS—avoid, improve, shift): avoiding impractical transportation planning, improving energy efficiency through technology, or transitioning to low-carbon transportation modes. In the context of engineering construction, where highway transportation is commonly employed for construction materials, transitioning transportation modes is currently not feasible [116].
Various transportation equipment is utilized during the material transportation stage, including trucks, loaders, dump trucks, concrete mixers, and beam carriers. Wei, et al. [117] examined the relationship between carbon emissions of freight vehicles and vehicle type, transport weight, and travel distance, providing a significant benchmark index for the effectiveness of policy interventions related to carbon emissions of material transportation. Additionally, as freight turnover increases, the carbon emissions per ton of goods transported over a kilometer decrease. The type of energy used by vehicles significantly influences emission reduction. For instance, under similar usage conditions, the adoption of pure electric trucks can result in an approximately 7.2% reduction in carbon emissions, compared to traditional fuel trucks [118].
To mitigate carbon emissions associated with transportation distance, several strategies can be implemented. (a) Reduction in the round-trip empty-vehicle rate: transport vehicles with similar functions, such as trucks, can enhance their utilization efficiency by simultaneously transporting waste residue and engineering materials, through contracts and other arrangements. (b) Avoidance of unnecessary transportation: when project progress allows, unnecessary transportation during peak traffic-flow periods can be avoided. This not only enhances transportation efficiency, but also minimizes additional carbon emissions arising from slow driving and waiting times during transit. (c) Shortening of transportation routes: improving the level of supply-chain management enables the procurement of materials from nearby sources, whenever feasible. This approach promotes material recycling, reduces carbon emissions resulting from external material procurement, and concurrently decreases the volume of freight during the material transportation stage. Table 7 summarizes the aforementioned methods that effectively contribute to the reduction of carbon emissions at the transportation stage.
Table 7.
Transportation-stage emission-reduction countermeasures.
- 3.
- Adopt green construction
Green construction involves raising awareness among construction personnel regarding energy conservation and environmental protection. It aims to reduce energy and material consumption during construction, within scientifically feasible limits [86,119]. This can be achieved by simplifying complex construction processes and avoiding excessive energy consumption resulting from intricate technologies and diverse functions.
5. Limitations and Prospects
LCA plays a critical role in providing valuable insights into the environmental impacts of ecological slope-treatment measures. This study underscores the importance of ecological slope treatment in preserving the ecological environment of roads, outlines the specific steps involved in evaluating the entire life cycle of slope treatment, and presents typical models for calculating carbon emissions. However, several deficiencies exist in accurately evaluating LCA in current research. This section introduces these limitations, to provide a more comprehensive understanding of the future application of LCA in ecological slope treatment.
The application of LCA in ecological slope treatment is confronted with challenges related to data availability, system boundaries, and calculation methods. Acquiring accurate and comprehensive data on materials, energy consumption, and greenhouse gas emissions is crucial, but often time-consuming. Defining appropriate system boundaries that encompass the entire life cycle of slope-treatment measures is a complex task. Additionally, reliable measurement techniques are required for calculating carbon fixation and oxygen-release capacities. To address these limitations, it is imperative to improve data collection methodologies, harmonize measurement methods, and establish standardized protocols to ensure the accuracy and reliability of LCA.
Future research efforts in ecological slope treatment should primarily focus on enhancing data collection methodologies and promoting data sharing among researchers, industry stakeholders, and governmental bodies. This collaborative approach will facilitate the development of comprehensive databases encompassing slope treatment materials and techniques. Additionally, the integration of uncertainty analysis techniques, such as probabilistic modeling and sensitivity analysis, will enhance the robustness of LCA results. Adopting a holistic approach that incorporates social and economic dimensions, through the integration of social life cycle assessment (SLCA) and life cycle costing (LCC), will provide a more comprehensive understanding of the sustainability performance of slope treatment measures.
Furthermore, addressing the current research deficiencies, particularly in accurately evaluating LCA, is essential. Although LCA is a valuable tool, improved methodologies and standardized protocols are needed to ensure consistent and reliable assessments. This includes developing more efficient data collection methods, establishing clear system boundaries, and refining calculation models for carbon-fixation and oxygen-release capacities. By addressing these limitations, future research can provide more accurate and robust evaluations of ecological slope-treatment measures.
To validate LCA results and assess the actual environmental performance of slope treatment measures, long-term monitoring and evaluation are essential. Continuous monitoring provides valuable data on the effectiveness and sustainability of ecological slope-treatment projects throughout their life cycle. It enables the identification of potential issues and the implementation of timely corrective measures, contributing to the overall success of slope-treatment projects. By emphasizing the importance of long-term monitoring, the reliability of LCA findings can be ensured, supporting the development of sustainable slope-treatment strategies.
In summary, LCA is crucial for evaluating the environmental impacts of ecological slope-treatment measures, but there are limitations in the current research. These include challenges in data availability, system boundaries, and calculation methods. Future research should improve data collection, promote data sharing, and integrate uncertainty-analysis techniques. Long-term monitoring is essential to validate LCA results and ensure the effectiveness of slope-treatment projects. By addressing these deficiencies and emphasizing long-term monitoring, the reliability and applicability of LCA in ecological slope treatment can be enhanced.
6. Conclusions
This study highlights the significance of life cycle assessment (LCA) in the field of ecological slope treatment. The application of LCA provides valuable insights into the environmental impacts of slope-treatment measures and supports decision making for sustainable road-infrastructure development. The main findings are as follows.
- (a)
- Ecological slope treatment ensures slope stability, reduces the risk of natural disasters, and provides ecological benefits, such as erosion reduction, promotion of the ecological environment, and conservation of biodiversity. It is essential for infrastructure development and the harmonious coexistence with the environment.
- (b)
- LCA plays a crucial role in evaluating the environmental impact of ecological slope treatment, encompassing the entire project life cycle, from raw materials to the endpoint. It helps identify environmental hotspots, and guides sustainable material and technology choices.
- (c)
- LCA assesses the environmental impact of slope-treatment schemes, considering factors such as energy consumption and greenhouse gas emissions. It assists in formulating sustainable strategies to minimize environmental harm and optimize resource utilization.
- (d)
- The application of LCA has enhanced the methodological rigor in assessing the environmental impacts of slope treatment, revealing innovative slope-management techniques and emission-reduction strategies, and emphasizing the role of ecological considerations in infrastructure projects. Employing LCA in slope treatment is vital for aligning industry practices with global sustainability goals, highlighting the need to integrate uncertainty analysis and long-term impact assessment, to bolster the credibility of LCA results.
- (e)
- Future research should enhance LCA practices by improving data collection methods, fostering collaboration among stakeholders, establishing comprehensive databases, and integrating uncertainty analysis and long-term monitoring, to enhance the reliability and effectiveness of LCA.
Author Contributions
Y.Y.: Conceptualization, methodology, investigation, formal analysis, supervision, project administration, writing—original draft. P.X.: Investigation, validation, formal analysis, data curation, writing—original draft, writing—review and editing. J.L.: Conceptualization, investigation, funding acquisition, writing—original draft, writing–review and editing. H.H.: Data curation, validation, formal analysis, writing—original draft. Q.Q.: Conceptualization, methodology, resources, writing—review and editing. All authors have read and agreed to the published version of the manuscript.
Funding
This research was funded by the National Natural Science Foundation of China, grant number 51908562 and 52208426; the Science and Technology Research Program of Chongqing Municipal Education Commission, grant number KJQN20230074 and KJQN202200743; the Chongqing Key Special Project for Technological Innovation and Application Development, grant number CSTB2022TIAD-KPX0102; the Science and Technology Project of the Department of Transportation of Jiangxi Province, grant number 2022H0024; the Standardization Project of Hunan Province; and Chongqing graduate tutor team building project, grant number JDDSTD2022009.
Conflicts of Interest
The authors declare no conflicts of interest.
References
- Ryding, S.-O. ISO 14042 Environmental management• Life cycle assessment• life cycle impact assessment. Int. J. Life Cycle Assess. 1999, 4, 307. [Google Scholar] [CrossRef]
- Wang, H.; Wang, X.; Zhang, C.; Wang, C.; Li, S. Analysis on the susceptibility of environmental geological disasters considering regional sustainable development. Environ. Sci. Pollut. Res. 2023, 30, 9749–9762. [Google Scholar] [CrossRef] [PubMed]
- Sun, X.; Miao, L.; Chen, R.; Wang, H.; Xia, J. Surface rainfall erosion resistance and freeze-thaw durability of bio-cemented and polymer-modified loess slopes. J. Environ. Manag. 2022, 301, 113883. [Google Scholar] [CrossRef] [PubMed]
- Chen, Z.; Li, W.; Qiao, O.; Han, Y.; Shi, J.; Li, C. The corrosiveness of artificial soil may lead to the collapse of eco-engineering projects on rock slopes in mining areas. Ecol. Eng. 2022, 181, 106673. [Google Scholar] [CrossRef]
- Liu, T.; Yu, L.; Chen, X.; Wu, H.; Lin, H.; Li, C.; Hou, J. Environmental laws and ecological restoration projects enhancing ecosystem services in China: A meta-analysis. J. Environ. Manag. 2023, 327, 116810. [Google Scholar] [CrossRef]
- Hendrickson, C.; Horvath, A.; Joshi, S.; Lave, L. Peer reviewed: Economic input–output models for environmental life-cycle assessment. Environ. Sci. Technol. 1998, 32, 184A–191A. [Google Scholar] [CrossRef]
- Darnay, A.; Nuss, G. Environmental Impacts of Coca-Cola Beverage Containers; Midwest Research Institute: Kansas City, MO, USA, 1971. [Google Scholar]
- Erlandsson, M.; Borg, M. Generic LCA-methodology applicable for buildings, constructions and operation services—Today practice and development needs. Build. Environ. 2003, 38, 919–938. [Google Scholar] [CrossRef]
- Yang, Y.; Fan, Y.; Basang, C.M.; Lu, J.; Zheng, C.; Wen, Z. Different biomass production and soil water patterns between natural and artificial vegetation along an environmental gradient on the Loess Plateau. Sci. Total Environ. 2022, 814, 152839. [Google Scholar] [CrossRef]
- Nwodo, M.N.; Anumba, C.J. A review of life cycle assessment of buildings using a systematic approach. Build. Environ. 2019, 162, 106290. [Google Scholar] [CrossRef]
- Faiz, H.; Ng, S.; Rahman, M. A state-of-the-art review on the advancement of sustainable vegetation concrete in slope stability. Constr. Build. Mater. 2022, 326, 126502. [Google Scholar] [CrossRef]
- Seo, Y.; Kim, S.-M. Estimation of materials-induced CO2 emission from road construction in Korea. Renew. Sustain. Energy Rev. 2013, 26, 625–631. [Google Scholar] [CrossRef]
- Celauro, C.; Corriere, F.; Guerrieri, M.; Casto, B.L. Environmentally appraising different pavement and construction scenarios: A comparative analysis for a typical local road. Transp. Res. Part D Transp. Environ. 2015, 34, 41–51. [Google Scholar] [CrossRef]
- Gulotta, T.; Mistretta, M.; Praticò, F. A life cycle scenario analysis of different pavement technologies for urban roads. Sci. Total Environ. 2019, 673, 585–593. [Google Scholar] [CrossRef] [PubMed]
- Noland, R.B.; Hanson, C.S. Life-cycle greenhouse gas emissions associated with a highway reconstruction: A New Jersey case study. J. Clean. Prod. 2015, 107, 731–740. [Google Scholar] [CrossRef]
- Shen, Y.; Li, Q.; Pei, X.; Wei, R.; Yang, B.; Lei, N.; Zhang, X.; Yin, D.; Wang, S.; Tao, Q. Ecological Restoration of Engineering Slopes in China—A Review. Sustainability 2023, 15, 5354. [Google Scholar] [CrossRef]
- Leal, D.; Winter, M.G.; Seddon, R.; Nettleton, I.M. A comparative life cycle assessment of innovative highway slope repair techniques. Transp. Geotech. 2020, 22, 100322. [Google Scholar] [CrossRef]
- Liang, Y.; Long, W.; Su, P.; Yang, F. Causes and treatment measures for deformation of retaining soil and slope. Arab. J. Geosci. 2021, 14, 546. [Google Scholar] [CrossRef]
- Ciambrone, D.F. Environmental Life Cycle Analysis; CRC Press: Boca Raton, FL, USA, 1997. [Google Scholar]
- Tam, V.W.; Zhou, Y.; Illankoon, C.; Le, K.N. A critical review on BIM and LCA integration using the ISO 14040 framework. Build. Environ. 2022, 213, 108865. [Google Scholar] [CrossRef]
- Abdelaal, F.; Guo, B.H. Stakeholders’ perspectives on BIM and LCA for green buildings. J. Build. Eng. 2022, 48, 103931. [Google Scholar] [CrossRef]
- Xu, J.; Teng, Y.; Pan, W.; Zhang, Y. BIM-integrated LCA to automate embodied carbon assessment of prefabricated buildings. J. Clean. Prod. 2022, 374, 133894. [Google Scholar] [CrossRef]
- Van Roijen, E.C.; Miller, S.A. A review of bioplastics at end-of-life: Linking experimental biodegradation studies and life cycle impact assessments. Resour. Conserv. Recycl. 2022, 181, 106236. [Google Scholar] [CrossRef]
- ISO 14043; Environmental Management—Life Cycle Assessment—Life Cycle, Interpretation. ISO: Geneva, Switzerland, 2000.
- Mulya, K.S.; Zhou, J.; Phuang, Z.X.; Laner, D.; Woon, K.S. A systematic review of life cycle assessment of solid waste management: Methodological trends and prospects. Sci. Total Environ. 2022, 831, 154903. [Google Scholar] [CrossRef] [PubMed]
- Winter, M.G.; Nettleton, I.M.; Seddon, R.; Codd, J. The assessment of innovative geotechnical slope repair techniques. Proc. Inst. Civ. Eng.-Geotech. Eng. 2022, 1–9. [Google Scholar] [CrossRef]
- Cordi, A.M.; Gallagher, P.M.; Spatari, S. Environmental life cycle performance of recycled materials for sustainable slope engineering. In Proceedings of the Geo-Congress 2013: Stability and Performance of Slopes and Embankments III, San Diego, CA, USA, 3–7 March 2013; pp. 1490–1501. [Google Scholar]
- Frischknecht, R.; Stucki, M.; Büsser, S.; Itten, R.; Wallbaum, H. Comparative life cycle assessment of geosynthetics versus conventional construction materials. Ground Eng. 2012, 45, 24–28. [Google Scholar]
- Storesund, R.; Massey, J.; Kim, Y. Life cycle impacts for concrete retaining walls vs. bioengineered slopes. In Proceedings of the GeoCongress 2008: Geosustainability and Geohazard Mitigation, New Orleans, LA, USA, 9–12 March 2008; pp. 875–882. [Google Scholar]
- Zhang, R.; Long, M.; Zheng, J. Comparison of environmental impacts of two alternative stabilization techniques on expansive soil slopes. Adv. Civ. Eng. 2019, 2019, 9454929. [Google Scholar] [CrossRef]
- Samuelsson, I.; Larsson, S.; Spross, J. Life cycle assessment and life cycle cost analysis for geotechnical engineering: Review and research gaps. In Proceedings of the IOP Conference Series: Earth and Environmental Science, Surakarta, Indonesia, 24–25 August 2021; p. 012031. [Google Scholar]
- VandenBerge, D.R.; Esser, A.J.; Bumpas, K. An overview of sustainability applied to earth structures. In Proceedings of the IFCEE 2015, San Antonio, TX, USA, 17–21 March 2015; pp. 2707–2716. [Google Scholar]
- Hoerbinger, S.; Obriejetan, M. Environmental Life Cycle Assessment Model for Soil Bioengineering Measures on Infrastructure Slopes. In Proceedings of the EGU General Assembly Conference Abstracts, Vienna, Austria, 12–17 April 2015; p. 7924. [Google Scholar]
- Xiong, D.; Chen, F.; Lv, K.; Tan, X.; Huang, Y. The performance and temporal dynamics of vegetation concretes comprising three herbaceous species in soil stabilization and slope protection. Ecol. Eng. 2023, 188, 106873. [Google Scholar] [CrossRef]
- Yu, G.-Q.; Li, Z.-B.; Pei, L.; Li, P.; Zhang, X. Study on mechanism of regulation measures on water erosion process in the slope system. In Proceedings of the 2011 International Conference on Electric Technology and Civil Engineering (ICETCE), Lushan, China, 22–24 April 2011; pp. 2636–2639. [Google Scholar]
- Fu, H.; Zha, H.; Zeng, L.; Chen, C.; Jia, C.; Bian, H. Research progress on ecological protection technology of highway slope: Status and challenges. Transp. Saf. Environ. 2020, 2, 3–17. [Google Scholar] [CrossRef]
- Zhang, M.; Hu, D.; Fan, J. Study on the application of vegetation protection and ecological restoration technology in stone slope. In Proceedings of the IOP Conference Series: Earth and Environmental Science, Changchun, China, 21–23 August 2020; p. 042024. [Google Scholar]
- Islam, M.; Hoque, M.; Mallick, S.; Parshi, F.; Islam, T. Performance evaluation of bioengineering in slope protection for different soils. In Proceedings of the International Conference on Disaster Risk Mitigation, Cancun, Mexico, 22–23 May 2017. [Google Scholar]
- Yi, W.; Xiling, Z.; Jinglin, Y.; Wenxuan, W.; Tian, T. A comprehensive performance evaluation of the cement-based expanded perlite plastering mortar. Sci. Total Environ. 2023, 858, 159705. [Google Scholar] [CrossRef]
- Song, Z.; Wang, T.; Wang, J.; Xiao, K.; Yang, T. Uniaxial compression mechanical properties and damage constitutive model of limestone under osmotic pressure. Int. J. Damage Mech. 2022, 31, 557–581. [Google Scholar] [CrossRef]
- Rodríguez, R.F.; Cardoso, R. Study of biocementation treatment to prevent erosion by concentrated water flow in a small-scale sand slope. Transp. Geotech. 2022, 37, 100873. [Google Scholar] [CrossRef]
- Li, H.; Chen, H.; Li, X.; Zhang, F. Design and construction application of concrete canvas for slope protection. Powder Technol. 2019, 344, 937–946. [Google Scholar] [CrossRef]
- Faiz, A.; Shah, B. Climate resilient slope stabilization for transport infrastructures. In Transport Infrastructure and Systems; CRC Press: Boca Raton, FL, USA, 2017; pp. 55–62. [Google Scholar]
- Li, J.; Hu, D.; Li, L.; Li, C. Research on Application of Lattice Anchor System Design and Construction Monitoring in Slope Protection. In Proceedings of the IOP Conference Series: Earth and Environmental Science, Surakarta, Indonesia, 24–25 August 2021; p. 022049. [Google Scholar]
- Su, H.; Wu, D.; Lu, Y.; Peng, X.; Wang, X.; Chen, W.; Wang, S. Experimental and numerical study on stability performance of new ecological slope protection using bolt-hinge anchored block. Ecol. Eng. 2021, 172, 106409. [Google Scholar] [CrossRef]
- Jiang, P.; Li, J.; Zuo, S.; Cui, X.Z. Ecological retaining wall for high-steep slopes: A case study in the ji-lai expressway, eastern China. Adv. Civ. Eng. 2020, 2020, 5106397. [Google Scholar] [CrossRef]
- Stokes, A.; Spanos, I.; Norris, J.E.; Cammeraat, E. Eco-and Ground Bio-engineering: The Use of Vegetation to Improve Slope Stability. In Proceedings of the First International Conference on Eco-Engineering, Thessaloniki, Greece, 13–17 September 2004; Springer Science & Business Media: Berlin, Germany, 2007; Volume 103. [Google Scholar]
- Shi, P.; Li, P.; Li, Z.; Sun, J.; Wang, D.; Min, Z. Effects of grass vegetation coverage and position on runoff and sediment yields on the slope of Loess Plateau, China. Agric. Water Manag. 2022, 259, 107231. [Google Scholar] [CrossRef]
- Sun, L.; Zhang, B.; Yin, Z.; Guo, H.; Siddique, K.H.; Wu, S.; Yang, J. Assessing the performance of conservation measures for controlling slope runoff and erosion using field scouring experiments. Agric. Water Manag. 2022, 259, 107212. [Google Scholar] [CrossRef]
- Sun, Y.; Li, H.; Cheng, Z.; Dong, J.; Wang, Y. Experimental and Numerical Simulation Study on Mechanical Properties of Shallow Slope Root-soil Composite in Qinghai Area. KSCE J. Civ. Eng. 2023, 27, 2834–2852. [Google Scholar] [CrossRef]
- Ng, C.W.W.; Guo, H.; Ni, J.; Zhang, Q.; Chen, Z. Effects of soil–plant-biochar interactions on water retention and slope stability under various rainfall patterns. Landslides 2022, 19, 1379–1390. [Google Scholar] [CrossRef]
- Li, J.; Wang, X.; Jia, H.; Liu, Y.; Zhao, Y.; Shi, C.; Zhang, F. Effect of herbaceous plant root density on slope stability in a shallow landslide-prone area. Nat. Hazards 2022, 112, 2337–2360. [Google Scholar] [CrossRef]
- Hao, G.; Wang, L.; Liu, X. Methods for Studying the Effect of Plant Roots on Soil Mechanical Reinforcement: A Review. J. Soil Sci. Plant Nutr. 2023, 23, 2893–2912. [Google Scholar] [CrossRef]
- Nomleni, I.A.; Hung, W.-Y.; Soegianto, D.P. Dynamic performance of root-reinforced slopes by centrifuge modeling tests. Landslides 2023, 20, 1187–1210. [Google Scholar] [CrossRef]
- Zhang, H.; Zhang, K.; Liu, J.; Wang, M.; Cen, Y. Quantifying the effects of grass distribution patterns on the relative hydrodynamic parameters of overland flow. Hydrol. Process. 2022, 36, e14707. [Google Scholar] [CrossRef]
- Aziz, S.; Islam, M.S. Erosion and runoff reduction potential of vetiver grass for hill slopes: A physical model study. Int. J. Sediment Res. 2023, 38, 49–65. [Google Scholar] [CrossRef]
- Wu, L.; Liu, X.; Yu, Y.; Ma, X. Biochar, grass, and cross-ridge reshaped the surface runoff nitrogen under consecutive rainstorms in loessial sloping lands. Agric. Water Manag. 2022, 261, 107354. [Google Scholar] [CrossRef]
- Huang, D.; Han, J.; Wu, J.; Wang, K.; Wu, W.; Teng, W.; Sardo, V. Grass hedges for the protection of sloping lands from runoff and soil loss: An example from Northern China. Soil Tillage Res. 2010, 110, 251–256. [Google Scholar] [CrossRef]
- Yang, Y.; Yang, J.; Zhao, T.; Huang, X.; Zhao, P. Ecological restoration of highway slope by covering with straw-mat and seeding with grass–legume mixture. Ecol. Eng. 2016, 90, 68–76. [Google Scholar] [CrossRef]
- Xu, Y.; Zhang, H.-R. Design of soilbag-protected slopes in expansive soils. Geotext. Geomembr. 2021, 49, 1036–1045. [Google Scholar] [CrossRef]
- Wang, Z. Ecological Protection Design Strategy for Mountain Tourism Highway Slopes. J. World Archit. 2021, 5, 9–12. [Google Scholar] [CrossRef]
- Lai, H.; Du, J.; Zhou, C.; Liu, Z. Experimental study on ecological performance improvement of sprayed planting concrete based on the addition of polymer composite material. Int. J. Environ. Res. Public Health 2022, 19, 12121. [Google Scholar] [CrossRef]
- Ngo, T.P.; Takahashi, A.; Likitlersuang, S. Centrifuge modelling of a soil slope reinforced by geosynthetic cementitious composite mats. Geotech. Geol. Eng. 2023, 41, 881–896. [Google Scholar] [CrossRef]
- Ghasemi, P.; Montoya, B.M. Field implementation of microbially induced calcium carbonate precipitation for surface erosion reduction of a coastal plain sandy slope. J. Geotech. Geoenviron. Eng. 2022, 148, 04022071. [Google Scholar] [CrossRef]
- Li, X.; Qin, Z.; Tian, Y.; Zhang, H.; Zhao, H.; Shen, J.; Shao, W.; Jiang, G.; Guo, X.; Zhang, J. Study on stability and ecological restoration of soil-covered rocky slope of an abandoned mine on an island in rainy regions. Sustainability 2022, 14, 12959. [Google Scholar] [CrossRef]
- Li, S.; Li, Y.; Shi, J.; Zhao, T.; Yang, J. Optimizing the formulation of external-soil spray seeding with sludge using the orthogonal test method for slope ecological protection. Ecol. Eng. 2017, 102, 527–535. [Google Scholar] [CrossRef]
- Seo, S.; Lee, M.; Im, J.; Kwon, Y.-M.; Chung, M.-K.; Cho, G.-C.; Chang, I. Site application of biopolymer-based soil treatment (BPST) for slope surface protection: In-situ wet-spraying method and strengthening effect verification. Constr. Build. Mater. 2021, 307, 124983. [Google Scholar] [CrossRef]
- Zhang, Z.; Yang, H.; Yu, W.; Li, X.; Liu, Q.; Zhang, C. Vegetative substrate configuration technology for tower foundation slope of transmission line in arid area considering species suitability. Environ. Prog. Sustain. Energy 2023, 42, e14184. [Google Scholar] [CrossRef]
- Xu, Y.; Su, C.; Huang, Z.; Yang, C.; Yang, Y. Research on the protection of expansive soil slopes under heavy rainfall by anchor-reinforced vegetation systems. Geotext. Geomembr. 2022, 50, 1147–1158. [Google Scholar] [CrossRef]
- Medl, A.; Mayr, S.; Rauch, H.P.; Weihs, P.; Florineth, F. Microclimatic conditions of ‘Green Walls’, a new restoration technique for steep slopes based on a steel grid construction. Ecol. Eng. 2017, 101, 39–45. [Google Scholar] [CrossRef]
- Shu, S.; Muhunthan, B.; Badger, T.C.; Grandorff, R. Load testing of anchors for wire mesh and cable net rockfall slope protection systems. Eng. Geol. 2005, 79, 162–176. [Google Scholar] [CrossRef]
- Fan, C.-C.; Su, C.-F. Role of roots in the shear strength of root-reinforced soils with high moisture content. Ecol. Eng. 2008, 33, 157–166. [Google Scholar] [CrossRef]
- Wang, Y.; Liu, J.; Lin, C.; Ma, X.-F.; Song, Z.-Z.; Chen, Z.-H.; Jiang, C.-H.; Qi, C.-Q. Polyvinyl acetate-based soil stabilization for rock slope ecological restoration. J. Environ. Manag. 2022, 324, 116209. [Google Scholar] [CrossRef]
- Du, H. Application of vetiver grass in slope retaining and consolidation project in suide test area. J. Discret. Math. Sci. Cryptogr. 2017, 20, 1321–1326. [Google Scholar] [CrossRef]
- Yang, Y.; Liu, D.; Xiao, H.; Chen, J.; Ding, Y.; Xia, D.; Xia, Z.; Xu, W. Evaluating the effect of the ecological restoration of quarry slopes in Caidian District, Wuhan City. Sustainability 2019, 11, 6624. [Google Scholar] [CrossRef]
- Wang, D.-Y.; Zun, Q.-J.; Wang, J.; Huang, W.-Y. Three-dimensional geonet ecological slope protection technology and its engineering application. In Proceedings of the IOP Conference Series: Materials Science and Engineering, Chennai, India, 16–17 September 2020; p. 012055. [Google Scholar]
- Fox, J.; Bhattarai, S.; Gyasi-Agyei, Y. Evaluation of different seed mixtures for grass establishment to mitigate soil erosion on steep slopes of railway batters. J. Irrig. Drain. Eng. 2011, 137, 624–631. [Google Scholar] [CrossRef]
- Rebitzer, G.; Ekvall, T.; Frischknecht, R.; Hunkeler, D.; Norris, G.; Rydberg, T.; Schmidt, W.-P.; Suh, S.; Weidema, B.P.; Pennington, D.W. Life cycle assessment: Part 1: Framework, goal and scope definition, inventory analysis, and applications. Environ. Int. 2004, 30, 701–720. [Google Scholar] [CrossRef] [PubMed]
- Stokes, A.; Douglas, G.B.; Fourcaud, T.; Giadrossich, F.; Gillies, C.; Hubble, T.; Kim, J.H.; Loades, K.W.; Mao, Z.; McIvor, I.R. Ecological mitigation of hillslope instability: Ten key issues facing researchers and practitioners. Plant Soil 2014, 377, 1–23. [Google Scholar] [CrossRef]
- Wang, X.-C.; Klemeš, J.J.; Wang, Y.; Dong, X.; Wei, H.; Xu, Z.; Varbanov, P.S. Water-Energy-Carbon Emissions nexus analysis of China: An environmental input-output model-based approach. Appl. Energy 2020, 261, 114431. [Google Scholar] [CrossRef]
- Liu, H.; Li, J.; Sun, Y.; Wang, Y.; Zhao, H. Estimation method of carbon emissions in the embodied phase of low carbon building. Adv. Civ. Eng. 2020, 2020, 8853536. [Google Scholar] [CrossRef]
- Cheng, S.; Zhou, X.; Zhou, H. Study on Carbon Emission Measurement in Building Materialization Stage. Sustainability 2023, 15, 5717. [Google Scholar] [CrossRef]
- Yang, J.; Deng, Z.; Guo, S.; Chen, Y. Development of bottom-up model to estimate dynamic carbon emission for city-scale buildings. Appl. Energy 2023, 331, 120410. [Google Scholar] [CrossRef]
- GB/T 51366-2019; Standard for Building Carbon Emission Calculation. China Architecture & Building Press: Beijing, China, 2019. (In Chinese)
- Noussan, M.; Campisi, E.; Jarre, M. Carbon Intensity of Passenger Transport Modes: A Review of Emission Factors, Their Variability and the Main Drivers. Sustainability 2022, 14, 10652. [Google Scholar] [CrossRef]
- Song, M.; Liu, X.; Hu, S.; Wen, Q.; Yan, D. Building a greener future—Progress of the green building technology in the “13th Five-Year Plan” of China. In Building Simulation; Tsinghua University Press: Beijing, China, 2022; pp. 1705–1707. [Google Scholar]
- Fan, H. A critical review and analysis of construction equipment emission factors. Procedia Eng. 2017, 196, 351–358. [Google Scholar] [CrossRef]
- Finnveden, G.; Hauschild, M.Z.; Ekvall, T.; Guinée, J.; Heijungs, R.; Hellweg, S.; Koehler, A.; Pennington, D.; Suh, S. Recent developments in life cycle assessment. J. Environ. Manag. 2009, 91, 1–21. [Google Scholar] [CrossRef] [PubMed]
- Cheng, B.; Li, J.; Tam, V.W.; Yang, M.; Chen, D. A BIM-LCA approach for estimating the greenhouse gas emissions of large-scale public buildings: A case study. Sustainability 2020, 12, 685. [Google Scholar] [CrossRef]
- Houghton, J.T.; Jenkins, G.J.; Ephraums, J.J. Climate change: The IPCC scientific assessment. Am. Sci. 1990, 80, 263. [Google Scholar]
- Zhang, Y.; Yan, D.; Hu, S.; Guo, S. Modelling of energy consumption and carbon emission from the building construction sector in China, a process-based LCA approach. Energy Policy 2019, 134, 110949. [Google Scholar] [CrossRef]
- Wang, X.; Gu, K. Present condition of estimate method of carbon emission in China. Environ. Sci. Manag 2006, 31, 78–80. [Google Scholar]
- Chen, C.; Hu, Q.-Q.; Deng, Y.-W.; Li, Q.; Li, Y. Emission Factors of CO and NOx of Urban Tunnel with Concave Structure Based on Measurement Method. China J. Highw. Transp. 2017, 30, 116. [Google Scholar]
- Reference manual. In Revised IPCC Guidelines for National Greenhouse Gas Inventories; IPCC: Geneva, Switzerland, 1996; Volume 3.
- Heimburger, A.M.; Harvey, R.M.; Shepson, P.B.; Stirm, B.H.; Gore, C.; Turnbull, J.; Cambaliza, M.O.; Salmon, O.E.; Kerlo, A.-E.M.; Lavoie, T.N. Assessing the optimized precision of the aircraft mass balance method for measurement of urban greenhouse gas emission rates through averaging. Elem. Sci. Anthropocene 2017, 5, 26. [Google Scholar] [CrossRef]
- Ipcc, I. Guidelines for National Greenhouse Gas Inventories; Eggleston, H.S., Buendia, L., Miwa, K., Ngara, T., Tanabe, K., Eds.; Prepared by the National Greenhouse Gas Inventories Programme; IGES: Tokyo, Japan, 2006. [Google Scholar]
- Liu, Z.; Guan, D.; Wei, W.; Davis, S.J.; Ciais, P.; Bai, J.; Peng, S.; Zhang, Q.; Hubacek, K.; Marland, G. Reduced carbon emission estimates from fossil fuel combustion and cement production in China. Nature 2015, 524, 335–338. [Google Scholar] [CrossRef]
- Schwarzböck, T.; Rechberger, H.; Cencic, O.; Fellner, J. Determining national greenhouse gas emissions from waste-to-energy using the Balance Method. Waste Manag. 2016, 49, 263–271. [Google Scholar] [CrossRef]
- Singh, P.; Kansal, A.; Carliell-Marquet, C. Energy and carbon footprints of sewage treatment methods. J. Environ. Manag. 2016, 165, 22–30. [Google Scholar] [CrossRef]
- Wang, Q.; Zeng, Y.-E.; Wu, B.-W. Exploring the relationship between urbanization, energy consumption, and CO2 emissions in different provinces of China. Renew. Sustain. Energy Rev. 2016, 54, 1563–1579. [Google Scholar] [CrossRef]
- Eggleston, H.; Buendia, L.; Miwa, K.; Ngara, T.; Tanabe, K. 2006 IPCC Guidelines for National Greenhouse Gas Inventories; IPCC: Geneva, Switzerland, 2006. [Google Scholar]
- Du, L.; Wei, C.; Cai, S. Economic development and carbon dioxide emissions in China: Provincial panel data analysis. China Econ. Rev. 2012, 23, 371–384. [Google Scholar] [CrossRef]
- Abdul-Wahab, S.A.; Charabi, Y.; Al-Maamari, R.; Al-Rawas, G.A.; Gastli, A.; Chan, K. CO2 greenhouse emissions in Oman over the last forty-two years. Renew. Sustain. Energy Rev. 2015, 52, 1702–1712. [Google Scholar] [CrossRef]
- Munksgaard, J.; Wier, M.; Lenzen, M.; Dey, C. Using input-output analysis to measure the environmental pressure of consumption at different spatial levels. J. Ind. Ecol. 2005, 9, 169–185. [Google Scholar] [CrossRef]
- Jackson, T.; Papathanasopoulou, E.; Bradley, P.; Druckman, A. Attributing Carbon Emissions to Functional Household Needs: A pilot framework for the UK. In Proceedings of the International Conference on Regional and Urban Modelling, Brussels, Belgium, 1–2 June 2006; pp. 1–2. [Google Scholar]
- Yu, Y.; Li, S.; Sun, H.; Taghizadeh-Hesary, F. Energy carbon emission reduction of China’s transportation sector: An input–output approach. Econ. Anal. Policy 2021, 69, 378–393. [Google Scholar] [CrossRef]
- Tunç, G.İ.; Türüt-Aşık, S.; Akbostancı, E. CO2 emissions vs. CO2 responsibility: An input–output approach for the Turkish economy. Energy Policy 2007, 35, 855–868. [Google Scholar] [CrossRef]
- Zhang, G.; Liu, M.; Gao, X. Dynamic characteristic analysis of indirect carbon emissions caused by Chinese urban and rural residential consumption based on time series input-output tables from 2002 to 2011. Math. Probl. Eng. 2014, 2014, 297637. [Google Scholar] [CrossRef]
- Wang, S.; Yu, Y.; Jiang, T.; Nie, J. Analysis on carbon emissions efficiency differences and optimization evolution of China’s industrial system: An input-output analysis. PLoS ONE 2022, 17, e0258147. [Google Scholar] [CrossRef]
- Chou, J.-S.; Yeh, K.-C. Life cycle carbon dioxide emissions simulation and environmental cost analysis for building construction. J. Clean. Prod. 2015, 101, 137–147. [Google Scholar] [CrossRef]
- Peng, C. Calculation of a building’s life cycle carbon emissions based on Ecotect and building information modeling. J. Clean. Prod. 2016, 112, 453–465. [Google Scholar] [CrossRef]
- Zhang, Y.; Peng, T.; Yuan, C.; Ping, Y. Assessment of Carbon Emissions at the Logistics and Transportation Stage of Prefabricated Buildings. Appl. Sci. 2022, 13, 552. [Google Scholar] [CrossRef]
- Mo, Z.; Gao, T.; Qu, J.; Cai, G.; Cao, Z.; Jiang, W. An Empirical Study of Carbon Emission Calculation in the Production and Construction Phase of A Prefabricated Office Building from Zhejiang, China. Buildings 2022, 13, 53. [Google Scholar] [CrossRef]
- Chen, J.; Fan, W.; Li, D.; Liu, X.; Song, M. Driving factors of global carbon footprint pressure: Based on vegetation carbon sequestration. Appl. Energy 2020, 267, 114914. [Google Scholar] [CrossRef]
- Xue, P.; Weipeng, L. Research on intelligent transportation logistics technology based on energy saving and emission reduction. In Proceedings of the IOP Conference Series: Earth and Environmental Science, Surakarta, Indonesia, 24–25 August 2021; p. 032020. [Google Scholar]
- Bakker, S.; Zuidgeest, M.; De Coninck, H.; Huizenga, C. Transport, development and climate change mitigation: Towards an integrated approach. Transp. Rev. 2014, 34, 335–355. [Google Scholar] [CrossRef]
- Wei, X.; Ye, M.; Yuan, L.; Bi, W.; Lu, W. Analyzing the freight characteristics and carbon emission of construction waste hauling trucks: Big data analytics of Hong Kong. Int. J. Environ. Res. Public Health 2022, 19, 2318. [Google Scholar] [CrossRef] [PubMed]
- Yu, D.; Zhang, H. The life cycle analysis of energy consumption and emission of pure electric van and diesel van. Acta Sci. Circumstantiae 2019, 39, 2043–2052. [Google Scholar]
- Yang, Z.; Chen, H.; Mi, L.; Li, P.; Qi, K. Green building technologies adoption process in China: How environmental policies are reshaping the decision-making among alliance-based construction enterprises? Sustain. Cities Soc. 2021, 73, 103122. [Google Scholar] [CrossRef]
Disclaimer/Publisher’s Note: The statements, opinions and data contained in all publications are solely those of the individual author(s) and contributor(s) and not of MDPI and/or the editor(s). MDPI and/or the editor(s) disclaim responsibility for any injury to people or property resulting from any ideas, methods, instructions or products referred to in the content. |
© 2024 by the authors. Licensee MDPI, Basel, Switzerland. This article is an open access article distributed under the terms and conditions of the Creative Commons Attribution (CC BY) license (https://creativecommons.org/licenses/by/4.0/).