Article

The Water–Energy–Carbon Coupling Coordination Level in China

Business School, Hohai University, Nanjing 211100, China
Sustainability 2024, 16(1), 383; https://doi.org/10.3390/su16010383
Submission received: 1 November 2023 / Revised: 21 November 2023 / Accepted: 26 December 2023 / Published: 31 December 2023

Abstract

:
The water–energy–carbon (WEC) nexus is a complex, systematic relationship whose influential factors can be interdependent, as well as interactive. Although many action has been taken to achieve the goal of global carbon emission reductions, the disparity and unbalanced among water–energy–carbon systems hundles urban comprehensive development which can not be ignored. Therefore, investigating the water–energy–carbon (WEC) nexus become critical for the global. This study explores the relationship between water utilization, energy consumption, and carbon emissions systematically and take China, one of the largest global carbon emission countries in the world with high energy consumption and unevenly distributed water resources, as an example to investigate coupling coordination model. We selected 2004–2021 data from China’s 30 provinces as our research material, explored them using the entropy weight method, and attempted to study the coupling coordination level of the WEC nexus. Multiple linear regression (MLR) was used to identify the possible influential factors in the WEC nexus. In addition, Spatial correlation of the water-energy-carbon coupling coordination level in 31 provinces and cities has also been researched by Spatial Durbin Model(SDM). The results show that (1) in general, the level of WEC coupling coordination in China is increasing, and the spatial differences between different provinces are large; (2) the lowest level of WEC coupling coordination is mainly distributed in the central region, and the highest level is found in the southwestern region; and (3) water production and hydraulic engineering investment are important factors affecting the coupling coordination of the WEC nexus.

1. Introduction

With the continuous development of our population and society, energy consumption contributes a large amount of carbon emissions, which intensifies global climate change [1]. At the same time, many areas of the world are facing varying degrees of water resource constraints. The successful realization of carbon balance requires not only the consideration of reducing carbon emissions and increasing carbon sinks, but also the full consideration of the level of coordination development among different systems [2]. In this case, identifying the relationship between water, energy, and carbon becomes increasingly important.
The WEC nexus is a systematic, interdependent, and complex relationship [3]. At present, many scholars have explored the interconnections between water and energy [4], water and carbon [5], and energy and carbon [6]. The WEC nexus provides a systematic perspective that combines these three factors into a group to analyze their relationship, their evolutionary trend, and their influencing factors. Understanding WEC relationships in cities is important for planning and improving water and energy sector policies to achieve sustainable water management and reduce greenhouse gas emissions [7].
As a country with one of the largest populations, China has been facing serious problems related to water shortages and unbalanced energy consumption. As shown in Figure 1, the distribution of water resources in China exhibits obvious spatial differences, with more water in the southern region and a shortage of water in the central and western regions. Energy consumption and carbon emissions are mainly distributed in the more developed coastal cities in central, eastern, and southern China, including the Beijing–Tianjin–Hebei region, the Yangtze River Delta region, and the Pearl River Delta region. Data related to water resources, energy, and carbon emissions are sourced from the CSMAR database, which can be found at https://data.csmar.com (accessed on 31 October 2023).
The lack of coordination of the development level of water, energy, and carbon can be dangerous [8]. At present, China is implementing a strategy considering dual carbon targets [9], and carbon emission reductions are being carried out through various methods, such as changing the industrial and the energy consumption structures. However, there are large differences regarding water resources and energy consumption between provinces, and each area is faced with different environmental governance problems [10].
Many studies have focused on the water–energy–carbon relationship at different levels, including the urban water system dimension, water consumption and carbon emissions in industrial production, agricultural irrigation, and interregional carbon and water footprints. As shown in Figure 2, water utilization and energy consumption activities can both cause carbon dioxide emissions. At the same time, water resource systems and energy systems can interconnect and interact. Energy production is heavily dependent on water consumption, and the expansion of the energy sector is inevitable in the context of population and economic growth. In contrast, the processes of the water cycle, including water production, wastewater treatment, and water distribution, also cause a large amount of energy consumption. Meanwhile, carbon emissions and carbon sinks, which are two important paths in the WEC nexus, need to be considered in the carbon balance.
(I)
Water system:
The water system comprises numerous human activities, including water production, water treatment, and water distribution, and most of these incur high energy demands. The reductions in greenhouse gas emissions (GGEs) and the carbon footprint in the water sector have proven to be crucial for water resource management [11]. Airshed [12] conducted research on water systems in Saudi Arabia, and Stokes [13] studied the energy consumption and GGEs in the water supply process. Griffiths [14] explored the embedded energy and carbon emissions in the water system from the national perspective. Water, energy, and carbon emissions are interconnected [15]. The water–energy nexus interacts through the utilization of water and energy consumption. Carbon emissions can be lowered by saving water and energy [16].
(II)
Energy system:
The energy system is also an indispensable link in the study of the water–energy–carbon relationship, including both energy production and utilization. The production process, including the extraction and burning of many fossil fuels, leads to increases in greenhouse gas and carbon emissions [17]. In the context of climate change, the field of green and low-carbon energy development has received increasing attention. Hydropower, photovoltaic systems, nuclear energy, and other clean energy production methods have become important options [18]. Naveed [19] integrated an energy–water system and stated that Hydropower can optimize the energy–water system. Two of the main influential factors in energy emissions included low water-use efficiency and the rapid growth of the GDP, and the change in energy and carbon emissions was determined by water resource utilization and the economic structure [20].
(III)
Carbon system:
The carbon cycle has become a hot research topic under the background of climate change. Researchers conduct studies to analyze its inner mechanisms and a reasonable path to reach the carbon peak and carbon neutrality [21]. Increasing carbon sinks and reducing carbon emissions are two important ways to achieve carbon neutrality [22]. Both are related to the WEC nexus. Water resources are conducive to carbon sequestration, including water body carbon sinks, wetland carbon sinks, and forest carbon sinks. At the same time, many energy-consuming activities demand water. In this case, different scenarios have been developed to test different water, energy, and carbon system plans [23]. Zhang [24] provided a regional water–carbon collaborative research perspective based on the power system. Miller [25] argued that a shift to a less carbon-intensive energy supply could lead to an increase in the water demand, depending on the technology choices, noting that Ontario’s use of renewable energy to generate electricity reduces carbon emissions but significantly increases the amount of water consumed. Therefore, a balance needs to be struck between water use and the carbon footprint.
At present, a significant amount of research related to the WEC nexus has been conducted by environmental experts. The current research mainly investigates urban water systems [26], regional industry [27] and supply chain sector perspectives [28], agricultural production [29] and irrigation carbon emissions [30,31], energy system water consumption, carbon footprints [32,33], water footprints [34], and regional inter-provincial water–energy–carbon transfer [35]. In general, the existing studies offer a certain understanding regarding the WEC nexus. However, these concerns require further consideration. First, few studies have systematically illustrated the WEC relationship from the perspective of a larger spatial level. Second, most current findings are usually derived from separate trade analyses of water, energy, and carbon. The research on the development level and the coupling coordination relationship of the WEC nexus is not comprehensive. As one of the most important resources and environmental impacts, the WEC nexus can better develop and optimize a consistent evaluation framework for WEC relationships. In addition, the current scholarly evaluation system of the water–carbon linkage system has always focused on the level of carbon emission, ignoring that the essence of the carbon cycle is the balance between carbon emission and carbon sink. The integration of carbon sinks and carbon emissions into the evaluation of the water carbon system is urgently needed.
To solve these research gaps, this paper explores the WEC nexus and establishes WEC coupling coordination model. We try to evaluates the water–energy–carbon coupling coordination level based on the 2004 to 2021 data from 30 Chinese provinces, analyzes its evolution trend and influential factors, and verifies these from a spatial perspective. The innovations of this paper are mainly reflected in the following three aspects. 1. A systematic sorting out of the complex relationship between water, energy, and carbon, and the use of the coupling and coordination model to describe the relationship between the three. 2. The construction of a comprehensive evaluation index system in the WEC, considering carbon emission and sequestration, which can better describe the balance of the carbon cycle system. 3. The testing of the applicability of the WEC coupling coordination model, taking China as an example to study its trends and possible influencing factors.
The content of this study is structured as follows: Section 2 presents the materials and methods. The research results can be found in Section 3. Section 4 presents the discussion, and the conclusion is provided in Section 5.

2. Materials and Methods

2.1. Index System Construction

The establishment of an index system is a prerequisite for the evaluation of water–energy–carbon coupling coordination. To comprehensively and effectively evaluate the coupling coordination level, it is necessary to select indexes from three perspectives: the water system, the energy system, and the carbon cycle system [36]. As shown in Table 1 below, this paper selects indicators based on existing studies from the perspectives of water resource utilization efficiency, resource endowment, energy consumption, and energy production [37]. From the perspective of the carbon system, since carbon emissions reduction [38] and carbon sinks [39] are two important methods of controlling the carbon balance, both are innovatively added to the WEC coupling coordination level index system.
These indicators are used to reflect the overall performance of water systems, energy systems, and carbon cycle systems. Next, by combining the weights determined using the entropy weight method, the comprehensive scores of the three systems can be obtained, which are then brought into the water–energy–carbon coupling coordination model to obtain its final coupling coordination level. This data information regarding water resource utilization and water resource endowment can all be obtained from the China Water Resources Bulletin and China Statistical Yearbook, while energy activities, including consumption and production, can be acquired from the China Energy Statistical Yearbook and the National Bureau of Statistics of China. Carbon emission and carbon sink data can be found in the CSMAR database and the research results of previous scholars regarding carbon sequestration [9,40,41].

2.2. Entropy Weight Method

As an important objective weight determination technique, the entropy weight method is widely used in the assessment of water resources [42], the environment [43], and the industrial economy [44,45]. It is often combined with an evaluation of the coupling coordination degree. The entropy weight method determines the weights of different indicators using the entropy information expressed by the indicators.
Standardized processing of raw data:
S i j = X i j M a x ( X i j )
where S i j represents the data after standardization, X i j represents the observed value of index j in subsystem i , and M a x ( X i j ) indicates the maximum observed value of the indicator.
Proportion transformation:
P i j = S i j i = 1 n S i j
where P i j represents the ratio of index j in subsystem i , and S i j represents the data after dimensionless processing, which can be found in Equation (1).
Entropy calculation:
P i j = S i j i = 1 n S i j
where e j represents the entropy of each index. ln P i j represents the natural logarithm of the index ratio; k = 1 / ln ( n ) > 0 , 0 e j 1 .
Difference coefficient calculation:
d j = 1 e j
where d j represents the difference coefficient of indicator S i j (the larger the d j value, the greater the role of the indicator) and e j indicates each indicator’s entropy value, according to Equation (3).
Weight calculation:
w j = d j j = 1 m d j
where w j represents the weight of indicator S i j , and d j indicates the difference coefficient of indicator S i j .
Score calculation:
S c o r e = j = 1 m w j S i j
where the score represents the comprehensive order parameter of the WEC subsystems, w j represents the weight of each index, and S i j represents the data after dimensionless processing.

2.3. WEC Coupling Coordination Model

At present, the calculation method of the coupling coordination model is mostly based on the score of the subsystems, which is essentially the expression of the physics coupling relationship, which has been adopted by many scholars in multi-system evaluation [46]. The same method is used here to express the WEC coupling coordination model, and the specific formula is as follows:
C = 3 Z 1 × Z 2 × Z 3 Z 1 + Z 2 + Z 3
C represents the coupling degree value of water-energy-carbon, and the value of C ranges from 0 to 1. Z1 represents the comprehensive order parameter of the water resource subsystem. Z2 represents the comprehensive order parameter of the energy subsystem. Z3 represents the comprehensive order parameter of the carbon subsystem.
The coupling degree of the development of water resources, energy, and carbon subsystems holds great significance for the strong and weak interactions between the three subsystems, but the coupling degree model cannot assess the absolute levels of the two systems. Therefore, this paper continues to develop the coordination degree of water–energy–carbon interaction coupling, as shown in the following Equation (8):
D = C × H H = α Z 1 + β Z 2 + χ Z 3
D represents the coupling coordination degree which among 0 to 1. H denote the comprehensive evaluation index of WEC nexus; α , β and χ represent the weight of water resource, energy and carbon subsystem. These three subsystems are equally important to the evaluation of the degree of coordination between WEC, so we give the same weight, that is, α = β = χ = 1 / 3 .

2.4. Classification of the Coupling Coordination Evaluation Levels

After calculating the value of the WEC coupling coordination degree, it is necessary to classify the coupling coordination evaluation levels. The common coupling coordination degree model usually divides WEC coupling coordination degree into 5–10 levels and assesses the coupling coordination degree of the system [46]. This paper aims to use this classification method, as shown in Table 2. This method covers extreme incoordination, high incoordination, moderate incoordination, mild incoordination, basic coordination, low coordination, moderate coordination, favorable coordination, excellent coordination and high-quality coordination.

2.5. Multiple Linear Regression

Y = α + β 1 X 1 + β 2 X 2 + β 3 X 3 + β 4 X 4 + β 5 X 5 + μ
The method of multiple linear regression is used to verify the possible influential factors of the WEC coupling relationship, where Y represents the level of WEC coupling coordination, and X 1 5 represents different explanatory variables. α and β represent the regression coefficients, and μ denotes the perturbation error term.

2.6. Spatial Durbin Model

Spatial autocorrelation reflects the degree of correlation between a certain geographical phenomenon or a certain attribute value on a regional unit and the same phenomenon or attribute value on a neighboring regional unit. In this paper, Moran’s index is used to test spatial autocorrelation, and the formula for calculating Moran’s index is as follows:
I = i = 1 n j = 1 n w i j ( X i X ¯ ) ( X j X ¯ ) S 2 i = 1 n j = 1 n w i j
where I represents the Moran’s index of the study area, w i j represents the spatial weight between region i and region j , and n represents the number of areas in the study area. X i represents the observed values of region i ; X j represents the observed values of region j. S represents the data after dimensionless processing. X ¯ = 1 / n i = 1 n X i and S 2 = 1 / n i = 1 n ( X i X ¯ ) 2 . The range of Moran’s index is between −1 and 1. Moran’s index > 0 indicates the existence of a positive spatial correlation, Moran’s index < 0 indicates a negative correlation, and Moran’s index = 0 indicates an independent random distribution.

3. Results

According to the coupling coordination model and the WEC comprehensive evaluation index, the scores of the water system, energy system, and carbon system were assembled with weights calculated using the entropy weight method.

3.1. Temporal Variation in the WEC Coupling Coordination Level

As shown in Figure 3, this research studies the WEC coupling coordination of 30 provinces in China from 2004 to 2021. To show the change trend more clearly, we aim to analyze China’s provincial WEC coupling coordination level by dividing it into six regions, namely, northern, northeastern, northwestern, central, southeastern, and southwestern China. The figures show the WEC coupling coordination levels in the six regions of China. From the perspective of temporal variation, the WEC coupling coordination level of all 30 provinces and cities generally shows a trend of fluctuation and increase. The growth rate become higher since 2012.
Based on the level of coupling coordination, in 2004, most of the provinces were still in a state of mild incoordination, and moderate incoordination. Only a few provinces, such as Qinghai, were in a state of primary coordination. In particular, many regions, such as Ningxia and Shanxi, were on the edge of serious incoordination, and Beijing, Tianjin, Shanghai, and other cities were at the stage of moderate incoordination. The situation improved in 2012. The southwestern provinces of China, such as Sichuan and Yunnan, began to progress from the transformation stage to the primary coordination state. The number of seriously incoordinated and moderately incoordinated provinces began to decrease. By 2021, the WEC coupling coordination levels of most provinces had changed. Qinghai, Sichuan, and Yunnan had progressed from the initial primary coordination status to the moderate coupling coordination status. Jiangxi, Hunan, and Hubei had evolved from the low to moderate coordination level. However, there were still many provinces and cities showing states of incoordination, such as Chongqing, Shaanxi, and Gansu, expressing states of mild incoordination, and Henan, Beijing, Shanghai, Tianjin, Shanxi, and Shandong, exhibiting states of moderate incoordination. At the same time, Jiangsu, Zhejiang, Anhui, and other locations were experiencing a change from incoordination to basic coordination.

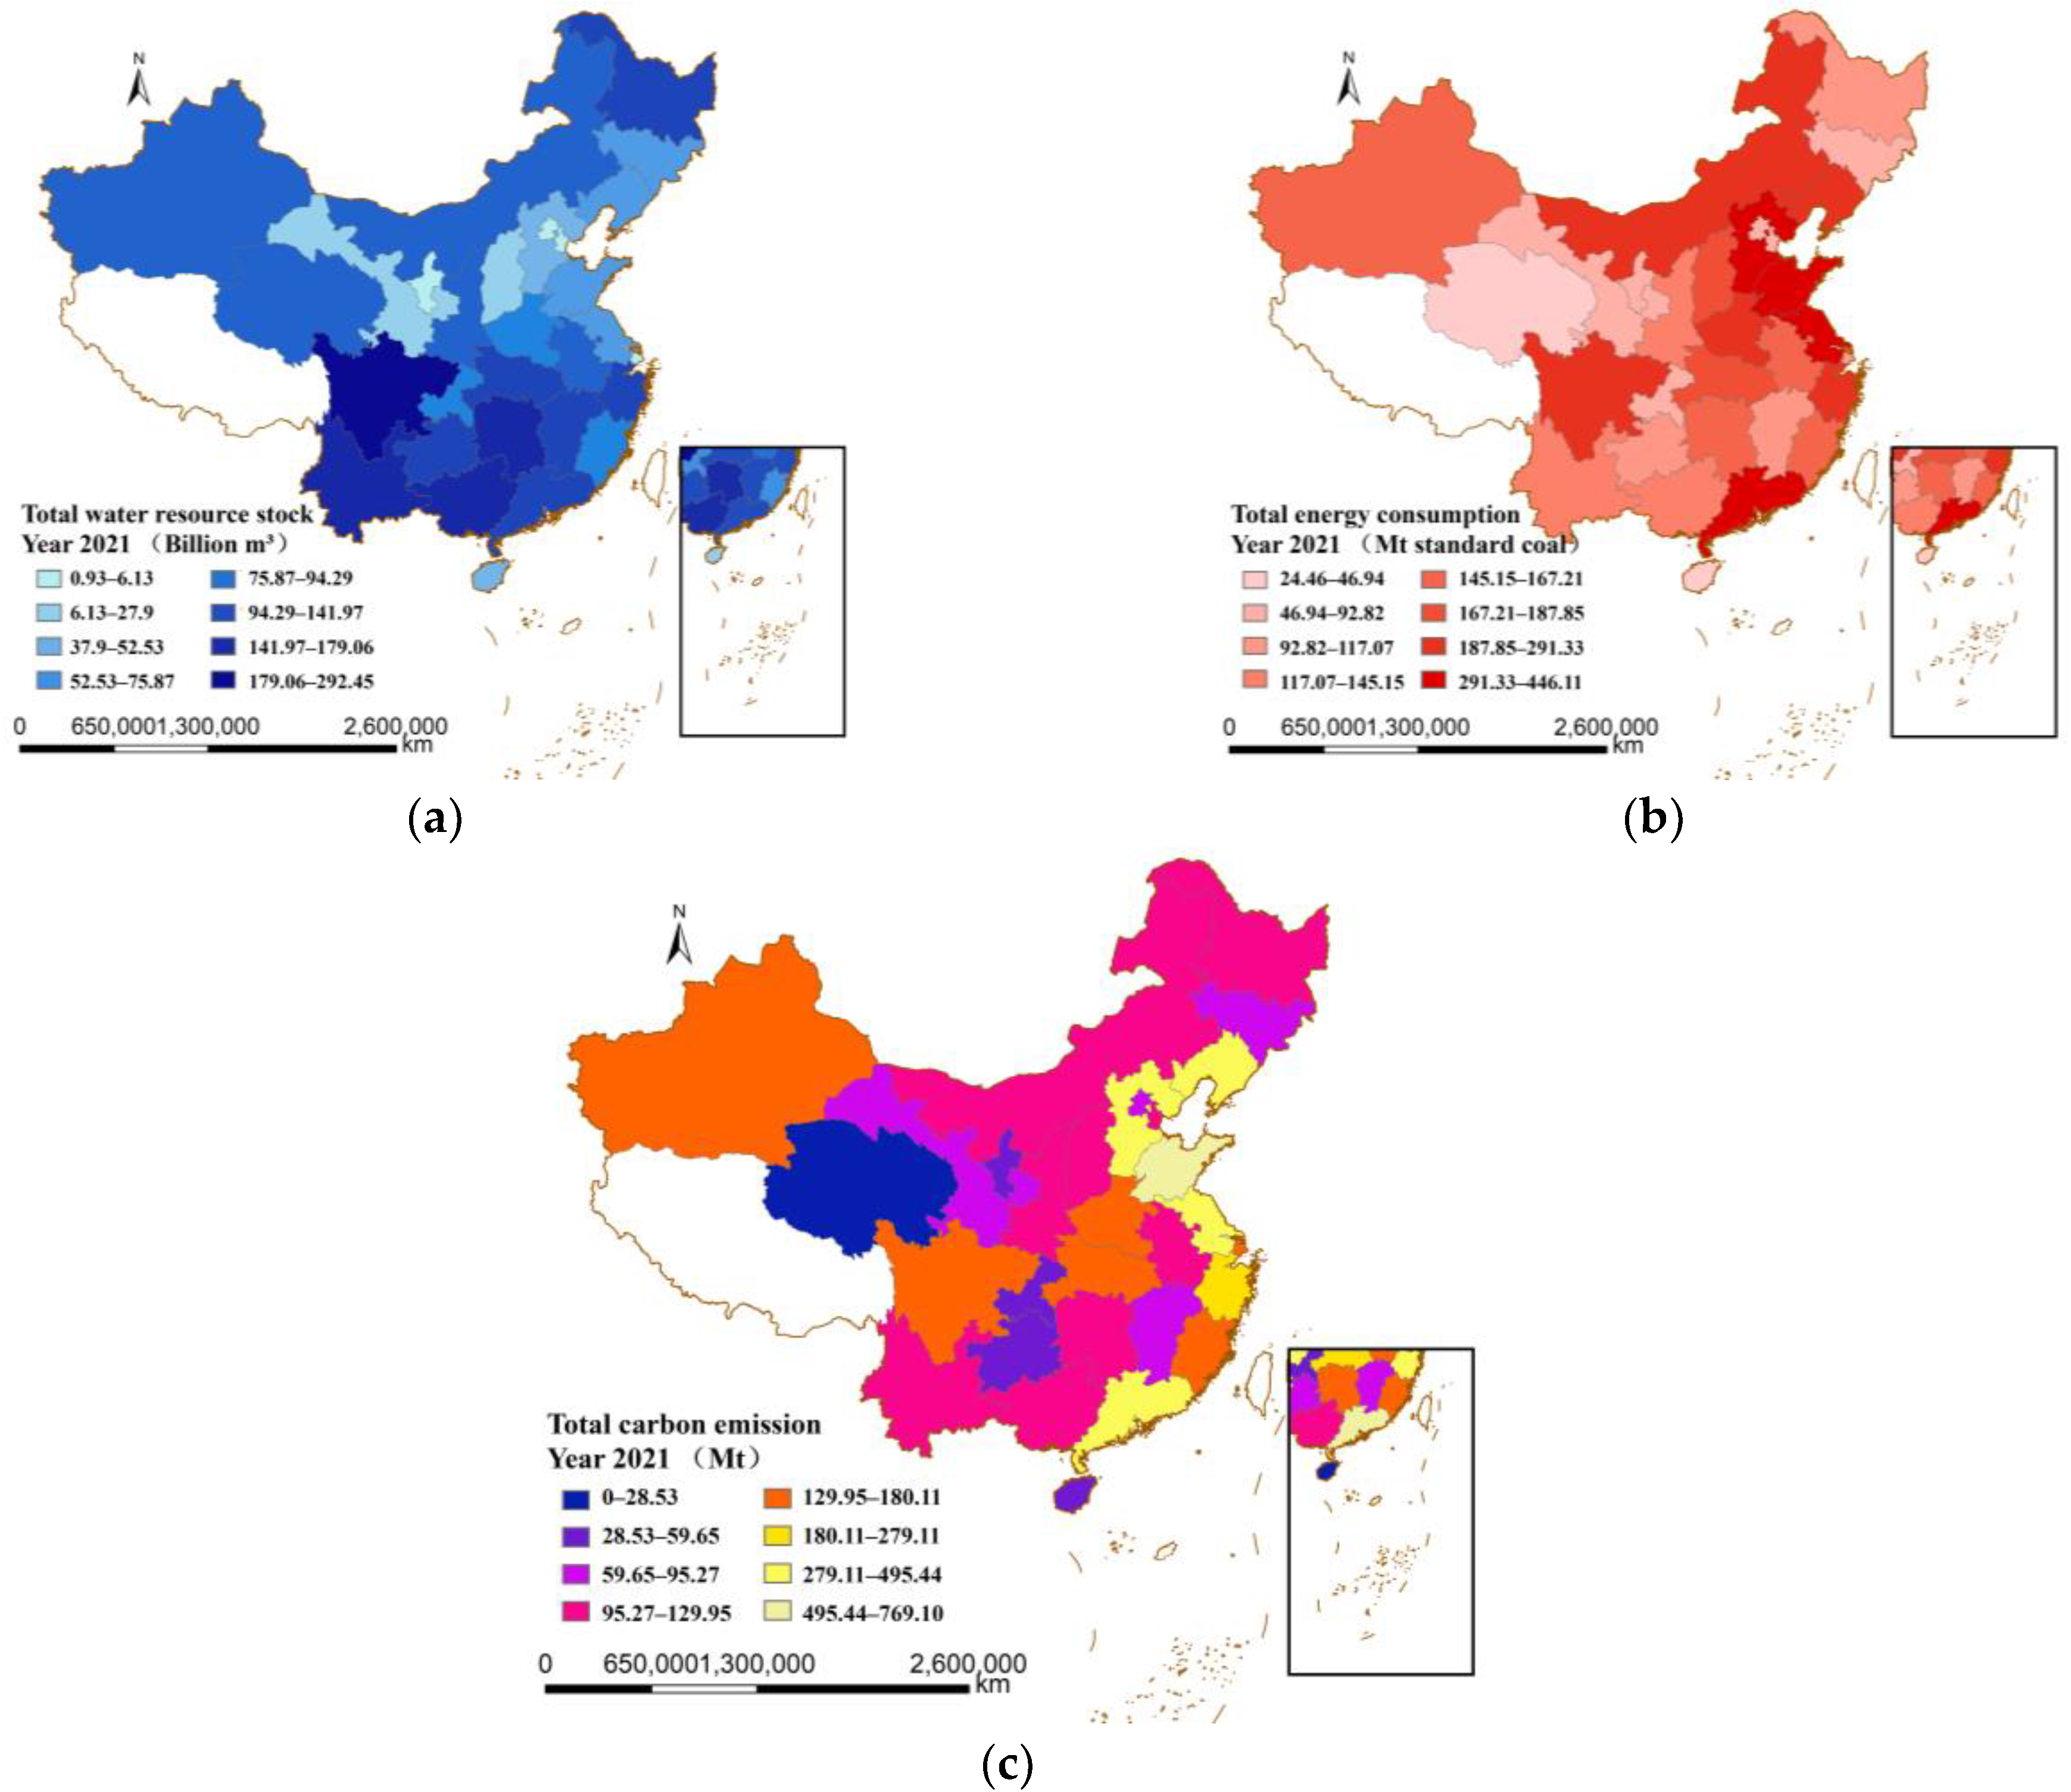
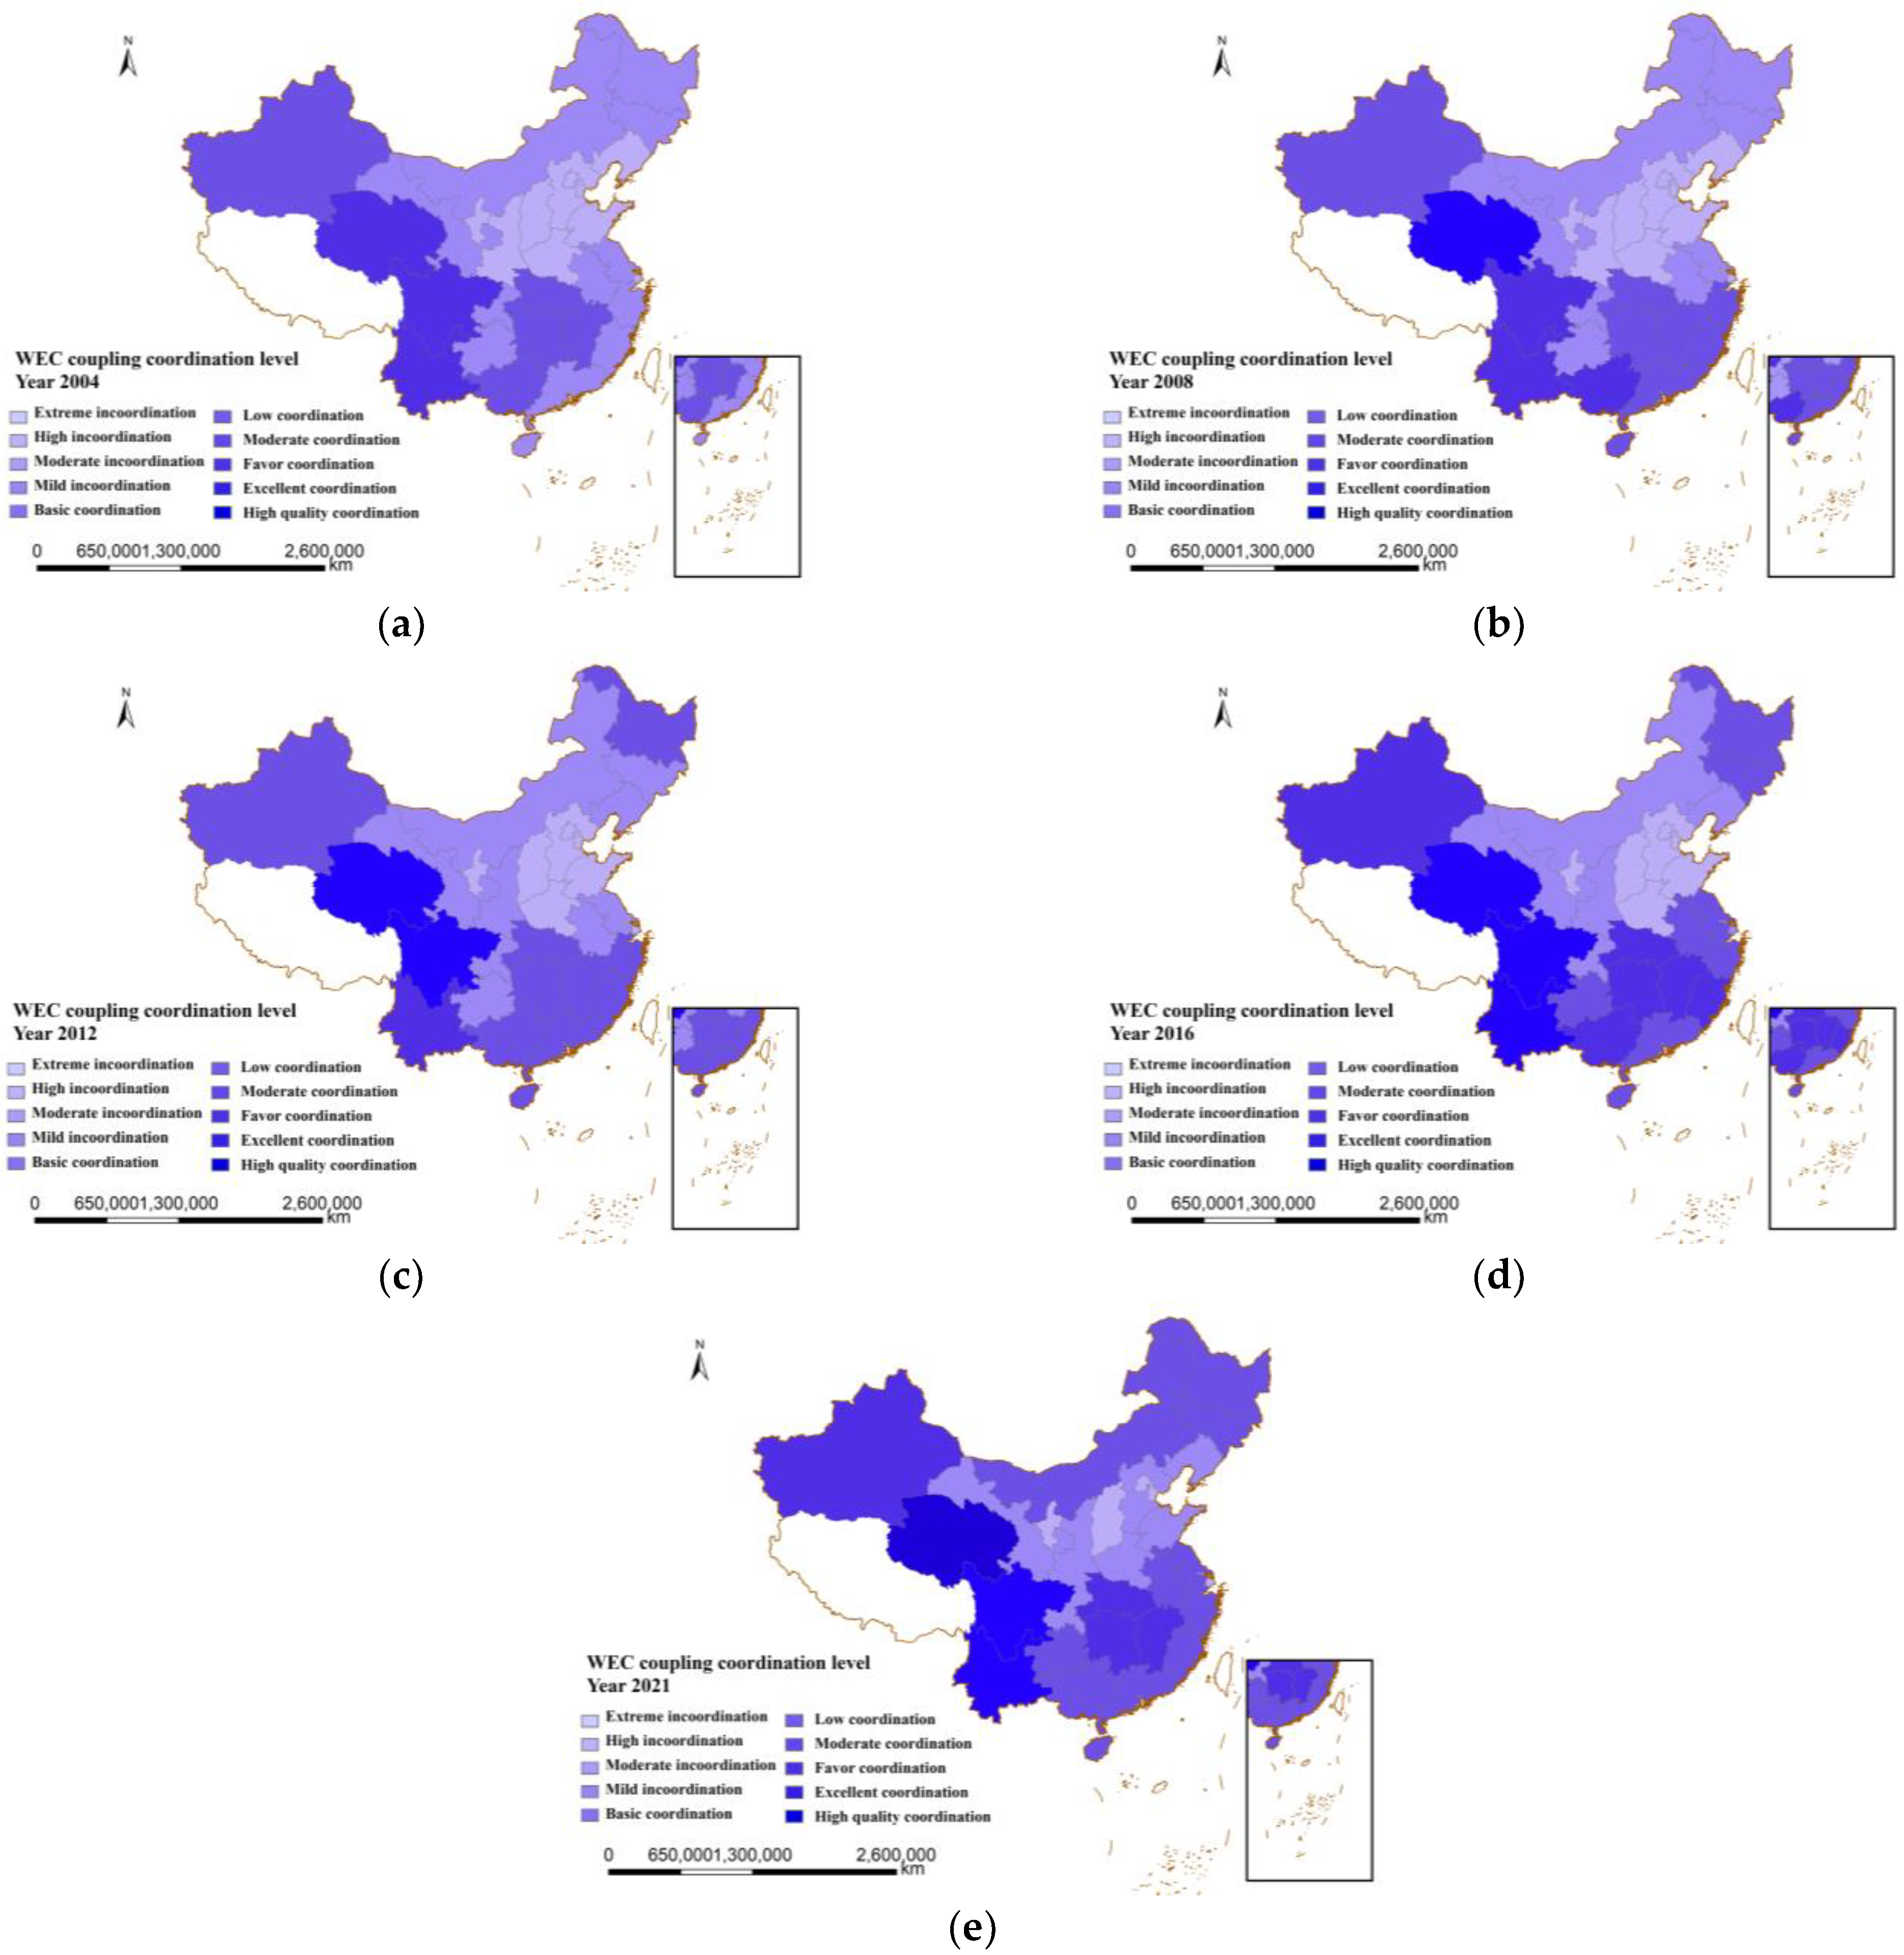
3.2. Spatial Distribution Characteristics of the WEC Coupling Coordination Level

The overall WEC coupling coordination level of the 30 provinces experienced a general increasing trend. As shown in Figure 4, the coupling level of most provinces was around 0.4 in 2021. At the same time, the coupling coordination levels of the eastern, central, and western regions were quite different. The level of coupling coordination was higher in the southern region than in the central region but lower than that in the southwestern provinces. From a spatial perspective, the central region, including Shanxi and Ningxia, exhibited the lowest water–energy–carbon coupling coordination level in China, while the southwestern region, including Qinghai, Yunnan, and Guangxi, showed the highest level.
During the 17 recent years of the survey, the 30 provinces and cities experienced constant transformation from incoordination to coordination. It was found that the number of provinces exhibiting coupling incoordination condition decreased, while the number of provinces showing the coupling coordination condition gradually increased. In the 5 selected years (2004, 2008, 2012, 2016, and 2021), there were many provinces that belonged to the moderate incoordination development category (10, 9, 8, 8, and 6, respectively). A few cities or provinces belonged to the mild incoordination category (10, 9, 8, 5, and 5). The number of provinces with these two levels of coordination experienced a downward trend. On the other hand, a number of provinces showed the basic coupling coordination (2, 2, 3, 6, and 4). Several provinces belonged to the moderate coupling coordination condition (1, 1, 2, 3, and 3). Most provinces were in the transformation phase, transitioning from the incoordination to the coordination condition. From 2004 to 2021, the number of provinces of basic coordination grew from four to seven.
From the perspective of river basins, the WEC coupling coordination level of Yangtze River Basin showed much higher than that of the Yellow River Basin. The provinces with coupling levels above the basic coordination level of the Yangtze River Basin included Qinghai, Sichuan, and Yunnan, all of which are in the upper reaches of the basin, and the coupling coordination degree of the downstream areas, such as Jiangsu, Shanghai, Zhejiang, and Anhui, as well as the middle reaches of Chongqing, Hunan, Hubei, Jiangxi, and Guizhou, was low. In contrast, the WEC in the upper reaches of the Yellow River Basin, such as Ningxia, Gansu, Shanxi, and Shaanxi, exhibited severe coupling incoordination. Compared with the upper reaches, the provinces at this stage were also in the middle and lower reaches, such as Henan, Hebei, Beijing, and Tianjin.
In short, the differences and variability are the important characteristics of the WEC coupling coordination levels in the 30 provinces in China. Most of China’s provinces exhibited a volatile upward trend. As of 2021, more than one-third of the provinces were in the basic coordination phase. At the same time, there were significant differences in the water–energy–carbon coupling coordination levels between the east and west and between the north and south. The central region showed the lowest coupling coordination level, and the change rate was low, while the southwestern region exhibited the highest coupling coordination level, and the growth rate was high.

3.3. Spatial Correlation Analysis

In this section, we aim to analyze the spatial correlation of the WEC coupling coordination level using Moran’s I, which can be divided into global Moran’s I and local Moran’s I. Global Moran’s I can be considered a comprehensive method to test the spatial autocorrelation level from a multi-dimensional perspective. According to the panel data of the 30 provinces in China, the global Moran’s I index of WEC coupling coordination (Y) was calculated using Equation (9). A proximity matrix, a geographic distance matrix, and an economic distance matrix were selected to calculate Moran’s I. The results show that the Moran’s I of the WEC coupling coordination level with the proximity matrix was significant at the 1% level from 2004 to 2021, and its values were between 0.39 and 0.50. This can be explained by the fact that the WEC coupling coordination level can have a nonrandom positive relationship. The results obtained using the geographic distance matrix and the economic distance matrix confirmed this conclusion.
In addition to calculating the global Moran’s I, we further analyzed the relationship of the local Moran’s I, which divides the results into four quadrants. As shown in Figure 5, most provinces and cities were concentrated in region H–H (quadrant 1) and region L–L (quadrant 3), rather than in region H–L (quadrant 2) or region L–L (quadrant 4). This shows that clustering can occur in regions H–H and L–L regarding the provincial coupling coordination level. Many provinces in southeast China, like Qinghai, Sichuan, and Yunnan, consistently maintained the top level of WEC coupling coordination, which was found in region H–H. From 2004 to 2021, the number of provinces in the L–L region gradually declined, while the number in the H–L region increased. Jiangsu and Jilin transferred from the L–L region to the H–L region. Heilongjiang and Zhejiang transferred from the H–H region to the H–L region. However, some provinces, such as Chongqing and Gansu, remained in their regions.

3.4. Analysis of Influential Factors

In this section, we verify the influence of possible factors on the WEC nexus coupling coordination level. There are many factors affecting the water–energy–carbon nexus [47,48]. Zhao suggested that water and energy systems can be important components of natural–social systems, which are driven by economic development, resource endowment, and the energy structure [49]. Jiang conducted a kernel density estimation to test the effects of an industrial matching index of water and land resources on the water–carbon relationship [50]. This research also confirmed that the economic output of water resources is the main contribution to land carbon emissions. These findings show that taking water resources into account as influential factors is an important research direction.
Water resources show a significant uneven spatial distribution and seasonal differences, which have become limitations for regional coordination development, such as in agriculture and industry. As shown in Table 3, we selected some possible influence factors on water energy carbon and verified by multiple linear regression. As the magnitude of the data was considerable, the logarithmic method commonly used in econometrics was employed here. The regression results are as follows: the p-values of water production investment and hydraulic engineering investment were both less than or equal to 0.001 among these indicators. It indicates that they exerted significant impacts on the water–energy–carbon coupling coordination level, and water production investment had a negative impact.

4. Discussion

This paper explored and constructed WEC coupling coordination model. A comprehensive WEC evaluation index system has been made to study the coupling coordination level, influential factors and the spatial and temporal evolutionary trend. From the perspective of temporal variation, the WEC coupling coordination level of 30 provinces in China was generally good, showing an upward trend, which is similar to the findings in another study [3]. The spatial differences between east and west and between north and south were large. In addition, carbon emissions and carbon sinks were considered in this paper; therefore, the assessment of the carbon balance state was more in line with reality. The results show that the water–energy–carbon coordination level in southwestern China is very high, which is related to the high levels of local water carbon sinks and forest carbon sinks. Northern China, which also has a strong forest carbon sequestration capacity, possesses extensive Three-North shelterbelts and is an important carbon sequestration site. The direct coordination degree of the water–energy–carbon system in provinces including Inner Mongolia is also high. However, due to the perennial shortage of water resources in northern China, the coupling coordination level is generally lower than that in southwestern China.
In terms of influential factors, this paper discusses the influence of factors such as water production investment, hydraulic engineering investment, water consumption per capita, urbanization level and industrial structure. It was found that hydraulic engineering and water production have significant impacts on WEC, where hydraulic engineering investment has a significant positive relationship, while the latter has a significant negative relationship. This may be because hydraulic engineering generation is a clean energy that promotes the water–energy coupling coordination level. However, a large amount of energy is still consumed in the water production process, so it is not conducive to the improvement of the coupling coordination degree.
In the last part of the study, Spatial Durbin Model has been used to testify water energy carbon nexus and find they have significant spatial autocorrelation. It can be seen from the local Moran’s index of the water–energy–carbon coupling coordination level, p-values less than 0.01, that means there is a significant spatial correlation, which is consistent with Liu’s research conclusion [51]. As early as 2004, 11 provinces, including Qinghai Province, Yunnan Province, and Sichuan Province, were at the HH level; Zhejiang Province and Jiangsu Province were at the HL level; and a large number of central provinces, such as Beijing, Tianjin, and Shaanxi Province, were at the LL level. It shows that the WEC coupling coordination level in the central region is lower than other places and they had impacts on each other negatively while in the southwest region is higher and has positive influence on surrounding provinces. Until 2021, the LL level of the provinces decreased from 13 to 10, and the HL level of the provinces increased by 3, showing that the water–energy–carbon coupling coordination levels in various regions gradually increased.

5. Conclusions

There is a complex interrelationship between water, energy, and carbon. To conduct effective and comprehensive sorting, we constructed a systematic analysis framework around the WEC nexus and calculated the coupling coordination levels of 30 provinces in China from 2004 to 2021. The results show that (1) in general, China’s overall provincial WEC coupling coordination level showed a fluctuating upward trend, and differences could be seen in different regions. (2) The spatial correlation of the WEC coupling coordination was significant. Southwestern provinces, including Yunnan, Sichuan, and Qinghai, have reached a good level of coupling coordination and have positive influence on surrounding provinces. Provinces in central region like Beijing, Tianjin, and shaanxi shows negative impact on adjacent provinces. (3) Hydraulic engineering and water production investments are critical influential factors in the WEC nexus.
Some policy recommendations are provided to guide the development of WEC coordination: (1) The proportion of new energy sources should be increased for total energy consumption, to promote the improvement of energy and water resource utilization efficiency. Adopt a variety of new energy sources, such as hydropower, photovoltaic and nuclear power generation, to reduce the level of carbon emissions generated by traditional fossil energy consumption. (2) Industrial spatial transfer should be carried out to solve the problems related to carbon emissions. In addition to this, the urban layout should also be reasonably projected to improve the carbon sequestration capacity. The carbon emission level in the eastern coastal areas is generally high, and high-pollution and -emission industries should be transferred from the eastern region to the western region to reduce the regional carbon sink pressure and environmental pollution problems. (3) An effective regional distribution and transfer of energy resources and water resources should be actively carried out. Engineering measures, including China's west-to-east power transmission program, west-to-east gas transmission project, and south-to–north water diversion project, should be promoted to reduce the resource mismatch caused by spatial differences.
The WEC coupling coordination model is mature and applicable to different areas. Although different regions can exhibit various characteristics, the interactive relationship between water, energy, and carbon is clear, and the data source of WEC coupling coordination is easily accessible from the regional statistic database. Thus, the WEC coupling coordination model can be well replicable. Apart from this, a reasonable measurement of water–energy carbon levels and an effective assessment of their coupling and coordination levels are the basis of many studies, providing theoretical and realistic reference values for urban development and planning. In the future, using machine learning and other methods to make effective predictions, along with scenario analyses based on comprehensive evaluation results of water energy carbon coupling coordination levels, should be important research directions.

Funding

This research received no external funding.

Institutional Review Board Statement

Not applicable.

Informed Consent Statement

Not applicable.

Data Availability Statement

Data are contained within the article.

Conflicts of Interest

The author declares no conflict of interest.

References

  1. Duan, C.C.; Chen, B. Energy-water nexus of international energy trade of China. Appl. Energy 2017, 194, 725–734. [Google Scholar] [CrossRef]
  2. Meng, F.X.; Liu, G.Y.; Liang, S.; Su, M.R.; Yang, Z.F. Critical review of the energy-water-carbon nexus in cities. Energy 2019, 171, 1017–1032. [Google Scholar] [CrossRef]
  3. Cao, Y.Q.; Li, J.; Xie, L.F.; Yao, J.Q.; Li, K.X.; Zhang, N.Y.; Ji, X.H.; Wang, M.R.; Mo, F.; Zhai, H.R. Coupling coordination of the water-energy-carbon system in three provinces of Northeastern China. Front. Environ. Sci. 2023, 11, 1261339. [Google Scholar] [CrossRef]
  4. Ding, X.; Wang, S.G.; Chen, B. Impacts of different low-carbon development pathways on water consumption in China based on input-output analysis. In Proceedings of the 9th International Conference on Applied Energy (ICAE), Cardiff, UK, 21–24 August 2017; pp. 3122–3128. [Google Scholar]
  5. Zheng, H.R.; Zhang, Z.Y.; Zhang, Z.K.; Li, X.; Shan, Y.L.; Song, M.L.; Mi, Z.F.; Meng, J.; Ou, J.M.; Guan, D.B. Mapping Carbon and Water Networks in the North China Urban Agglomeration. One Earth 2019, 1, 126–137. [Google Scholar] [CrossRef]
  6. Zhou, Y.; Zou, S.; Duan, W.; Chen, Y.; Takara, K.; Di, Y. Analysis of energy carbon emissions from agroecosystems in Tarim River Basin, China: A pathway to achieve carbon neutrality. Appl. Energy 2022, 325, 119842. [Google Scholar] [CrossRef]
  7. Chhipi-Shrestha, G.; Hewage, K.; Sadiq, R. Water-Energy-Carbon Nexus Modeling for Urban Water Systems: System Dynamics Approach. J. Water Resour. Plan. Manag. 2017, 143, 04017016. [Google Scholar] [CrossRef]
  8. Wang, X.C.; Jiang, P.; Yang, L.; Fan, Y.V.; Klemes, J.J.; Wang, Y.T. Extended water-energy nexus contribution to environmentally-related sustainable development goals. Renew. Sustain. Energy Rev. 2021, 150, 111485. [Google Scholar] [CrossRef]
  9. Du, Z.; Su, T.; Ge, J.; Wang, X. Towards the carbon neutrality: The role of carbon sink and its spatial spillover effects. Econ. Res. J. 2021, 56, 187–202. [Google Scholar]
  10. Gao, J.J.; Li, C.L.; Zhao, P.; Zhang, H.W.; Mao, G.Z.; Wang, Y. Insights into water-energy cobenefits and trade-offs in water resource management. J. Clean. Prod. 2019, 213, 1188–1203. [Google Scholar] [CrossRef]
  11. Rothausen, S.G.S.A.; Conway, D. Greenhouse-gas emissions from energy use in the water sector. Nat. Clim. Change 2011, 1, 210–219. [Google Scholar] [CrossRef]
  12. Alresheedi, M.T.; Haider, H.; Shafiquzzaman, M.; AlSaleem, S.S.; Alinizzi, M. Water-Energy-Carbon Nexus Analysis for Water Supply Systems with Brackish Groundwater Sources in Arid Regions. Sustainability 2022, 14, 5106. [Google Scholar] [CrossRef]
  13. Stokes, J.R.; Horvath, A. Energy and Air Emission Effects of Water Supply. Environ. Sci. Technol. 2009, 43, 2680–2687. [Google Scholar] [CrossRef]
  14. Griffiths-Sattenspiel, B.; Wilson, W. The Carbon Footprint of Water; River Network: Portland, OR, USA, 2009. [Google Scholar]
  15. Shrestha, S.; Parajuli, K.; Babel, M.S.; Dhakal, S.; Shinde, V. Water-energy-carbon nexus: A case study of Bangkok. Water Sci. Technol. Water Supply 2015, 15, 889–897. [Google Scholar] [CrossRef]
  16. Sowby, R.B.; Capener, A. Reducing carbon emissions through water conservation: An analysis of 10 major U.S. cities. Energy Nexus 2022, 7, 100094. [Google Scholar] [CrossRef]
  17. Achakulwisut, P.; Erickson, P.; Guivarch, C.; Schaeffer, R.; Brutschin, E.; Pye, S. Global fossil fuel reduction pathways under different climate mitigation strategies and ambitions. Nat. Commun. 2023, 14, 5425. [Google Scholar] [CrossRef]
  18. Liu, Z.; He, X. Balancing-oriented hydropower operation makes the clean energy transition more affordable and simultaneously boosts water security. Nat. Water 2023, 1, 778–789. [Google Scholar] [CrossRef]
  19. Naveed, U.; Rozali NE, M.; Mahadzir, S. Energy-Water-Carbon Nexus Study for the Optimal Design of Integrated Energy-Water Systems Considering Process Losses. Energies 2022, 15, 8605. [Google Scholar] [CrossRef]
  20. Ma, J.; Yin, Z.; Cai, J. Efficiency of urban water supply under carbon emission constraints in China. Sustain. Cities Soc. 2022, 85, 104040. [Google Scholar] [CrossRef]
  21. Regnier, P.; Resplandy, L.; Najjar, R.G.; Ciais, P. The land-to-ocean loops of the global carbon cycle. Nature 2022, 603, 401–410. [Google Scholar] [CrossRef]
  22. Lin, B.; Ge, J. Valued forest carbon sinks: How much emissions abatement costs could be reduced in China. J. Clean. Prod. 2019, 224, 455–464. [Google Scholar] [CrossRef]
  23. Sun, Y.; Zhi, Y.; Zhao, Y. Indirect effects of carbon taxes on water conservation: A water footprint analysis for China. J. Environ. Manag. 2021, 279, 111747. [Google Scholar] [CrossRef] [PubMed]
  24. Zhang, Y.; Wang, J.; Zhang, L.; Liu, J.; Zheng, H.; Fang, J.; Hou, S.; Chen, S. Optimization of China’s electric power sector targeting water stress and carbon emissions. Appl. Energy 2020, 271, 115221. [Google Scholar] [CrossRef]
  25. Miller, L.; Carriveau, R. Balancing the carbon and water footprints of the Ontario energy mix. Energy 2017, 125, 562–568. [Google Scholar] [CrossRef]
  26. Karimov, A.K.; Amirova, I.; Karimov, A.A.; Tohirov, A.; Abdurakhmanov, B. Water, Energy and Carbon Tradeoffs of Groundwater Irrigation-Based Food Production: Case Studies from Fergana Valley, Central Asia. Sustainability 2022, 14, 1451. [Google Scholar] [CrossRef]
  27. Wang, X.; Zhang, Q.; Xu, L.; Tong, Y.; Jia, X.; Tian, H. Water-energy-carbon nexus assessment of China’s iron and steel industry: Case study from plant level. J. Clean. Prod. 2020, 253, 119910. [Google Scholar] [CrossRef]
  28. Hou, J.J.; Wang, Z.; Zhang, J.T.; Yu, S.W.; Liu, L.C. Revealing energy and water hidden in Chinese regional critical carbon supply chains. Energy Policy 2022, 165, 112979. [Google Scholar] [CrossRef]
  29. Yu, L.; Liu, S.L.; Wang, F.F.; Liu, Y.X.; Liu, H.; Wang, Q.B.; Tran, L.S.P.; Dong, Y.H.; Li, W.Q. Strategies for agricultural production management based on land, water and carbon footprints on the Qinghai-Tibet Plateau. J. Clean. Prod. 2022, 362, 132563. [Google Scholar] [CrossRef]
  30. McCarthy, B.; Anex, R.; Wang, Y.; Kendall, A.D.; Anctil, A.; Haacker EM, K.; Hyndman, D.W. Trends in Water Use, Energy Consumption, and Carbon Emissions from Irrigation: Role of Shifting Technologies and Energy Sources. Environ. Sci. Technol. 2020, 54, 15329–15337. [Google Scholar] [CrossRef]
  31. Xu, Z.; Chen, X.; Liu, J.; Zhang, Y.; Chau, S.; Bhattarai, N.; Wang, Y.; Li, Y.; Connor, T.; Li, Y. Impacts of irrigated agriculture on food–energy–water–CO2 nexus across metacoupled systems. Nat. Commun. 2020, 11, 5837. [Google Scholar] [CrossRef]
  32. Chen, S.Q.; Tan, Y.Q.; Liu, Z. Direct and embodied energy-water-carbon nexus at an inter-regional scale. Appl. Energy 2019, 251, 113401. [Google Scholar] [CrossRef]
  33. Shaikh, M.A.; Kucukvar, M.; Onat, N.C.; Kirkil, G. A framework for water and carbon footprint analysis of national electricity production scenarios. Energy 2017, 139, 406–421. [Google Scholar] [CrossRef]
  34. Liang, M.; Huang, G.; Chen, J.; Li, Y. Energy-water-carbon nexus system planning: A case study of Yangtze River Delta urban agglomeration, China. Appl. Energy 2022, 308, 118144. [Google Scholar] [CrossRef]
  35. Tian, P.P.; Lu, H.W.; Reinout, H.; Li, D.; Zhang, K.L.; Yang, Y.Y. Water-energy-carbon nexus in China’s intra and inter-regional trade. Sci. Total Environ. 2022, 806, 150666. [Google Scholar] [CrossRef] [PubMed]
  36. Zhao, R.; Li, Z.; Han, Y.; Milind, K.; Zhang, Z.; Ding, M. The coupling interaction mechanism of regional water-land-energy-carbon system. Acta Geogr. Sin. 2016, 71, 1613–1628. [Google Scholar]
  37. Xiang, W.Q.; Yang, X.H.; Bian, D.H.; Pan, Z.S.; Chen, H.; Chen, Y.J.; Li, M.S. Evaluation and prediction of water-energy-carbon nexus efficiency in China based on a new multiregional input-output perspective. J. Environ. Manag. 2023, 339. [Google Scholar] [CrossRef]
  38. Dong, F.; Li, X.H.; Long, R.Y.; Liu, X.Y. Regional carbon emission performance in China according to a stochastic frontier model. Renew. Sustain. Energy Rev. 2013, 28, 525–530. [Google Scholar] [CrossRef]
  39. Van der Heijden, G.M.; Schnitzer, S.A.; Powers, J.S.; Phillips, O.L. Liana Impacts on Carbon Cycling, Storage and Sequestration in Tropical Forests. Biotropica 2013, 45, 682–692. [Google Scholar] [CrossRef]
  40. Xue, L.; Luo, X.; Li, Z.; Wu, X. Spatial spillover effects and influencing factors of forest carbon sink in China—Spatial econometric analysis based on forest resources inventory in 31 provinces of the mainland of China. J. Nat. Resour. 2017, 32, 1744–1754. [Google Scholar]
  41. Xue, L.; Luo, X.; Wu, X. Carbon sequestration efficiency of four forest regions in China: Measurement, driving factors and convergence. J. Nat. Resour. 2016, 31, 1351–1363. [Google Scholar]
  42. Zhang, K.; Shen, J. Optimal allocation of water resources based on firefly algorithm and entropy method. Water Resour. Prot. 2016, 32, 50. [Google Scholar]
  43. Geng, Y.Q.; Wei, Z.J.; Zhang, H.; Maimaituerxun, M. Analysis and Prediction of the Coupling Coordination Relationship between Tourism and Air Environment: Yangtze River Economic Zone in China as Example. Discret. Dyn. Nat. Soc. 2020, 2020, 1406978. [Google Scholar] [CrossRef]
  44. Li, W.W.; Yi, P.T. Assessment of city sustainability-Coupling coordinated development among economy, society and environment. J. Clean. Prod. 2020, 256, 120453. [Google Scholar] [CrossRef]
  45. Yang, C.; Zeng, W.; Yang, X. Coupling coordination evaluation and sustainable development pattern of geo-ecological environment and urbanization in Chongqing municipality, China. Sustain. Cities Soc. 2020, 61, 102271. [Google Scholar] [CrossRef]
  46. Li, W.; Wang, Y.; Xie, S.; Cheng, X. Coupling coordination analysis and spatiotemporal heterogeneity between urbanization and ecosystem health in Chongqing municipality, China. Sci. Total Environ. 2021, 791, 148311. [Google Scholar] [CrossRef]
  47. Yuan, T.; Lu, P.; Liu, Y.J.; Ren, F.; Zhang, H.R. Distribution Characteristics and Influence Factors of Carbon in Coal Mining Subsidence Wetland. Sustainability 2023, 15, 7042. [Google Scholar] [CrossRef]
  48. Zhu, Y.; Tian, Z.; Wang, L.; Ji, D.; Yang, Z.; Meng, J.; Tian, P.; Liu, J. Characteristics and influencing factors of the rising period of carbon sink flux in East Dongting Lake waters. China Environ. Sci. 2023, 43, 843–853. [Google Scholar]
  49. Zhao, R.; Liu, Y.; Tian, M.; Ding, M.; Cao, L.; Zhang, Z.; Chuai, X.; Xiao, L.; Yao, L. Impacts of water and land resources exploitation on agricultural carbon emissions: The water-land-energy-carbon nexus. Land Use Policy 2018, 72, 480–492. [Google Scholar] [CrossRef]
  50. Jiang, W.; Zhang, Z.; Wen, J.; Yin, L.; Song, B. Spatio-temporal variation and influencing factors of industrial carbon emission effect in China based on water-land-energy-carbon nexus. Ecol. Indic. 2023, 152, 110307. [Google Scholar] [CrossRef]
  51. Liu, J.H.; Pu, L.Y.; Huang, L.C.; Shi, T.L. Research on the Coupling Evaluation and Driving Factors of Water-Energy-Carbon in the Yellow River Basin. Water 2023, 15, 2377. [Google Scholar] [CrossRef]
Figure 1. China’s basic water–energy–carbon condition: (a) total volume of water resources in 2021; (b) total energy consumption in 2021; (c) total carbon emissions in 2021.
Sustainability 16 00383 g001
Figure 2. WEC nexus diagram.
Sustainability 16 00383 g002
Figure 3. China’s provincial WEC coupling coordination levels from 2004 to 2021: (a) northern region of China; (b) northeastern region of China; (c) eastern region of China; (d) central region of China; (e) southwestern region of China; (f) northwestern region of China.
Sustainability 16 00383 g003
Figure 4. Spatial distribution characteristics of China’s WEC coupling coordination level: (a) 2004; (b) 2008; (c) 2012; (d) 2016; (e) 2021.
Sustainability 16 00383 g004
Figure 5. Local Moran scatter plots of the WEC coupling coordination levels in China from 2004 to 2021: (a) 2004; (b) 2008; (c) 2016; (d) 2021.
Sustainability 16 00383 g005
Table 1. WEC coupling coordination level index system.
SubsystemCategoryEvaluation IndexProperty
Water
resources
Water
resource
utilization
Water consumption per GDP (CNY 10,000) Negative
Total wastewater dischargeNegative
Total water consumption in each regionNegative
Water resource endowmentWater production modulusPositive
Total water resourcesPositive
Water resources per capitaPositive
Energy
system
Energy
consumption
Energy consumption per GDP (CNY 10,000) Negative
Energy consumption structure Negative
Total energy consumptionNegative
Energy
production
Total coal and crude oil productionNegative
Hydropower generationPositive
The share of non-fossil fuels in energy productionPositive
Carbon
cycle
system
Carbon
emissions
Total carbon emissions Negative
CO2 emissions per capitaNegative
CO2 emission intensityNegative
Carbon sinks Carbon sequestration by vegetationPositive
Carbon sequestration by water bodiesPositive
Table 2. Classification of the WEC coupling coordination level.
LevelDegree
0–0.1Extreme incoordination
0.1–0.2High incoordination
0.2–0.3Moderate incoordination
0.3–0.4Mild incoordination
0.4–0.5Basic coordination
0.5–0.6Low coordination
0.6–0.7Moderate coordination
0.7–0.8Favorable coordination
0.8–0.9Excellent coordination
0.9–1High-quality coordination
Table 3. Influential factors of WEC coupling coordination.
Explained VariableExplanatory VariableCoefficientp
WEC coupling
coordination level
Water production investment −0.01050.000
Hydraulic engineering investment0.00790.001
Water consumption per capita0.01260.178
Urbanization level0.03600.169
Industrial structure−0.01130.017
Disclaimer/Publisher’s Note: The statements, opinions and data contained in all publications are solely those of the individual author(s) and contributor(s) and not of MDPI and/or the editor(s). MDPI and/or the editor(s) disclaim responsibility for any injury to people or property resulting from any ideas, methods, instructions or products referred to in the content.

