
Changing Urban Temperature and Rainfall Patterns in Jakarta: A Comprehensive Historical Analysis


Abstract
:1. Introduction
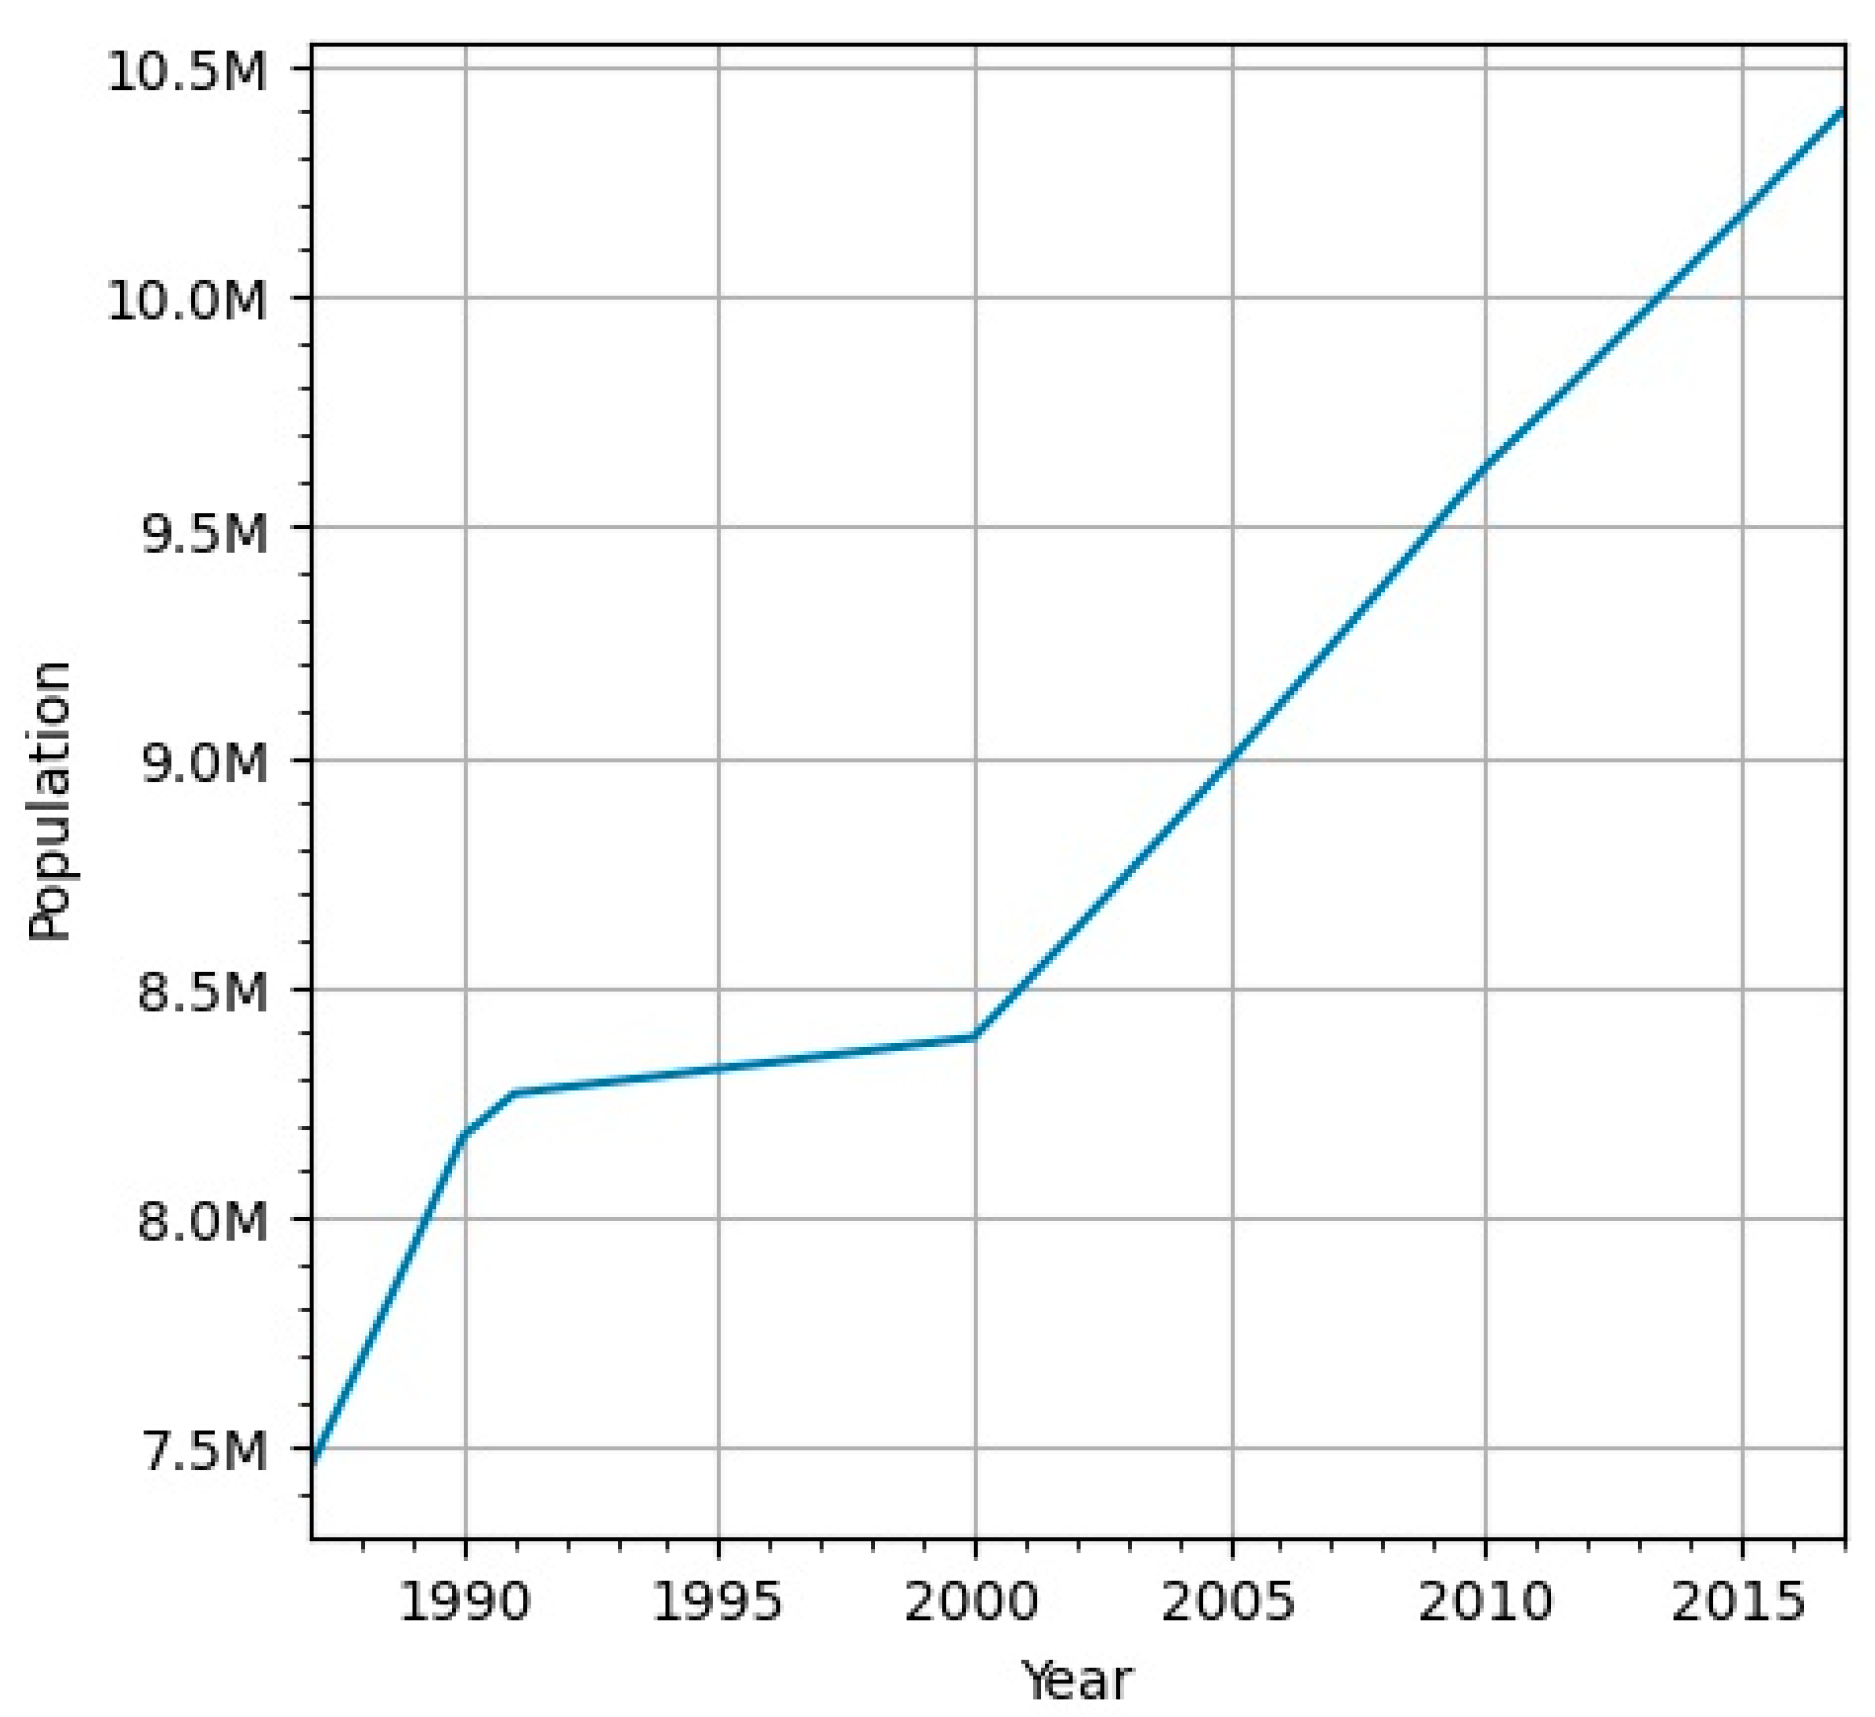
2. Study Area
Data Source
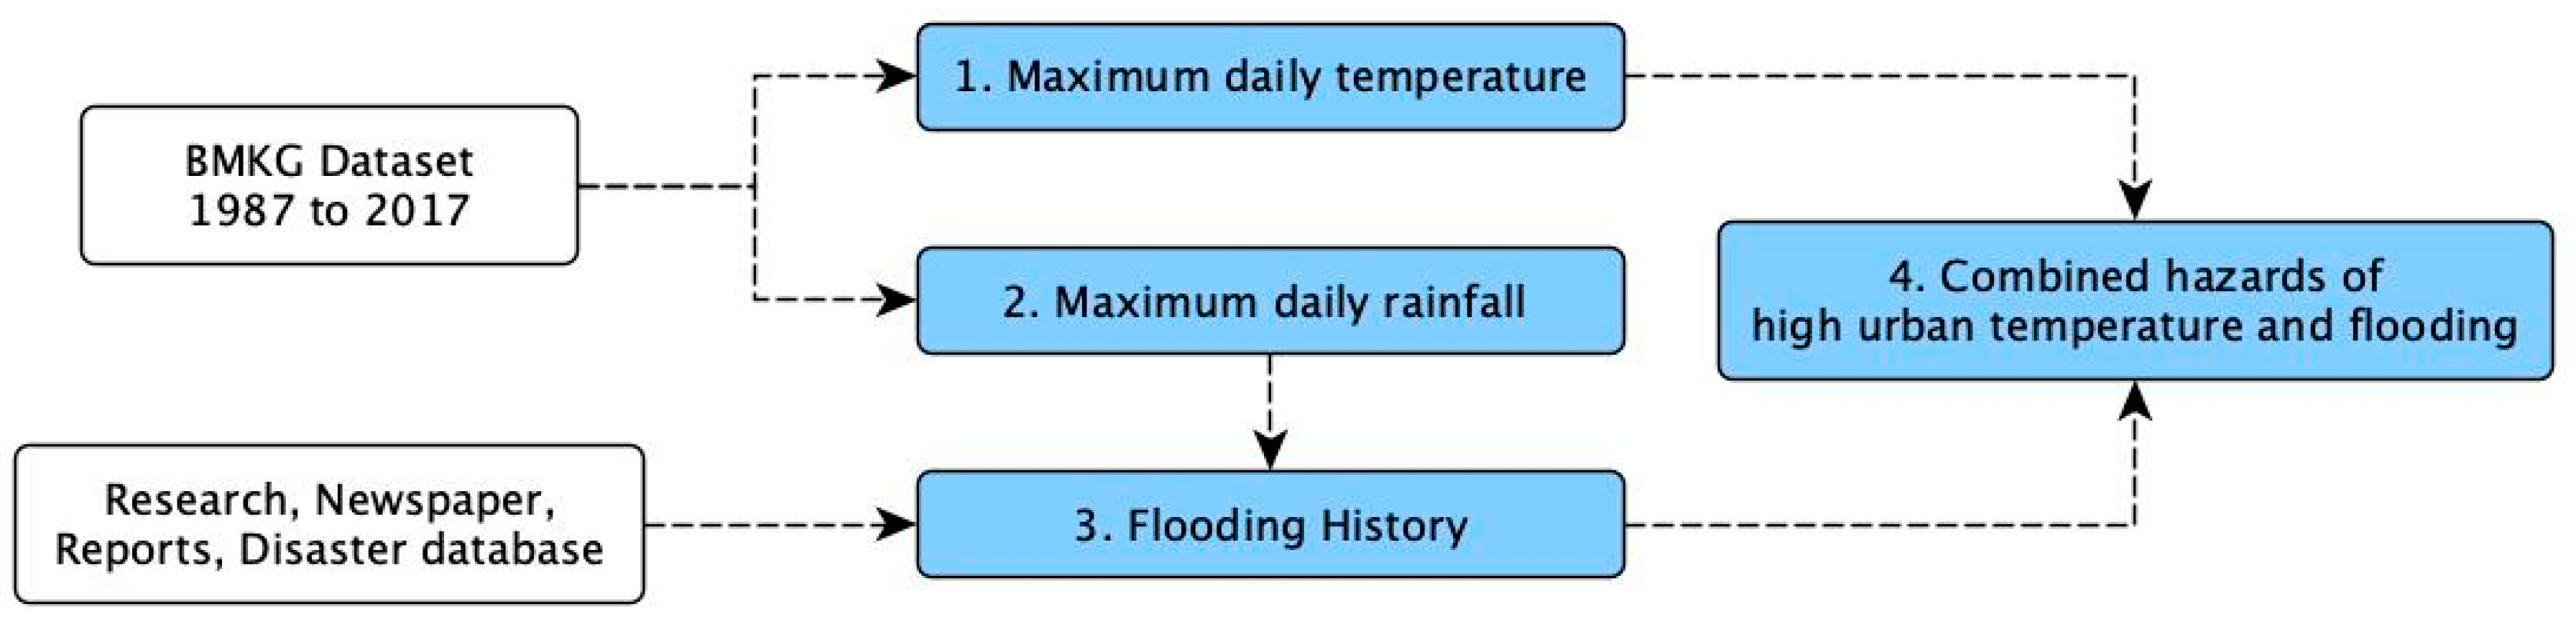
3. Methodology
4. Results
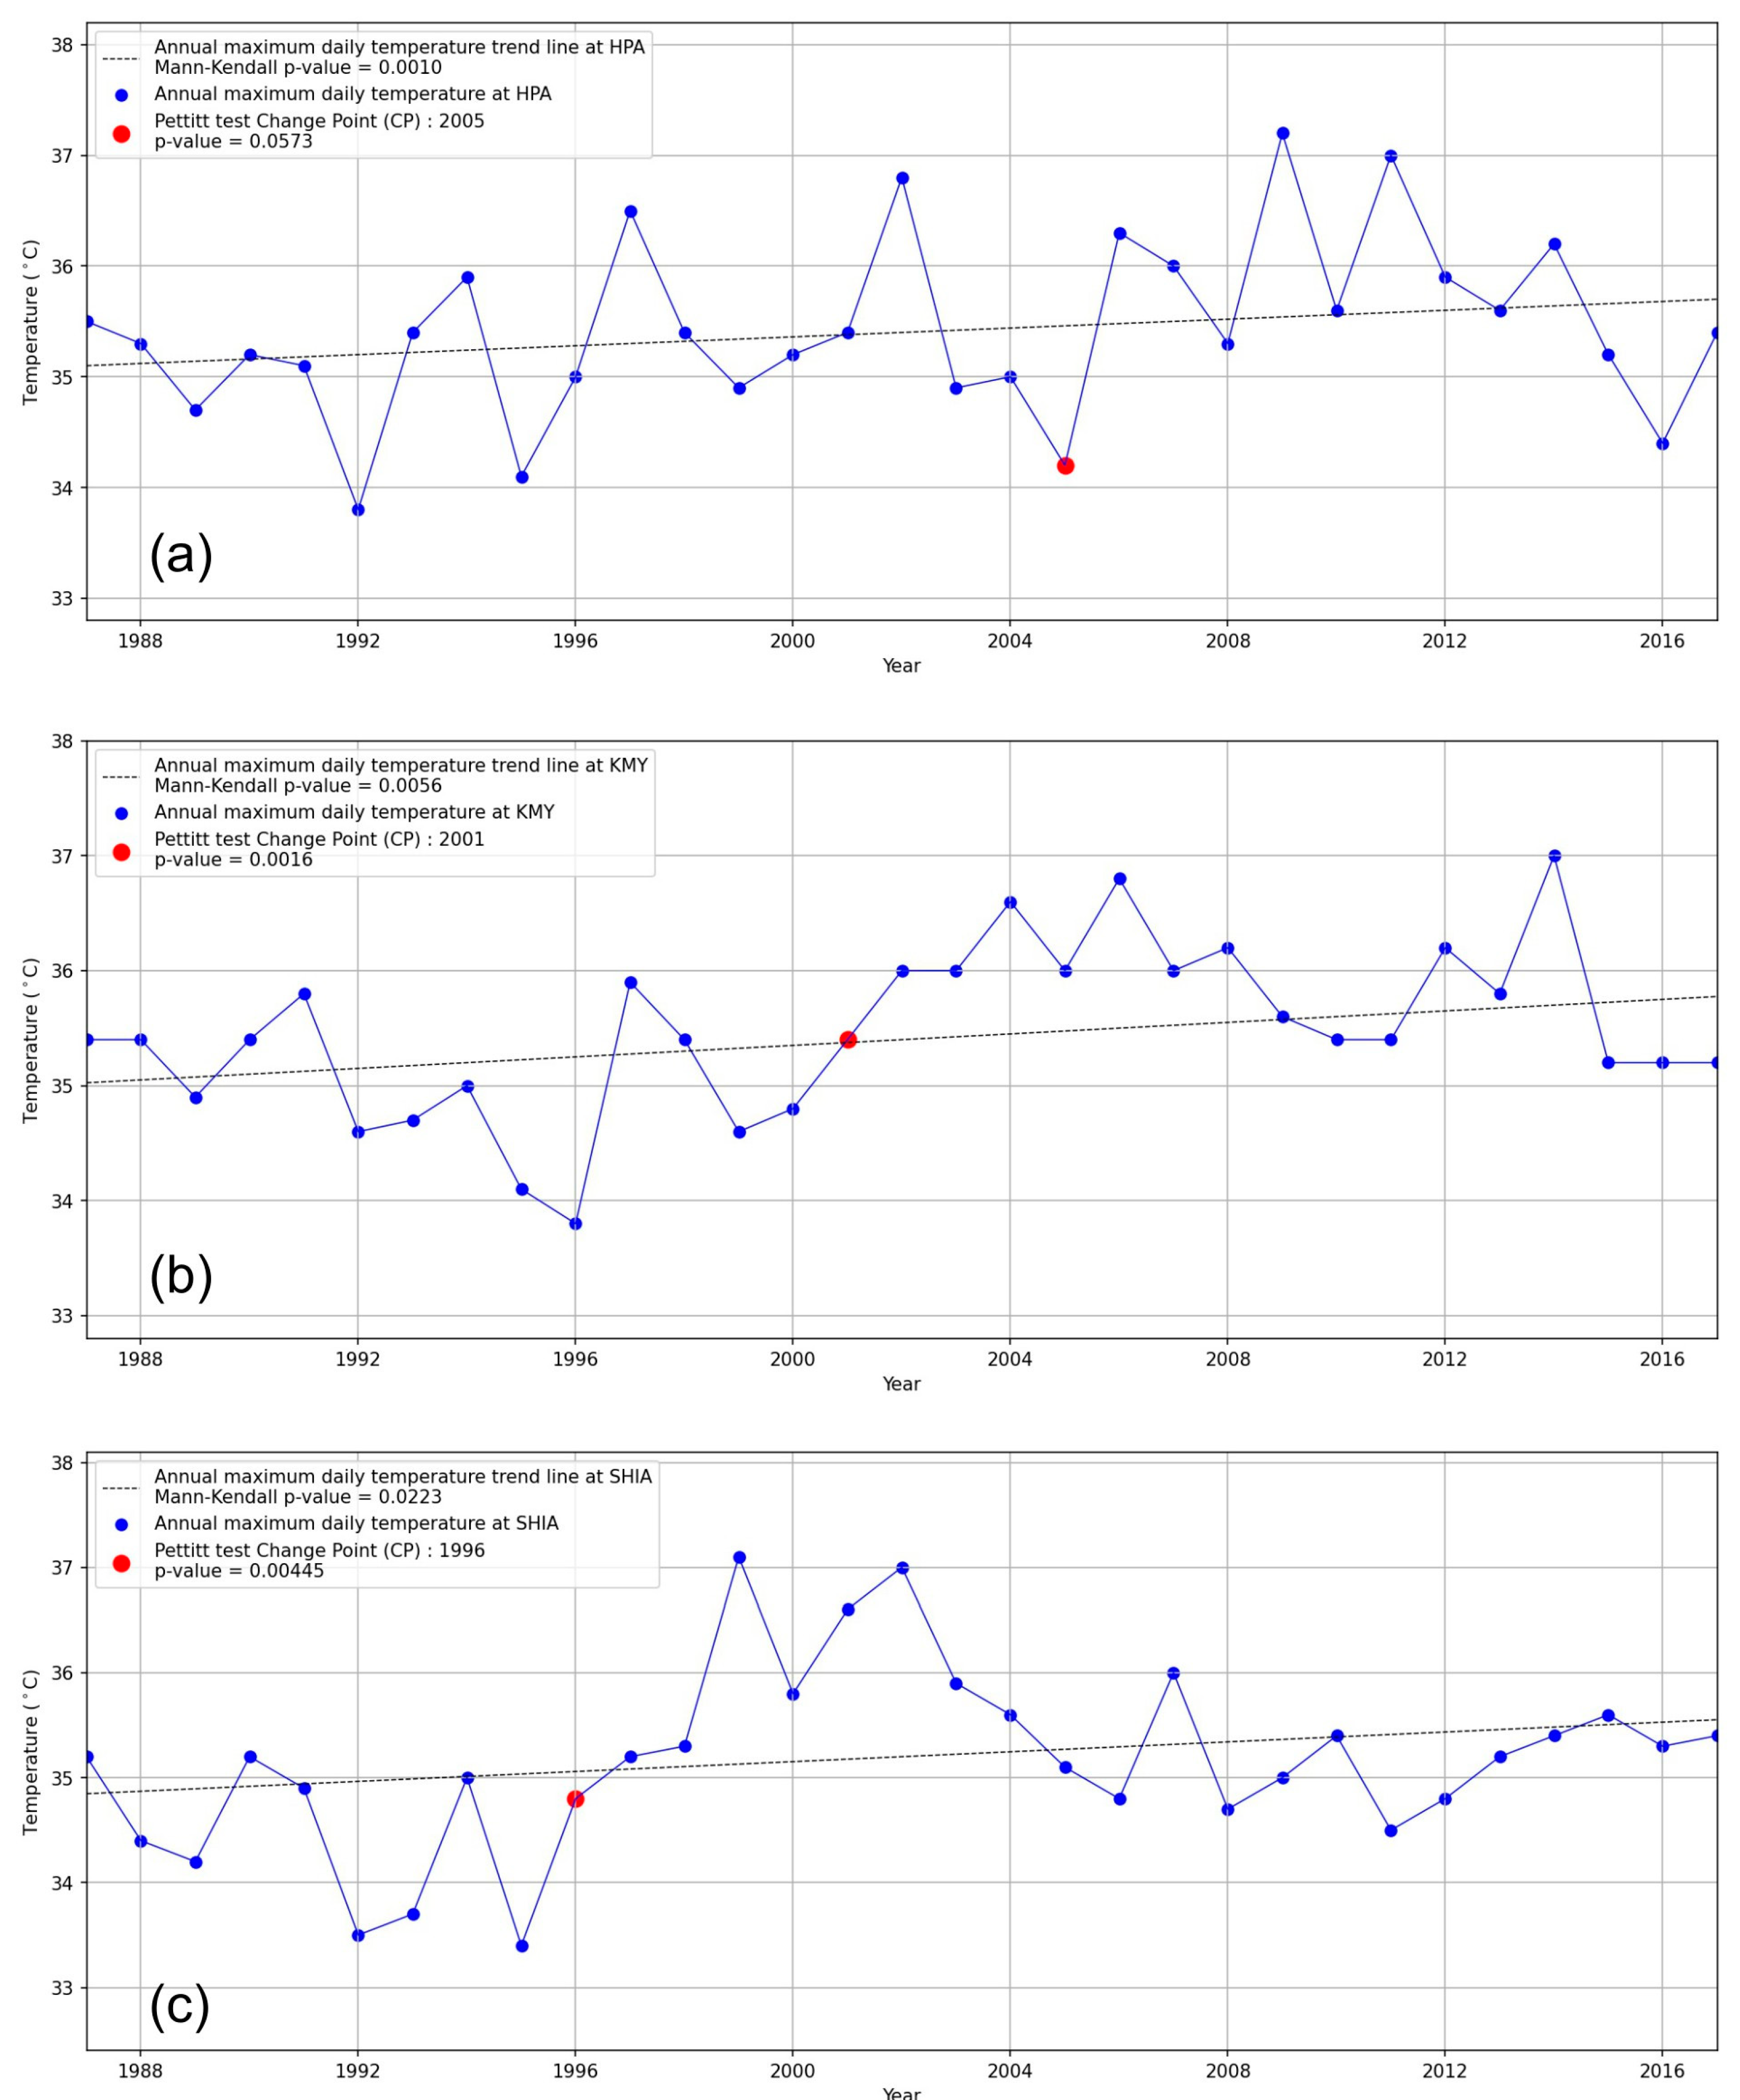
4.1. Maximum Daily Temperature
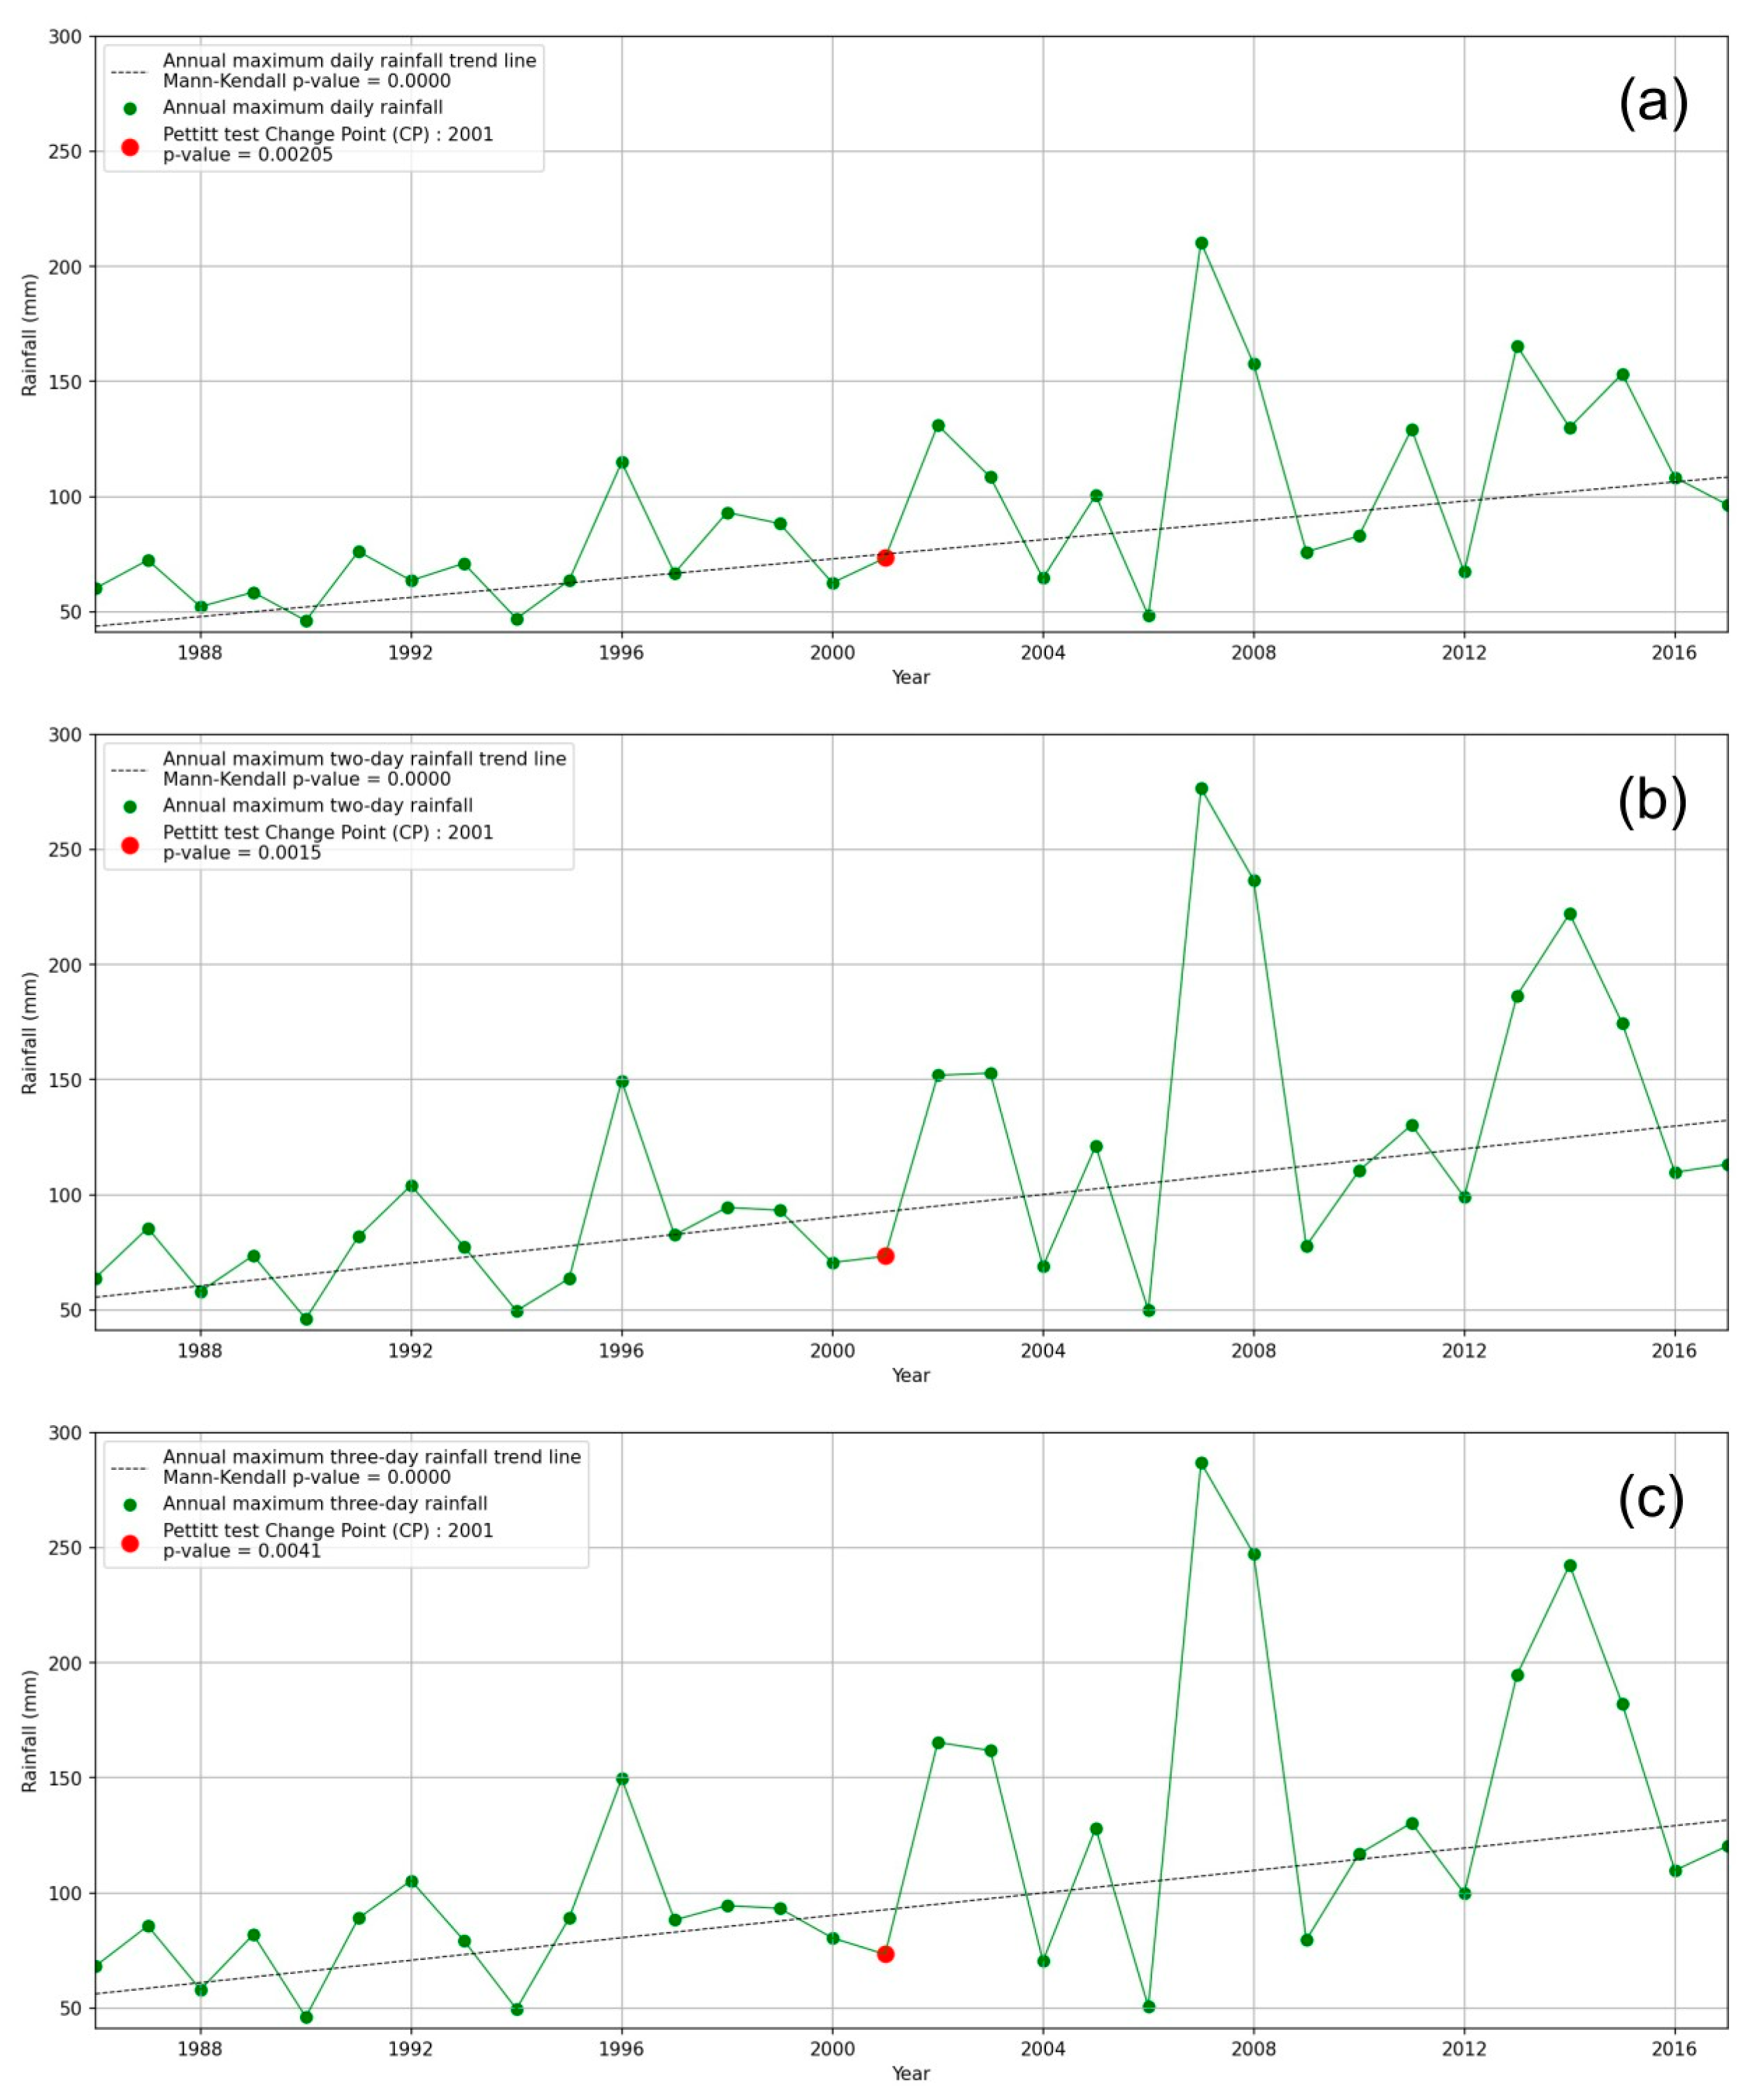
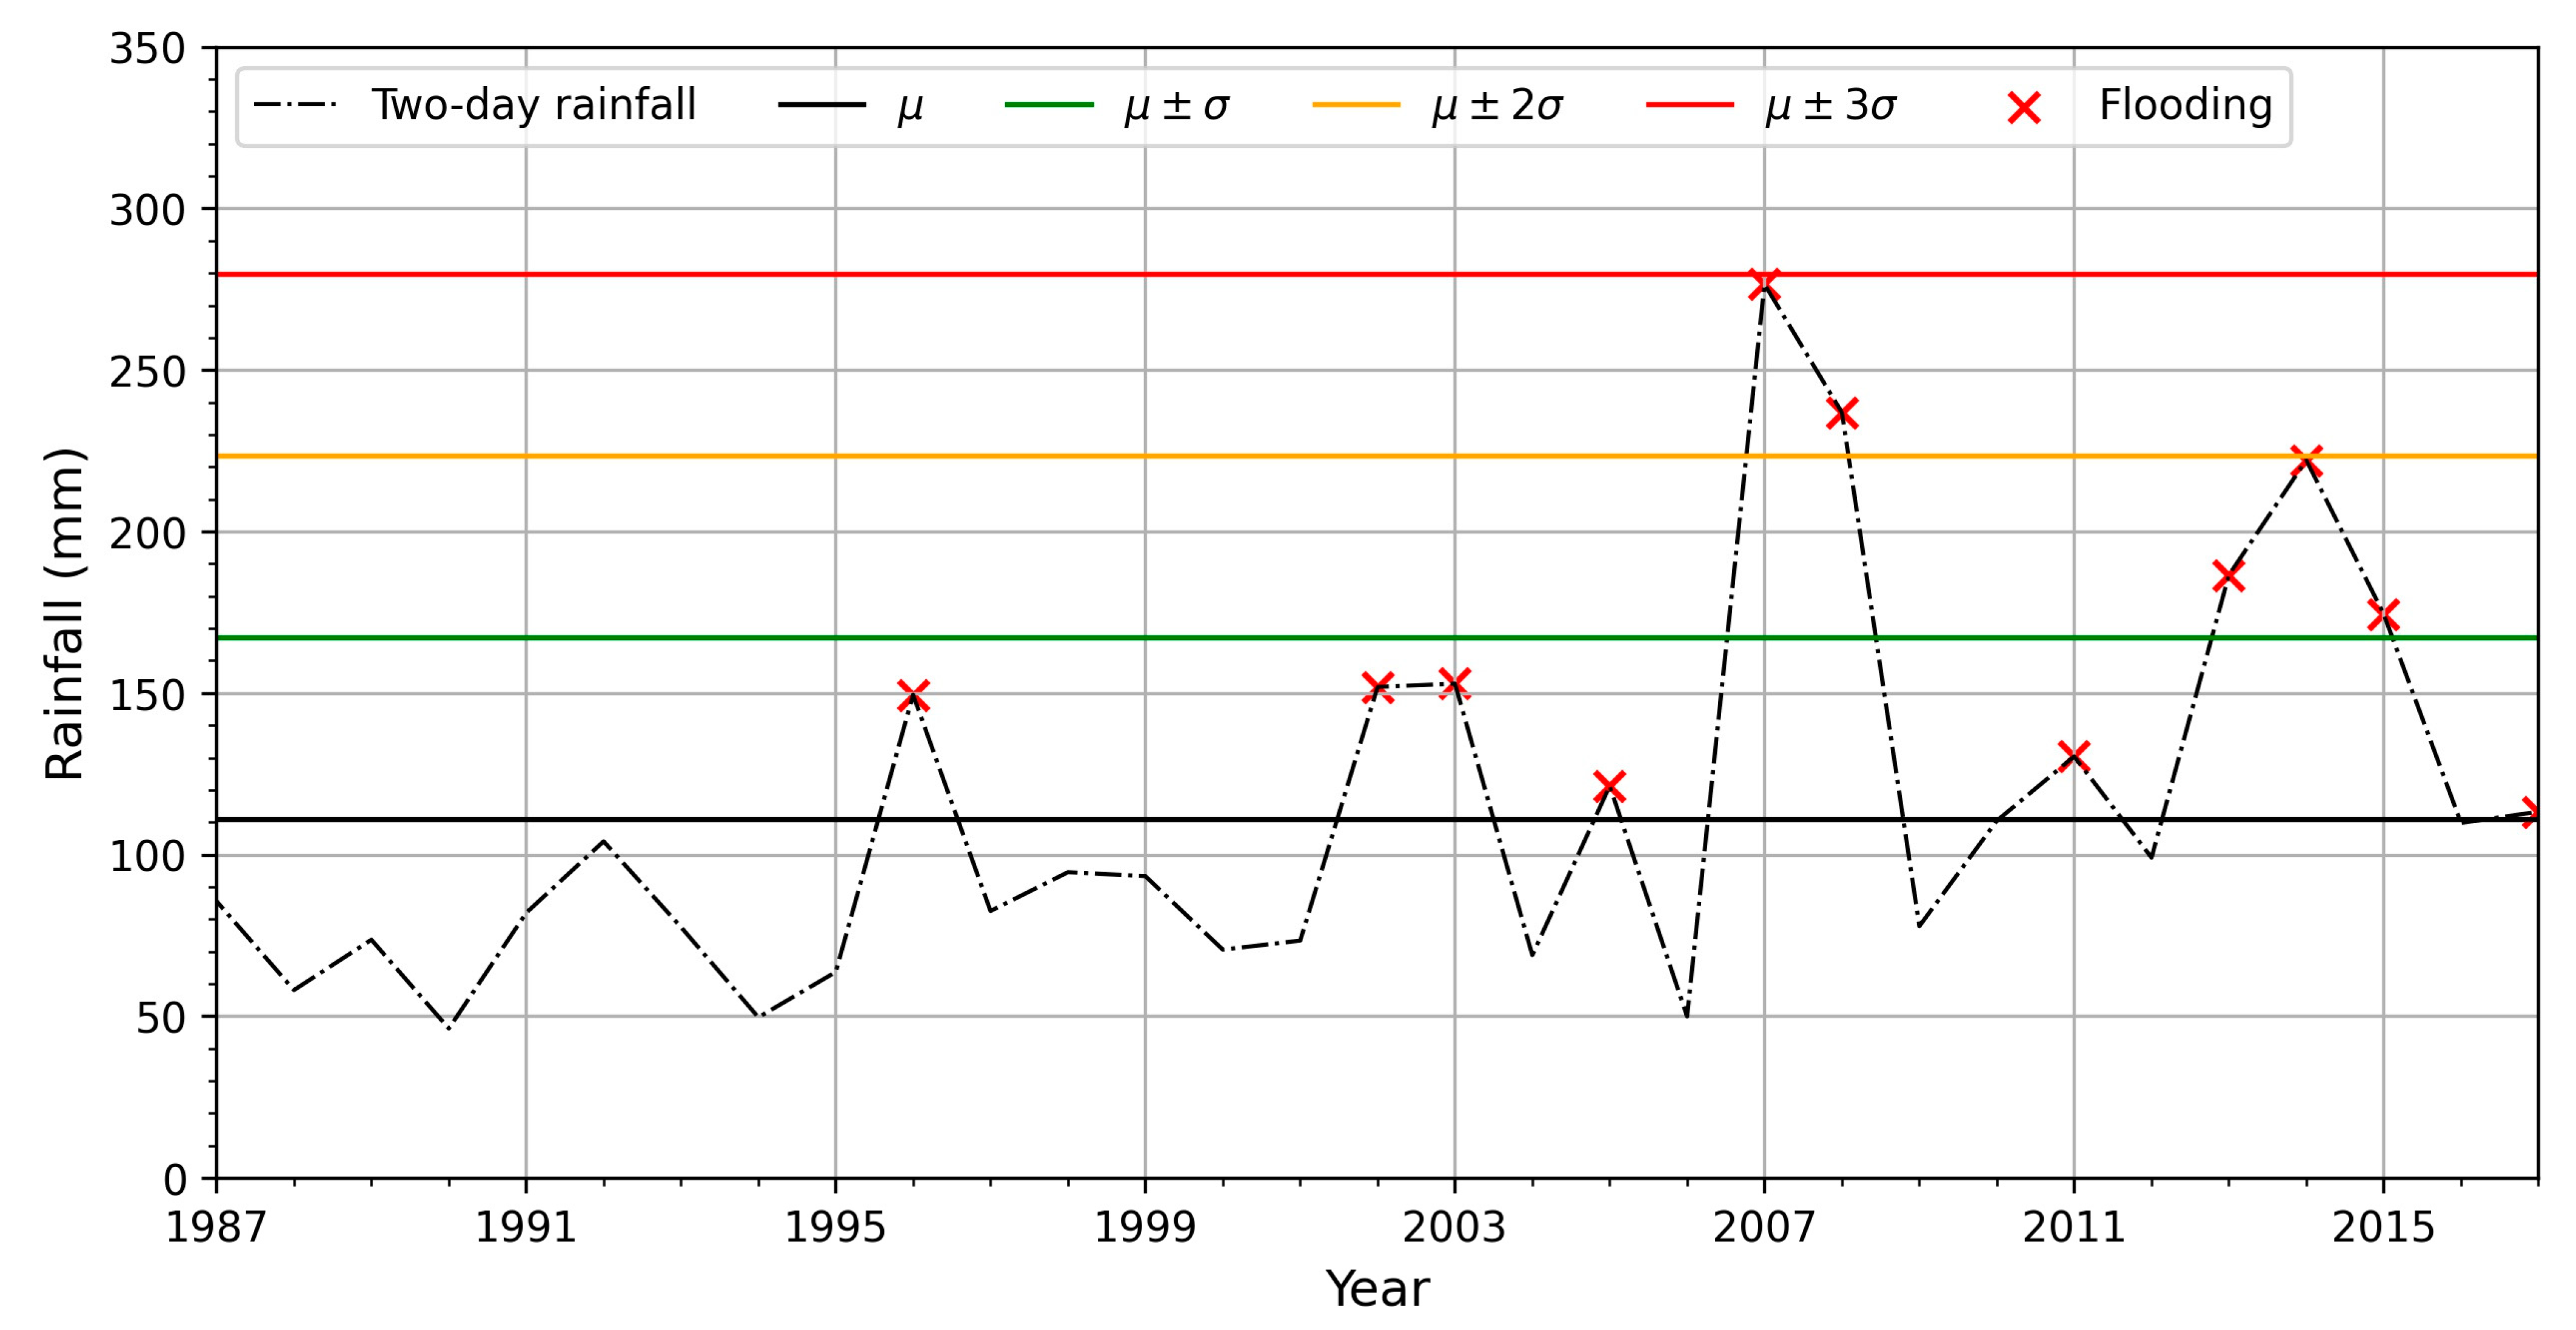
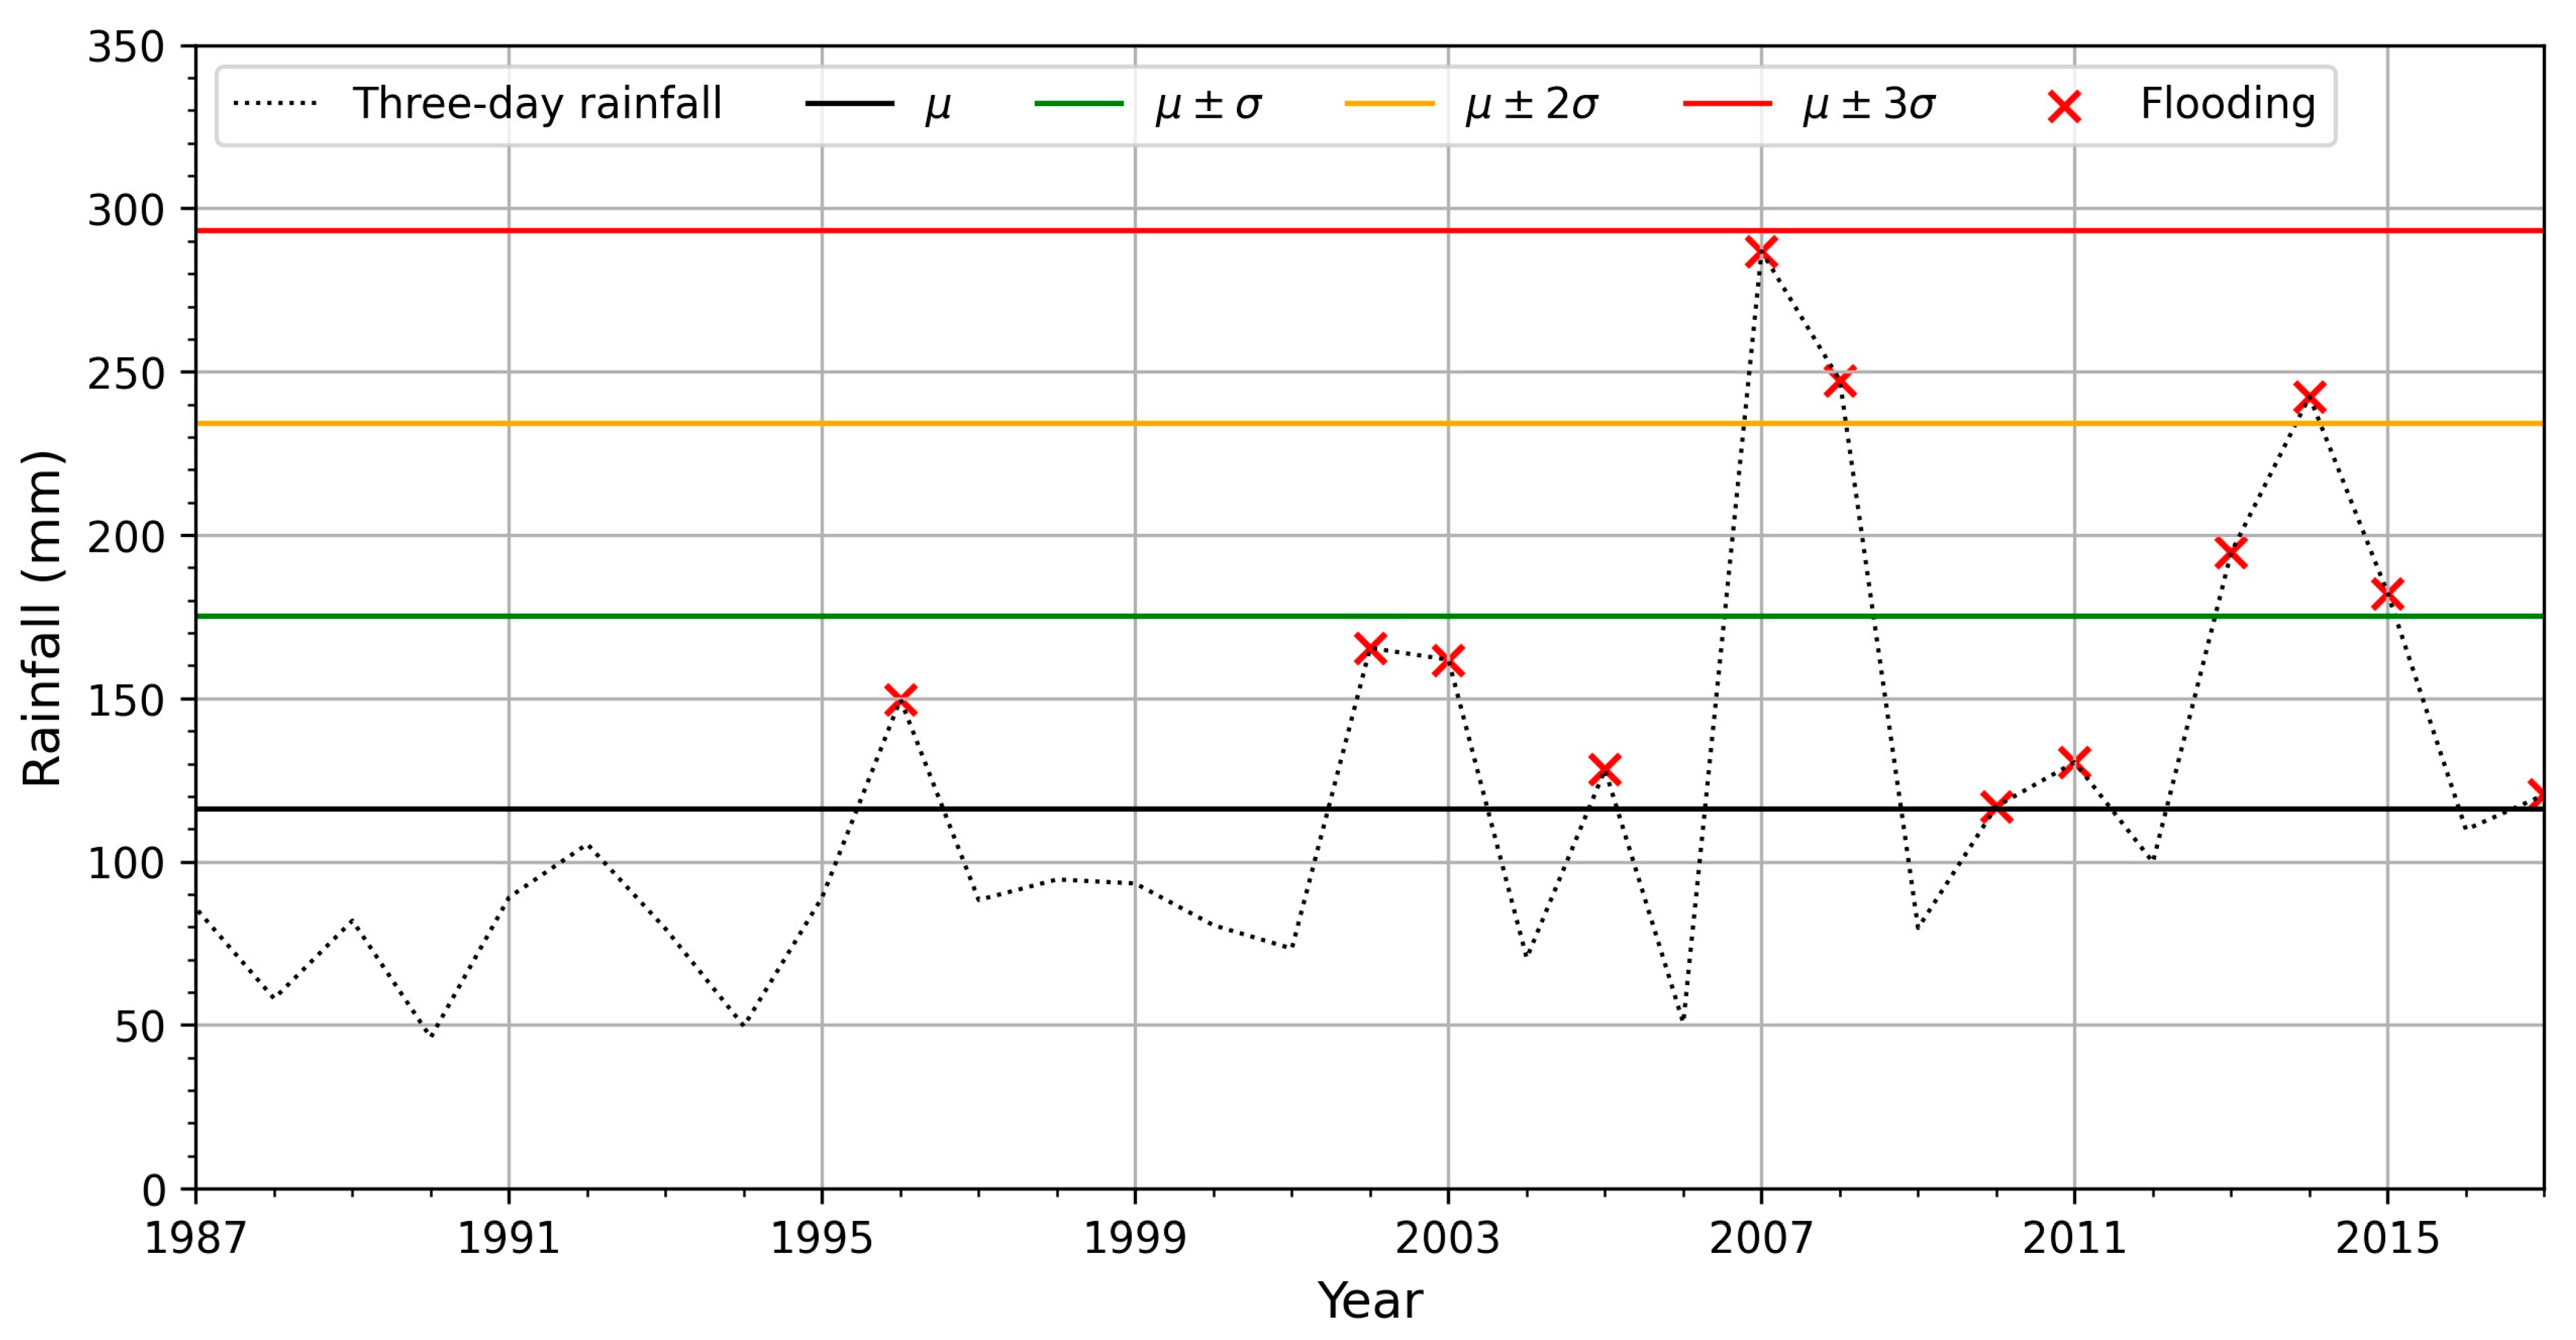
4.2. Maximum Daily Rainfall
4.3. Flooding History in Jakarta
5. Discussion
5.1. Increasing Maximum Daily Temperature and Maximum Daily Rainfall
5.2. Combined Hazards of High Urban Temperature and Flooding
5.3. Limitations of This Study and Future Perspectives
6. Conclusions
Author Contributions
Funding
Institutional Review Board Statement
Informed Consent Statement
Data Availability Statement
Acknowledgments
Conflicts of Interest
References
- United Nations—DESA. Available online: https://www.un.org/en/desa/world-population-projected-reach-98-billion-2050-and-112-billion-2100 (accessed on 15 November 2022).
- UNDESA. World Urbanization Prospects. 2018. Available online: https://esa.un.org/unpd/wup/ (accessed on 10 January 2020).
- Song, X.-P.; Hansen, M.C.; Stehman, S.V.; Potapov, P.V.; Tyukavina, A.; Vermote, E.F.; Townshend, J.R. Global land change from 1982 to 2016. Nature 2018, 560, 639–643. [Google Scholar] [CrossRef]
- Winkler, K.; Fuchs, R.; Rounsevell, M.; Herold, M. Global land use changes are four times greater than previously estimated. Nat. Commun. 2021, 12, 2501. [Google Scholar] [CrossRef]
- MacDicken, K.G. Global Forest Resources Assessment 2015: What, why and how? For. Ecol. Manag. 2015, 352, 3–8. [Google Scholar] [CrossRef]
- Potapov, P.; Hansen, M.C.; Pickens, A.; Hernandez-Serna, A.; Tyukavina, A.; Turubanova, S.; Zalles, V.; Li, X.; Khan, A.; Stolle, F.; et al. The Global 2000–2020 Land Cover and Land Use Change Dataset Derived from the Landsat Archive: First Results. Front. Remote Sens. 2022, 3, 856903. [Google Scholar] [CrossRef]
- Gao, J.; O’Neill, B.C. Mapping global urban land for the 21st century with data-driven simulations and Shared Socioeconomic Pathways. Nat. Commun. 2020, 11, 2302. [Google Scholar] [CrossRef] [PubMed]
- Oke, T.R.; Mills, G.; Christen, A.; Voogt, J.A. Urban Climates; Cambridge University Press: Cambridge, UK, 2017; ISBN 9781139016476. [Google Scholar]
- Forman, R.T.T. Urban Ecology; Cambridge University Press: Cambridge, UK, 2013; ISBN 9781139030472. [Google Scholar]
- Oke, T.R. Boundary Layer Climates; Routledge, Taylor and Francis Group: London, UK, 1987; Volume 27, ISBN 9780415043199. [Google Scholar]
- Fu, P.; Weng, Q. Responses of urban heat island in Atlanta to different land-use scenarios. Theor. Appl. Climatol. 2017, 133, 123–135. [Google Scholar] [CrossRef]
- Uddin, A.S.M.S.; Khan, N.; Islam, A.R.M.; Kamruzzaman, M.; Shahid, S. Changes in urbanization and urban heat island effect in Dhaka city. Theor. Appl. Climatol. 2022, 147, 891–907. [Google Scholar] [CrossRef]
- Doan, Q.-V.; Kusaka, H. Numerical study on regional climate change due to the rapid urbanization of greater Ho Chi Minh City’s metropolitan area over the past 20 years. Int. J. Climatol. 2016, 36, 3633–3650. [Google Scholar] [CrossRef]
- uz Zaman Chaudhry, Q.; Rasul, G.; Kamal, A.; Ahmad Mangrio, M.; Mahmood, S. Government of Pakistan Ministry of Climate Change Technical Report on Karachi Heat wave June. 2015; pp. 1–23. Available online: https://mocc.gov.pk/SiteImage/Misc/files/Final%20Heat%20Wave%20Report%203%20August%202015.pdf (accessed on 10 December 2022).
- Tokairin, T.; Sofyan, A.; Kitada, T. Effect of land use changes on local meteorological conditions in Jakarta, Indonesia: Toward the evaluation of the thermal environment of megacities in Asia. Int. J. Climatol. 2010, 30, 1931–1941. [Google Scholar] [CrossRef]
- Maheng, D.; Ducton, I.; Lauwaet, D.; Zevenbergen, C.; Pathirana, A. The sensitivity of urban heat island to urban green space-A model-based study of City of Colombo, Sri Lanka. Atmosphere 2019, 10, 151. [Google Scholar] [CrossRef]
- Matsumoto, J.; Fujibe, F.; Takahashi, H. Urban climate in the Tokyo metropolitan area in Japan. J. Environ. Sci. 2017, 59, 54–62. [Google Scholar] [CrossRef] [PubMed]
- Steul, K.; Schade, M.; Heudorf, U. Mortality during heatwaves 2003–2015 in Frankfurt-Main—The 2003 heatwave and its implications. Int. J. Hyg. Environ. Health 2018, 221, 81–86. [Google Scholar] [CrossRef] [PubMed]
- Sharma, R.; Hooyberghs, H.; Lauwaet, D.; De Ridder, K. Urban Heat Island and Future Climate Change—Implications for Delhi’s Heat. J. Urban Health 2019, 96, 235–251. [Google Scholar] [CrossRef]
- Kasai, M.; Okaze, T.; Mochida, A.; Hanaoka, K. Heatstroke risk predictions for current and near-future summers in Sendai, Japan, based on mesoscale WRF simulations. Sustainability 2017, 9, 1467. [Google Scholar] [CrossRef]
- De Troeyer, K.; Bauwelinck, M.; Aerts, R.; Profer, D.; Berckmans, J.; Delcloo, A.; Hamdi, R.; Van Schaeybroeck, B.; Hooyberghs, H.; Lauwaet, D.; et al. Heat related mortality in the two largest Belgian urban areas: A time series analysis. Environ. Res. 2020, 188, 109848. [Google Scholar] [CrossRef] [PubMed]
- Kolokotroni, M.; Ren, X.; Davies, M.; Mavrogianni, A. London’s urban heat island: Impact on current and future energy consumption in office buildings. Energy Build. 2012, 47, 302–311. [Google Scholar] [CrossRef]
- Shepherd, J.M. A review of current investigations of urban-induced rainfall and recommendations for the future. Earth Interact. 2005, 9, 1–27. [Google Scholar] [CrossRef]
- Kusaka, H.; Nawata, K.; Suzuki-Parker, A.; Takane, Y.; Furuhashi, N. Mechanism of precipitation increase with urbanization in Tokyo as revealed by ensemble climate simulations. J. Appl. Meteorol. Climatol. 2014, 53, 824–839. [Google Scholar] [CrossRef]
- Umer, Y.; Jetten, V.; Ettema, J.; Steeneveld, G.-J. Assessing the Impact of the Urban Landscape on Extreme Rainfall Characteristics Triggering Flood Hazards. Hydrology 2023, 10, 15. [Google Scholar] [CrossRef]
- Lin, C.Y.; Chen, W.C.; Chang, P.L.; Sheng, Y.F. Impact of the urban heat island effect on precipitation over a complex geographic environment in northern Taiwan. J. Appl. Meteorol. Climatol. 2011, 50, 339–353. [Google Scholar] [CrossRef]
- McCarthy, M.P.; Best, M.J.; Betts, R.A. Climate change in cities due to global warming and urban effects. Geophys. Res. Lett. 2010, 37, L09705. [Google Scholar] [CrossRef]
- Rozoff, C.M.; Cotton, W.R.; Adegoke, J.O. Simulation of St. Louis, Missouri, Land Use Impacts on Thunderstorms. J. Appl. Meteorol. Climatol. 2003, 42, 716–738. [Google Scholar] [CrossRef]
- Hidalgo, J.; Masson, V.; Baklanov, A.; Pigeon, G.; Gimeno, L. Advances in urban climate modeling. Ann. N. Y. Acad. Sci. 2008, 1146, 354–374. [Google Scholar] [CrossRef] [PubMed]
- Han, J.Y.; Baik, J.J.; Lee, H. Urban impacts on precipitation. Asia-Pac. J. Atmos. Sci. 2014, 50, 17–30. [Google Scholar] [CrossRef]
- Zhong, S.; Qian, Y.; Zhao, C.; Leung, R.; Wang, H.; Yang, B.; Fan, J.; Yan, H.; Yang, X.Q.; Liu, D. Urbanization-induced urban heat island and aerosol effects on climate extremes in the Yangtze River Delta region of China. Atmos. Chem. Phys. 2017, 17, 5439–5457. [Google Scholar] [CrossRef]
- Jin, M.; Li, Y.; Su, D. Urban-Induced Mechanisms for an Extreme Rainfall Event in Beijing China: A Satellite Perspective. Climate 2015, 3, 193–209. [Google Scholar] [CrossRef]
- Huff, F.A.; Vogel, J.L. Urban, Topographic and Diurnal Effects on Rainfall in the St. Louis Region. J. Appl. Meteorol. 1978, 17, 565–577. [Google Scholar] [CrossRef]
- Doan, Q.-V.; Dipankar, A.; Simón-Moral, A.; Sanchez, C.; Prasanna, V.; Roth, M.; Huang, X.-Y. Urban-induced modifications to the diurnal cycle of rainfall over a tropical city. Q. J. R. Meteorol. Soc. 2021, 147, 1189–1201. [Google Scholar] [CrossRef]
- Marelle, L.; Myhre, G.; Steensen, B.M.; Hodnebrog, Ø.; Alterskjær, K.; Sillmann, J. Urbanization in megacities increases the frequency of extreme precipitation events far more than their intensity. Environ. Res. Lett. 2020, 15, 124072. [Google Scholar] [CrossRef]
- Lei, C.; Yu, Z.; Sun, X.; Wang, Y.; Yuan, J.; Wang, Q.; Han, L.; Xu, Y. Urbanization effects on intensifying extreme precipitation in the rapidly urbanized Tai Lake Plain in East China. Urban Clim. 2023, 47, 101399. [Google Scholar] [CrossRef]
- Pathirana, A.; Denekew, H.B.; Veerbeek, W.; Zevenbergen, C.; Banda, A.T. Impact of urban growth-driven landuse change on microclimate and extreme precipitation—A sensitivity study. Atmos. Res. 2014, 138, 59–72. [Google Scholar] [CrossRef]
- Steensen, B.M.; Marelle, L.; Hodnebrog, Ø.; Myhre, G. Future urban heat island influence on precipitation. Clim. Dyn. 2021, 58, 3393–3403. [Google Scholar] [CrossRef]
- Fletcher, T.D.; Andrieu, H.; Hamel, P. Understanding, management and modelling of urban hydrology and its consequences for receiving waters: A state of the art. Adv. Water Resour. 2013, 51, 261–279. [Google Scholar] [CrossRef]
- Yao, L.; Chen, L.; Wei, W.; Sun, R. Potential reduction in urban runoff by green spaces in Beijing: A scenario analysis. Urban For. Urban Green. 2015, 14, 300–308. [Google Scholar] [CrossRef]
- Shang, H.; Zhang, K.; Wang, Z.; Yang, J.; He, M.; Pan, X.; Fang, C. Effect of varying wheatgrass density on resistance to overland flow. J. Hydrol. 2020, 591, 125594. [Google Scholar] [CrossRef]
- Bergeson, C.B.; Martin, K.L.; Doll, B.; Cutts, B.B. Soil infiltration rates are underestimated by models in an urban watershed in central North Carolina, USA. J. Environ. Manag. 2022, 313, 115004. [Google Scholar] [CrossRef] [PubMed]
- Gregory, J.H.; Dukes, M.D.; Jones, P.H.; Miller, G.L. Effect of urban soil compaction on infiltration rate. J. Soil Water Conserv. 2006, 61, 117–124. [Google Scholar]
- Eshtawi, T.; Evers, M.; Tischbein, B. Quantifying the impact of urban area expansion on groundwater recharge and surface runoff. Hydrol. Sci. J. 2015, 61, 150527103244004. [Google Scholar] [CrossRef]
- Skougaard Kaspersen, P.; Høegh Ravn, N.; Arnbjerg-Nielsen, K.; Madsen, H.; Drews, M. Comparison of the impacts of urban development and climate change on exposing European cities to pluvial flooding. Hydrol. Earth Syst. Sci. 2017, 21, 4131–4147. [Google Scholar] [CrossRef]
- Pravitasari, A.E. Study on Impact of Urbanization and Rapid Urban Expansion in Java and Jabodetabek, Megacity in Indonesia. Ph.D. Thesis, Kyoto University, Kyoto, Japan, 2015. [Google Scholar]
- Rustiadi, E.; Zain, A.M.; Trisasongko, B.H.; Carolita, I. Land Cover Change in Jabotabek Region, 2nd ed.; Himiyama, Y., Mather, A., Bicik, I., Milanova, E.V., Eds.; International Geographical Union Commission on Land Use/Cover Change: Hokkaido, Japan, 2002. [Google Scholar]
- Carolita, I.; Zain, A.M.; Trisasongko, B.H. The Land Use Pattern Changes of Jabotabek Region and Its Major Causes. 2002. Available online: https://www.semanticscholar.org/paper/The-Land-Use-Pattern-Changes-of-Jabotabek-Region-Carolita-Zain/df19c07727364e35b388378938f5b131e43e3f55 (accessed on 15 November 2022).
- Nagasawa, R.; Fukushima, A.; Yayusman, L.F.; Novresiandi, D.A. Urban expansion and its influences on the suburban land use change in Jakarta metropolitan region (JABODETABEK). Urban Plan. Des. Res. 2015, 3, 7–16. [Google Scholar] [CrossRef]
- Maheng, D.; Pathirana, A.; Zevenbergen, C. A preliminary study on the impact of landscape pattern changes due to urbanization: Case study of Jakarta, Indonesia. Land 2021, 10, 218. [Google Scholar] [CrossRef]
- Ramdhoni, S.; Rushayati, S.B. Open green space development priority based on distribution of air temperature change in capital city of Indonesia, Jakarta. Procedia Environ. Sci. 2016, 33, 204–213. [Google Scholar] [CrossRef]
- Darmanto, N.S.; Varquez, A.C.G.; Kawano, N.; Kanda, M. Future urban climate projection in a tropical megacity based on global climate change and local urbanization scenarios. Urban Clim. 2019, 29, 100482. [Google Scholar] [CrossRef]
- Siswanto, S.; van Oldenborgh, G.J.; van der Schrier, G.; Jilderda, R.; van den Hurk, B. Temperature, extreme precipitation, and diurnal rainfall changes in the urbanized Jakarta city during the past 130 years. Int. J. Climatol. 2016, 36, 3207–3225. [Google Scholar] [CrossRef]
- Sobri, E. Impact Reducing Urban Green Space towards Increasing Air Temperature Using Landsat Data. J. Agromet 2009, 23, 169–181. [Google Scholar]
- Maheng, D.; Pathirana, A.; Bhattacharya, B.; Zevenbergen, C.; Lauwaet, D.; Siswanto, S.; Suwondo, A. LULC change drives the temperature increase in the urbanized Jakarta: Findings from an Urban Boundary Layer Model. City Environ. Interact. 2023. under review. [Google Scholar]
- Tsiringakis, A.; Schreus, B.W.; Steeneveld, G.J.; Siswanto, S. The impact of urbanization on an extreme precipitation event over Jakarta. In Proceedings of the EMS Annual Meeting: European Conference for Applied Meteorology and Climatology, Dublin, Ireland, 4–8 September 2017. [Google Scholar]
- Siswanto, S.; van der Schrier, G.; van den Hurk, B. Observed Increase of Urban Extreme Rainfall as Surface Temperature Rise: The Jakarta Case. J. Meteorol. Soc. Jpn. Ser. II 2022, 100, 475–492. [Google Scholar] [CrossRef]
- Nuryanto, D.E.; Pawitan, H.; Hidayat, R.; Aldrian, E. Contribution of land use changes to meteorological parameters in Greater Jakarta: Case 17 January 2014. IOP Conf. Ser. Earth Environ. Sci. 2018, 149, 012028. [Google Scholar] [CrossRef]
- Supari; Tangang, F.; Juneng, L.; Aldrian, E. Observed changes in extreme temperature and precipitation over Indonesia. Int. J. Climatol. 2017, 37, 1979–1997. [Google Scholar] [CrossRef]
- United Nations—DESA. 2018 Revision of World Urbanization Prospects. Available online: https://population.un.org/wup/ (accessed on 10 December 2022).
- Duan, Y.; Liu, H.; Yu, W.; Liu, L.; Yang, G.; Liu, B. The onset of the Indonesian–Australian summer monsoon triggered by the first-branch eastward-propagating Madden–Julian oscillation. J. Clim. 2019, 32, 5453–5470. [Google Scholar] [CrossRef]
- Siswanto; Van Oldenborgh, G.J.; Van Der Schrier, G.; Lenderink, G.; Van Den Hurk, B. Trends in high-daily precipitation events in Jakarta and the flooding of January 2014. Bull. Am. Meteorol. Soc. 2015, 96, S131–S135. [Google Scholar] [CrossRef]
- BMKG. Data Online—Pusat Database BMKG. Available online: https://dataonline.bmkg.go.id/home (accessed on 17 July 2022).
- CEDR. The International Disaster Database. Available online: https://www.emdat.be (accessed on 11 November 2022).
- Jaiswal, R.K.; Lohani, A.K.; Tiwari, H.L. Statistical Analysis for Change Detection and Trend Assessment in Climatological Parameters. Environ. Process. 2015, 2, 729–749. [Google Scholar] [CrossRef]
- Luiz-Silva, W.; Oscar-Júnior, A.C. Climate extremes related with rainfall in the State of Rio de Janeiro, Brazil: A review of climatological characteristics and recorded trends. Nat. Hazards 2022, 114, 713–732. [Google Scholar] [CrossRef] [PubMed]
- Regoto, P.; Dereczynski, C.; Chou, S.C.; Bazzanela, A.C. Observed changes in air temperature and precipitation extremes over Brazil. Int. J. Climatol. 2021, 41, 5125–5142. [Google Scholar] [CrossRef]
- Te Chow, V.; Maidment, D.R.; Mays, L.W. Applied Hydrology; McGraw-Hill Series in Water Resources and Environmental Engineering; McGraw-Hill: Singapore, 1988; ISBN 0070108102. [Google Scholar]
- Marani, M.; Ignaccolo, M. A metastatistical approach to rainfall extremes. Adv. Water Resour. 2015, 79, 121–126. [Google Scholar] [CrossRef]
- Towler, E.; Llewellyn, D.; Prein, A.; Gilleland, E. Extreme-value analysis for the characterization of extremes in water resources: A generalized workflow and case study on New Mexico monsoon precipitation. Weather Clim. Extrem. 2020, 29, 100260. [Google Scholar] [CrossRef]
- Arvind, G.; Ashok Kumar, P.; Girish Karthi, S.; Suribabu, C.R. Statistical Analysis of 30 Years Rainfall Data: A Case Study. IOP Conf. Ser. Earth Environ. Sci. 2017, 80, 012067. [Google Scholar] [CrossRef]
- Li, Y.; Cai, W.; Campbell, E.P. Statistical modeling of extreme rainfall in southwest Western Australia. J. Clim. 2005, 18, 852–863. [Google Scholar] [CrossRef]
- Noorduyn, J.; Verstappen, H. Purnavarman’s river-works near tugu. Bijdr. Tot De Taal-Land En Volkenkd. 1972, 128, 298–307. [Google Scholar] [CrossRef]
- Ndoen, E.M.; Faimau, G.; Li, D.E.; Lassa, J.A.; Sagala, S.S. The Evolution of Risk and Vulnerability in Greater Jakarta: Contesting Government Policy; IRGSC: Kupang, Indonesia, 2013. [Google Scholar]
- ReliefWeb Floods in Jakarta, Indonesia 6 February 2002. Available online: https://reliefweb.int/report/indonesia/floods-jakarta-indonesia-06-feb-2002 (accessed on 2 December 2022).
- Diposaptono, S.; Pratikto, W.A.; Mano, A. Flood in Jakarta—Lessons Learnt from the 2002 Flood. In Asian and Pacific Coasts 2003; 2004; pp. 1–8. Available online: https://www.worldscientific.com/doi/10.1142/9789812703040_0006 (accessed on 10 October 2022).
- ReliefWeb Indonesia: Floods in DKI Jakarta Province, Updated 7 February 2007 Emergency Situation Report No. 4. Available online: https://reliefweb.int/report/indonesia/indonesia-floods-dki-jakarta-province-updated-07-feb-2007-emergency-situation (accessed on 15 November 2022).
- JBA. A Retrospective View of Floods in Jakarta. Available online: https://www.jbarisk.com/products-services/event-response/a-retrospective-view-of-floods-in-jakarta/ (accessed on 15 November 2022).
- Cobián Álvarez, J.A.; Resosudarmo, B.P. The cost of floods in developing countries’ megacities: A hedonic price analysis of the Jakarta housing market, Indonesia. Environ. Econ. Policy Stud. 2019, 21, 555–577. [Google Scholar] [CrossRef]
- ReliefWeb Jakarta Flood Response. 2013. Available online: https://reliefweb.int/report/indonesia/jakarta-flood-response-2013 (accessed on 12 December 2022).
- Detiknews Banjir, 13.120 Warga DKI Ngungsi. Available online: https://news.detik.com/berita/d-276668/banjir-13120-warga-dki-ngungsi (accessed on 15 November 2022).
- Guardian, T. Four-Metre Floodwaters Displace 340,000 in Jakarta. Available online: https://www.theguardian.com/world/2007/feb/05/weather.indonesia (accessed on 11 November 2022).
- Aldrian, E. Dominant Factors of Jakarta’ S Three Largest Floods. Hidrosfir Indones. 2008, 3, 105–112. [Google Scholar]
- Detiknews Korban Banjir Jakarta 79796 Jiwa. Available online: https://news.detik.com/berita/d-888218/korban-banjir-jakarta-79796-jiwa (accessed on 20 December 2022).
- Nuryanto, D.E.; Pawitan, H.; Hidayat, R.; Aldrian, E. Characteristics of two mesoscale convective systems (MCSs) over the Greater Jakarta: Case of heavy rainfall period 15–18 January 2013. Geosci. Lett. 2019, 6, 1. [Google Scholar] [CrossRef]
- Siswanto; van der Schrier, G.; Jan van Oldenborgh, G.; van den Hurk, B.; Aldrian, E.; Swarinoto, Y.; Sulistya, W.; Eka Sakya, A. A very unusual precipitation event associated with the 2015 floods in Jakarta: An analysis of the meteorological factors. Weather Clim. Extrem. 2017, 16, 23–28. [Google Scholar] [CrossRef]
- ReliefWeb. AHA Centre Flash Update—Jakarta Flood. 10 February 2015. Available online: https://reliefweb.int/report/indonesia/aha-centre-flash-update-jakarta-flood-10-february-2015 (accessed on 13 December 2022).
- Media Jaya. Information Media of the Provincial Government of DKI Jakarta; Jakarta, Indonesia. 2020. Available online: https://jakita.jakarta.go.id/media/download/eng/edisi_1_2020.pdf (accessed on 10 October 2022).
- Takagi, H.; Esteban, M.; Mikami, T.; Pratama, M.B.; Valenzuela, V.P.B.; Avelino, J.E. People’s perception of land subsidence, floods, and their connection: A note based on recent surveys in a sinking coastal community in Jakarta. Ocean Coast. Manag. 2021, 211, 105753. [Google Scholar] [CrossRef]
- Hasibuan, H.S.; Tambunan, R.P.; Rukmana, D.; Permana, C.T.; Elizandri, B.N.; Putra, G.A.Y.; Wahidah, A.N.; Ristya, Y. Policymaking and the spatial characteristics of land subsidence in North Jakarta. City Environ. Interact. 2023, 18, 100103. [Google Scholar] [CrossRef]
- Wicaksono, A.P.A.; Agustin, H.N.; Agustina, N.; Putri, N.D.R.; Pratama, F.K.T. Impact of drainage problems in the city of Jakarta. J. Glob. Environ. Dyn. 2021, 2, 8–12. [Google Scholar]
- Zevenbergen, C.; Bhattacharya, B.; Wahaab, R.A.; Elbarki, W.A.I.; Busker, T.; Salinas Rodriguez, C.N.A. In the aftermath of the October 2015 Alexandria Flood Challenges of an Arab city to deal with extreme rainfall storms. Nat. Hazards 2017, 86, 901–917. [Google Scholar] [CrossRef]
- Supari; Tangang, F.; Salimun, E.; Aldrian, E.; Sopaheluwakan, A.; Juneng, L. ENSO modulation of seasonal rainfall and extremes in Indonesia. Clim. Dyn. 2018, 51, 2559–2580. [Google Scholar] [CrossRef]
- Roca-barcelo, A.; Belcher, R.N.; Asseng, S.; Spänkuch, D.; Hernandez-ochoa, I.M.; Laporta, J. The upper temperature thresholds of life. Lancet Planet Health 2021, 5, e378–e385. [Google Scholar]
- Sherwood, S.C.; Huber, M. An adaptability limit to climate change due to heat stress. Proc. Natl. Acad. Sci. USA 2010, 107, 9552–9555. [Google Scholar] [CrossRef]
- Majidi, A.N.; Vojinovic, Z.; Alves, A.; Weesakul, S.; Sanchez, A.; Boogaard, F.; Kluck, J. Planning nature-based solutions for urban flood reduction and thermal comfort enhancement. Sustainability 2019, 11, 6361. [Google Scholar] [CrossRef]
- Young, A.; Bhattacharya, B.; Zevenbergen, C. A rainfall threshold-based approach to early warnings in urban data-scarce regions: A case study of pluvial flooding in Alexandria, Egypt. J. Flood Risk Manag. 2021, 14, e12702. [Google Scholar] [CrossRef]


| Meteorological Stations | Data | Time Period | Source |
|---|---|---|---|
| KMY | daily temperature, daily rainfall | 1987 to 2017 | https://dataonline.bmkg.go.id, accessed on 17 July 2022 |
| SHIA | daily temperature, daily rainfall | 1987 to 2017 | https://dataonline.bmkg.go.id, accessed on 17 July 2022 |
| HPA | daily temperature, daily rainfall | 1987 to 2017 | https://dataonline.bmkg.go.id, accessed on 17 July 2022 |
| Proposed Rainfall Classification in Jakarta | Daily Rainfall Amount (p) |
|---|---|
| Low | p < (µ + σ) |
| Medium | (µ + σ) < p < (µ + 2σ) |
| High | (µ + 2σ) < p < (µ + 3σ) |
| Very high | p > (µ + 3 σ) |
| Dates | Daily Accumulated Rainfall (mm) | ||
|---|---|---|---|
| One-Day | Two-Day | Three-Day | |
| 9 February 1996 | 114.96 | 149.45 | 149.65 |
| 25 February 1998 | 93.16 | 94.54 | 94.54 |
| 1 February 2002 | 131.11 | 151.88 | 165.41 |
| 29 December 2003 | 108.50 | 152.88 | 161.82 |
| 18 January 2005 | 100.62 | 121.26 | 128.16 |
| 1 February 2007 | 210.49 | 276.56 | 286.86 |
| 1 February 2008 | 157.70 | 236.80 | 247.33 |
| 28 February 2011 | 129.34 | 130.37 | 130.42 |
| 17 January 2013 | 165.57 | 186.50 | 194.67 |
| 17 January 2014 | 130.02 | 222.09 | 242.39 |
| 10 February 2015 | 153.34 | 174.50 | 182.16 |
| 21 April 2016 | 108.36 | 109.79 | 109.79 |
| Dates | Number of Affected People | Number of Deaths | Remarks | Information Sources |
|---|---|---|---|---|
| 9 February 1996 | ~30,000 | ~20 | Major flooding | [64,74] |
| 1998 | NA | NA | NA | |
| 1 February 2002 | ~400,000 | ~33 | Major flooding | [64,74,75] |
| 29 December 2003 | NA | NA | [64] | |
| 2005 | NA | NA | [81] | |
| 1 February 2007 | ~400,000 | ~ 57 | Major flooding | [74,77,78,82] |
| 1 February 2008 | ~80,000 | NA | Major flooding | [83,84] |
| 2011 | NA | NA | NA | |
| 17 January 2013 | ~250,000 | ~ 20 | Major flooding | [78,80,85] |
| 17 January 2014 | ~130,000 | ~ 20 | Major Flooding | [58,62,64,78] |
| 10 February 2015 | NA | NA | [64,86,87] |
Disclaimer/Publisher’s Note: The statements, opinions and data contained in all publications are solely those of the individual author(s) and contributor(s) and not of MDPI and/or the editor(s). MDPI and/or the editor(s) disclaim responsibility for any injury to people or property resulting from any ideas, methods, instructions or products referred to in the content. |
© 2023 by the authors. Licensee MDPI, Basel, Switzerland. This article is an open access article distributed under the terms and conditions of the Creative Commons Attribution (CC BY) license (https://creativecommons.org/licenses/by/4.0/).
Share and Cite
Maheng, D.; Bhattacharya, B.; Zevenbergen, C.; Pathirana, A. Changing Urban Temperature and Rainfall Patterns in Jakarta: A Comprehensive Historical Analysis. Sustainability 2024, 16, 350. https://doi.org/10.3390/su16010350
Maheng D, Bhattacharya B, Zevenbergen C, Pathirana A. Changing Urban Temperature and Rainfall Patterns in Jakarta: A Comprehensive Historical Analysis. Sustainability. 2024; 16(1):350. https://doi.org/10.3390/su16010350
Chicago/Turabian StyleMaheng, Dikman, Biswa Bhattacharya, Chris Zevenbergen, and Assela Pathirana. 2024. "Changing Urban Temperature and Rainfall Patterns in Jakarta: A Comprehensive Historical Analysis" Sustainability 16, no. 1: 350. https://doi.org/10.3390/su16010350
APA StyleMaheng, D., Bhattacharya, B., Zevenbergen, C., & Pathirana, A. (2024). Changing Urban Temperature and Rainfall Patterns in Jakarta: A Comprehensive Historical Analysis. Sustainability, 16(1), 350. https://doi.org/10.3390/su16010350