Article

Spatiotemporal Land Use and Land Cover Changes and Associated Runoff Impact in Itaperuna, Brazil

by
Gean Carlos Gonzaga da Silva
,
Priscila Celebrini de Oliveira Campos
,
Marcelo de Miranda Reis
and
Igor Paz
*
Instituto Militar de Engenharia, Praça General Tibúrcio 80, Praia Vermelha, Rio de Janeiro 22290-270, Brazil
*
Author to whom correspondence should be addressed.
Sustainability 2024, 16(1), 325; https://doi.org/10.3390/su16010325
Submission received: 30 November 2023 / Revised: 20 December 2023 / Accepted: 27 December 2023 / Published: 29 December 2023

Abstract

:
The urban growth intricately linked to the hydrological cycle outlines a crucial dynamic in the environmental transformations of cities. Utilizing the InVEST (Integrated Valuation of Ecosystem Services and Tradeoffs) Urban Flood Risk Mitigation model, we conducted hydrological modeling to assess the impact of urbanization on land use and land cover (LULC) changes and their subsequent effects on runoff generation in Itaperuna, Brazil, spanning the years 2015 to 2020. The analysis, performed across 17 urban sub-basins, highlights rapid urban expansion, notably in sub-basins 3 and 7, reflecting the city’s spatial dynamics and growth. Significantly, sub-basin 3 exhibited a 7.42% increase in runoff production capacity. The study meticulously documents changes in six LULC categories—water bodies, urban area, exposed soil, forest, natural pasture, and grassland vegetation—revealing that urban growth has directly amplified surface runoff in specific sub-basins, thereby impacting water resource management and flood prevention. Emphasizing the urgency of environmental conservation, especially in deforested basins, the findings hold substantial importance for urban planners and local authorities, offering relevant insights for flood risk mitigation and water security. Future research directions may explore additional facets, including water quality, advanced hydrological models, impacts on biodiversity and society, socioeconomic assessments of preventative measures, public policy considerations, and monitoring systems.

1. Introduction

Projections suggest that by 2050, approximately 68% of the global population will reside in metropolitan areas, with 55% already dwelling in urban centers in 2017 [1]. Urbanization fundamentally reshapes urban land use and land cover (LULC) [2], bearing manifold implications for urban hydrology [3,4,5,6]. As urban areas expand, the transformation from natural terrains into impermeable surfaces, encompassing structures, roadways, and pavements, diminishes rainwater absorption capacity, leading to increased surface runoff and peak flow during rainfall events [7,8,9]. This proliferation of impermeable surfaces also disrupts the natural hydrological cycle, causing alterations in water flow patterns within urban settings [10].
The surge in surface runoff and peak flows heightens vulnerability to urban flooding and inundation, especially in areas with inadequate drainage systems [11,12]. Additionally, urban growth can induce secondary effects on local weather patterns, influencing hydrological processes by shifting rainfall intensity and near-surface air temperature [13]. The decline in seepage results in an upsurge in surface runoff, as rainwater is impeded from infiltrating the soil and instead cascades over impermeable surfaces [14,15]. This presence of impermeable surfaces exacerbates runoff processes, while runoff from permeable areas remains uncertain due to the variable nature of infiltration [16]. Research consistently demonstrates that urbanization and the expansion of impermeable surfaces significantly impact hydrological processes, altering runoff characteristics such as heightened peak flows and increased flow volumes [17,18].
Urban runoff, stemming from precipitation reaching impermeable city surfaces that impede soil absorption, triggers several critical issues including flooding, erosion, pollution, and a decline in overall quality of life [19,20,21,22]. Managing urban flow within watersheds is crucial to safeguard water resources, preserve ecosystems, mitigate flood risks, and ensure the urban sustainability, necessitating an integrated approach encompassing land use planning, stormwater management, and natural hydrological process preservation [23,24]. Watersheds play a pivotal role in water resource management. Comprehending runoff processes, including the interplay between primary channels and tributaries and water storage quantification, is essential for effective watershed management [25,26]. This understanding is important in the planning, management, and sustainable development of water resources, especially considering the variations in watershed hydrological responses due to climate change [27,28]. Therefore, studying LULC changes and their impact on soil erosion and runoff at the watershed level is indispensable for effective urban water resource planning and management [29,30,31].
In the global context, where climate change is exacerbating water-related challenges, the use of technologies such as remote sensing and geographic information systems (GIS) plays a critical role in adapting to and mitigating extreme events [32,33,34,35]. Remote sensing provides detailed insights into key hydrological variables like rainfall, evapotranspiration, and wetland extent [36,37]. GIS complements this by integrating and analyzing such data with other geospatial information such as topography, geology, and LULC, offering a comprehensive view of hydrological systems [38].
The integration of these technologies has led to significant progress in water management. Remote sensing data aids in flood monitoring and prediction, identification of aquifer recharge zones, and development of sustainable water management strategies [39,40]. Furthermore, GIS facilitates information exchange among government institutions, water resource management organizations, and researchers, fostering effective collaboration in addressing water-related crises [41].
Managing and analyzing risk and performing mitigation studies for urban flooding heavily rely on software tools [42,43]. These tools, equipped with advanced functionalities, assist in identifying and evaluating flood-related risks in urban environments [44,45]. They aid managers and researchers in comprehensively understanding urban flood risks, facilitating well-informed decision-making for effective risk management, including prioritizing intervention areas and assessing mitigation strategies [46]. Various approaches currently exist for assessing and mitigating flood risks in urban areas. Some methods, like the Genetic Algorithm Rule-Set Production (GARP) and Quick Unbiased Efficient Statistical Tree (QUEST) models utilizing machine learning techniques, effectively identify areas with a higher probability of flooding [47]. Additionally, numerical techniques, such as Long Short-Term Memory (LSTM) neural networks and numerical model integration, expedite the prediction of flood-related risks in urban settings [44].
The InVEST (Integrated Valuation of Ecosystem Services and Tradeoffs) models represent an initiative spearheaded by the Natural Capital Project at Stanford University. Among these models, the InVEST Urban Flood Risk Mitigation (UFRM) tool has been utilized in various hydrological investigations to assess flood mitigation measures. For instance, research in Hyderabad, India [48], and Bose and Mazumdar [42] have highlighted the model’s effectiveness in identifying areas prone to elevated flood risk and evaluating mitigation measures. The Urban Flood Risk Mitigation model uses GIS and aligns with the Soil Conservation Service’s curve number method (SCS-CN). This method estimates surface runoff volumes resulting from specific rainfall events within an area by considering factors like cumulative precipitation, LULC, and antecedent moisture [49,50,51]. Its success lies in its simplicity, reliance on well-documented environmental data, and the incorporation of various runoff-generating factors into a single parameter, the curve number (CN).
Lately, the SCS-CN methodology, coupled with GIS, has gained attention in research by investigating the impact of LULC changes and urban development on surface runoff [52,53,54,55]. Therefore, the combination of GIS and remote sensing with the SCS-CN model offers a more efficient and cost-effective approach, providing satisfactory results in assessing the consequences of LULC alterations and urban expansion without the need for intricate data [55,56,57,58].
This study explores the changing patterns of LULC in Itaperuna city, located in the northwest of Rio de Janeiro (RJ), Brazil, scrutinizing its 2015 and 2020 LULC maps. Its discoveries contribute significantly to understanding the factors driving LULC changes at regional and national levels, affecting the risk of flooding in the area. The primary aims of this study encompass two aspects: firstly, investigating changes in land use and land cover, and secondly, assessing variations in surface runoff patterns while identifying crucial hydrological trends within the urban sub-basins of Itaperuna, located in the state of Rio de Janeiro, Brazil. The research initiated by gathering images from the Sino-Brazilian satellite CBERS-4 to evaluate LULC changes between 2015 and 2020. Following this, hydrological modeling, along with quantifying runoff, was executed utilizing the InVEST Urban Flood Risk Mitigation tool.

2. Materials and Methods
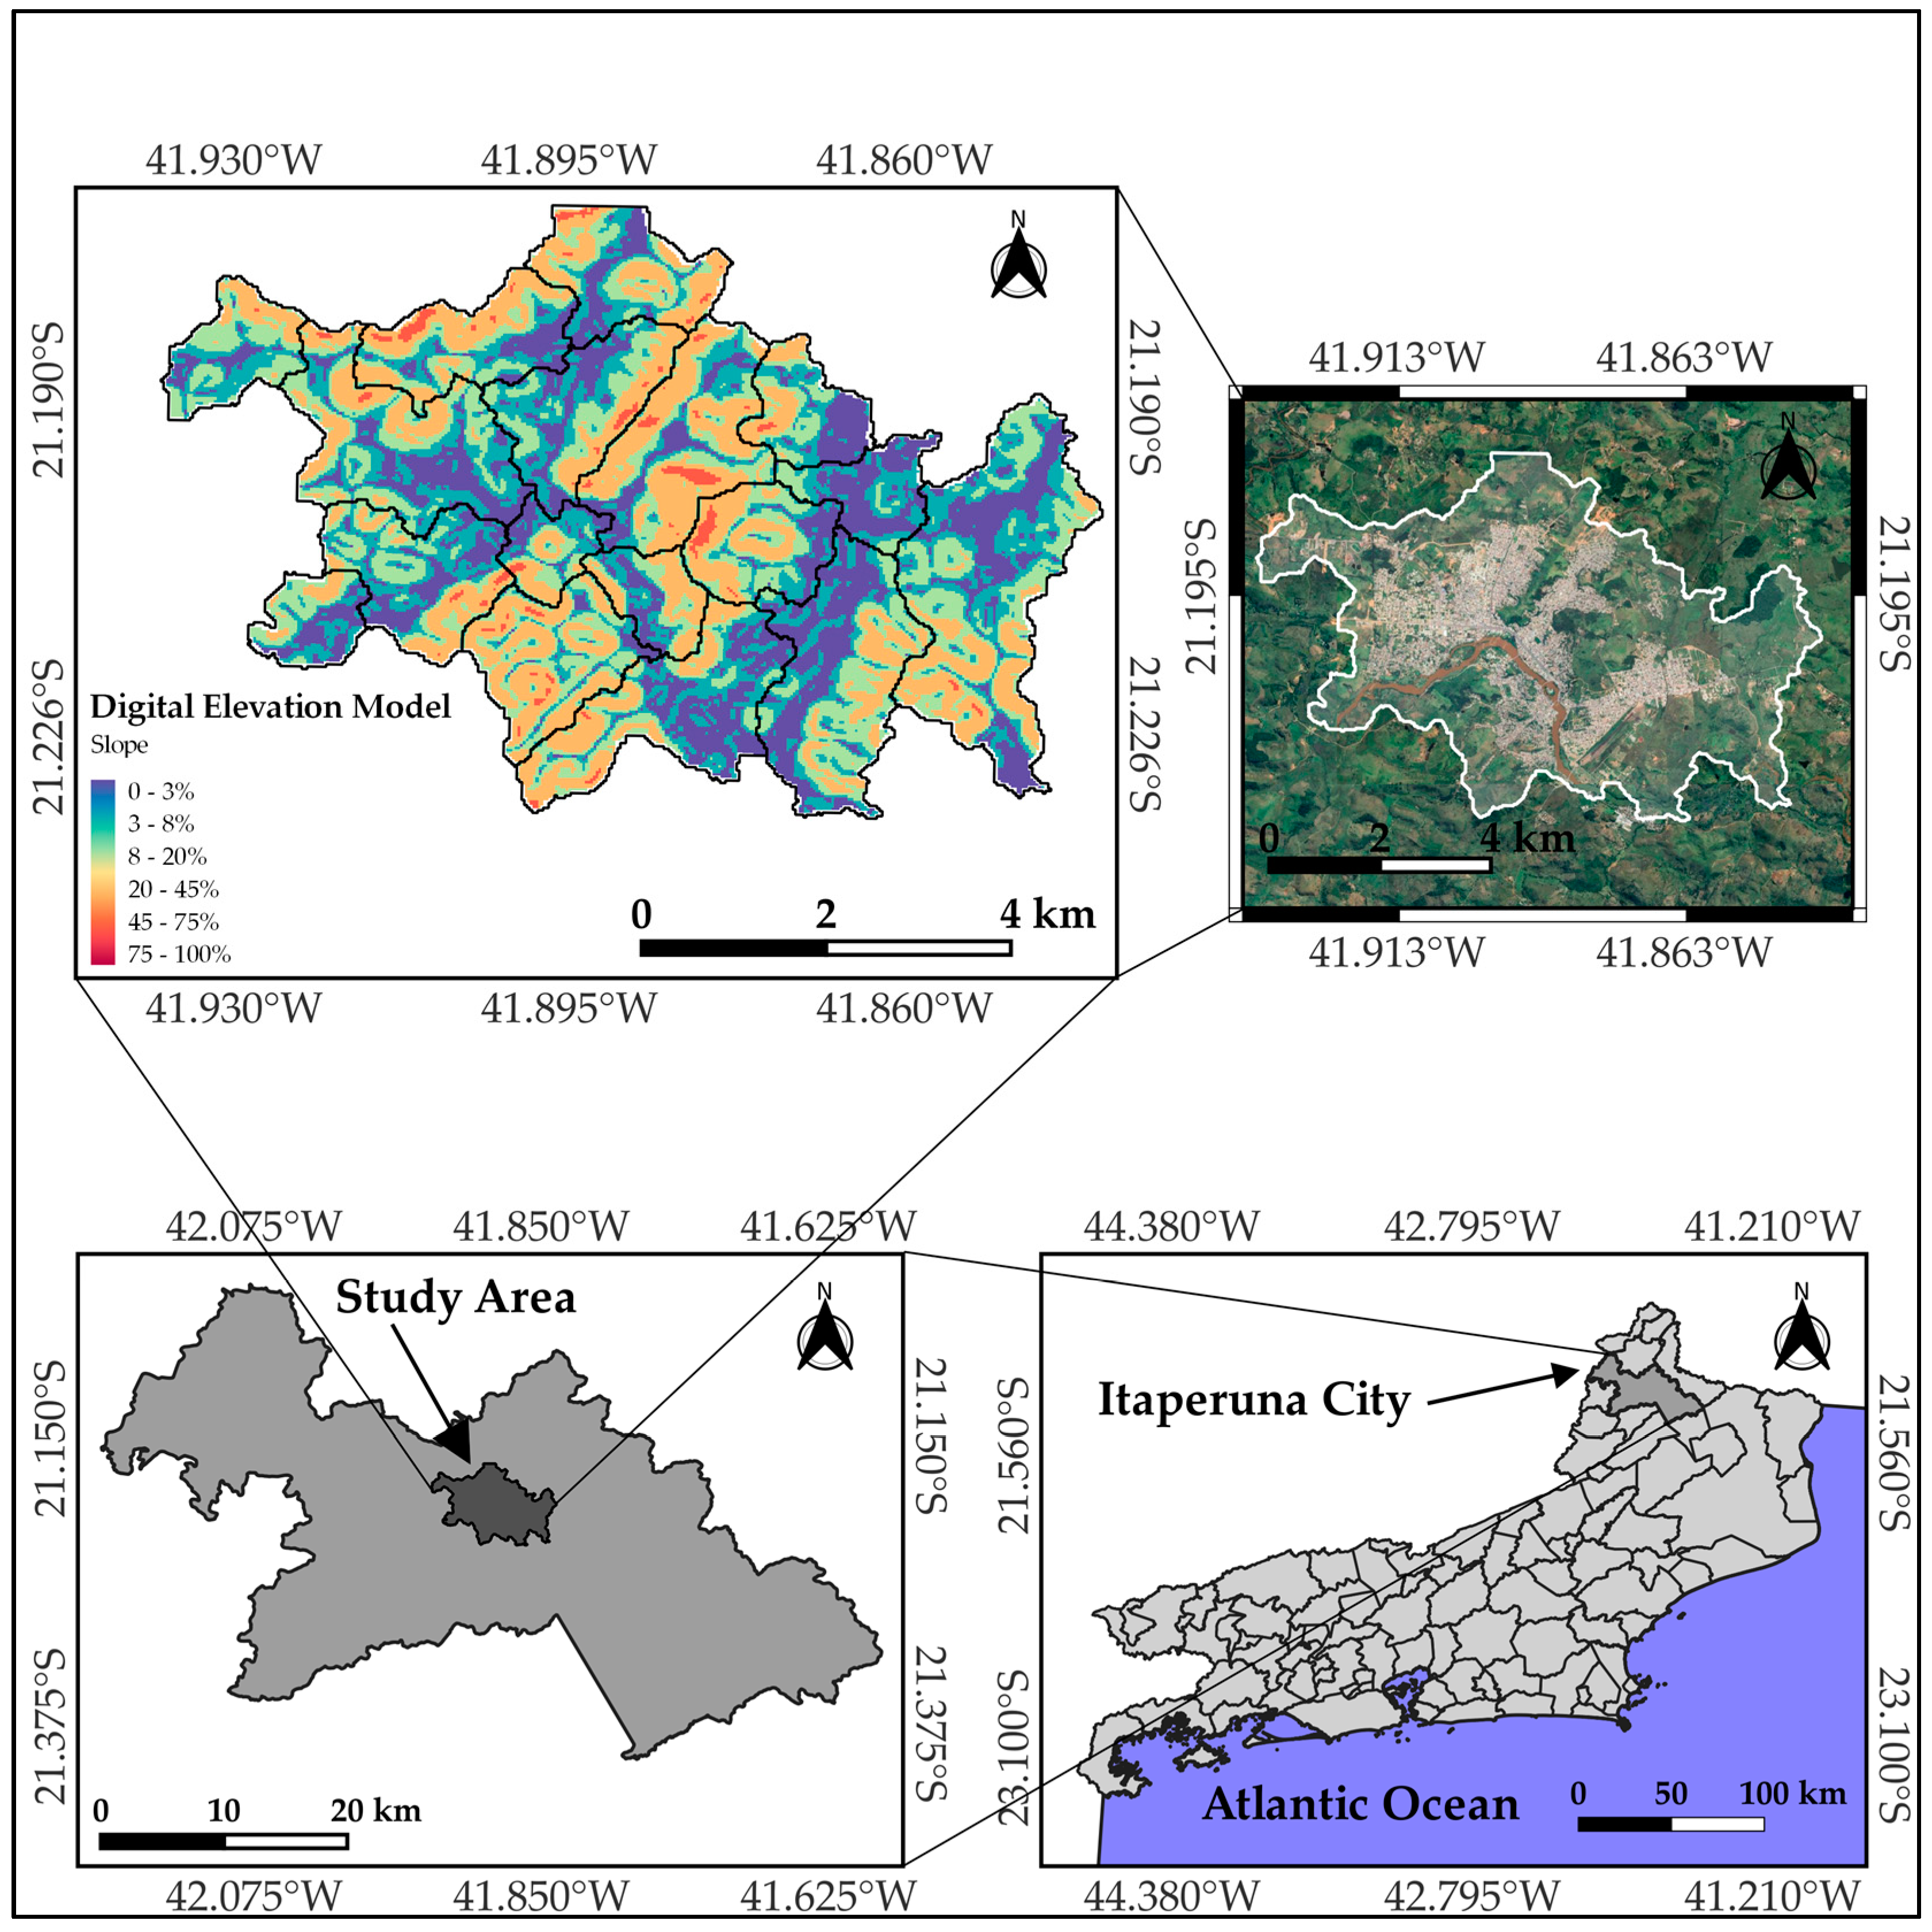
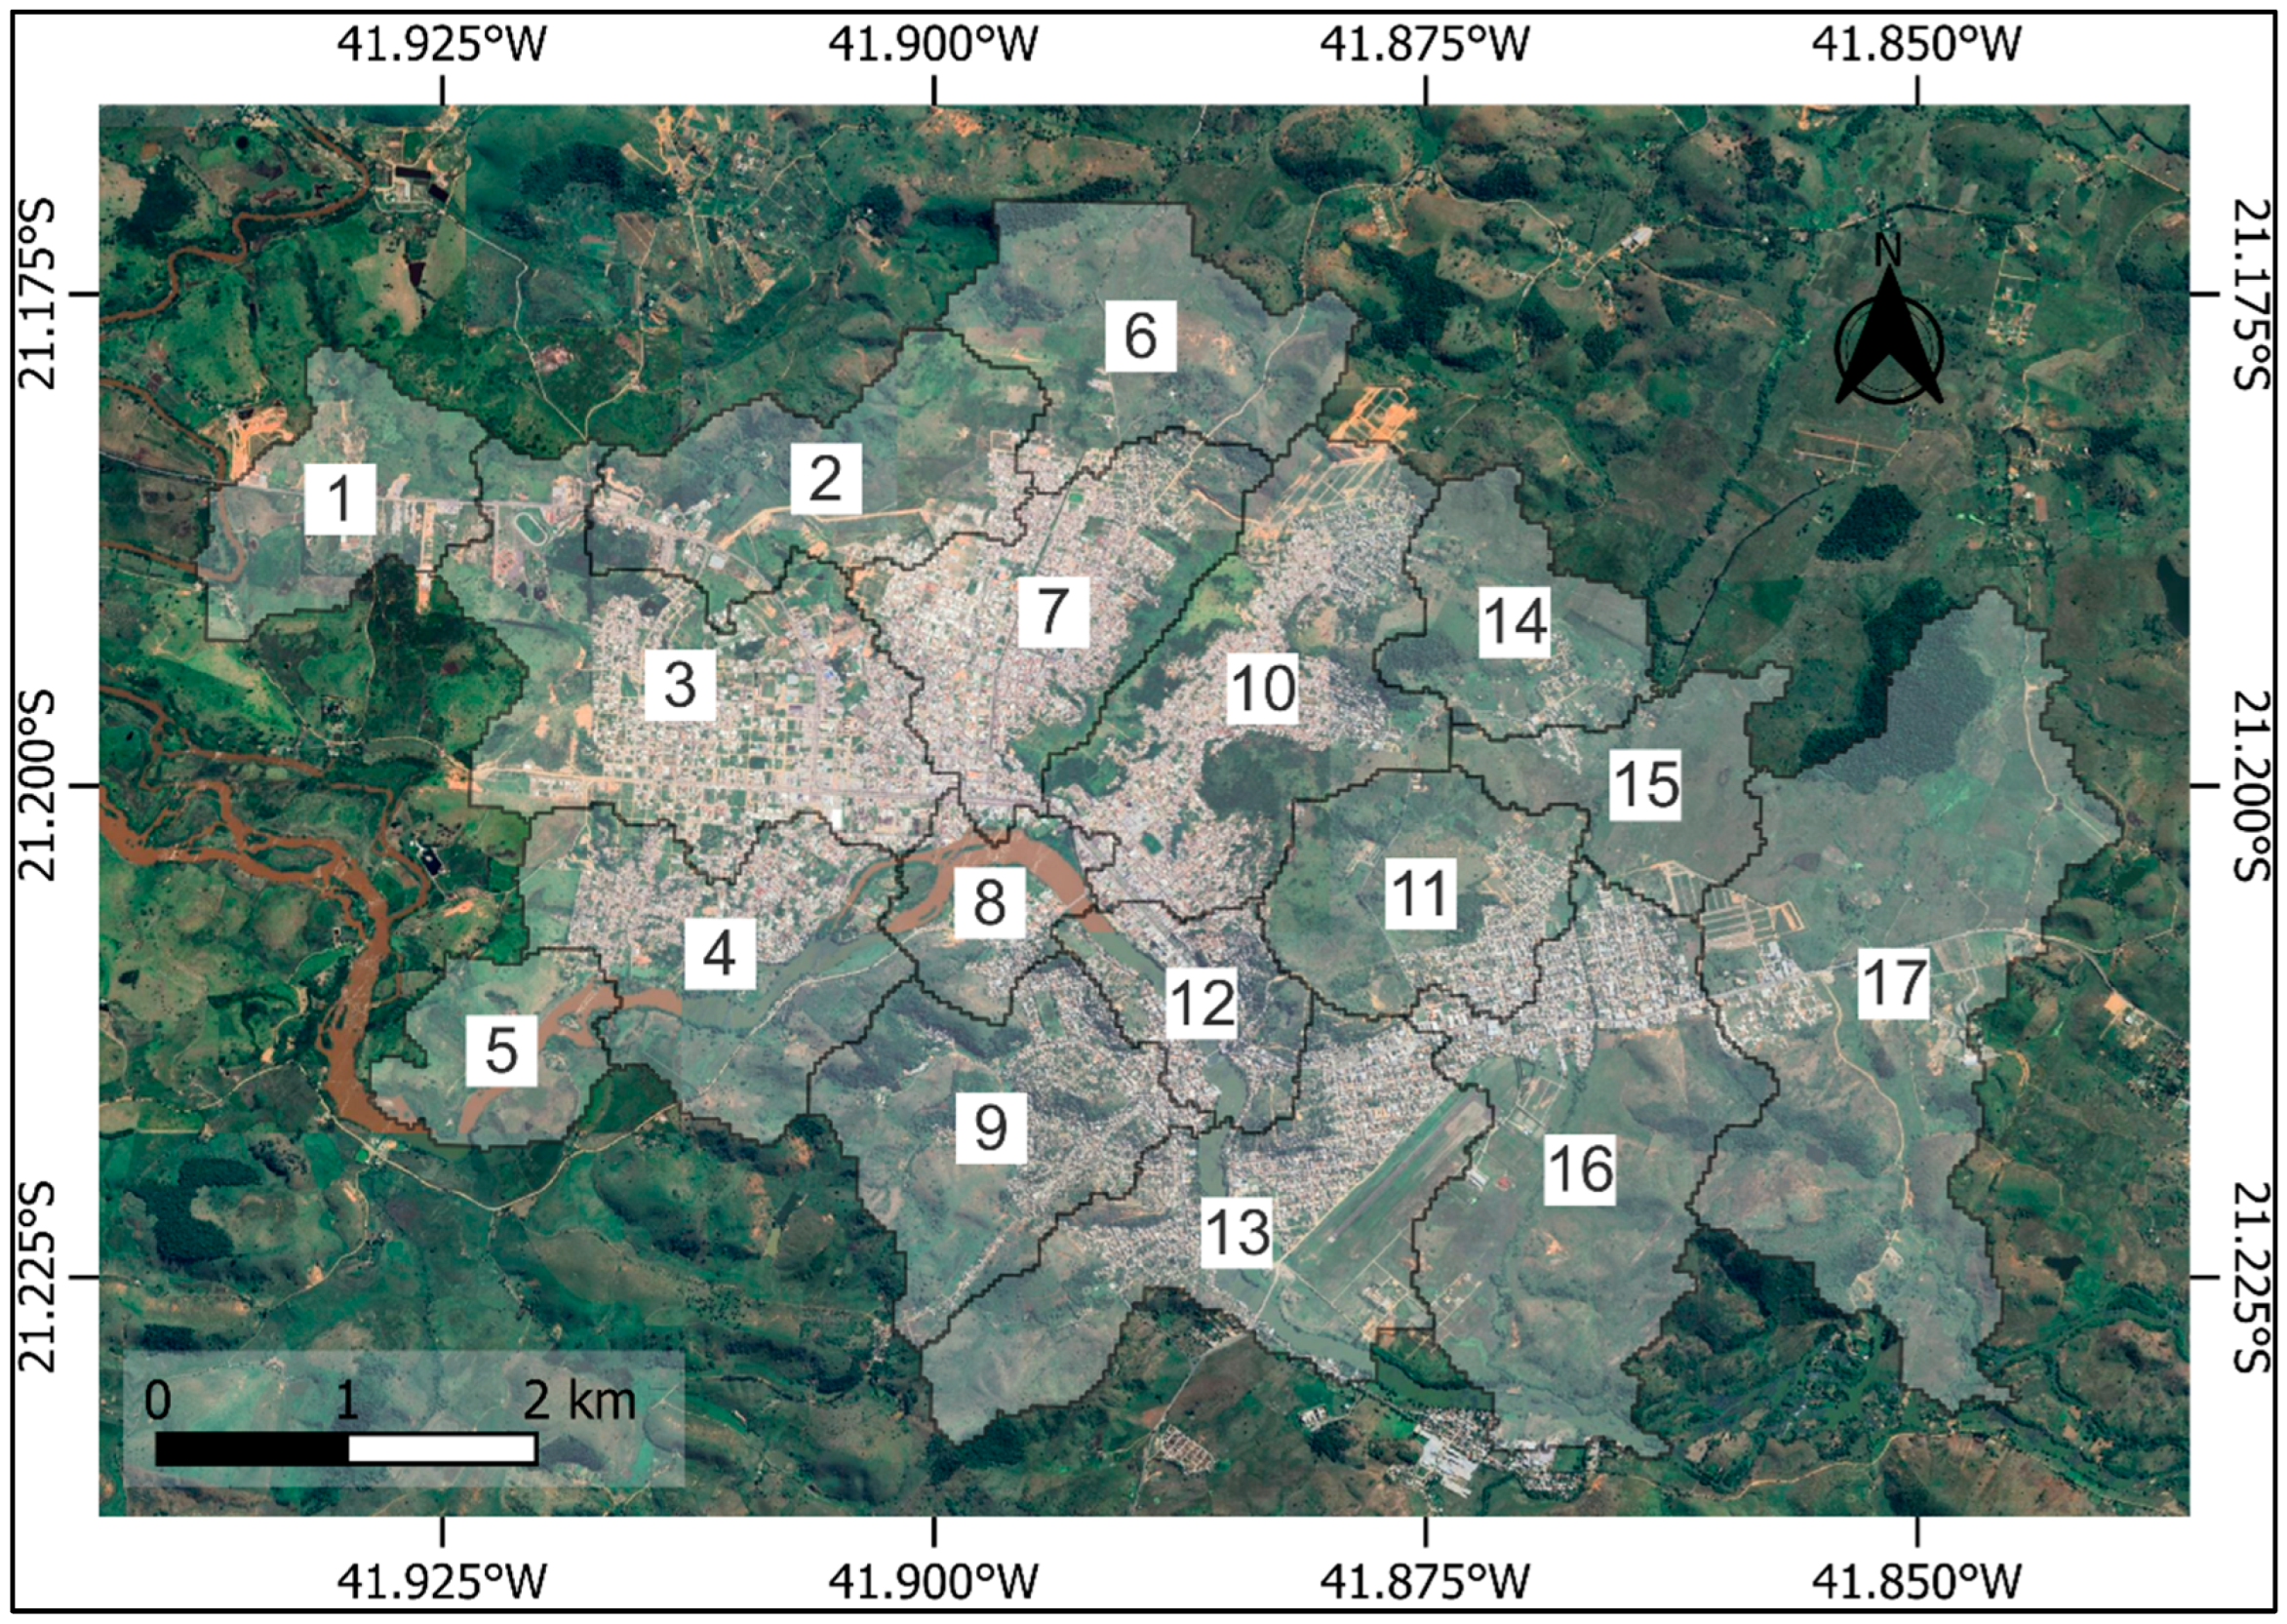
2.1. Study Area

The city of Itaperuna is located in the northwestern region of the state of Rio de Janeiro, sharing its borders with the state of Minas Gerais (Figure 1). Itaperuna stands as one of the largest urban centers in the region, covering a total area of 1106.694 km2. Approximately 27 km2 of this area is densely urbanized, accounting for about 2.39% of the total area. As of the most recent census conducted by the Brazilian Institute of Geography and Statistics (IBGE) in 2022 [59], the resident population of the city stands at 101,041 people. The study focused exclusively on urban areas, as defined by the IBGE criteria [60]. The delineation of these areas based on official IBGE data provided a clear and objective definition of urban geographical boundaries, ensuring a precise approach aligned with nationally recognized criteria.
The municipality of Itaperuna lies within the geographical context of the North-Northwest Fluminense, characterized by its extensive low-lying areas interspersed with staggered mountain ranges, boasting an average annual temperature of 23.61 °C. The highest and lowest temperature averages stand at 29.7 °C and 19.0 °C, respectively. February registers as the hottest month, reaching a maximum average temperature of 33.1 °C. The prevailing climate in the area is classified as Aw (tropical dry, by Köppen–Geiger), experiencing an average annual rainfall ranging from 1100 to 1200 mm. It exhibits two markedly contrasting seasons: a wet summer-spring period, with December recording the highest rainfall, and a dry autumn-winter phase, where August stands out as the driest month [61,62].
Hydrographically, the Itaperuna territory is situated within the Muriaé River basin, covering an expansive area of 8126 km2. The Muriaé River and the Carangola River serve as the primary tributaries within this basin [63]. Historically, the Muriaé River basin has been subjected to substantial deforestation since the 19th century, chiefly due to the proliferation of coffee plantations. This deforestation practice, coupled with the suboptimal occupation of areas near the river, has had adverse repercussions for the communities residing in municipalities within the watershed [64], leading to adverse effects on its sustainable development, akin to those in numerous other Brazilian municipalities [65].
In the latter decades of the 19th century, Itaperuna rose to national prominence due to its substantial coffee production. This agricultural progress concentrated commercial activities, elevating the city into a subregional hub within the state. However, starting from the 1930s, the coffee industry experienced a decline, transitioning to beef cattle farming and later evolving into dairy production, both becoming the predominant economic pursuits [66]. Throughout its history, the municipality of Itaperuna has experienced a recurring and detrimental pattern of flood events. Dating back to its establishment, Itaperuna endured significant floods in the years 1925, 1943 (twice), 1961, 1979, 1985, 2008, 2010, 2012, and notably, the most severe in terms of both flooded area and socioeconomic losses in 2020 [67,68]. An analysis conducted by Campos and Paz [68] revealed an escalating frequency of flood events, transitioning from a once-in-a-century occurrence to a biennial phenomenon.
The recurrent inundations in the municipality of Itaperuna demand immediate attention, as they significantly impact the north/northwest region of the State of Rio de Janeiro. A particular area of concern is the BR 356 highway, which traverses the city center, facilitating regional trade between the capital of the state of Minas Gerais, Belo Horizonte, and Campos dos Goytacazes in the state of Rio de Janeiro. Furthermore, the São José do Avaí Hospital, a highly esteemed healthcare facility in the region, frequently faces flooding, intensifying the challenges posed by these recurring floods.

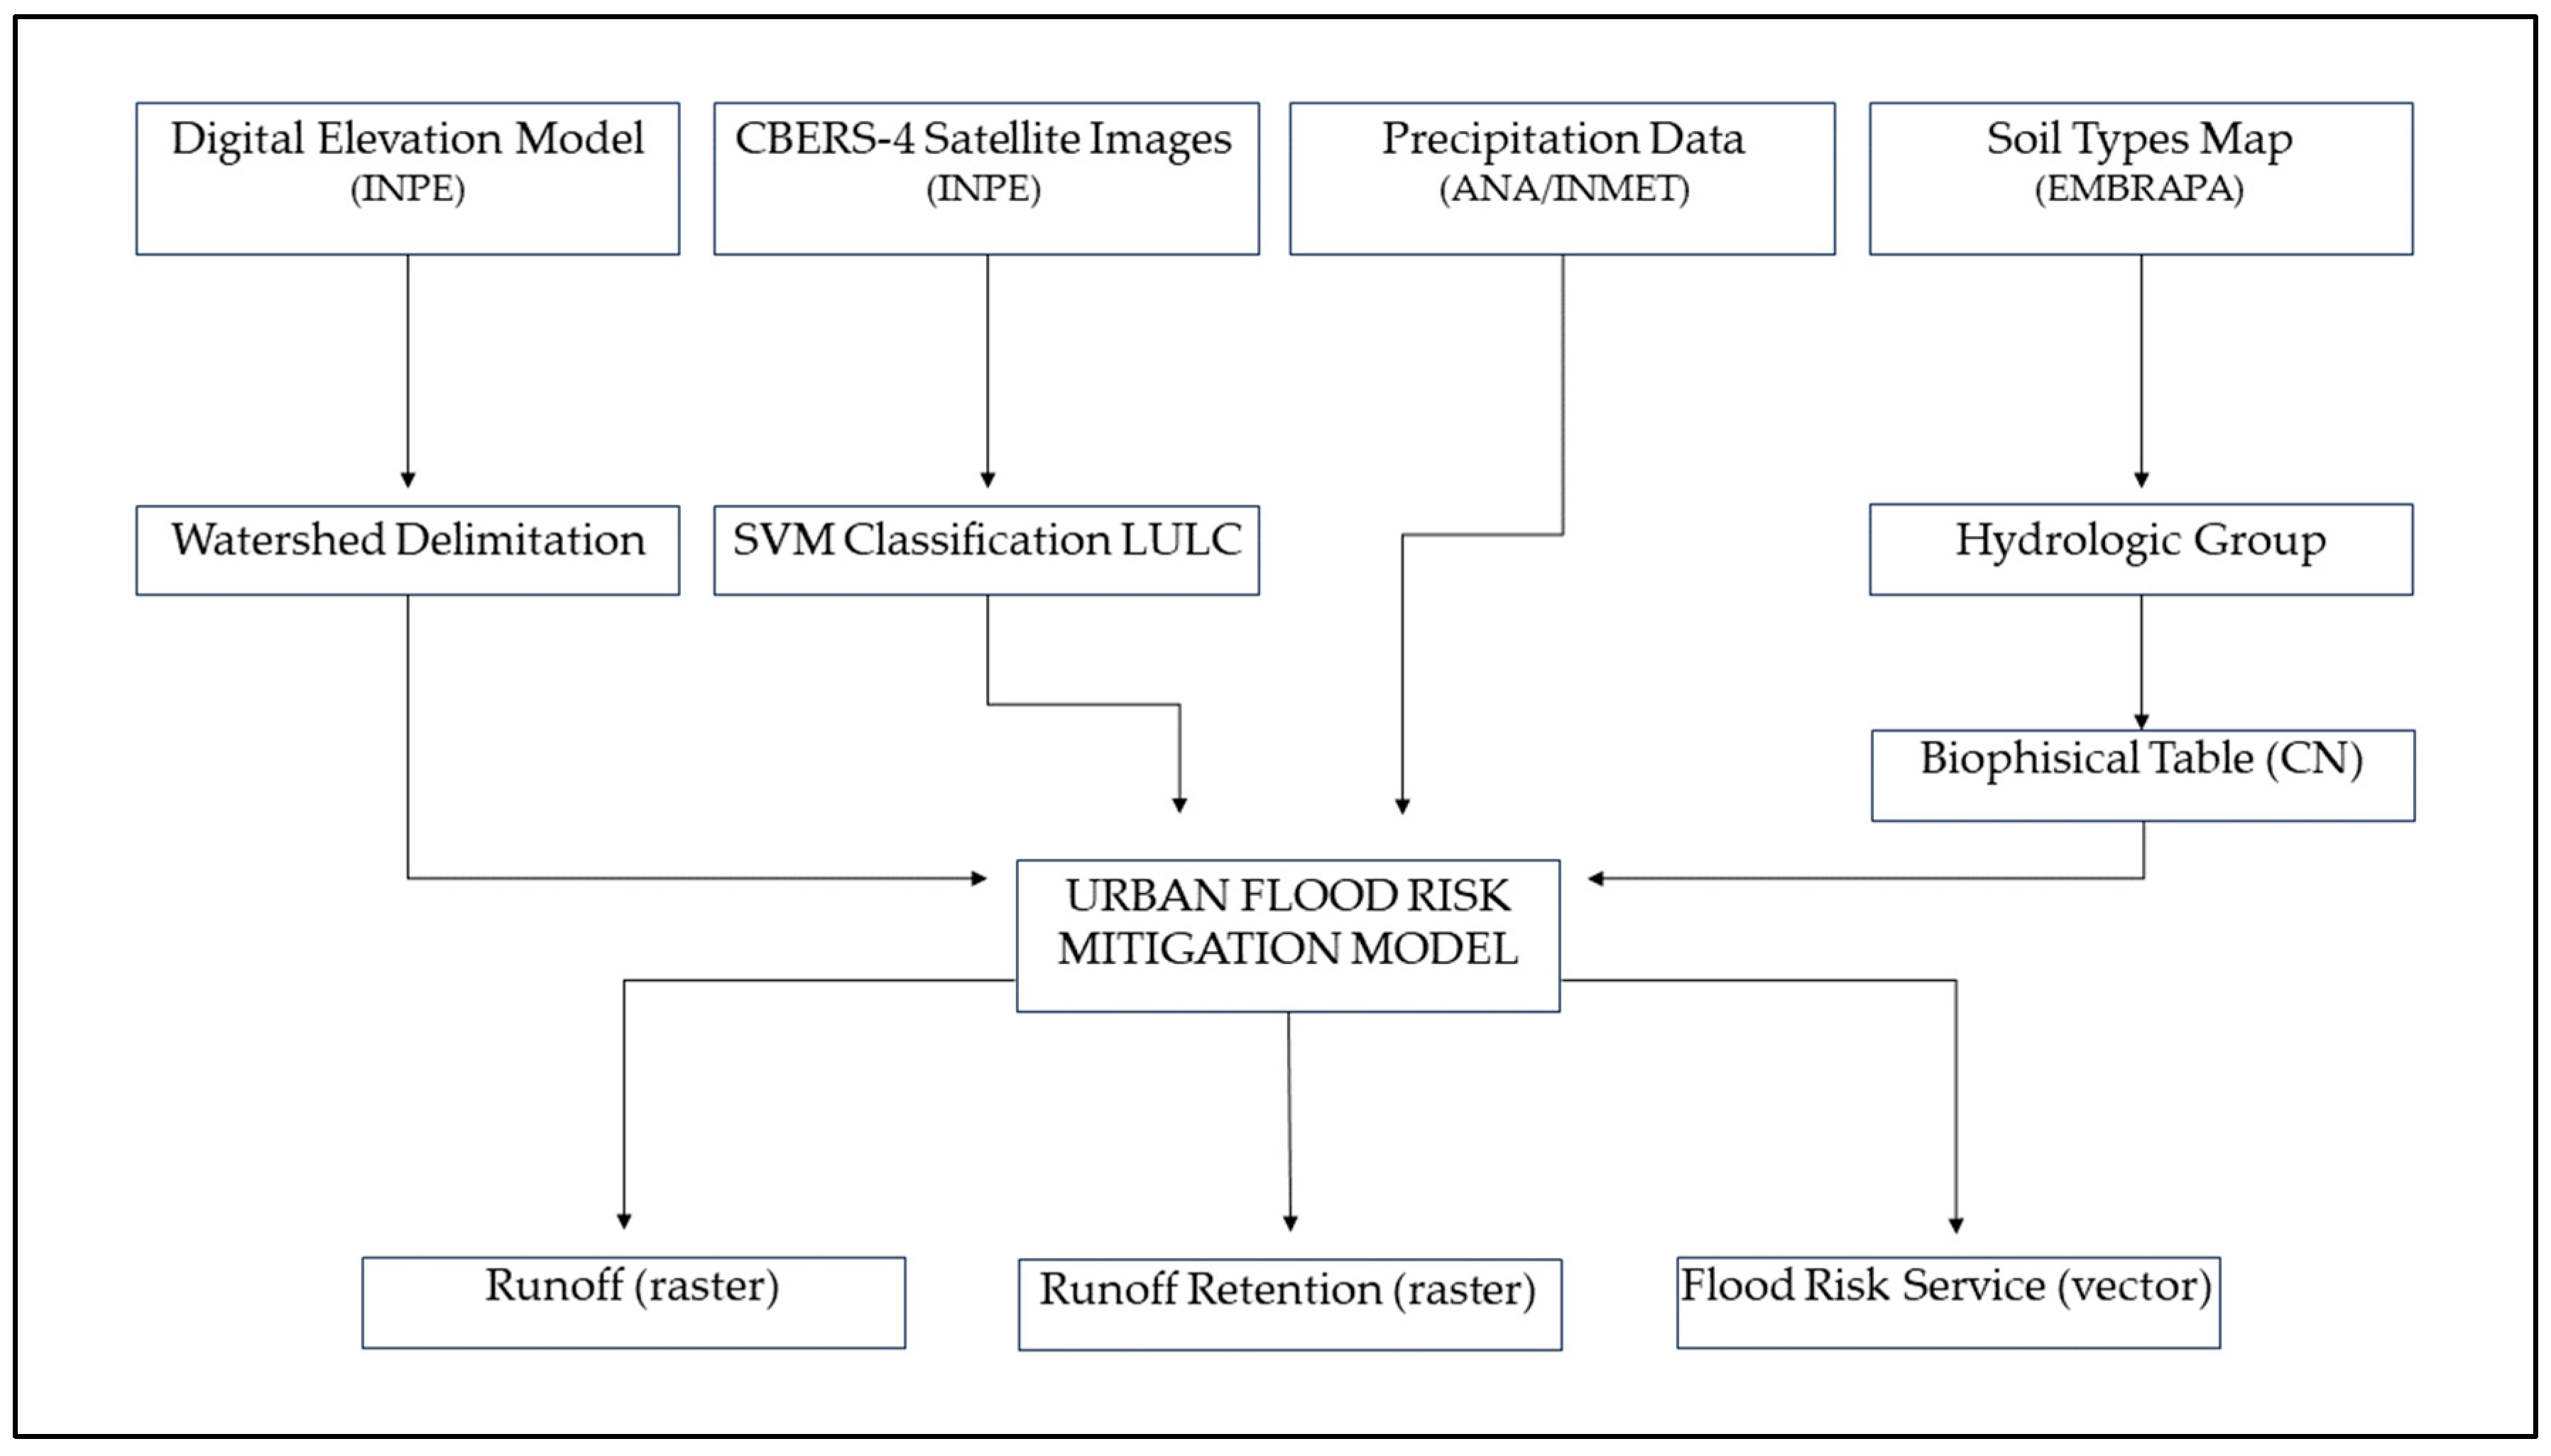
2.2. Data Sources and Methodology

2.2.1. Land Use and Land Cover (LULC) Maps

To generate the land use and land cover maps, CBERS4 satellite images from 2015 and 2020 were employed. The selection of these specific years was intentional, aiming to capture significant urban changes within a relatively concise time frame. By concentrating on these two years, the objective was to highlight notable urban transformations relevant to the scope of the investigation. Additionally, building upon the methodological framework established in a prior study [29] that examined carbon storage and sequestration processes in Itaperuna during the same timeframe, this temporal focus enhances precision in identifying conspicuous alterations, such as urban expansion, emerging infrastructure, and substantial shifts in land use patterns. Consequently, the methodology adopted represents a systematically rigorous approach to scrutinizing the progression of urbanization, complementing the earlier research conducted by Felix et al. [29].
The CBERS4 satellite images were captured by the Regular Multispectral Camera (MUX), operating within the red, green, blue (RGB) and near-infrared (NIR) color spectrums. The spatial resolution of these images stands at 20 m [69]. Following this, the images underwent processing using the open-source QGIS software (QuantumGIS 3.22.8) [70]. Initially, the images were reprojected to the Official Datum of the Brazilian Geodetic System (SIRGAS 2000), Universal Transverse Mercator (UTM) 24S coordinates. Subsequently, a new vector layer was created to delineate the study area, specifically the urban zone. The next step involved extracting the raster data from the vector layer, marking the initiation of the classification process.
The training phase initiated with the computation of image statistics, which were subsequently utilized by the classification algorithm to identify the distinguishing features of each land use and land cover class. The adoption of a satellite grid with a 20-m resolution facilitated the identification of the spatial variability of six distinct LULC classes in the region. Thereafter, a machine learning algorithm, specifically support vector machine (SVM), was applied to the trained dataset, using samples classified according to the various LULC categories. In total, 396 distinct samples were selected, distributed across the six LULC classes chosen to be used in this study: water bodies; urban area; exposed soil; forest; natural pasture; and grassland vegetation. Ultimately, the images were classified by deploying the trained classifier. The classification process entailed analyzing the entire image pixel by pixel, leveraging the knowledge acquired during the previous stages of training and classification.

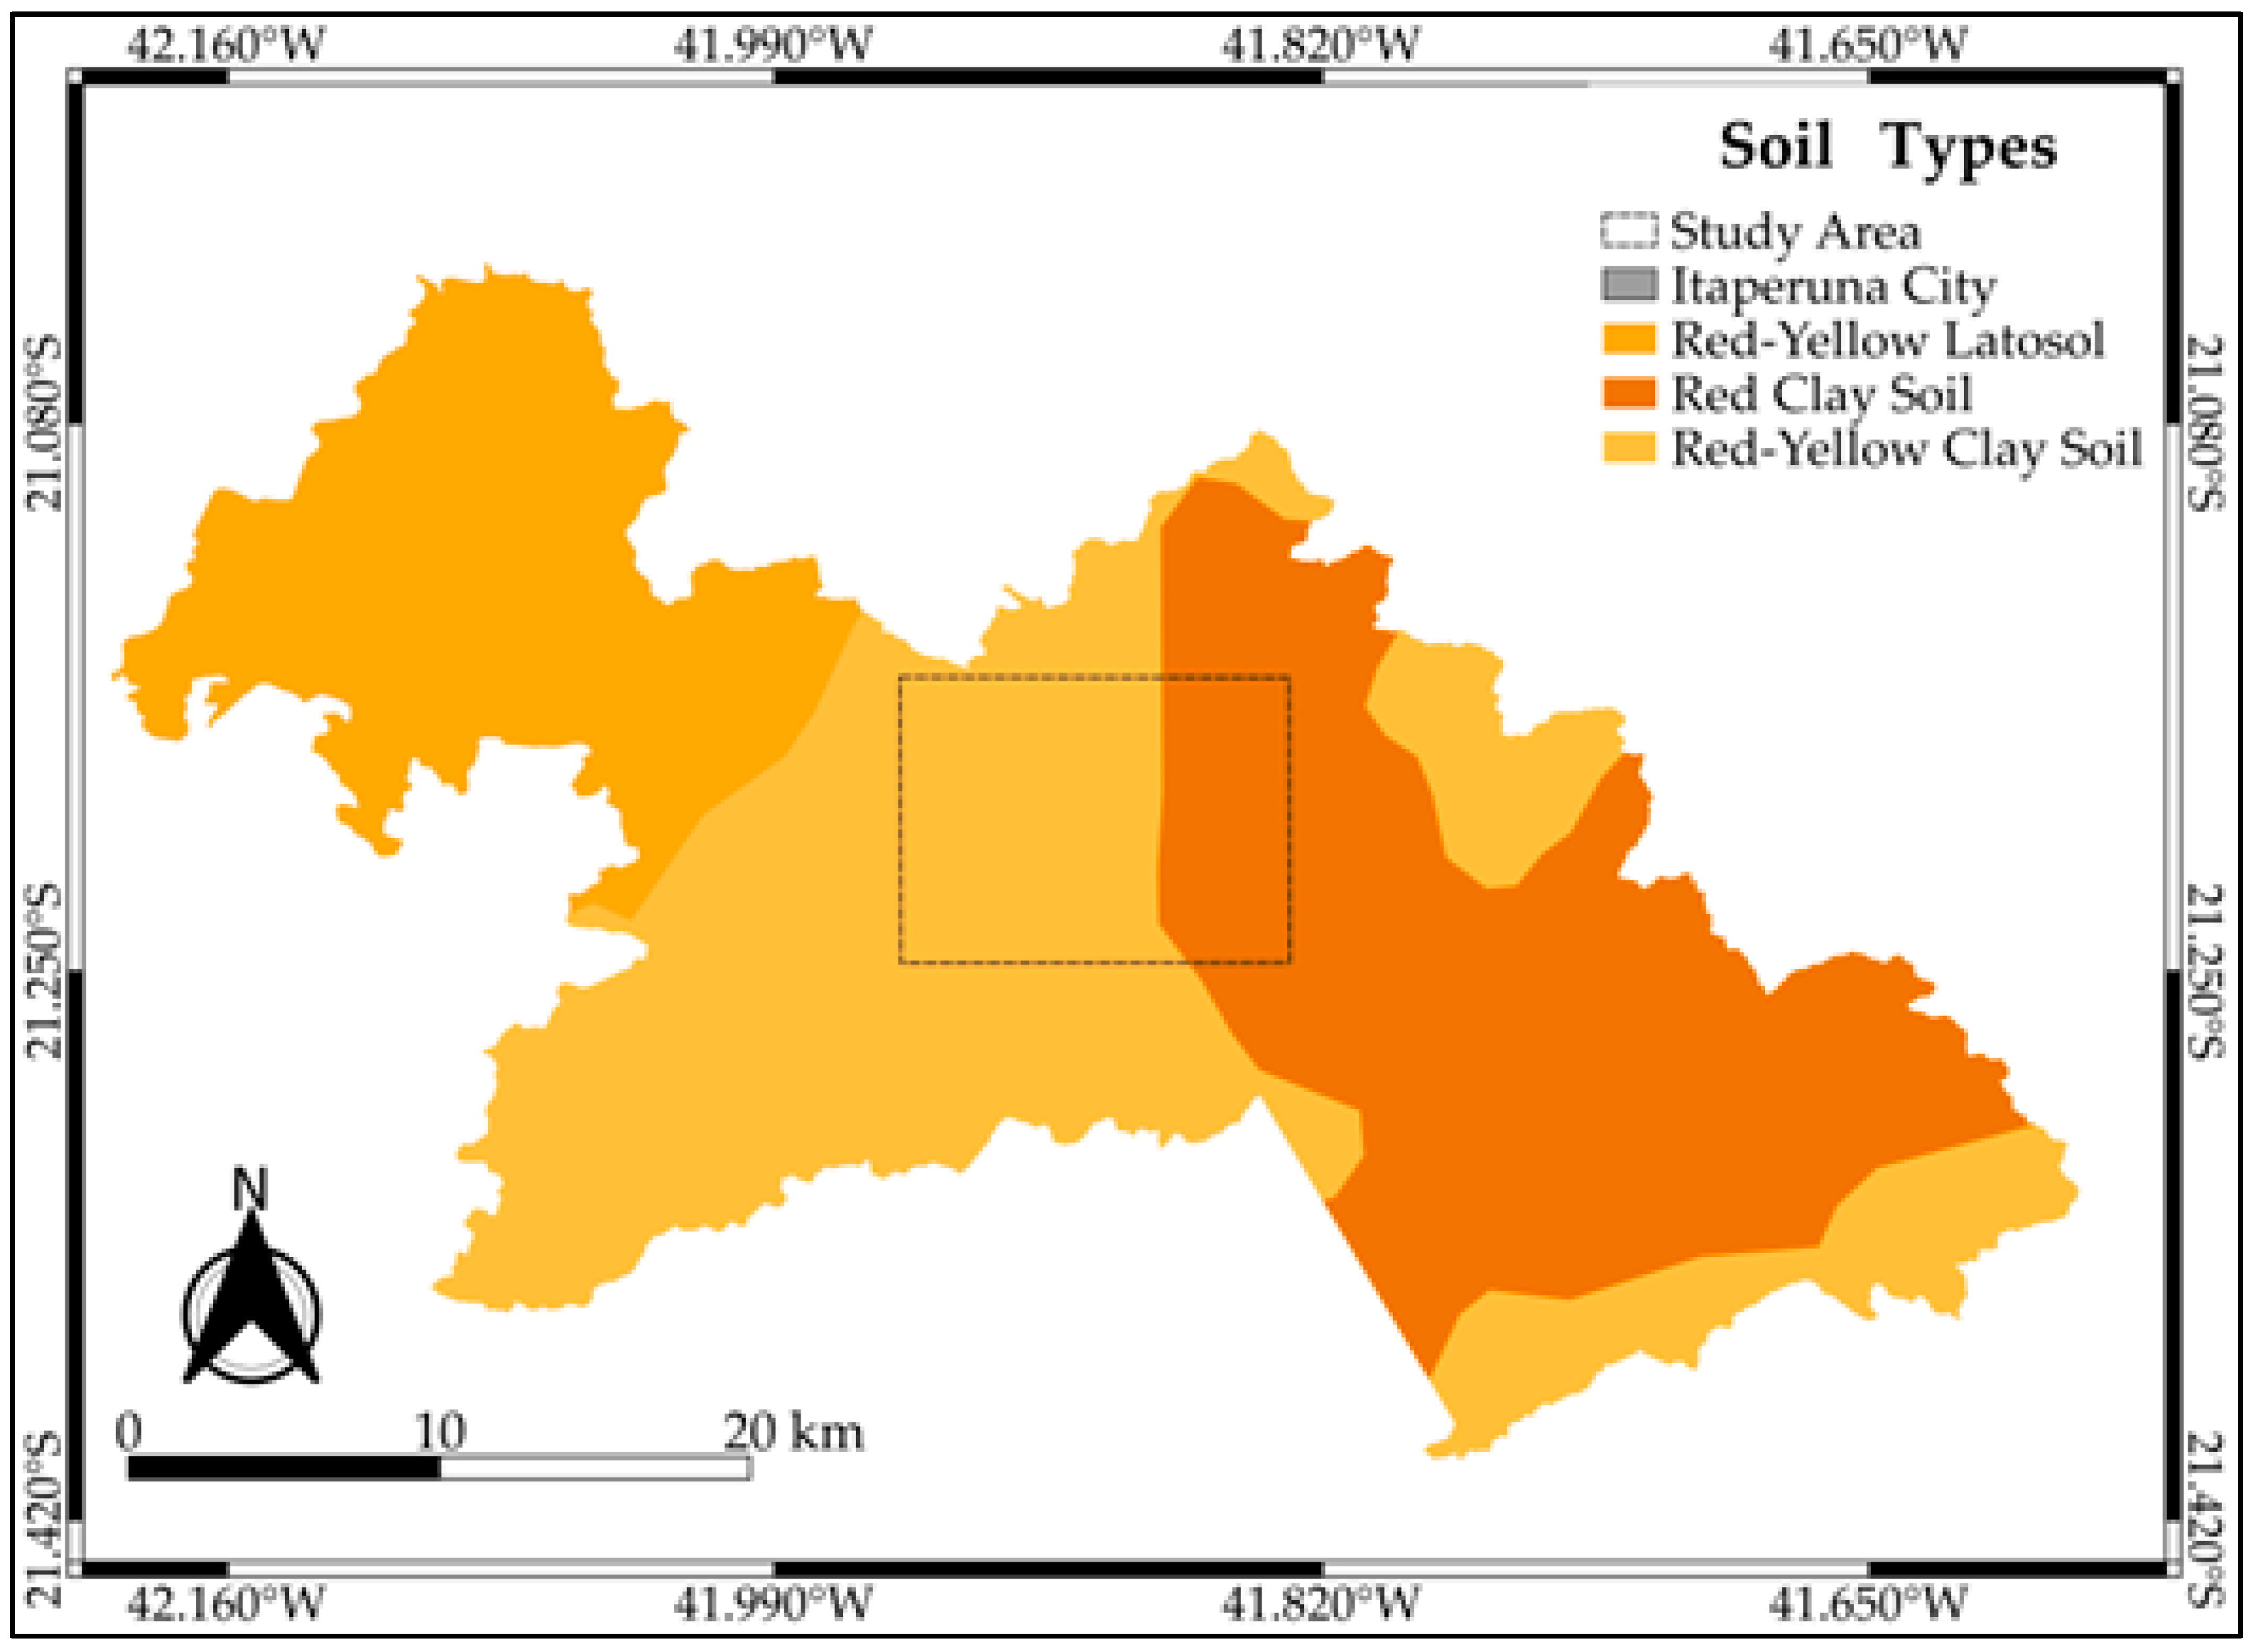
2.2.2. Soil Types and Hydrological Classification

The pedological map of the state of Rio de Janeiro was obtained from the EMBRAPA (Brazilian Agricultural Research Corporation) catalog [68]. The study area’s vegetation is characterized as seasonal semideciduous forest (subdeciduous tropical forest) with an alluvial nature, encompassing secondary vegetation and agricultural practices [71]. Across the entire expanse of the municipality of Itaperuna, three soil types were identified. However, within the study area, only two types were observed, specifically the red-yellow argisol and red argisol (Figure 2).
The hydrological classification of Brazilian soils, as proposed by [72], categorizes soils into four groups (A, B, C, and D) based on their erosion resistance. Group A comprises highly erosion-resistant soils, while groups B, C, and D encompass soils with moderate, low, and very low levels of erosion resistance, respectively. According to Technical Note 46/2018/SPR issued by the ANA (National Water Agency) [73], both red-yellow argisol and red argisol are hydrologically classified as members of Group C.

2.2.3. Precipitation Data and Digital Elevation Model

Precipitation data were obtained from both the ANA (National Water Agency) [74] and the INMET (National Institute of Meteorology) [75]. The precipitation data utilized in the modeling correspond to the lengthiest period of precipitation accumulation in the historical series for Itaperuna. Specifically, these data pertain to the month of January in the year 2020. The cumulative rainfall within a 24-h timeframe reached 128.4 mm. This value served as the basis for conducting hydrological modeling.
The digital elevation model (DEM) (see Figure 1) was obtained through the TOPODATA platform, a geomorphometric database of Brazil provided by the National Institute for Space Research (INPE) [76]. The TOPODATA project offers access to DEM and its local variations across the country, derived from SRTM data made available by USGS on the internet. Initially, the MDE layer was adjusted to the SIRGAS 2000 UTM-24S coordinates. The sub-basin delineation process was executed using the GRASS toolbox within QGIS 3.22.8. This yielded a vector layer containing the sub-basin delineations obtained through an algorithm that identifies the drainage network leading to a single point on the surface. To establish these delineations, a minimum value of 2000 cells was set, meaning that the algorithm would only recognize sub-basins with at least 2000 cells. Consequently, sub-basins with cell values below 2000 were amalgamated to fulfill the delineation criteria. This process revealed the presence of 17 sub-basins within the densely populated area of Itaperuna (Figure 3).

2.3. Urban Flood Risk Mitigation InVEST

The InVEST model comprises a collection of models designed for the mapping and valuation of nature’s resources. Most of these models are spatially explicit, utilizing maps as their primary data source and generating results that can be transformed into maps for visualizing and comprehending the process dynamics. One of these models, the Urban Flood Risk Mitigation (UFRM) tool, calculates the amount of runoff retained per pixel in relation to a precipitation event. This tool relies on the curve number method, originally developed by the United States Natural Resources Conservation Service (NRCS), as its foundational calculation basis. Runoff is estimated for each pixel by applying the curve number method (Soil Conservation Service) to the rainfall amount. The equation used for this estimation is defined as follows:
Q p , i = P S m a x , i 2 P + 1 λ S m a x , i   ,   if   P > λ · S m a x , i ,
where Q p , i represents the runoff per pixel in response to precipitation (m3); P denotes the precipitation amount (mm); S m a x , i stands for the potential retention (mm); and λ · S m a x , i corresponds to the rainfall threshold necessary to initiate runoff (mm) with λ = 0.2 .
The potential retention is determined based on the SCS curve number (CN), and is expressed as:
S m a x , i = 25400 C N i 254
The model also calculates the runoff retention per pixel R i as follows:
R i = 1 Q p , i P
The runoff retention volume per pixel R _ m 3 i is obtained as:
R _ m 3 i = R i · P · p i x e l _ a r e a · 10 3
where p i x e l _ a r e a is the pixel area in m2.
Subsequently, the runoff volume per pixel is obtained using the model for calculating the total runoff volume using the following equation:
Q m 3 i = Q p , i · p i x e l _ a r e a · 10 3
For the modeling, UFRM utilizes the following input data (Figure 4): a vector representing the area of interest with basin subdivisions, a biophysical table containing curve number values for the four soil hydrological groups, a raster depicting LULC, a raster representing the soil’s hydrological group, and precipitation height data.
The curve number (CN) values linked to the hydrological classification of each soil type were derived from Table 1 (adapted from Tucci [77]).

3. Results

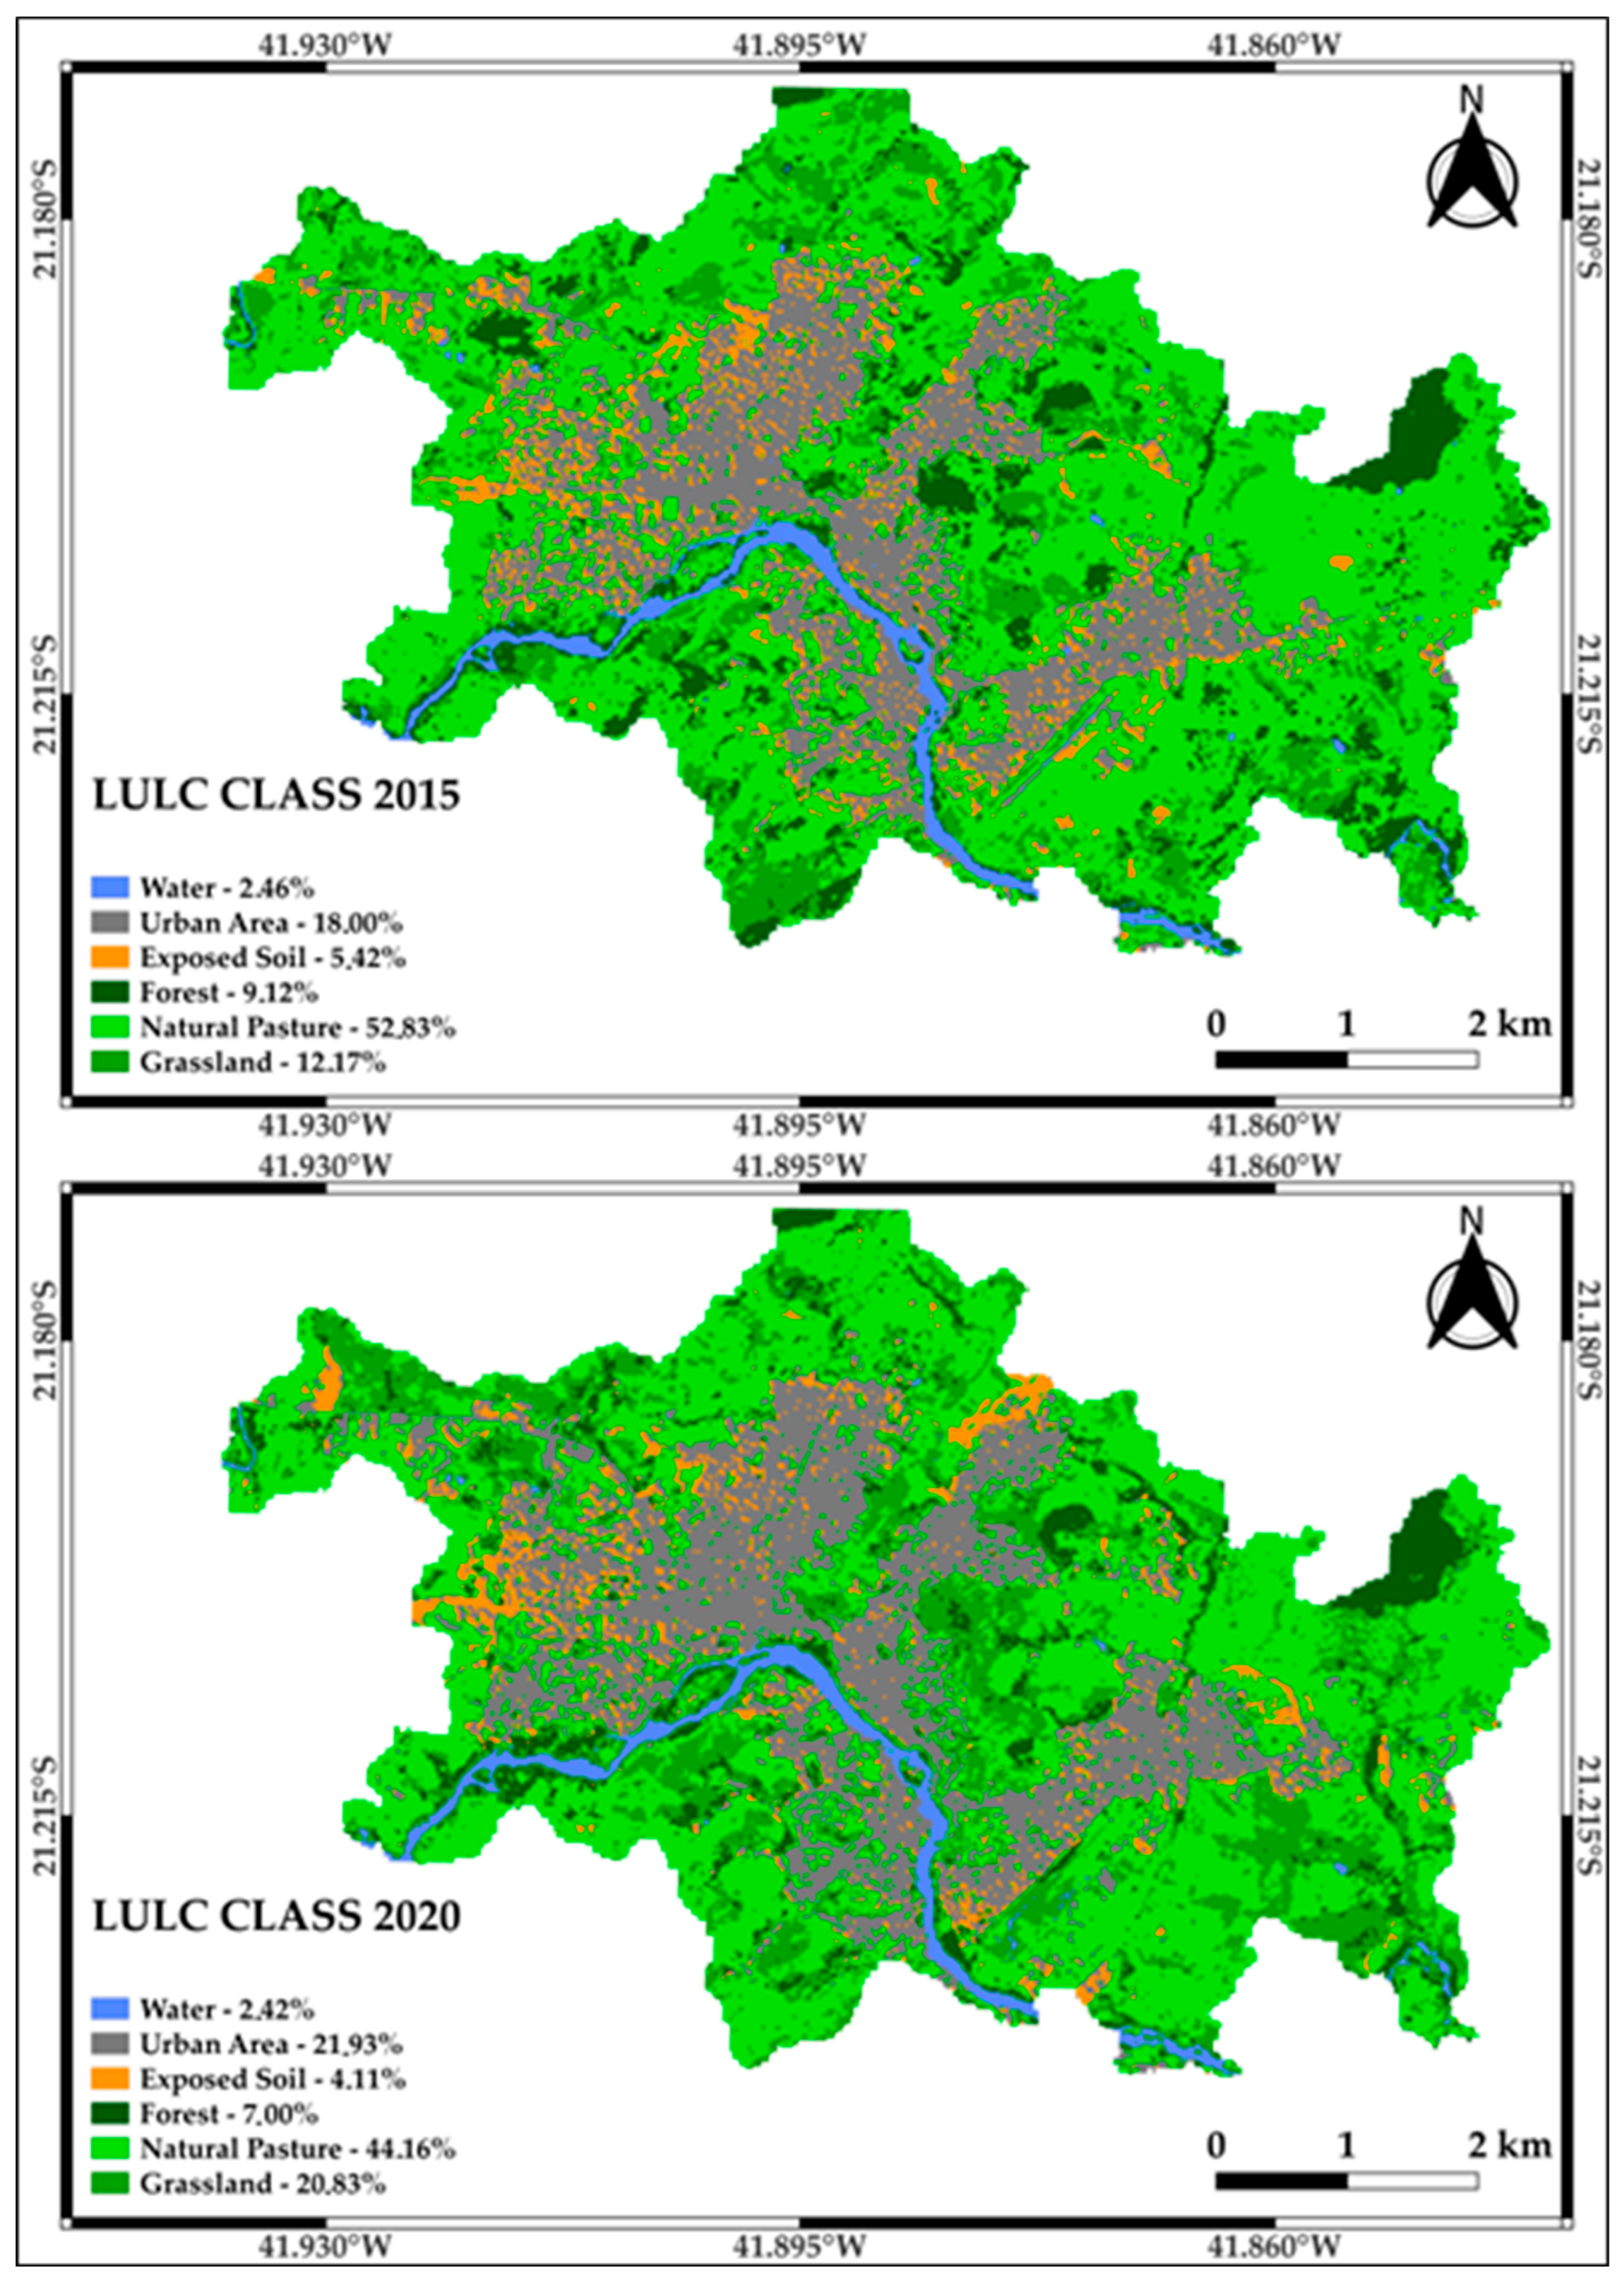
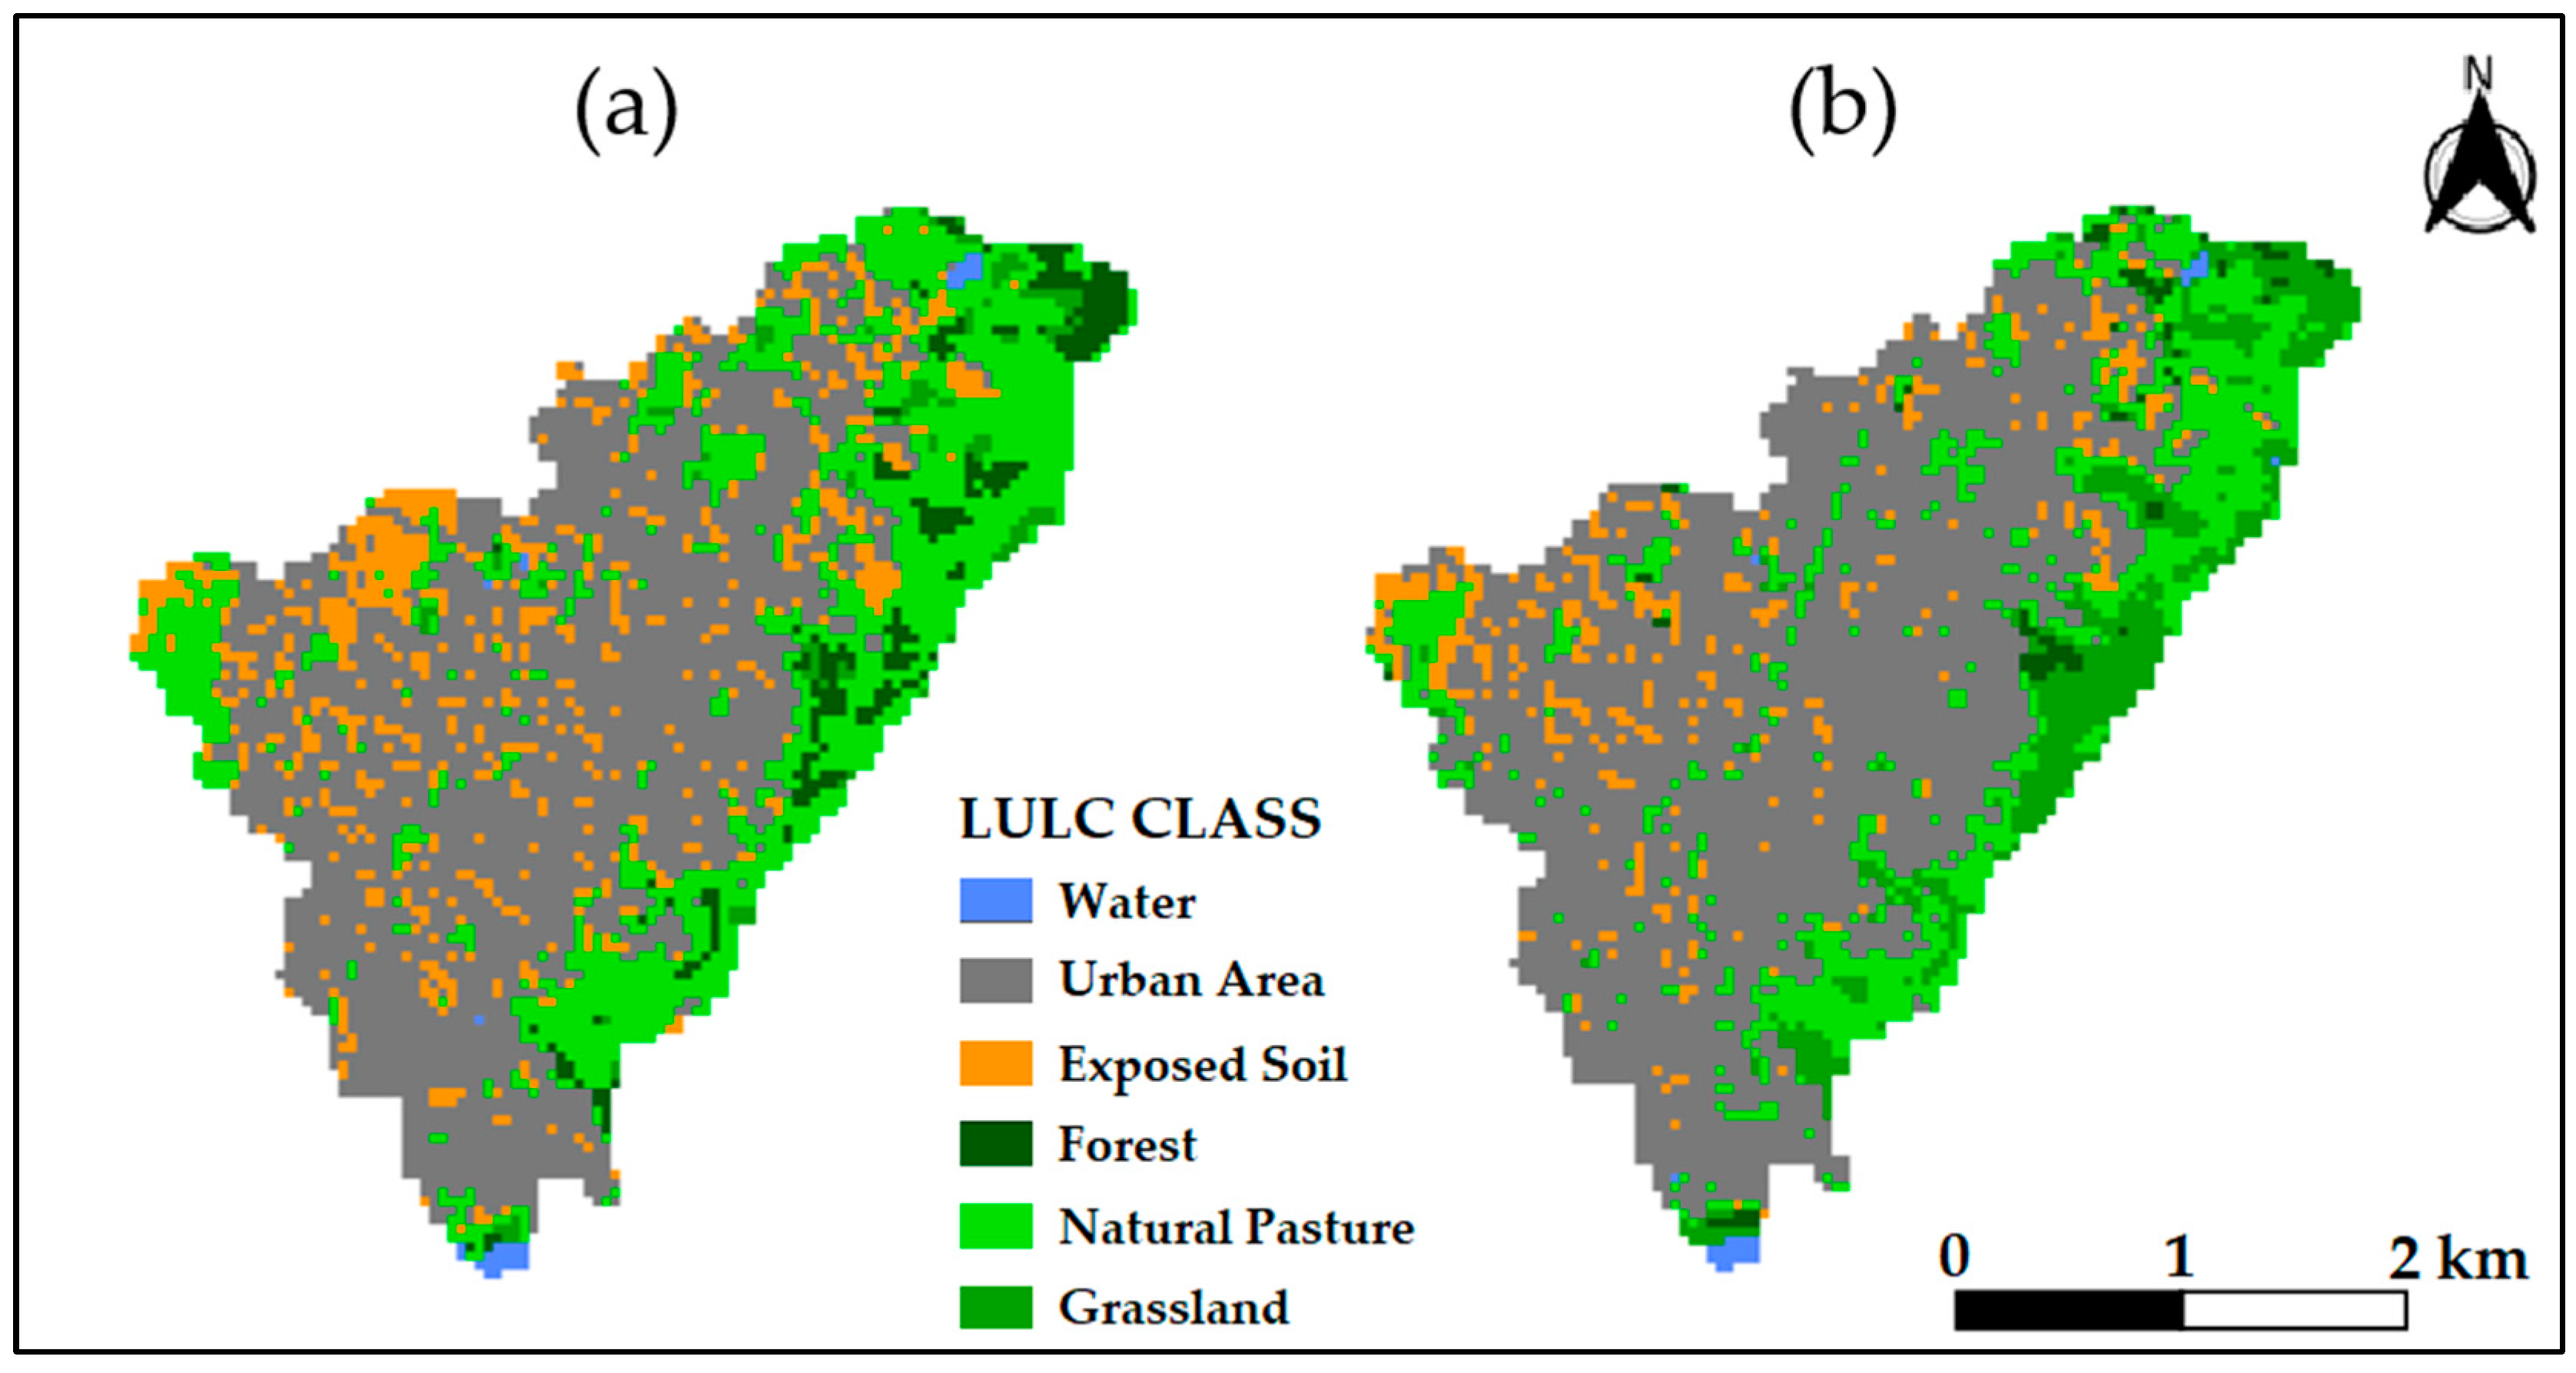
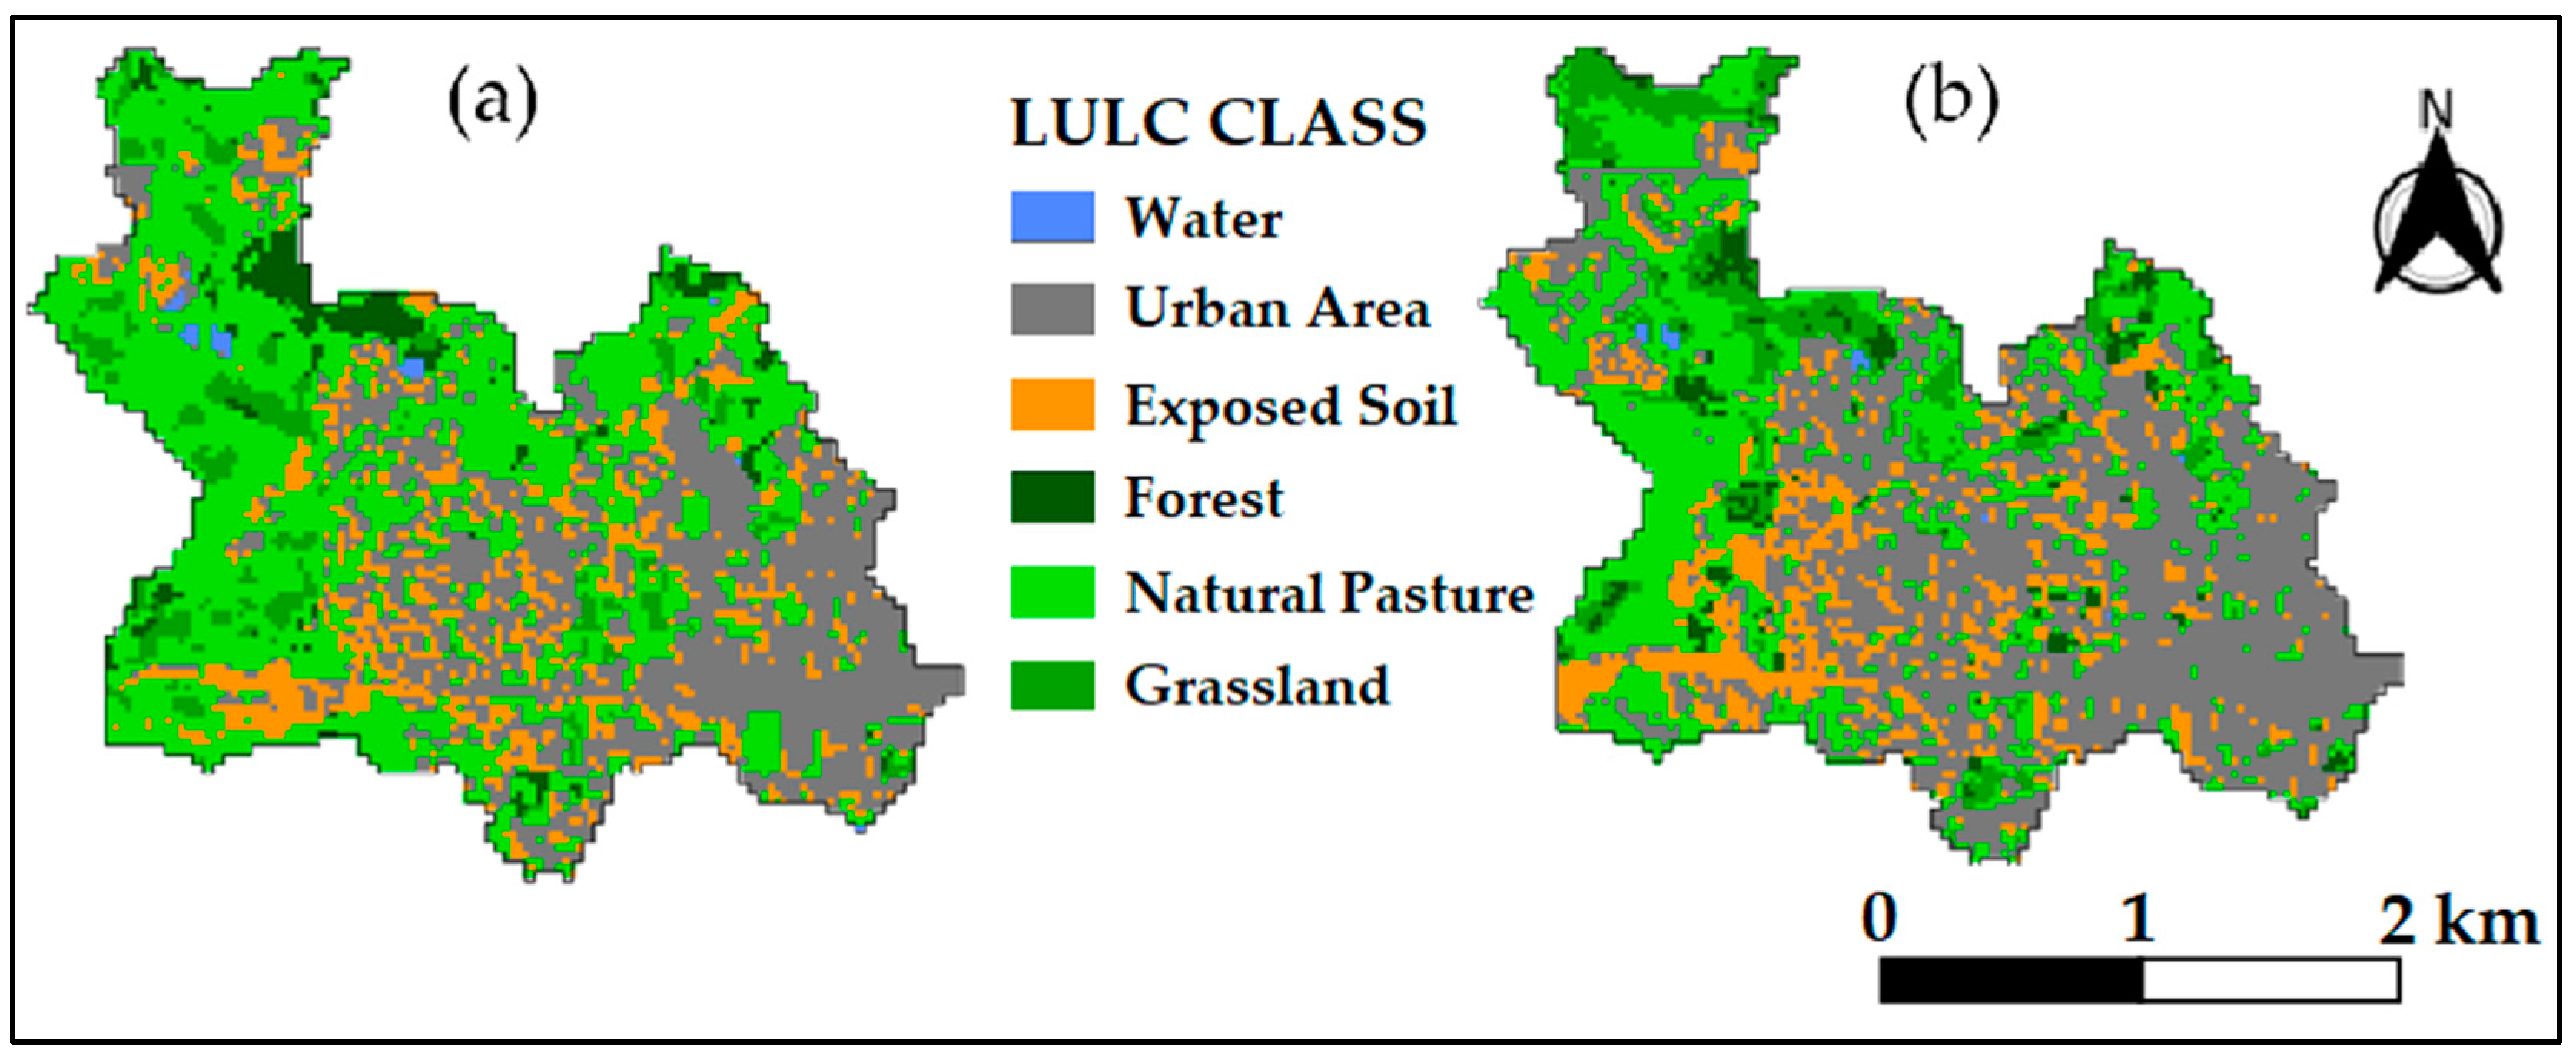
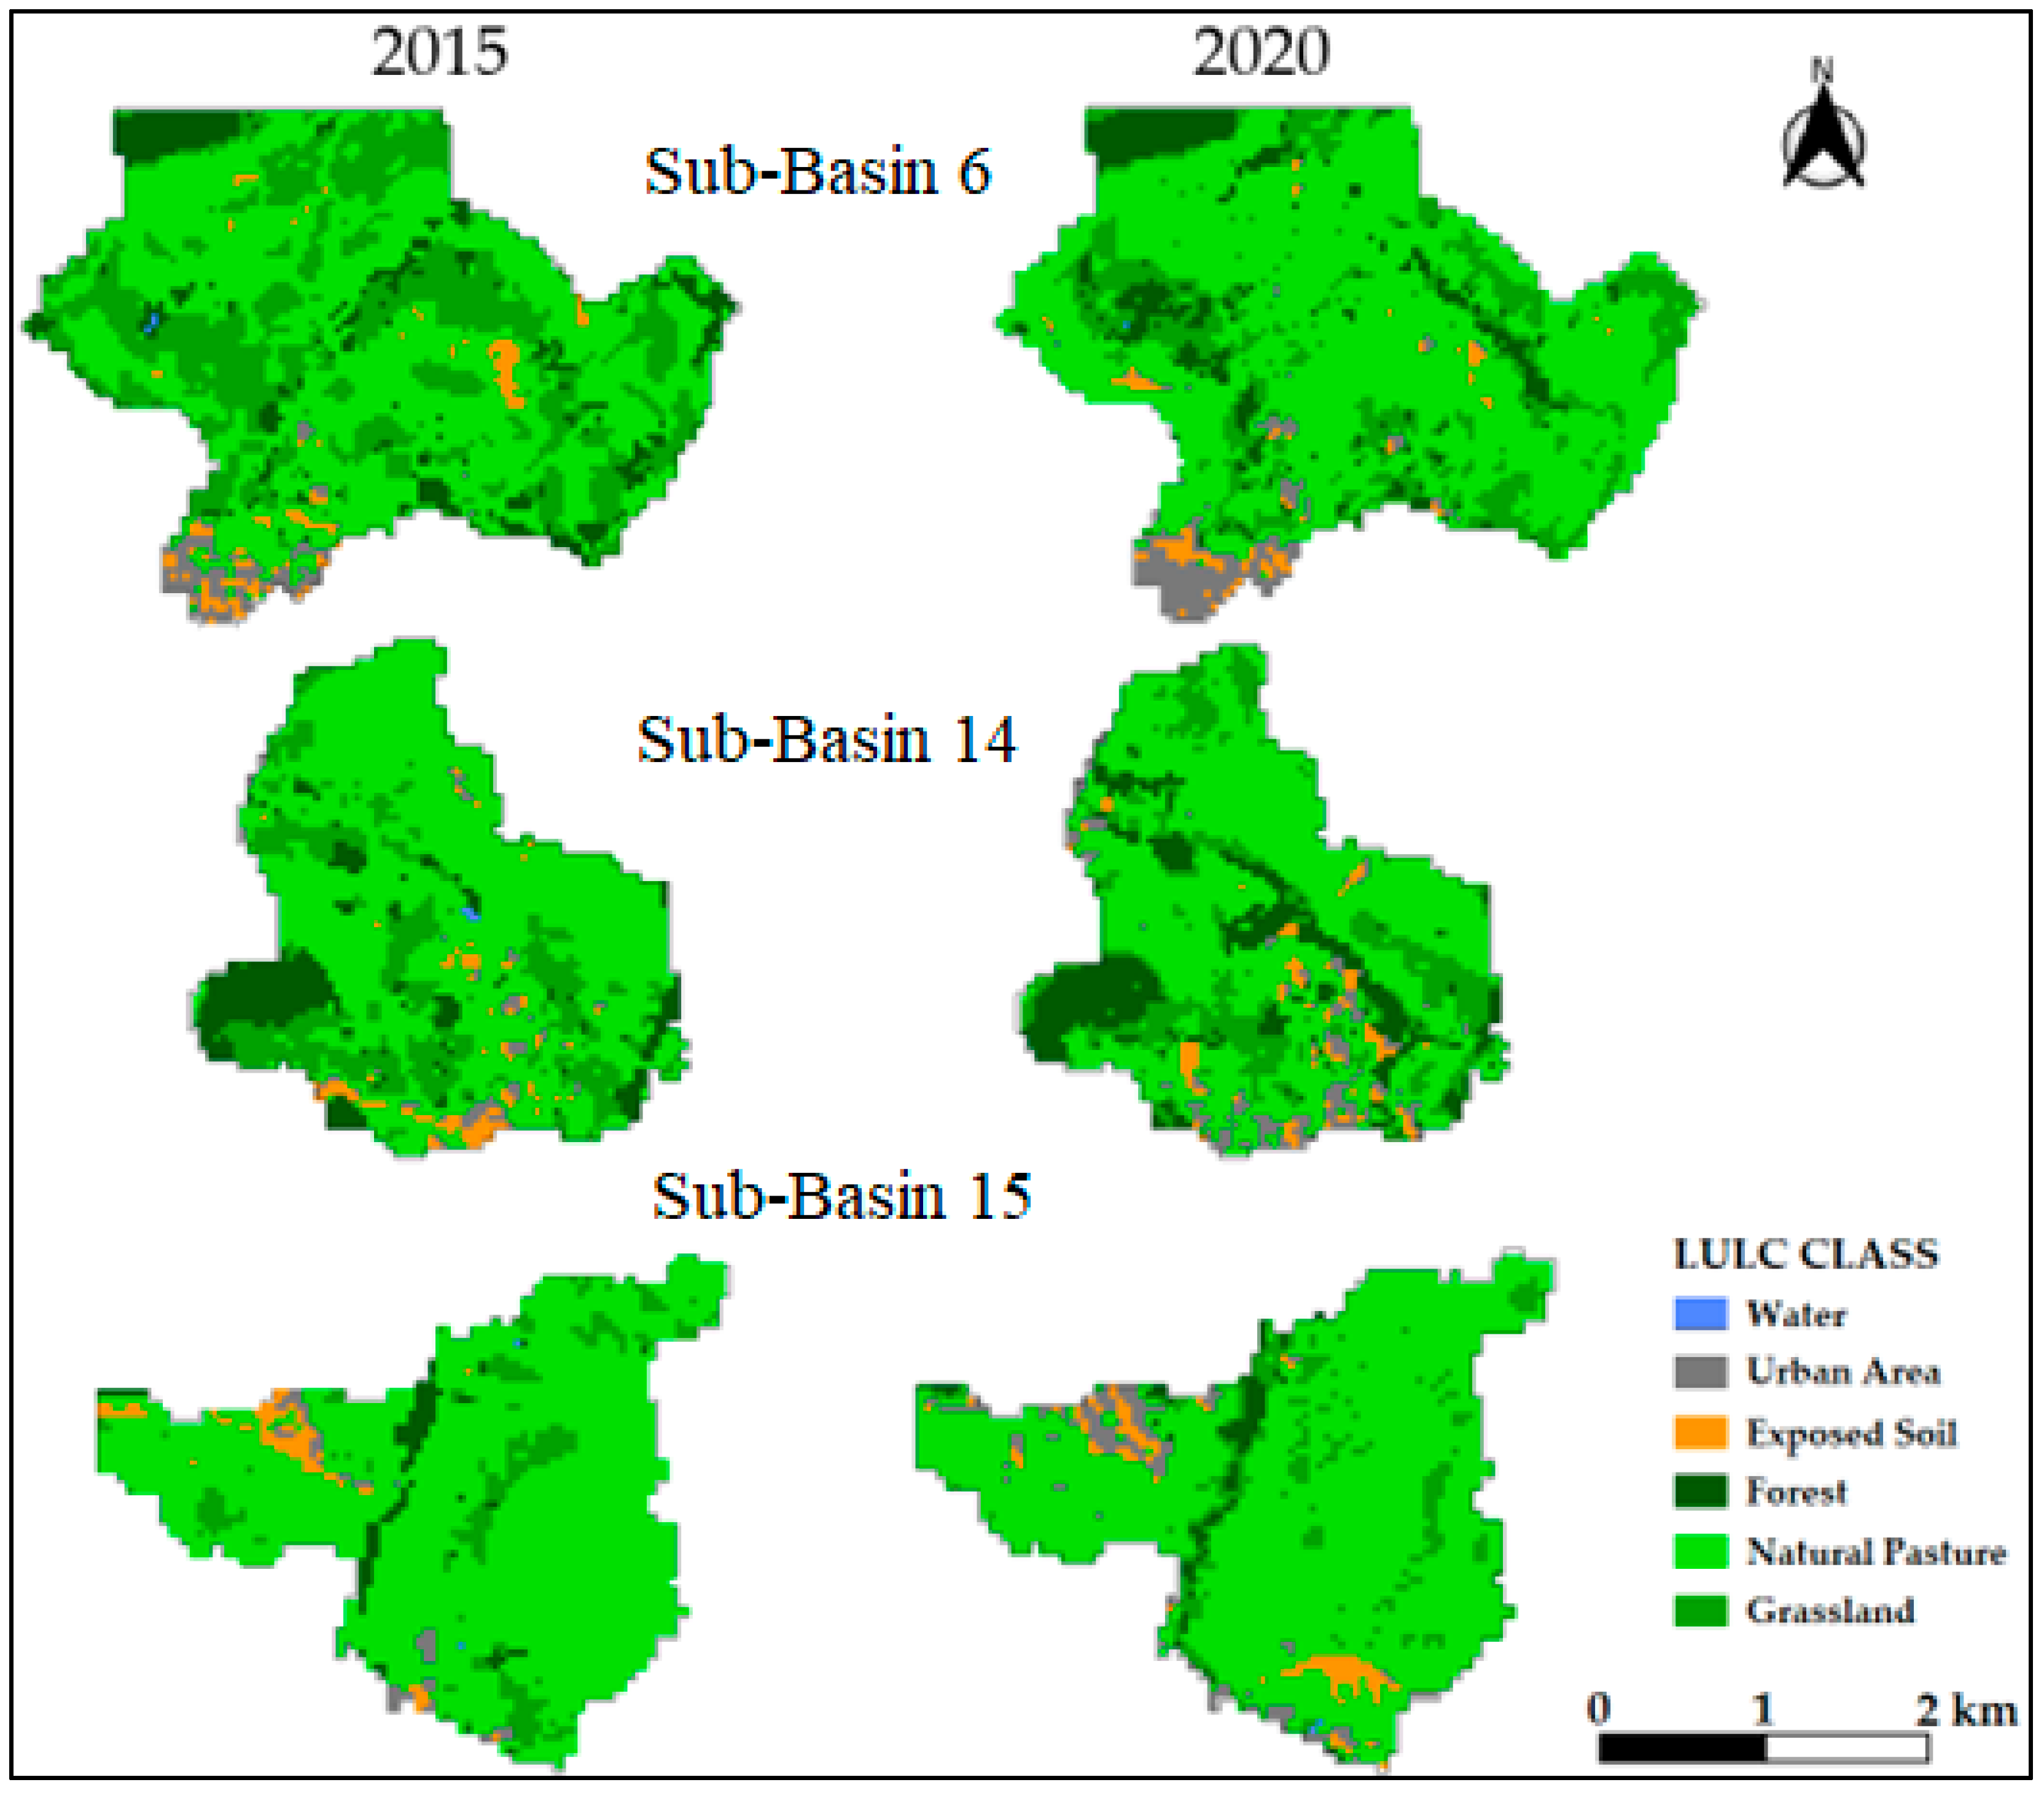
3.1. Land Use and Land Cover (LULC)

The study applied the SVM method for LULC classification using machine learning techniques on CBERS4 satellite images from 2015 and 2020. The classification aimed to gain insights into the evolving dynamics of LULC, as well as to detect changes in the urban area of Itaperuna over the years. In the image classification, six LULC categories were distinguished: (1) water bodies; (2) urban areas; (3) exposed soil; (4) forest; (5) natural pasture; and (6) grassland vegetation. The classification accuracies of both LULC maps were assessed using various metrics, including the overall accuracy, kappa coefficient, producer’s accuracy, and user’s accuracy [78,79]. The classification in 2015 resulted in an overall accuracy of 96.93% with a kappa coefficient of 95.67%. In contrast, the results from 2020 displayed an overall accuracy of 97.64% and a kappa coefficient of 96.37%. Figure 5 displays the map of LULC categories within Itaperuna’s urban area, and Table 2 presents the associated confusion matrix.
The analysis of land use and land cover in the Itaperuna region from 2015 to 2020 unveiled several noteworthy trends and changes. Water bodies within the watersheds remained relatively stable in terms of extent, without clear indications of specific drivers for significant alterations. In the context of the urban area, there was an overall expansion in all sub-basins, except for sub-basin 12, which experienced a modest reduction of 0.24 hectares. Sub-basins 5, 14, and 15 emerged as the most urbanized sub-basins in terms of percentage change during this period. Nevertheless, the most substantial expansions in urban areas were observed in sub-basins 3 and 7, which increased by 46.04 hectares and 22.48 hectares, respectively. This phenomenon can be partly attributed to the location of these sub-basins in the area of highest growth in Itaperuna. The class of exposed soil underwent notable transformations, with sub-basin 7 leading in terms of reduction, displaying a decrease of 13.92 hectares. Percentagewise, the most significant negative changes in the exposed soil class were noted in sub-basins 5 and 9, with reductions of 123.1% and 60.8%, respectively, while sub-basin 17 witnessed the most substantial increase, with an expansion of 5.56 hectares.
Regarding the forested areas, only three sub-basins demonstrated an increase in this class, with sub-basin 14 being the standout, showing a percentage increase of 45.5%, equivalent to 6.64 hectares. Conversely, four sub-basins witnessed a substantial decrease in forested area, with reductions of more than 65%, particularly in sub-basin 10, which saw a decline of 24.92 hectares. Sub-basins 10, 16, and 17 were particularly affected by deforestation, experiencing reductions of 24.92 hectares, 24.56 hectares, and 21.36 hectares, respectively. Concerning the natural pasture class, only sub-basin 6 recorded an increase of 24.84 hectares, while the other sub-basins exhibited significant reductions, with sub-basins 3 and 17 being the most impacted, experiencing decreases of 50.88 hectares and 63.36 hectares, respectively. In sub-basin 12, there was a remarkable increase of 1329% in the grassland vegetation class, expanding from 1.24 hectares in 2015 to 17.72 hectares in 2020. This shift implies a replacement of forested areas and natural pastures with grassland vegetation.
Regarding the LULC category displaying the most significant average changes in basin occupancy, the natural pasture category stands out, which experienced a decrease from 51.29% to 44.78%. Conversely, there was an increase in the area covered by grassland vegetation, growing from 12.33% to 17.94%. The urban area also exhibited an average increase per sub-basin, rising from 19.10% in 2015 to 23.73% in 2020. Hence, Table 3 presents a quantitative summary of the area in hectares for the identified LULC classes.

3.2. LULC and Its Impact on Surface Runoff

Analyzing the changes in runoff per hectare in the Itaperuna region (Figure 6 and Table 4) in light of the alterations in LULC between 2015 and 2020 offers a comprehensive perspective on the watershed transformations. This method enables us to pinpoint the areas most affected by the shifts in land use and land cover within the municipality.
Sub-basin 3 emerges as a notable illustration of the adverse consequences of urbanization in the region, where urbanization significantly escalated the runoff capacity. This pattern is mirrored in sub-basins 5, 10, and 11, which have also experienced substantial alterations in runoff generation. Notably, the most impacted sub-basins are primarily situated in the northwestern sector of the urban area, aligning with the urban expansion pattern in Itaperuna. Nevertheless, it is worth highlighting that two of the three sub-basins that exhibited reduced runoff production are positioned in the city center, specifically sub-basins 8 and 12.
Sub-basin 7 is remarkable for having the highest runoff capacity among all the considered sub-basins (Figure 7). Between 2015 and 2020, this capacity increased significantly, experiencing a notable increase of 19.53 cubic meters per hectare. This exceptional behavior of the sub-basin can be attributed in large part to the significant urbanization rate characterizing it. In fact, sub-basin 7 is the only sub-basin in the region where more than 50% of the total area is occupied by the urban area class. In 2015, this proportion accounted for 54.04% of the territory, but over five years, it rose to 63.30% in 2020.
The analysis of land use and land cover in the sub-basins reveals significant patterns in runoff changes and landscape evolution between 2015 and 2020. One of the standout findings is the substantial increase in runoff in sub-basin 3. Over five years, the runoff generation in sub-basin 3 increased from 802.45 m3/ha to 865.03 m3/ha, representing a rise of 59.58 m3/ha. This number is particularly striking when compared to the average variation in runoff capacity across the sub-basins, which stands at 14.15 m3/ha, exceeding the average by more than four times.
This trend is visually supported by the LULC map analysis (Figure 8), which illustrates a significant expansion of the urban area, playing a pivotal role in the increased runoff. In 2015, the urban area covered 117.12 hectares, and by 2020, it had expanded to 163.16 hectares. The growth in the urban area is undeniably linked to runoff production.
Direct observation and quantitative data confirm this pattern in sub-basin 3, showing that the urban area has expanded at the expense of natural pasture areas. The extent of natural pasture areas decreased from 159.64 hectares in 2015 to 108.76 hectares in 2020. Additionally, a moderate decrease in forested areas within the sub-basin is also noticeable.
These findings underscore the ongoing urbanization process in the sub-basin, where the expansion of urban areas has significantly impacted land use and land cover. The transformation of natural spaces, such as fields and forests, into urban areas has brought visible changes to the landscape and, consequently, to the runoff process.
Among the examined sub-basins, sub-basin 6 stands out as having the lowest flow capacity. A noticeable rise in urban areas is evident in several sub-basins, coupled with a corresponding decline in grassland vegetation. These transformations are particularly pronounced in sub-basins 14 and 15, which exhibit a pattern similar to that of sub-basin 6 throughout the study period (Figure 9).
Sub-basin 14 illustrates a substantial loss of a forested area situated in the sub-basin’s central part. Furthermore, a significant expansion of the urban area is noticeable, signifying an ongoing process of urbanization in this specific region.
Conversely, in sub-basin 15, there is a localized increase in the urban area within the sub-basin’s northwestern segment. In the remaining region, there are predominantly minor variations between pastureland and grassland vegetation, suggesting a less pronounced dynamic compared to other sub-basins under examination.

4. Discussion

This research delves into the evolving land use and land cover (LULC) patterns within Itaperuna city, situated in the northwest region of Rio de Janeiro (RJ), Brazil, examining its LULC maps from 2015 and 2020. The findings significantly contribute to comprehending the factors influencing LULC changes on regional and national scales, impacting the area’s susceptibility to flooding. This proposition is substantiated by the studies conducted by Hernandez et al. [80] and Fohrer et al. [81], both of which emphasize an increase in runoff in areas transitioning towards urbanization.
This understanding is highly significant for policymakers aiming to craft effective environmental strategies that promote sustainable development in Brazilian projects associated with altering LULC. Notably, this research novelty stands out for its original approach, introducing a methodology applied worldwide to Brazil, thus supporting sustainable management practices, particularly in smaller and medium-sized cities. Furthermore, its objective is to advocate for the widespread use of this method in other Brazilian regions, especially those significantly impacted by LULC changes.
First and foremost, a significant transformation in land use and land cover was evident in the Itaperuna region between 2015 and 2020. The growth of the urban area was particularly noticeable across most sub-basins, reflecting the city’s development. Notable increases in urban area, driven by expansion in the most densely populated city areas, were observed in sub-basins 3 and 7.
Substantial alterations in exposed soil were also observed, with sub-basin 7 exhibiting the most significant reduction. Furthermore, there were considerable fluctuations in forest cover, with some sub-basins experiencing growth while others faced substantial reductions. Particularly, deforestation was most pronounced in sub-basins 10, 16, and 17, resulting in large areas losing forest cover.
Regarding water runoff, sub-basin 3 emerged as a notable example of the detrimental effects of urbanization, demonstrating a considerable increase in runoff generation capacity. A similar trend was observed in other sub-basins, including sub-basins 5, 10, and 11, which exhibited significant changes in runoff production. Sub-basin 7, with a high level of urbanization, was distinguished by having the highest runoff capacity. This remarkable increase in the urban area class’s coverage within this sub-basin is a key factor in explaining the observed high runoff capacity per hectare. This aligns with the dynamics of runoff and land use described by Zhang et al. [82].
The analysis of land use and land cover in the sub-basins unveiled significant patterns in the changes in water flow and the evolution of the natural landscape. The expansion of the urban area has had a significant impact on runoff generation, influencing water and environmental management in the region. This corroborates the findings established by Sajikumar and Remya [83], Marhaento et al. [84], and Astuti et al. [85].
Consequently, the findings of this study indicate that alterations in LULC in Itaperuna are closely linked to an increase in urban area and changes in LULC categories. These changes directly affect runoff production, underscoring the significance of considering them in water resource management and decision-making pertaining to regional urban and environmental planning.

5. Conclusions

In conclusion, this research shed light on the intricate relationship between land use and land cover (LULC) alterations in Itaperuna, showcasing a direct correlation with the expansion of urban areas. Notably, these transformations play a pivotal role in influencing runoff production, emphasizing the imperative consideration of such changes in the context of water resource management. This insight holds profound implications for regional urban and environmental planning, particularly in the pursuit of effective flood prevention and mitigation strategies.
Building upon the insights garnered from this study, which primarily focused on flood prevention and mitigation in Itaperuna, Brazil, several critical avenues for future research emerge. One such avenue involves investigating how changes in LULC impact water quality, recognizing the interconnected nature of land use alterations and environmental health. Additionally, the advancement of hydrological models is essential for more precise water flow predictions, enabling proactive measures to combat potential flood-related risks.
Moreover, a comprehensive understanding of the broader implications of these changes for biodiversity and society is crucial. This involves exploring the ecological and social repercussions, which can inform more holistic and sustainable flood management strategies. Evaluating the socioeconomic implications of preventative measures is equally vital, ensuring that interventions are not only effective but also equitable and socially responsible.
As a forward-looking recommendation, the implementation of advanced water resource management strategies is warranted. This includes a reevaluation of existing public policies to align them with the dynamic nature of urbanization and environmental changes. Establishing continuous monitoring systems is of great importance, providing real-time data that enhance the effectiveness of decision-making processes related to flood prevention.
In essence, these proposed research directions aim to contribute to a comprehensive understanding of the challenges associated with flood management in the region. By addressing these aspects, the research endeavors to provide valuable guidance for decision-makers, ultimately enhancing water security, reducing flood-related risks, and fostering sustainable development in the face of evolving urban landscapes.

Author Contributions

Conceptualization, G.C.G.d.S., P.C.d.O.C., M.d.M.R. and I.P.; methodology, G.C.G.d.S., P.C.d.O.C., M.d.M.R. and I.P.; software, G.C.G.d.S.; validation, G.C.G.d.S. and P.C.d.O.C.; formal analysis, G.C.G.d.S., P.C.d.O.C., M.d.M.R. and I.P.; investigation, G.C.G.d.S., P.C.d.O.C., M.d.M.R. and I.P.; resources, G.C.G.d.S., P.C.d.O.C. and I.P.; data curation, G.C.G.d.S. and P.C.d.O.C.; writing—original draft preparation, G.C.G.d.S., P.C.d.O.C., M.d.M.R. and I.P.; writing—review and editing, G.C.G.d.S., P.C.d.O.C., M.d.M.R. and I.P.; visualization, G.C.G.d.S., P.C.d.O.C., M.d.M.R. and I.P.; supervision, G.C.G.d.S., P.C.d.O.C., M.d.M.R. and I.P.; project administration, G.C.G.d.S., P.C.d.O.C., M.d.M.R. and I.P.; funding acquisition, G.C.G.d.S., P.C.d.O.C. and I.P. All authors have read and agreed to the published version of the manuscript.

Funding

This research was funded by Coordenação de Aperfeiçoamento de Pessoal de Nível Superior (CAPES), grant numbers 001 and 23038.014822/2022-60, and by Fundação Carlos Chagas Filho de Amparo à Pesquisa do Estado do Rio de Janeiro (FAPERJ), grant number SEI-260003/000537/2023. The APC was funded by Coordenação de Aperfeiçoamento de Pessoal de Nível Superior (CAPES), grant number 23038.014822/2022-60.

Data Availability Statement

Restrictions apply to the availability of these data. Data were obtained from the National Institute for Space Research (INPE), the Brazilian Agricultural Research Corporation (EMBRAPA), the National Water Agency (ANA) and the National Institute of Meteorology (INMET) and are available on request from the corresponding author with the permission of INPE, EMBRAPA, ANA, and/or INMET.

Acknowledgments

The authors would like to thank the National Institute for Space Research (INPE) for providing the digital elevation model (DEM), the Brazilian Agricultural Research Corporation (EMBRAPA) for providing the pedological map of the state of Rio de Janeiro, the National Water Agency (ANA) and the National Institute of Meteorology (INMET) for providing the precipitation data.

Conflicts of Interest

The authors declare no conflict of interest. The funders had no role in the design of the study; in the collection, analyses, or interpretation of data; in the writing of the manuscript; or in the decision to publish the results.

References

  1. United Nations. Handbook of Statistics; United Nations: Geneva, Switzerland, 2018. [Google Scholar]
  2. Chen, D.; Hu, W.; Li, Y.; Zhang, C.; Lu, X.; Cheng, H. Exploring the temporal and spatial effects of city size on regional economic integration: Evidence from the Yangtze River Economic Belt in China. Land Use Policy 2023, 132, 106770. [Google Scholar] [CrossRef]
  3. Arnone, E.; Pumo, D.; Francipane, A.; La Loggia, G.; Noto, L.V. The Role of Urban Growth, Climate Change, and Their Interplay in Altering Runoff Extremes. Hydrol. Process. 2018, 32, 1755–1770. [Google Scholar] [CrossRef]
  4. Borges, E.C.; Paz, I.; Leite, N.A.D.; Willinger, B.; Ichiba, A.; Gires, A.; de Campos, P.C.O.; Monier, L.; Cardinal, H.; Amorim, J.C.C.; et al. Evaluation of the Spatial Variability of Ecosystem Services and Natural Capital: The Urban Land Cover Change Impacts on Carbon Stocks. Int. J. Sustain. Dev. World Ecol. 2020, 28, 339–349. [Google Scholar] [CrossRef]
  5. Paz, I.; Willinger, B.; Gires, A.; de Souza, B.A.; Monier, L.; Cardinal, H.; Tisserand, B.; Tchiguirinskaia, I.; Schertzer, D. Small-Scale Rainfall Variability Impacts Analyzed by Fully-Distributed Model Using C-Band and X-Band Radar Data. Water 2019, 11, 1273. [Google Scholar] [CrossRef]
  6. Campos, P.C.O.; Paz, T.S.R.; Lenz, L.; Qiu, Y.; Alves, C.N.; Simoni, A.P.R.; Amorim, J.C.C.; Lima, G.B.A.; Rangel, M.P.; Paz, I. Multi-Criteria Decision Method for Sustainable Watercourse Management in Urban Areas. Sustainability 2020, 12, 6493. [Google Scholar] [CrossRef]
  7. Seto, K.C.; Fragkias, M.; Güneralp, B.; Reilly, M.K. A Meta-Analysis of Global Urban Land Expansion. PLoS ONE 2011, 6, e23777. [Google Scholar] [CrossRef] [PubMed]
  8. Zeleňáková, M.; Vranayová, Z.; Repel, A.; Kaposztasová, D. Surface Runoff in Urban Area—Case Study. In New Trends in Urban. Drainage Modelling. UDM 2018. Green. Energy and Technology; Mannina, G., Ed.; Springer: Cham, Switzerland, 2019. [Google Scholar] [CrossRef]
  9. Jacobson, C.R. Identification and Quantification of the Hydrological Impacts of Imperviousness in Urban Catchments: A Review. J. Env. Manag. 2011, 92, 1438–1448. [Google Scholar] [CrossRef]
  10. Hao, L.; Sun, G.; Liu, Y.; Wan, J.; Qin, M.; Qian, H.; Liu, C.; Zheng, J.; John, R.; Fan, P.; et al. Urbanization Dramatically Altered the Water Balances of a Paddy Field-Dominated Basin in Southern China. Hydrol. Earth Syst. Sci. 2015, 19, 3319–3331. [Google Scholar] [CrossRef]
  11. Feng, B.; Zhang, Y.; Bourke, R. Urbanization Impacts on Flood Risks Based on Urban Growth Data and Coupled Flood Models. Nat. Hazards 2021, 106, 613–627. [Google Scholar] [CrossRef]
  12. Thanapura, P.; Helder, D.L.; Burckhard, S.; Warmath, E.; O’Neill, M.; Galster, D. Mapping Urban Land Cover Using QuickBird NDVI and GIS Spatial Modeling for Runoff Coefficient Determination. Photogramm. Eng. Remote Sens. 2007, 73, 57–65. [Google Scholar] [CrossRef]
  13. Chapman, S.; Watson, J.E.M.; Salazar, A.; Thatcher, M.; McAlpine, C.A. The Impact of Urbanization and Climate Change on Urban Temperatures: A Systematic Review. Landsc. Ecol. 2017, 32, 1921–1935. [Google Scholar] [CrossRef]
  14. Yao, L.; Wei, W.; Chen, L. How Does Imperviousness Impact the Urban Rainfall-Runoff Process under Various Storm Cases? Ecol. Indic. 2016, 60, 893–905. [Google Scholar] [CrossRef]
  15. Amarasinghe, M.P.; Kulathilaka, S.A.S.; Robert, D.J.; Zhou, A.; Jayathissa, H.A.G. Risk assessment and management of rainfall-induced landslides in tropical regions: A review. Nat. Hazards 2023, 1–53. [Google Scholar] [CrossRef]
  16. McGrane, S.J. Impacts of Urbanisation on Hydrological and Water Quality Dynamics, and Urban Water Management: A Review. Hydrol. Sci. J. 2016, 61, 2295–2311. [Google Scholar] [CrossRef]
  17. Li, C.; Sun, G.; Caldwell, P.V.; Cohen, E.; Fang, Y.; Zhang, Y.; Oudin, L.; Sanchez, G.M.; Meentemeyer, R.K. Impacts of Urbanization on Watershed Water Balances Across the Conterminous United States. Water Resour. Res. 2020, 56, e2019WR026574. [Google Scholar] [CrossRef]
  18. Oñate-Valdivieso, F.; Oñate-Paladines, A.; Collaguazo, M. Spatiotemporal Dynamics of Soil Impermeability and Its Impact on the Hydrology of An Urban Basin. Land 2022, 11, 250. [Google Scholar] [CrossRef]
  19. Müller, A.; Österlund, H.; Marsalek, J.; Viklander, M. The Pollution Conveyed by Urban Runoff: A Review of Sources. Sci. Total Environ. 2020, 709, 136125. [Google Scholar] [CrossRef]
  20. Qin, Y. Urban Flooding Mitigation Techniques: A Systematic Review and Future Studies. Water 2020, 12, 3579. [Google Scholar] [CrossRef]
  21. Brito, G.Q.; Murta, J.R.d.M.; Salemi, L.F. Surface Runoff from an Urban Area Promotes Hydrological Connectivity and Soil Loss in a Tropical Riparian Forest. Water Air Soil Pollut. 2022, 233, 204. [Google Scholar] [CrossRef]
  22. Walsh, C.J.; Fletcher, T.D.; Burns, M.J. Urban Stormwater Runoff: A New Class of Environmental Flow Problem. PLoS ONE 2012, 7, e45814. [Google Scholar] [CrossRef]
  23. Xu, S.; Yang, K.; Xu, Y.; Zhu, Y.; Luo, Y.; Shang, C.; Zhang, J.; Zhang, Y.; Gao, M.; Wu, C. Urban Land Surface Temperature Monitoring and Surface Thermal Runoff Pollution Evaluation Using UAV Thermal Remote Sensing Technology. Sustainability 2021, 13, 11203. [Google Scholar] [CrossRef]
  24. He, C.; James, L.A. Watershed Science: Linking Hydrological Science with Sustainable Management of River Basins. Sci. China Earth Sci. 2021, 64, 677–690. [Google Scholar] [CrossRef]
  25. Figueiredo, P.M.A.; Lippo, B.B.; de Quevedo, D.M. Importância Do Monitoramento e Disponibilização de Dados Hidrológicos Para a Gestão Integrada Dos Recursos Hídricos. Soc. Nat. 2020, 32, 308–320. [Google Scholar] [CrossRef]
  26. Medina, Y.; Muñoz, E.; Clasing, R.; Arumí, J.L. Analysis of the Relative Importance of the Main Hydrological Processes at Different Temporal Scales in Watersheds of South-Central Chile. Water 2022, 14, 807. [Google Scholar] [CrossRef]
  27. Samie, M.; Ghazavi, R.; Vali, A.; Pakparvar, M. Evaluation of the Effect of Land Use Change on Runoff Using Supervised Classified Satellite Data. Glob. Nest J. 2019, 21, 245–252. [Google Scholar] [CrossRef]
  28. Senbeta, T.B.; Romanowicz, R.J. The Role of Climate Change and Human Interventions in Affecting Watershed Runoff Responses. Hydrol. Process. 2021, 35, e14448. [Google Scholar] [CrossRef]
  29. Felix, N.B.; Campos, P.C.d.O.; Paz, I.; Marques, M.E.S. Geoprocessing Applied to the Assessment of Carbon Storage and Sequestration in a Brazilian Medium-Sized City. Sustainability 2022, 14, 8761. [Google Scholar] [CrossRef]
  30. Kifle, T.; Deres, A.; Birku, A.; Aberham, T.; Mengist, D. Evaluation of the Impacts of Land Use and Land Cover Changes Using Erosion Assessment Model at Tikur Wuha Watershed. Int. J. Res.-GRANTHAALAYAH 2020, 8, 75–91. [Google Scholar] [CrossRef]
  31. Chen, D.; Hu, W. Temporal and Spatial Effects of Heavy Metal-Contaminated Cultivated Land Treatment on Agricultural Development Resilience. Land 2023, 12, 945. [Google Scholar] [CrossRef]
  32. Mojaddadi, H.; Pradhan, B.; Nampak, H.; Ahmad, N.; Ghazali, A.H. bin Ensemble Machine-Learning-Based Geospatial Approach for Flood Risk Assessment Using Multi-Sensor Remote-Sensing Data and GIS. Geomat. Nat. Hazards Risk 2017, 8, 1080–1102. [Google Scholar] [CrossRef]
  33. Rollenbeck, R.; Orellana-Alvear, J.; Rodriguez, R.; Macalupu, S.; Nolasco, P. Calibration of X-Band Radar for Extreme Events in a Spatially Complex Precipitation Region in North Peru: Machine Learning vs. Empirical Approach. Atmosphere 2021, 12, 1561. [Google Scholar] [CrossRef]
  34. Silva, E.J.R.d.; Alves, C.N.; Campos, P.C.d.O.; Oliveira, R.A.A.C.e.; Marques, M.E.S.; Amorim, J.C.C.; Paz, I. Comparison of Rain Gauge Network and Weather Radar Data: Case Study in Angra dos Reis, Brazil. Water 2022, 14, 3944. [Google Scholar] [CrossRef]
  35. Ding, J.; Gao, J.; Zhang, G.; Zhang, F.; Yang, J.; Wang, S.; Xue, B.; Wang, K. A Rolling Real-Time Correction Method for Minute Precipitation Forecast Based on Weather Radars. Water 2023, 15, 1872. [Google Scholar] [CrossRef]
  36. Wang, X.; Xie, H. A Review on Applications of Remote Sensing and Geographic Information Systems (GIS) in Water Resources and Flood Risk Management. Water 2018, 10, 608. [Google Scholar] [CrossRef]
  37. Dogra, A.; Thakur, J.; Tandon, A. Do satellite-based products suffice for rainfall observations over data-sparse omplex terrains? Evidence from the North-Western Himalayas. Remote Sens. Environ. 2023, 299, 113855. [Google Scholar] [CrossRef]
  38. Lim, T.C.; Welty, C. Effects of Spatial Configuration of Imperviousness and Green Infrastructure Networks on Hydrologic Response in a Residential Sewershed. Water Resour. Res. 2017, 53, 8084–8104. [Google Scholar] [CrossRef]
  39. Fok, H.S.; Chen, Y.; Wang, L.; Tenzer, R.; He, Q. Improved Mekong Basin Runoff Estimate and Its Error Characteristics Using Pure Remotely Sensed Data Products. Remote Sens. 2021, 13, 996. [Google Scholar] [CrossRef]
  40. Kumar, A.; Agarwal, V.; Pal, L.; Chandniha, S.K.; Mishra, V. Effect of Land Surface Temperature on Urban Heat Island in Varanasi City, India. J—Multidiscip. Sci. J. 2021, 4, 420–429. [Google Scholar] [CrossRef]
  41. Huang, C.; Chen, T.; Yi, H.; Xu, X.; Chen, S.; Chen, W. Collaborative Environmental Governance, Inter-Agency Cooperation and Local Water Sustainability in China. Sustainability 2017, 9, 2305. [Google Scholar] [CrossRef]
  42. Bose, S.; Mazumdar, A. Urban Flood Risk Assessment and Mitigation with InVEST-UFRM Model: A Case Study on Kolkata City, West Bengal State (India). Arab. J. Geosci. 2023, 16, 320. [Google Scholar] [CrossRef]
  43. Qi, W.; Ma, C.; Xu, H.; Chen, Z.; Zhao, K.; Han, H. A Review on Applications of Urban Flood Models in Flood Mitigation Strategies. Nat. Hazards 2021, 108, 31–62. [Google Scholar] [CrossRef]
  44. Chen, J.; Li, Y.; Zhang, C.; Tian, Y.; Guo, Z. Urban Flooding Prediction Method Based on the Combination of LSTM Neural Network and Numerical Model. Int. J. Environ. Res. Public Health 2023, 20, 1043. [Google Scholar] [CrossRef] [PubMed]
  45. Albano, R.; Mancusi, L.; Sole, A.; Adamowski, J. FloodRisk: A Collaborative, Free and Open-Source Software for Flood Risk Analysis. Geomat. Nat. Hazards Risk 2017, 8, 1812–1832. [Google Scholar] [CrossRef]
  46. Beilicci, E.; Beilicci, R.; David, I. Hydroinformatic Tools for Flood Risk Map Achievement. Int. J. Energy 2021, 15, 27–32. [Google Scholar] [CrossRef]
  47. Darabi, H.; Choubin, B.; Rahmati, O.; Torabi Haghighi, A.; Pradhan, B.; Kløve, B. Urban Flood Risk Mapping Using the GARP and QUEST Models: A Comparative Study of Machine Learning Techniques. J. Hydrol. 2019, 569, 142–154. [Google Scholar] [CrossRef]
  48. Kadaverugu, A.; Nageshwar Rao, C.; Viswanadh, G.K. Quantification of Flood Mitigation Services by Urban Green Spaces Using InVEST Model: A Case Study of Hyderabad City, India. Model. Earth Syst. Environ. 2021, 7, 589–602. [Google Scholar] [CrossRef]
  49. Soulis, K.X. Soil Conservation Service Curve Number (SCS-CN) Method: Current Applications, Remaining Challenges, and Future Perspectives. Water 2021, 13, 192. [Google Scholar] [CrossRef]
  50. Xiao, B.; Wang, Q.-H.; Fan, J.; Han, F.-P.; Dai, Q.-H. Application of the SCS-CN Model to Runoff Estimation in a Small Watershed with High Spatial Heterogeneity. Pedosphere 2011, 21, 738–749. [Google Scholar] [CrossRef]
  51. Mishra, S.K.; Singh, V.P. Soil Conservation Service Curve Number (SCS-CN) Methodology; Springer: Dordrecht, The Netherlands, 2003; Volume 42, ISBN 978-90-481-6225-3. [Google Scholar]
  52. Hu, S.; Fan, Y.; Zhang, T. Assessing the Effect of Land Use Change on Surface Runoff in a Rapidly Urbanized City: A Case Study of the Central Area of Beijing. Land 2020, 9, 17. [Google Scholar] [CrossRef]
  53. Vojtek, M.; Vojteková, J. Land Use Change and Its Impact on Surface Runoff from Small Basins: A Case of Radiša Basin. Folia Geogr. 2019, 60, 104–125. [Google Scholar]
  54. Ozdemir, H.; Elbaşı, E. Benchmarking Land Use Change Impacts on Direct Runoff in Ungauged Urban Watersheds. Phys. Chem. Earth Parts A/B/C 2015, 79, 100–107. [Google Scholar] [CrossRef]
  55. Jahan, K.; Pradhanang, S.M.; Bhuiyan, M.A.E. Surface Runoff Responses to Suburban Growth: An Integration of Remote Sensing, GIS, and Curve Number. Land 2021, 10, 452. [Google Scholar] [CrossRef]
  56. Chatterjee, C.; Jha, R.; Lohani, A.K.; Kumar, R.; Singh, R. Runoff Curve Number Estimation for a Basin Using Remote Sensing and GIS. Asian-Pac. Remote Sens. GIS J. 2001, 14, 1–8. [Google Scholar]
  57. NRCS. Urban Hydrology for Small Watersheds TR-55; NRCS: Washington, DC, USA, 1986.
  58. Al-Juaidi, A.E.M. A Simplified GIS-Based SCS-CN Method for the Assessment of Land-Use Change on Runoff. Arab. J. Geosci. 2018, 11, 269. [Google Scholar] [CrossRef]
  59. IBGE—Instituto Brasileiro de Geografia e Estatística. Panorama IBGE Itaperuna-RJ. Available online: https://cidades.ibge.gov.br/brasil/rj/itaperuna/panorama (accessed on 14 August 2023).
  60. IBGE—Instituto Brasileiro de Geografia e Estatística. Censo. 2010. Available online: https://censo2010.ibge.gov.br (accessed on 16 December 2023).
  61. Martorano, L.G.; Rossiello, R.O.P.; Meneguelli, N.A.; Lumbreras, J.F.; Valle, L.S.S.; Motta, P.E.F.; Rebello, E.R.G.; Said, U.P.; Martins, G.S. Aspectos Climáticos do Noroeste Fluminense, RJ.—Portal Embrapa; Embrapa Solos: Rio de Janeiro, Brazil, 2003. [Google Scholar]
  62. Santos, H.d.; Jacomine, P.; Anjos, L.d.; Oliveira, V.; Lumbreras, J.; Coelho, M.; Almeida, J.; Filho, J.; Oliveira, J.d.; Cunha, T. Sistema Brasileiro de Classificação dos Solos; Embrapa Solos: Rio de Janeiro, Brazil, 2018. [Google Scholar]
  63. Salviano, M.; Matos, A. Relatório Anual Do Sistema de Alerta Hidrológico Da Bacia Do Rio Muriaé—2023; Serviço Geológico do Brasil-CPRM: São Paulo, Brazil, 2023. [Google Scholar]
  64. Fundação COPPETEC. Plano de Recursos Hídricos da Bacia do Rio Paraíba do Sul—Resumo; Resende, R.J., Ed.; Fundação COPPETEC: Rio de Janeiro, Brazil, 2006. [Google Scholar]
  65. Paz, T.S.R.; Rocha, V.G., Jr.; Campos, P.C.O.; Paz, I.; Caiado, R.G.G.; Rocha, A.A.; Lima, G.B.A. Hybrid Method to Guide Sustainable Initiatives in Higher Education: A Critical Analysis of Brazilian Municipalities. Int. J. Sustain. High. Educ. 2022, 24, 299–316. [Google Scholar] [CrossRef]
  66. Diniz, D. O desenvolver de um município: Itaperuna. In Do Germinar à Frutificação; Damadá Artes Gráficas e Editora: Rio de Janeiro, Brazil, 1985. [Google Scholar]
  67. Costa, J.; Hora, A. A Dinâmica Dos Processos Relacionados Às Inundações No Município de Itaperuna-RJ. Sodebras 2016, 11, 129. [Google Scholar]
  68. Campos, P.C.d.O.; Paz, I. Spatial Diagnosis of Rain Gauges’ Distribution and Flood Impacts: Case Study in Itaperuna, Rio de Janeiro—Brazil. Water 2020, 12, 1120. [Google Scholar] [CrossRef]
  69. INPE—Instituto Nacional de Pesquisas Espaciais. Cbers-3 e 4. Available online: http://www.cbers.inpe.br/sobre/cbers3-4.php (accessed on 15 August 2023).
  70. QGIS 3.22.8. Available online: https://qgis.org (accessed on 28 June 2023).
  71. IBGE—Instituto Brasileiro de Geografia e Estatística. Mapa de Vegetação do Brasil. Available online: https://geoftp.ibge.gov.br/informacoes_ambientais/vegetacao/mapas/brasil/vegetacao.pdf (accessed on 17 December 2023).
  72. Genovez, A.; Neto, F.; Sartori, A. Classificação Hidrológica de Solos Brasileiros Para a Estimativa Da Chuva Excedente Com o Método Do Serviço de Conservação Do Solo Dos Estados Unidos Parte 1: Classificação. Rev. Bras. Recur. Hídri. 2005, 10, 5–18. [Google Scholar] [CrossRef]
  73. ANA—Agência Nacional de Águas e Saneamento Básico. Nota Técnica nº 46/2018/SPR. Produção de Base Vetorial com o Curve Number (CN) para BHO 2014 (BHO_CN). Available online: https://metadados.snirh.gov.br/geonetwork/srv/api/records/d1c36d85-a9d5-4f6a-85f7-71c2dc801a67/attachments/NOTA_TECNICA_46_2018_SPR.pdf (accessed on 10 August 2023).
  74. ANA—Agência Nacional de Águas e Saneamento Básico. HidroWeb Mobile. Available online: https://www.snirh.gov.br/hidroweb-mobile/mapa (accessed on 14 August 2023).
  75. INMET—Instituto Nacional de Meteorologia. BDMEP. Banco de dados Meteorológicos do INMET. Available online: https://bdmep.inmet.gov.br (accessed on 17 September 2023).
  76. INPE—Instituto Nacional de Pesquisas Espaciais. TOPODATA. Banco de Dados Geomorfométricos do Brasil. Available online: http://www.dsr.inpe.br/topodata/ (accessed on 3 October 2023).
  77. Tucci, C.E.M. Escoamento superficial. In Tucci, C.E.M. (org.). Hidrologia: Ciência e Aplicação, 3rd ed.; ABRH/UFRGS: Porto Alegre, Brazil, 2004; pp. 391–441. [Google Scholar]
  78. Damtea, W.; Kim, D.; Im, S. Spatiotemporal Analysis of Land Cover Changes in the Chemoga Basin, Ethiopia, Using Landsat and Google Earth Images. Sustainability 2020, 12, 3607. [Google Scholar] [CrossRef]
  79. Solórzano, J.V.; Mas, J.F.; Gao, Y.; Gallardo-Cruz, J.A. Land Use Land Cover Classification with U-Net: Advantages of Combining Sentinel-1 and Sentinel-2 Imagery. Remote Sens. 2021, 13, 3600. [Google Scholar] [CrossRef]
  80. Hernandez, M.; Miller, S.N.; Goodrich, D.C.; Goff, B.F.; Kepner, W.G.; Edmonds, C.M.; Jones, K.B. Modeling Runoff Response to Land Cover and Rainfall Spatial Variability in Semi-Arid Watersheds. Environ. Monit. Assess. 2000, 64, 285–298. [Google Scholar] [CrossRef]
  81. Fohrer, N.; Haverkamp, S.; Eckhardt, K.; Frede, H.-G. Hydrologic Response to Land Use Changes on the Catchment Scale. Phys. Chem. Earth Part B Hydrol. Ocean. Atmos. 2001, 26, 577–582. [Google Scholar] [CrossRef]
  82. Zhang, Y.; Xia, J.; Yu, J.; Randall, M.; Zhang, Y.; Zhao, T.; Pan, X.; Zhai, X.; Shao, Q. Simulation and As-sessment of Urbanization Impacts on Runoff Metrics: Insights from Landuse Changes. J. Hydrol. 2018, 560, 247–258. [Google Scholar] [CrossRef]
  83. Sajikumar, N.; Remya, R.S. Impact of Land Cover and Land Use Change on Runoff Characteristics. J. Env. Manag. 2015, 161, 460–468. [Google Scholar] [CrossRef]
  84. Marhaento, H.; Booij, M.J.; Rientjes, T.H.M.; Hoekstra, A.Y. Attribution of Changes in the Water Balance of a Tropical Catchment to Land Use Change Using the SWAT Model. Hydrol. Process. 2017, 31, 2029–2040. [Google Scholar] [CrossRef]
  85. Astuti, I.S.; Sahoo, K.; Milewski, A.; Mishra, D.R. Impact of Land Use Land Cover (LULC) Change on Sur-face Runoff in an Increasingly Urbanized Tropical Watershed. Water Resour. Manag. 2019, 33, 4087–4103. [Google Scholar] [CrossRef]
Figure 1. Geographical and digital elevation model maps of Itaperuna municipality, located in the northwestern region of the state of Rio de Janeiro, Brazil.
Sustainability 16 00325 g001
Figure 2. Pedological map of Itaperuna.
Sustainability 16 00325 g002
Figure 3. Subdivision of Itaperuna’s urban sub-basins.
Sustainability 16 00325 g003
Figure 4. Flowchart for the Urban Flood Risk Mitigation model.
Sustainability 16 00325 g004
Figure 5. Maps of Itaperuna’s LULC classes: 2015, on the top; and 2020, on the bottom.
Sustainability 16 00325 g005
Figure 6. Changes in Surface Runoff (m3/hectare) in Urban Sub-Basins of Itaperuna from 2015 to 2020.
Sustainability 16 00325 g006
Figure 7. LULC map of sub-basin 7 in 2015 (a) in comparison to 2020 (b).
Sustainability 16 00325 g007
Figure 8. Landscape transformation in LULC classes within sub-basin 3 from 2015 (a) to 2020 (b).
Sustainability 16 00325 g008
Figure 9. Contrasting LULC classes in sub-basins 6, 14, and 15.
Sustainability 16 00325 g009
Table 1. Curve number values for various soil types (adapted from Tucci [77]).
LULC ClassLULC Code C N A C N B C N C C N D
Water1100100100100
Urban Area293939393
Exposed Soil374849092
Forest436607076
Natural Pasture536607379
Grassland630587178
Table 2. Confusion matrix of 2015 and 2020 LULC maps.
LULC ClassWaterUrban AreaExposed SoilForestNatural PastureGrass-
Land
Overall AccuracyKappa Coeffi-cient
2015User Accuracy100.00%98.63%97.27%94.67%97.34%96.47%96.93%95.67%
Producer Accuracy100.00%93.75%96.35%96.32%96.85%95.48%
2020User Accuracy100.00%97.36%98.26%98.35%98.52%96.64%97.64%96.37%
Producer Accuracy100.00%94.64%96.42%97.63%97.93%95.93%
Table 3. Area (in hectares) of each LULC class in individual urban sub-basins of Itaperuna.
Sub-
Basin
WaterUrban AreaExposed SoilForestNatural
Pasture
Grassland
201520202015202020152020201520202015202020152020
11.681.849.96147.488.687.8410.896.1677.7229.0438.88
20.320.1222.433.7211.127.2817.414.04132.1211837.248.68
31.520.96117.12163.1649.5649.3214.4812.24159.64108.7622.5630.12
416.2415.847.660.3213.848.9227.0823.64113.6100.230.4439.64
511.0412.40.242.560.521.1611.8410.2871.6865.3612.616.2
60.120.046.0810.045.363.8418.5619.52119.64144.4868.1240.04
71.361.12131.16153.6430.7216.810.683.5263.9644.44.8423.24
818.1617.442224.864.526.846.1229.9222.568.616.12
90.20.254.1260.6412.364.8425.3616.2124.48110.562649.68
100.120.2125.48137.1219.1222.437.812.88119.6485.6423.266.4
110.680.4425.9237.727.84.1214.0813.3698.285.9235.5241.44
1216.7216.244.0843.846.082.567.482.2432.7226.081.2417.72
1317.818.687591.622.7613.3623.3615.12136.9613453.3255.68
140.16037.443.844.0414.621.2491.4482.226.8824.64
150.080.082.646.163.043.924.23.56107.72103.4811.0810.8
168.848.246881.4817.9210.9631.887.32213.48202.2836.6866.16
175.524.3615.0827.569.5215.0895.3273.96355.8292.4469.84137.12
Average5.925.7745.2956.2213.3610.6921.6915.65121.60106.1229.2442.50
Total100.5698.12769.88955.8227.04181.8368.8266.042067.161804.08497.16722.56
2.49%2.44%19.10%23.73%5.63%4.51%9.15%6.60%51.29%44.78%12.33%17.94%
Table 4. Surface runoff in urban sub-basins and variations in runoff volume and percentage between 2015 and 2020.
Sub-BasinGenerated Runoff (m3/ha)Variation
20152020m3/haPercentage
1643.09657.2714.182.21%
2650.19669.5319.342.97%
3802.45862.0359.587.42%
4740.49754.8914.411.95%
5651.83673.0121.183.25%
6593.50603.5310.031.69%
7907.76927.3019.532.15%
8862.08861.04−1.04−0.12%
9710.99708.56−2.43−0.34%
10794.11814.8320.722.61%
11668.00691.9023.903.58%
12911.20892.29−18.91−2.08%
13759.23774.0914.861.96%
14598.14609.9111.771.97%
15604.72618.1613.442.22%
16706.93716.249.311.32%
17602.40613.0210.621.76%
Average718.06732.2114.152.03%
Disclaimer/Publisher’s Note: The statements, opinions and data contained in all publications are solely those of the individual author(s) and contributor(s) and not of MDPI and/or the editor(s). MDPI and/or the editor(s) disclaim responsibility for any injury to people or property resulting from any ideas, methods, instructions or products referred to in the content.

