1. Introduction
Indoor air pollution within enclosed spaces is a significant issue that can lead to severe health problems. Particularly in the wake of the COVID-19 pandemic, the focus on IAQ and ventilation has been increased. According to estimates from the World Health Organization, in 2020, indoor pollution was responsible for approximately 3.2 million deaths annually [
1]. Furthermore, it is worth noting that indoor air contaminants are typically 2–5% higher than outdoor pollutants [
2], and people generally spend most of their time indoors, and only a small part of their day is spent in vehicles or outdoors [
3]. Sources of indoor air pollutants vary and can include combustion from vehicles, tobacco smoke, household products, and building materials. These pollutants can have adverse effects on respiratory health [
4,
5], cardiovascular health [
6], and overall well-being.
In recent years, ensuring a safe and healthy learning environment for students has attracted considerable attention. IAQ plays a pivotal role in creating an optimal and safe learning environment for students. A poor IAQ can have detrimental effects on the health, well-being, and academic performance of students and staff [
7]. Given that students spend a significant amount of their time in educational buildings, assessing and enhancing IAQ is essential.
Adequate ventilation and air exchange are considered effective methods to reduce the spread of airborne infections. Implementing proper ventilation measures, such as increasing airflow rates, utilizing high-efficiency air filters, and optimizing ventilation system designs, can significantly contribute to maintaining a good IAQ. Additionally, the integration of air quality monitoring systems is gaining attraction to further enhance IAQ and ensure the safety of occupants.
Generally, there are three methods for ventilation: natural, mechanical, or a combination of both, known as hybrid ventilation, and strategies for mitigating pollutant transmission indoors vary based on the ventilation type employed. For instance, in a naturally or hybrid ventilated room, occupants are advised to enhance IAQ by opening windows, aiming to keep CO
2 levels below 1000 ppm, which is an indicator of acceptable ventilation [
8]. In contrast, mechanical ventilation allows for the precise measurement and control of supply and return airflows, ensuring the desired IAQ level is maintained without the need for occupants to take any specific actions [
5].
However, in a mechanically ventilated environment, occupants can still affect their level of safety with their actions. For instance, if the ventilation rate proves inadequate, occupants can take protective measures, such as wearing masks or practicing social distancing, similar to the measures taken during the COVID-19 pandemic to mitigate the risk of various diseases [
9]. Moreover, ensuring sufficient mechanical ventilation in buildings becomes more important, particularly in winter. At this time of the year, natural ventilation is considerably limited due to cold weather conditions, impacting both thermal comfort and heating expenses. Consequently, the responsibility for air renewal predominantly falls on mechanical ventilation systems [
10].
Furthermore, building simulation tools have become indispensable in assessing and improving IAQ and energy performance. These tools allow researchers and engineers to model different building scenarios, predict IAQ levels, and optimize ventilation strategies. Through simulations, various mitigation measures can be evaluated to determine the most effective strategies for improving IAQ while minimizing energy consumption.
In the pursuit of assessing and improving IAQ, CONTAM has emerged as a practical tool. Developed by the National Institute of Standards and Technology (NIST), CONTAM is widely recognized as a reliable IAQ modeling software. Its appeal lies in its user-friendly interface and specialized focus on contaminant transport in multi-zone environments. CONTAM’s capabilities extend to assessing contaminant dispersion, ventilation rates, and airflow patterns within indoor spaces. It allows researchers to model various scenarios and implement strategies to improve IAQ, making it a preferred tool in IAQ assessments and research. Therefore, researchers find CONTAM to be a reliable and accessible tool for simulating complex indoor environments and understanding pollutant dispersion [
11,
12,
13,
14,
15].
In this regard, Sung et al. [
16] conducted a study on the IAQ of three school classrooms with varying ages (10, 20, and 80 years old), employing both real measurements and CONTAM simulations. The primary focus was on PM
2.5 as the main contaminant, with additional measurements of indoor CO
2 concentrations. The study explored the impact of different refurbishment measures on IAQ, including window and door replacements, improved wall airtightness, and the implementation of mechanical and natural ventilation and filtration.
Another study investigated the influence of energy efficiency measures on IAQ and air penetration rates in nursery, primary, and secondary schools in London, utilizing CONTAM for analysis [
17]. In Trondheim, Norway, a study on an office building focused on PM
2.5 pollution using CONTAM and EnergyPlus co-simulation [
18]. Budaiwi and Mohammed [
19] utilized CONTAM to assess energy efficiency techniques in a mosque and an auditorium, evaluating IAQ based on pollutants like CO
2 and formaldehyde (HCHO).
Mannan and Al-Ghamdi [
20] conducted a comprehensive review of global IAQ studies, categorizing them into residential and commercial buildings, including educational buildings and offices. They emphasized the need for detailed studies on indoor contaminant sources and building materials while highlighting the importance of adhering to standardized regulations in future research.
Various researchers, such as Shrestha et al. [
21] and Yan et al. [
15], employed CONTAM in multi-zonal studies within office buildings, considering different strategies to reduce the risk of SARS-CoV-2 infection and identifying effective methods for controlling contaminant dispersion. Furthermore, Malki-Epshtein et al. [
22] monitored the CO
2 concentration in ten large venues in the UK to evaluate the IAQ and ventilation rates and analyze the transmission risk of SARS-CoV-2. Harrington et al. [
23] studied the probability of infection of SARS-CoV-2 in ten classrooms in the UK, considering the actual and designed ventilation rates and mask-wearing.
In the present study, the IAQ of a college building in London is assessed by utilizing real-time monitoring data of CO2 concentrations and CONTAM simulation. The actual ventilation rates are calculated and compared to the recommended rates outlined by various regulations. Subsequently, the study analyzes the impact of adhering to these recommendations on IAQ and the probability of SARS-CoV-2 infection in the most occupied rooms, including classrooms and laboratories. Additionally, the study explores the efficacy of different scenarios involving hybrid ventilation, such as opening windows and doors, by comparing CO2 levels as an indicator of ventilation adequacy. Finally, the transmission risk of the virus is evaluated through the application of mechanical ventilation, hybrid ventilation strategies, and the installation of air cleaners.
2. Materials and Methods
2.1. Case Introduction
This study is focused on enhancing the IAQ in London College, which is located in Hounslow Borough of London. The building has three stories with a total area of 2500 m2. Each floor’s height is 2.8 m, excluding the Plenum. The plenums above each level housing the ductwork of ventilation are 80 cm deep. The building operates throughout three semesters (autumn, spring, and summer), remaining open for the majority of the year. The building comprises a total of 11 classrooms and 6 laboratories, which are the most occupied zones. The remainder of the building mainly includes offices, library, canteen, and bathrooms. The focus of this study will be specifically on the classrooms and laboratories, as it is crucial to provide high-quality indoor air for the students who spend many hours in these zones.
In the plant room, an air handling unit (AHU) supplies the building with 100% outdoor air. Additionally, extractor diffusers are installed in the canteen and bathrooms. The return air flows through open spaces on the ceiling, passing through the plenum. The building’s windows are fixed to mitigate noise pollution from the nearby Heathrow Airport. Nevertheless, this study aims to explore hypothetical scenarios involving the opening of these fixed windows. The objective is to evaluate potential enhancements in IAQ and to offer insights into comparing the performance of mechanical and hybrid ventilation systems.
The college’s annual timetable is used as a reference to accurately define schedules of each classroom and laboratory throughout each semester. According to this timetable, classes are conducted six days a week, excluding Sundays. The college’s annual timetable is used to accurately define schedules of each classroom and laboratory during each semester. According to the timetable, the classes are held 6 days a week except for Sundays. During peak periods, some classrooms accommodate three consecutive classes from 9:30 to 18:30. However, based on actual observations and measurements, it is noteworthy that the number of students is often considerably lower than the class capacity, typically ranging from 15 to 30 students, while only 10 to 15 students regularly attend the classes.
Although this fact helps the IAQ to stay in the safe level (CO
2 concentration less than 1000 ppm) in most of the times, in the current study, the peak number of occupants who may occupy the rooms in some days will be considered in presenting the results and applying IAQ enhancement methods.
Table 1 summarizes the characteristics of the most occupied rooms in the building during summer semester, which will be used in the analysis.
2.2. Actual Ventilation Rate Calculation Method
As mentioned earlier, the AHU operating with 100% outdoor air provides fresh air to the building through supply diffusers in each zone. In order to model the building accurately in CONTAM, the actual ventilation rate needs to be determined. In this regard, CO
2 concentration is considered as the tracer gas because it cannot be removed by any filter, necessitating the replacement of air with fresh air to reduce its concentration. According to this approach, achieving a 63% decrease in CO
2 levels in a room corresponds to one complete air change [
24,
25]. In this method, the following equation [
26] is used to calculate the air change rate of a room:
where ACH
63% is the ACH of the room based on 63% reduction in CO
2 level,
is the time when 63% reduction has achieved,
is the time when CO
2 is at the peak. Moreover,
is the CO
2 level after 63% reduction,
is the peak CO
2 level, and
is the ambient CO
2 level which varies around 400 ppm and is usually assumed 400 ppm [
23].
One of the objectives of this study is to compute the ventilation rate of the diffusers. To achieve this, is taken into account during periods of room vacancy (no active CO2 generation). During these times, with doors and windows closed, the only way of diluting the CO2 is by mechanical ventilation.
In the initial stage of calculating the ACH, the CO2 level in the rooms should be measured. Therefore, Netatmo data loggers equipped with Non-Dispersive Infrared (NDIR) CO2 sensors were strategically installed in two classrooms and a laboratory, all of which are active during the summer semester. It should be noted that the careful selection of monitoring locations significantly affects the accuracy of the results. The rationale behind opting for classrooms and the laboratory, as opposed to offices, cafés, or the canteen, lies in their structured timetable, providing clarity on when they are fully unoccupied. Additionally, the frequent closure of doors during occupied periods in these spaces suggests that CO2 removal primarily relies on the ventilation system. Furthermore, the chosen zones are situated on the first and second floors of the building, where summer classes are conducted. Moreover, simultaneous occupation of all three spaces on Saturdays enhances the reliability of result comparisons.
Taking these into account, classrooms 112C and 214C, as well as the electronics laboratory (210EL) on the second floor, were selected to measure their CO2 level from 9 May to 10 July 2023. To ensure consistent data collection, the sensors were positioned at a height of approximately 1.2 m from the floor and maintained a minimum distance of 1.5 m from any openings (such as doors) and occupants. Data were collected at 5 min intervals throughout the weeks. According to the college’s timetable for summer semester, classes are held once a week in classroom 214C and the 210EL laboratory (on Saturdays) and five days a week in classroom 112C.
2.3. Guidelines for Ventilation Rate of Educational Buildings
In order to keep the indoor air of the buildings safe and comfortable, various regulations are considered to ensure the well-being of the building occupants. Ventilation rate guidelines for educational buildings can differ based on factors such as the country, region, and the specific type of educational facility, encompassing schools, universities, nurseries, and more.
In this regard, CIBSE guide A [
27] recommends a minimum ventilation rate of 10 L/s per person with outdoor air supply for various spaces in educational buildings, including corridors, classrooms, laboratories, etc. This guideline is established to ensure occupant comfort, and in the case of presenting a source of contamination, more ventilation will be required based on the equation presented in the guideline. Thus, the recommended minimum amount should be provided to the building in the best-case scenario. Moreover, Building Bulletin 101 guidelines [
8] set out a minimum requirement of 8 L/s per person or 2.3 L/s per area, whichever is greater, to maintain health and hygiene standards in classrooms.
Furthermore, the ANSI/ASHRAE 62.1 standard [
28] specifies that the breathing zone outdoor airflow should not fall below the value determined by the following equation:
where
is outdoor air rate per person (L/s∙p),
is zone population,
is outdoor air rate per area (L/s∙m
2),
is zone floor area (m
2). The amount of
and
classrooms with students aged 9 plus and computer labs are 5 L/s∙p and 0.6 L/s∙m
2, respectively, while for university/college laboratories are 5 L/s∙p and 0.9 L/s∙m
2, respectively.
This study involves comparing the current condition of London College with established guidelines. Subsequently, the ventilation rate will be adjusted to the highest recommended level in the building model to examine its effects on both CO2 concentration and the probability of SARS-CoV-2 infection.
2.4. Building Modelling in CONTAM
Various contaminants with flexible schedules and generation rates can be defined in CONTAM. Modeling in CONTAM enables a detailed analysis of airflow patterns within a building and the movement of contaminants through cracks, ducts, and leakages through comprehensive simulations.
The IAQ modeling in CONTAM relies on a combination of a multi-zone airflow model and mass balance equations. This modeling approach involves multi-zonal analysis where different indoor areas are interconnected and can have varying boundary conditions. In this regard, an airflow network representation, including building components such as rooms, doors, windows, and ventilation systems, is used to analyze airflow dynamics influenced by factors such as pressure differences, mechanical mechanisms, external wind forces, and temperature variations.
CONTAM’s modeling approach is basically based on mass balance equations, which track the transport and mixing of air and contaminants between various zones and ambient [
12]. These equations can also be categorized for contaminant and airflow analysis. In this regard, the model utilizes Equation (4) as the basis for contaminant dispersal analysis, derived from the conservation of mass for all species in a control volume.
In Equation (4),
is the rate of air mass flow from control volume i to j.
is removal coefficient,
is species generation rate,
is the filter coefficient in the path,
is the kinetic reaction coefficient between species α and β, and
is the concentration of contaminant α in control volume i.
Furthermore, the infiltration and exfiltration flow rates through leakages are calculated using a power law equation (Equation (5)), which takes into account various factors, including flow discharge coefficient, leakage area, and pressure differences.
where
is flow discharge coefficient,
is leakage area,
is the air density,
is the reference pressure difference,
is the indoor-outdoor pressure difference, and n is the flow exponent. Further details about the CONTAM model’s theoretical background can be found in [
12].
2.4.1. Assumptions and Inputs
The main assumptions considered in the building model are as follows:
All zones are well mixed, and contaminant level, temperature, airflow, etc, are the same in the whole zone.
Airflow from the interior and exterior wall leakages are defined in three elevations to capture the stack effect.
Plenums are separate floors, and all three of them have the same structure.
Exhaust fans are operating in the kitchen and bathrooms.
Return airflows are defined in the plenums, and the air flows to the plenum through the cracks in the ceiling (which connects to the plenum).
London Test Reference Year (TRY) weather file from The Chartered Institution of Building Services Engineers (CIBSE) is used.
Simulation time step is 5 min.
CO
2 and SARS-CoV-2 initial levels (ambient concentration) are 400 ppm and 0 quanta/m
3, respectively. A quantum is defined as a dose of virus that can infect a susceptible person [
29,
30,
31].
The virus sources present in the zones during the occupied times.
CO
2 and SARS-CoV-2 generation rates are 0.0042 L/s [
32] and 65 quanta/h [
15,
29].
The deposition and deactivation rates of SARS-CoV-2 are assumed to be 0.24 h
−1 [
33] and 0.63 h
−1 [
34], respectively.
Removal rate of the air cleaner is 0.003 s
−1 [
35].
In order to assess the SARS-CoV-2 transmission risk in the rooms, the study employs the Wells–Riley equation [
11,
15], which has been widely used in previous research. Wells–Riley equation is presented in Equation (6):
where
is the probability (or risk) of infection,
is the infection cases,
is the number of susceptibles, I is the number of infectious sources (infectors), p is the pulmonary ventilation rate of a person (breathing rate) per hour, q is the quanta generation rate per hour, t is the exposure time to the certain microorganism (in hours), Q is the room ventilation rate, and
is the number of quanta that have been inhaled.
In Equation (7),
is the mask inhale efficiency,
is the percentage of mask-wearing, and C is the quanta’s concentration (quanta/m
3). In this study, considering a light activity (whispering and speaking) level for occupants, p is assumed to be 0.75 m
3/h [
36]. The building model in CONTAM has been validated by comparing the results with measured CO
2 levels using NDIR sensors installed in the building which has been explained in the authors’ previous paper [
37].
2.4.2. Hybrid Ventilation in Building Model
Considering that there are no certain regulations recommending the precise duration and time, frequency, or fraction of windows or doors opening, this study explores various assumptions and scenarios to assess the impact of these actions on the IAQ.
One objective is to keep the number of opened windows at minimum considering the building energy efficiency which decreases by allowing more air from the outdoor. Moreover, windows are only partially opened during occupied times to avoid more energy loss by fully opening them and making it more feasible in real life to keep them open for a long time (class duration). Considering the building energy efficiency, the starting time of opening the windows and doors in a room that was unoccupied for hours should be around the time that the CO2 is going to reach 1000 ppm and not earlier.
Two key parameters can be changed regarding the window opening: 1. Time: indicating when and for how long the window opens; 2. Fraction: representing the fraction of the airflow from the window into the room. Taking this into account, various scenarios are defined with only one changing factor between every two of them to understand the role each of these factors plays in the room IAQ. Two groups of scenarios are considered. The first group is in the absence of active contaminant sources. The examining factor between each of two scenarios in group one is explained in
Table 2.
The second group is when sources of SARS-CoV-2 virus are presented in the rooms. In this group, hybrid ventilation operating with CIBSE recommended ventilation rates. Scenario E is the base scenario of the second group which is similar to scenario C with only difference in mechanical ventilation rate. In scenario F, starting time of opening is from beginning of the classes until the end. Finally, in scenario G, the fraction of opening increases to 50%. All of the second group scenarios are designed for the extreme conditions of multiple sources of virus in the rooms.
3. Results
3.1. Building Actual Ventilation Rate
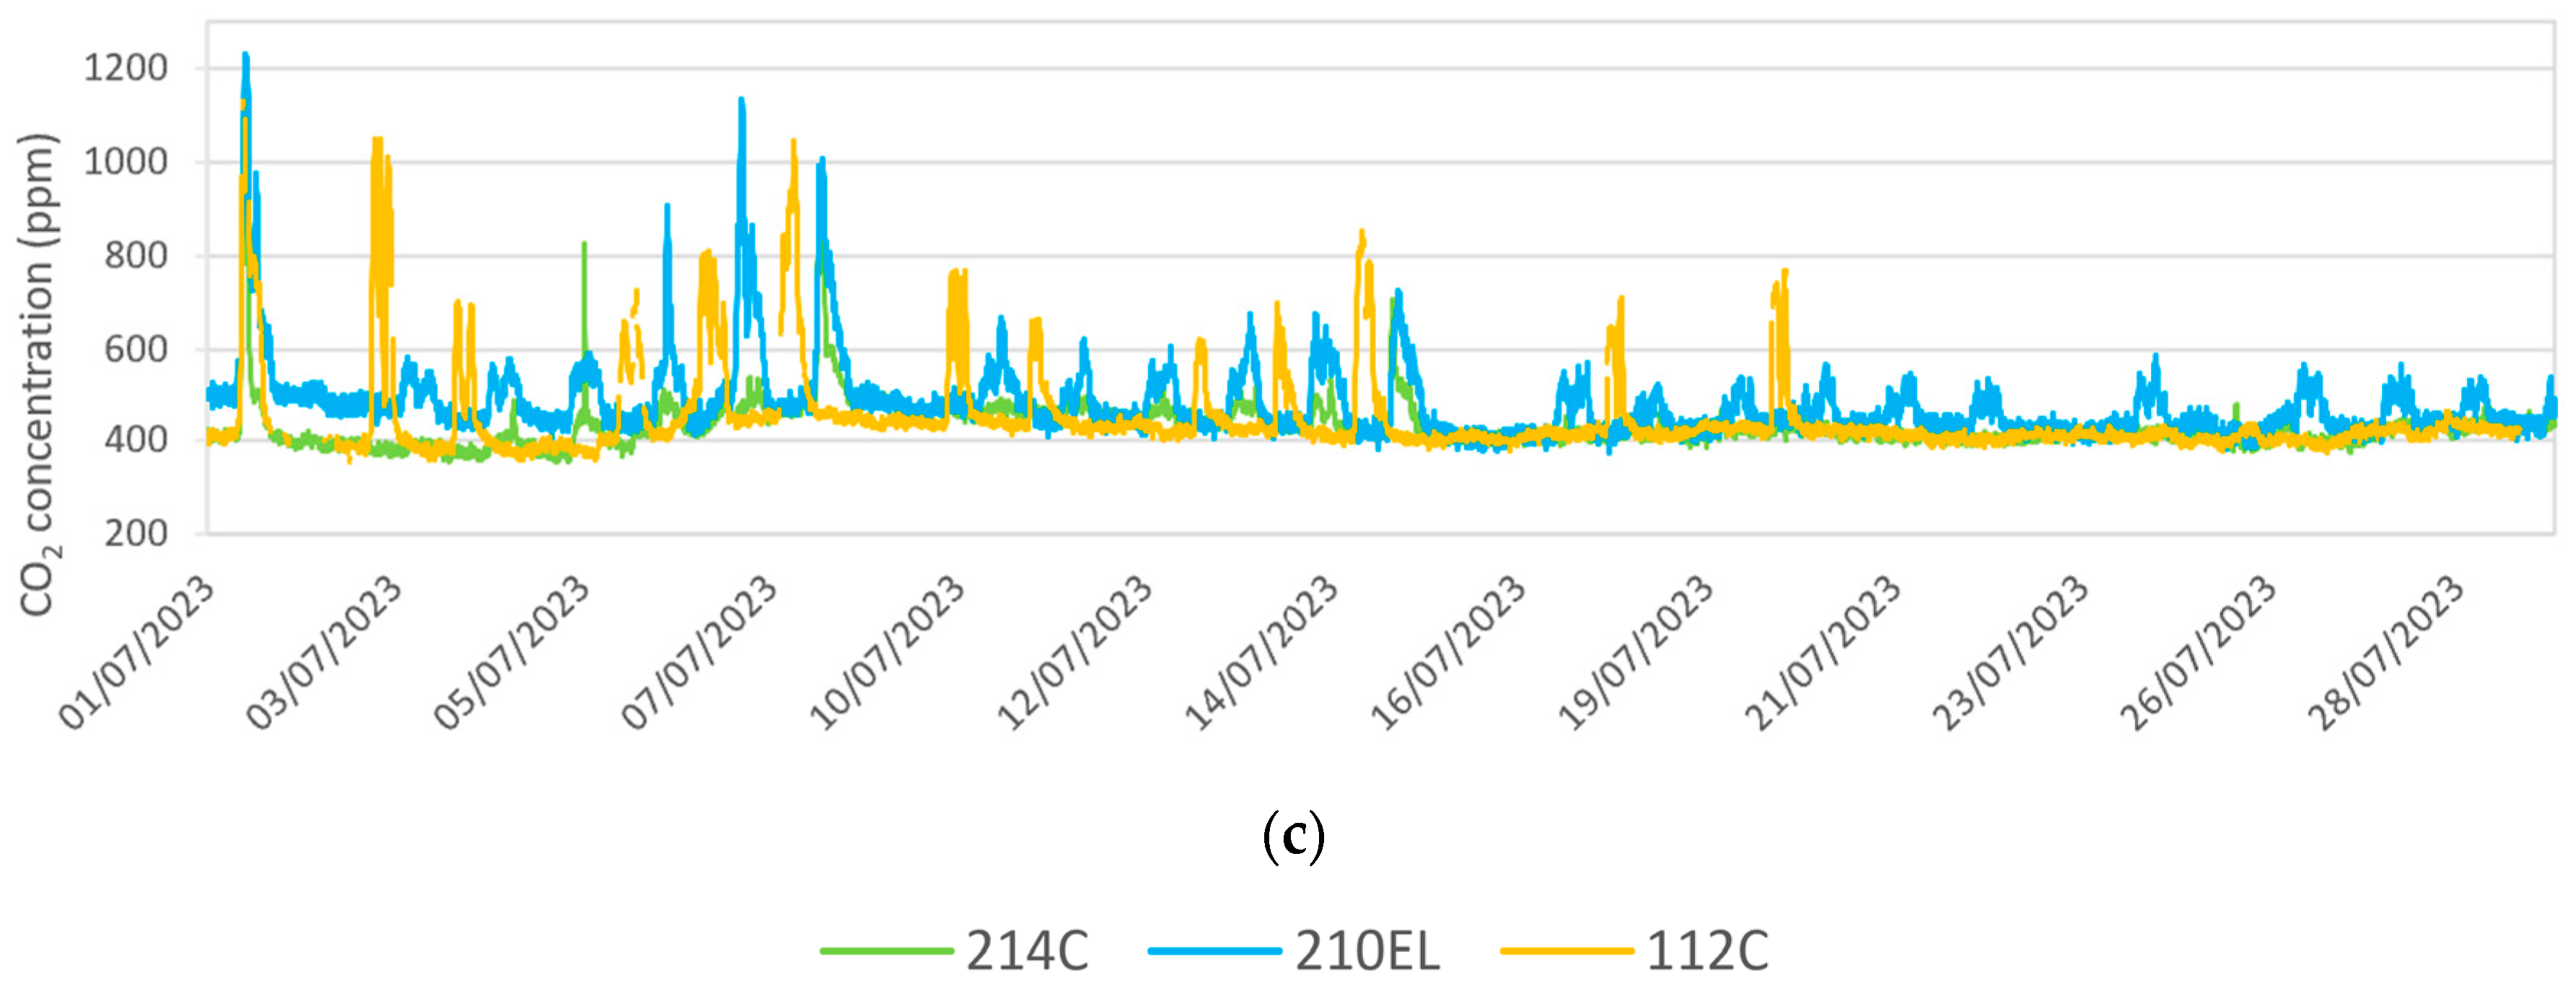
First of all, employing the method described in
Section 2.2, the ACH for the three zones where the sensors were installed was calculated over a span of two months.
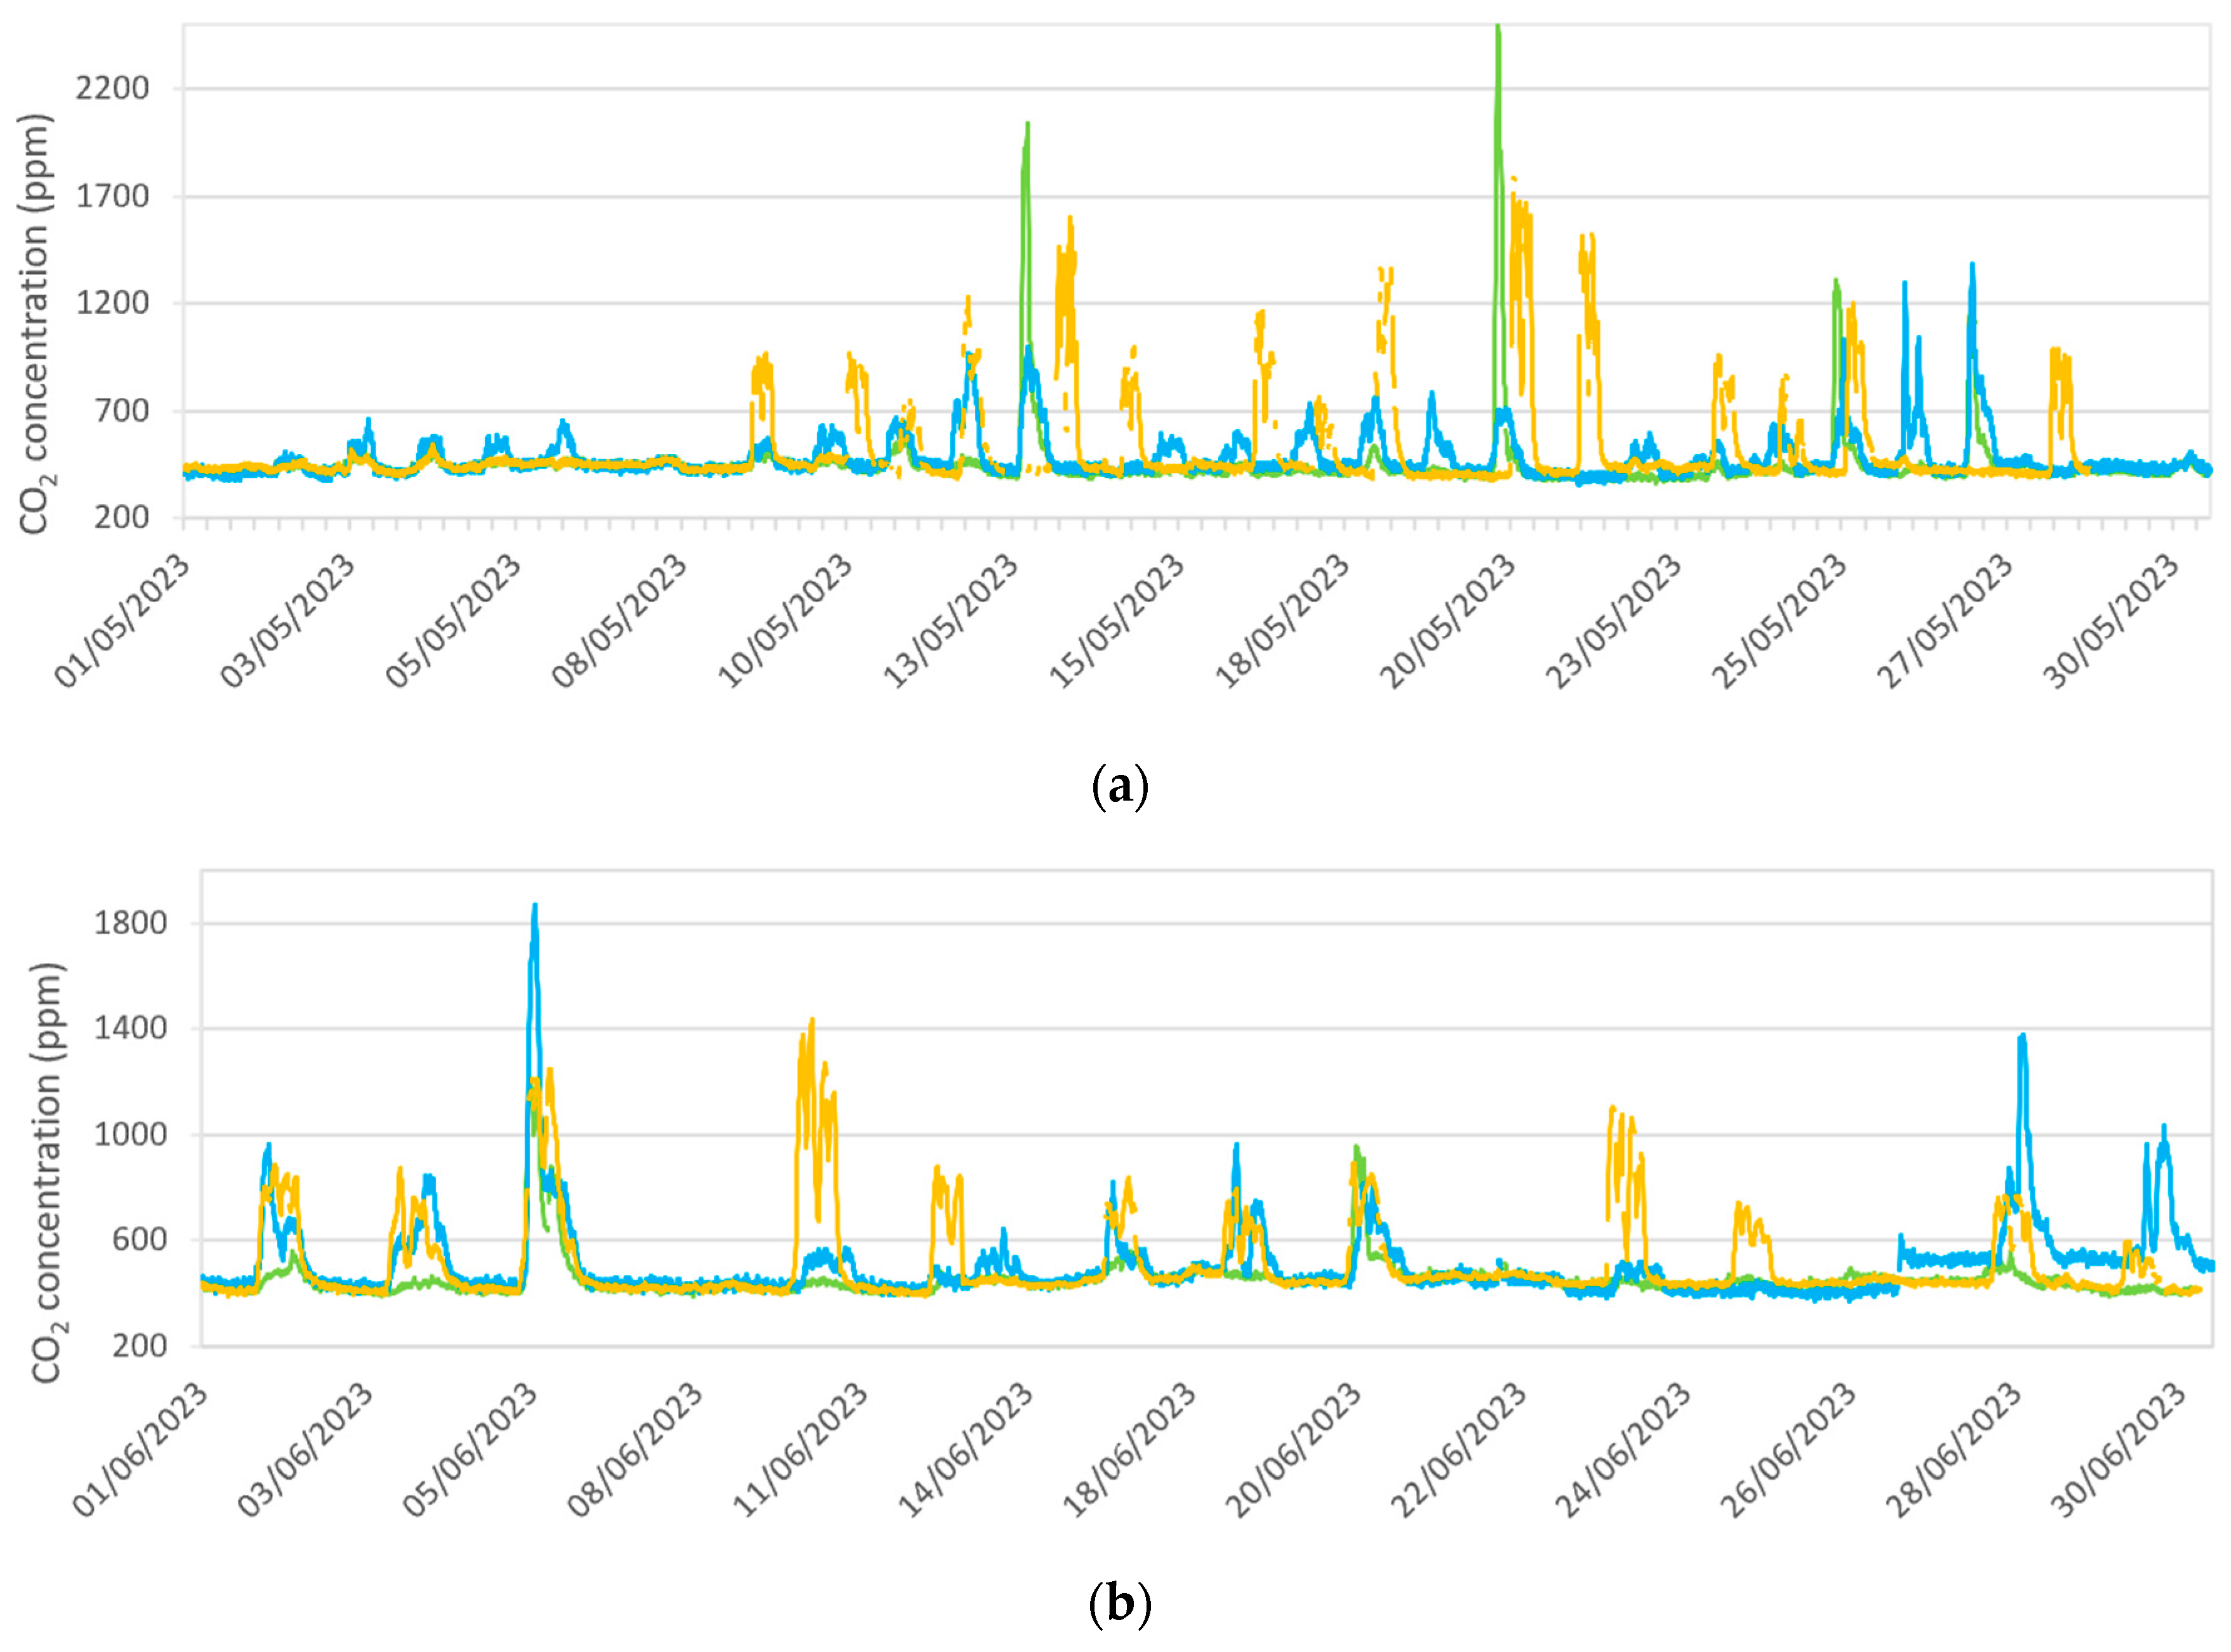
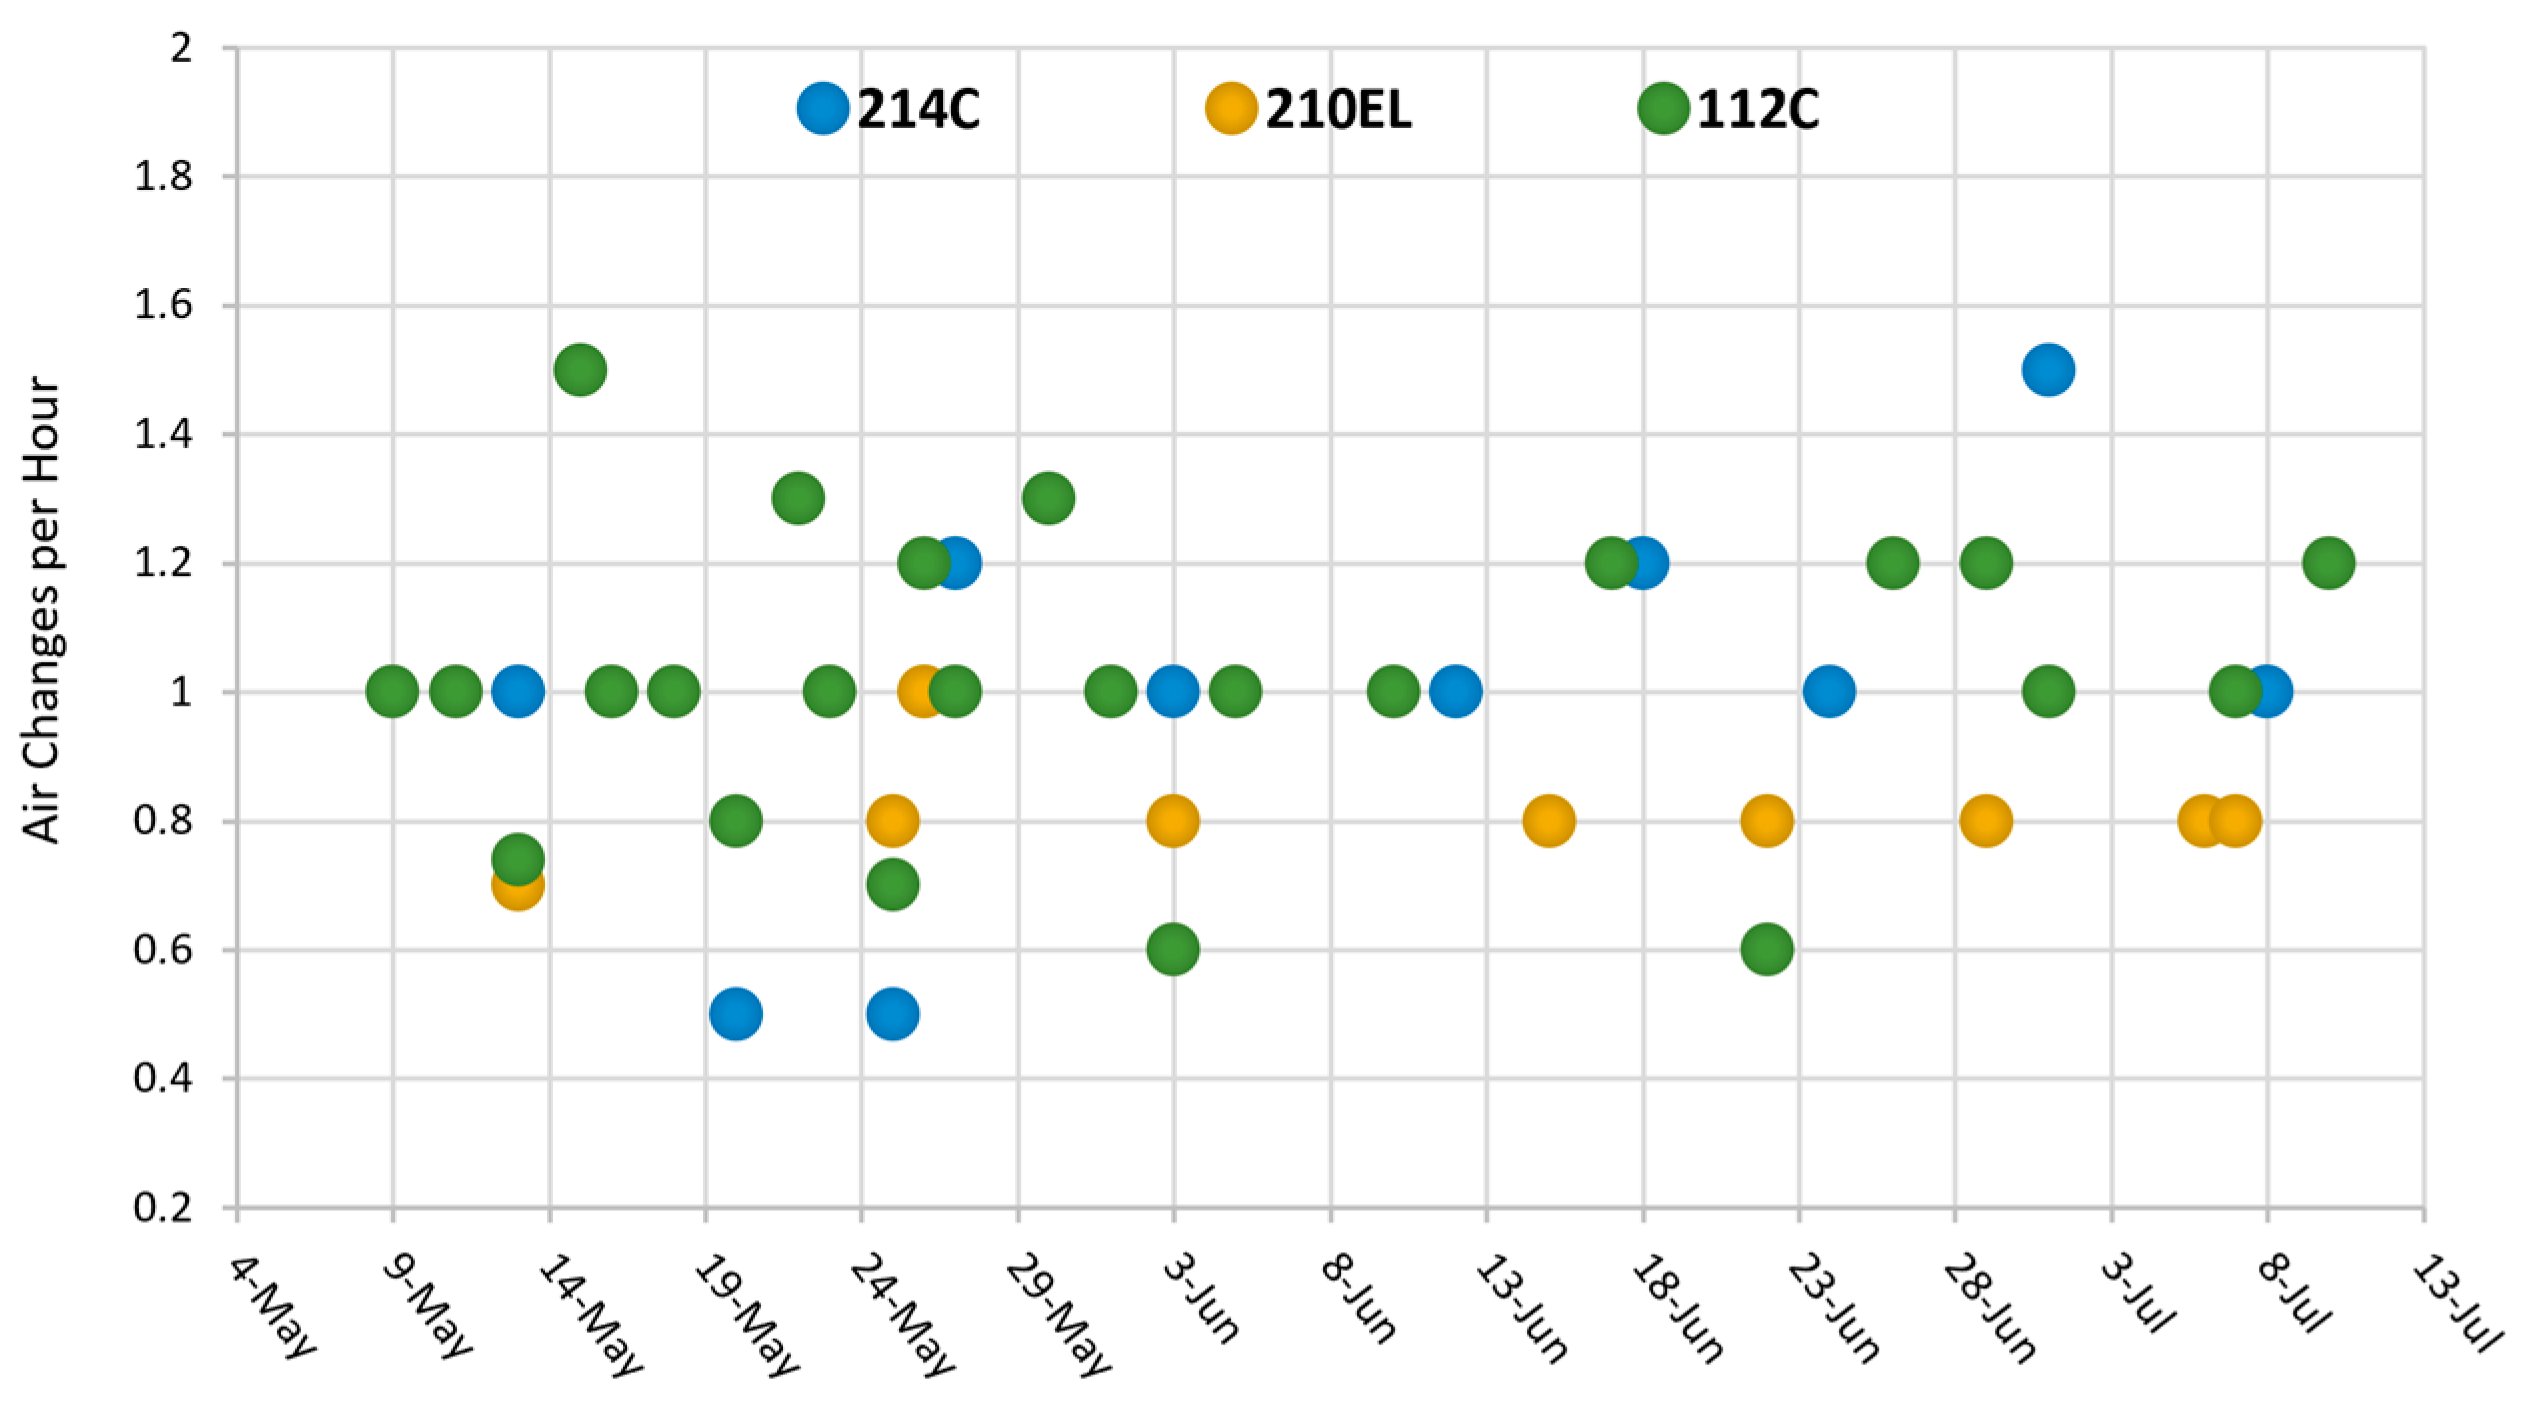
Figure 1 shows the measured CO
2 level in classrooms 112C and 214C, as well as laboratory 210EL, throughout the summer semester.
The ventilation rate of the AHU is not consistently constant, as it is manually set each day by the site engineer. However, on most days, it is ranged around a specific rate.
Figure 2 illustrates the results of the actual ACH for the zones. In calculating the ACH, it is assumed that the doors are closed (as it is most of the time), and the only way of air exchange in the room is through the AHU.
Based on the results, the ACH in classrooms is typically 1, while in the laboratory, it is around 0.8 on most days. Although the ACH can fluctuate within a single day, Mondays generally exhibit higher values. However, for simulation purposes, the most common ventilation rate is considered due to uncertainties in human-related decision-making processes, such as adjusting the ventilation rate or opening doors, which are not easily predictable.
Surveys conducted in the college and the building’s floor plan indicate that each classroom contains five diffusers with similar volumes, while the laboratory has three diffusers and is smaller than the classrooms. Consequently, the difference in their ACH leads to an equal rate for each diffuser. By determining the rate of each diffuser and considering the number of diffusers in each room, the total ventilation rate for the building is calculated to be approximately 1446 L/s.
3.2. IAQ in the Building’s Current Condition
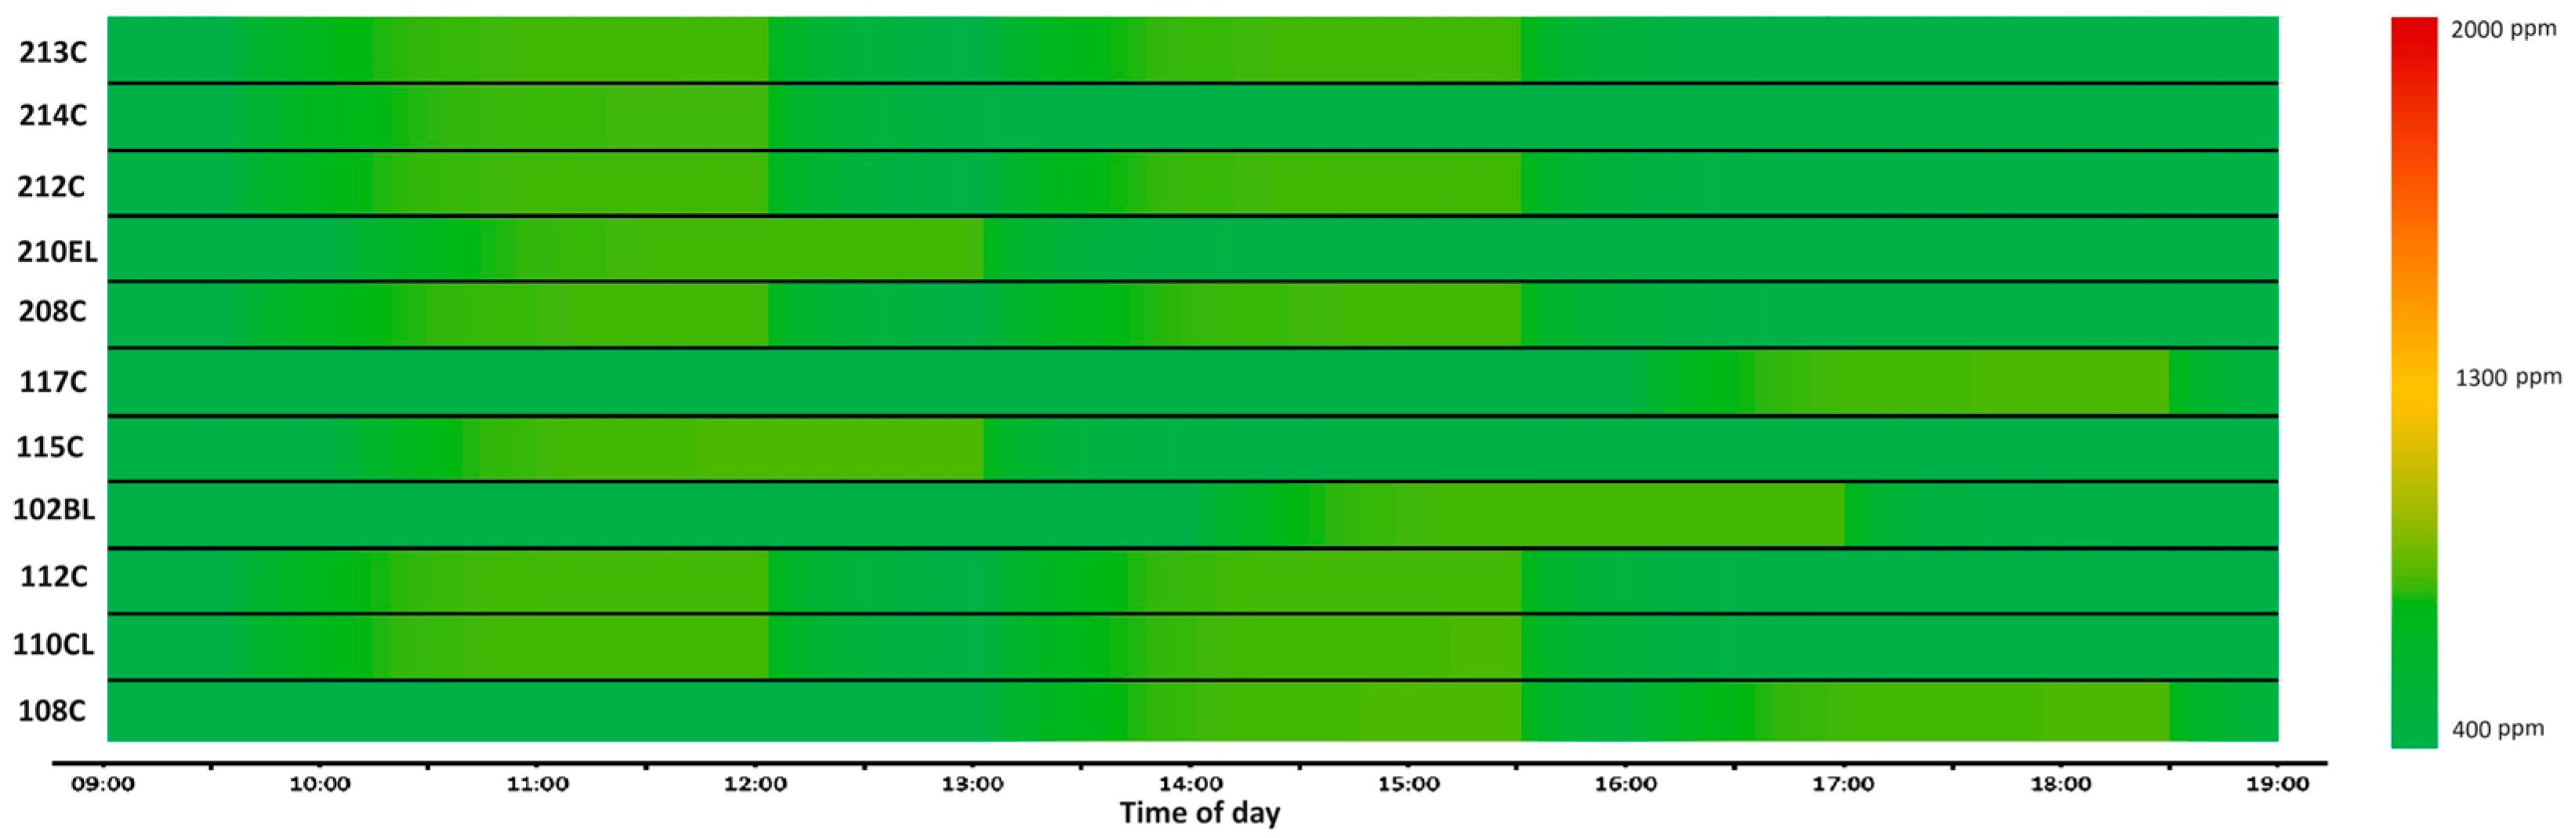
The schedules and peak number of occupants are the same during the semester, resulting in similar CO
2 concentrations and probabilities of SARS-CoV-2 infection during occupied periods over the three-month period. Consequently, a typical week within this timeframe is selected to compare the results for the chosen zones. In this weekly period, a total of 30 classes are conducted in classrooms and laboratories.
Figure 3 illustrates the distribution of these classes throughout the weekdays based on average and maximum CO
2 levels falling within various bands, ranging from 700 ppm to over 2000 ppm.
As depicted in
Figure 3, the majority of rooms (24 out of 30) exhibit average CO
2 levels between 1101 and 1500 ppm, while the maximum level in 21 out of 30 classes falls within the range of 1501 to 2000 ppm. Furthermore, the maximum values are never less than 1100 ppm.
In order to indicate the IAQ in the current condition of the building, the busiest day of the semester, which is Saturday, is selected to illustrate the CO
2 levels during the occupied period, as shown in
Figure 4.
The figure reveals that in classrooms where two consecutive classes are conducted, the CO
2 levels between the two classes, which take 1 h, do not completely drop below 1000 ppm. Additionally, rooms 212C, 210EL, 117C, and 102BL exhibit inferior IAQ compared to other rooms, as evidenced by the more pronounced red area in
Figure 4. Considering CO
2 level as an indicator of ventilation, both
Figure 3 and
Figure 4 highlight the inadequate ventilation in the building, emphasizing the need for improvement.
3.3. Guidelines’ Recommended Ventilation Rates for the Building
Having the information of the classrooms and laboratories from
Table 1 and the guidelines discussed in
Section 2.3, the recommended values of ventilation rate for rooms are calculated, which is presented in
Table 3.
According to
Table 3, the actual ventilation rate in the building falls significantly below all of the recommended levels, indicating a need for improvements in the current conditions. Among the recommendations, CIBSE guide A is more stringent than the others. Thus, as part of the effort to enhance ventilation, this guideline will be prioritized. In this regard, the ventilation rates in the rooms were increased by 2–5 times until they met the CIBSE requirement, the results of which are depicted in
Figure 5.
In this scenario, all rooms maintain a CO2 level of around 800 ppm during occupied times. This outcome demonstrates the effectiveness of the applied guidelines in ensuring adequate fresh air supply, particularly in the absence of active contaminant generation sources within the rooms.
3.4. IAQ with Hybrid Ventilation
Based on the results obtained with a 5-min simulation time step, it was observed that in the first classes of the day, in rooms where the CO
2 level begins at 400 ppm, it takes a minimum of 30 min to reach a CO
2 level exceeding 1000 ppm. Therefore, the initiation of window opening is designated at 25 min when the CO
2 level across all rooms is below 1000 ppm, representing the best time to boost the ventilation. Considering this, the scenarios outlined in
Section 2.4.2 are summarized in
Table 4. The analysis of results for the second group of scenarios, which involves active sources of the virus within the rooms, will be expounded upon in
Section 3.5.
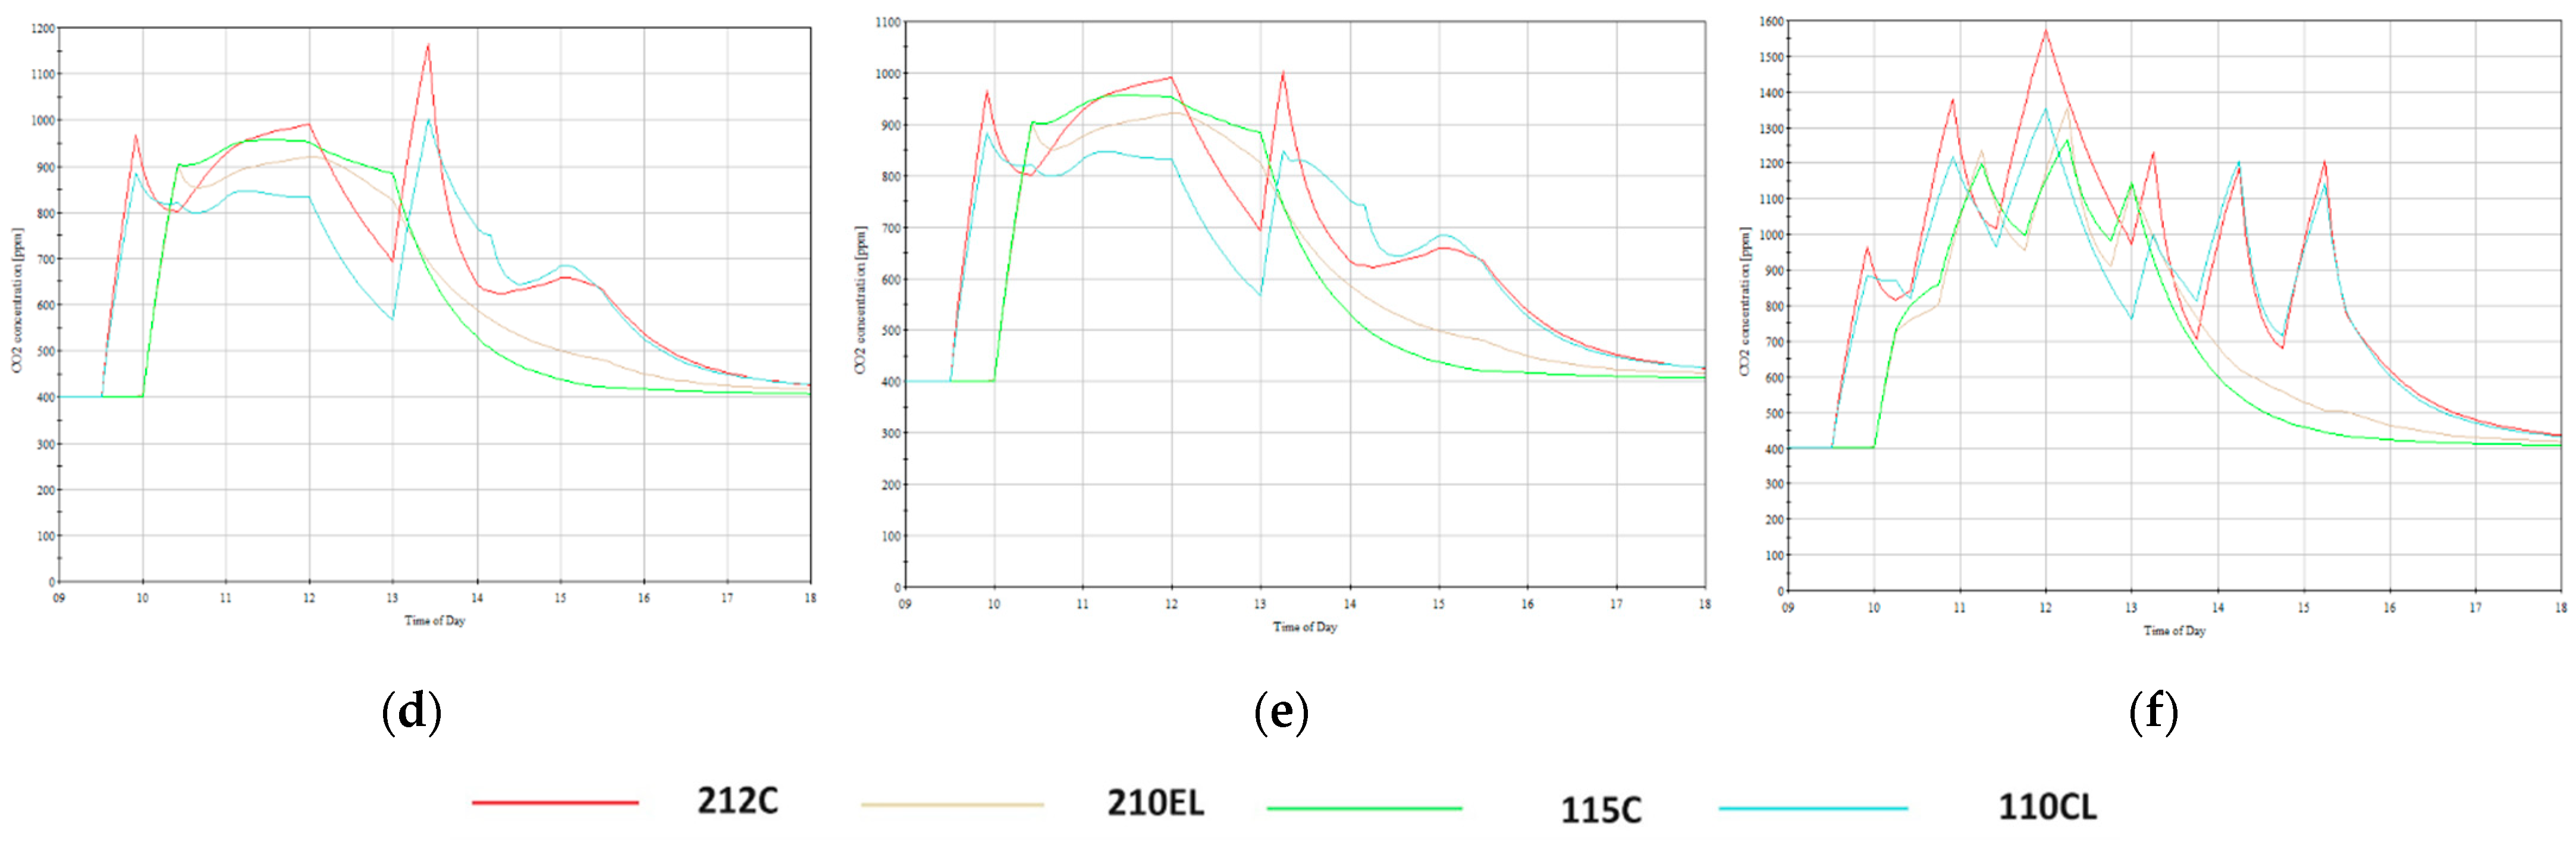
To analyze the impact of different factors on the performance of hybrid ventilation, the CO
2 levels in four selected rooms, namely 110CL, 115C, 210EL, and 212C, on the first and second floors, are illustrated in
Figure 6. According to
Figure 6a, classroom 212C exhibits the highest CO
2 concentration compared to the other three zones under the building’s current condition (when only the building’s actual ventilation is active). In
Figure 6a, classrooms hosting two consecutive classes between 9:00 and 18:00 display two peaks (212C and 110CL), while those with only one class exhibit a single peak (115C and 210EL).
In order to analyze the results of hybrid ventilation in the first group of scenarios, as graphically depicted in
Figure 6, the average and maximum CO
2 levels in the rooms were calculated and are presented in
Table 5. The highest CO
2 level in the current condition happens in the first class of 212C room, reaching a maximum of 2198 ppm. However, in the second class of this room, the average CO
2 level is the highest among all four rooms. When the baseline scenario is applied, the average amounts in three classes (in rooms 212C and 110CL) drop to below 1000 ppm, with the most and least reductions in average CO
2 occurring in the second class of 212C and 115C, having 44% and 0.24% reduction, respectively.
The impact of keeping a window constantly open versus opening it along with the door for 30 min every hour on the CO2 level is evident in the comparison of scenarios Z and A, where all other factors remain constant. In this case, the average amount in all the classes except 115C was reduced to below 1000 ppm, but the maximum values still need further reduction to achieve acceptable IAQ. The maximum amounts in scenario A compared to scenario Z are reduced the most in the first class of 212C (31%) and the least in 110CL (first class: 9%, second class: 2%), resulting in an average reduction of 18% in maximum CO2 levels across all four classes.
Comparing scenario A to B reveals that increasing the fraction of opening to 0.3 in scenario B leads to an 11% average reduction in maximum levels. While average CO2 levels fall below the limit in all classes, the maximum amount exceeds the limit in the second class of 212C and 110CL. Adjusting the starting time of opening in second classes in scenario C results in additional CO2 level reduction, achieving the desired condition in all classes. In this case, the maximum CO2 levels, compared to the current condition, are reduced by the most (55%) in the first class of 212C and the least (37%) in 115C, with an average reduction of 49%.
Furthermore, comparing the performance of intermittent and continual opening of the door and window in scenarios C and D reveals that, although average CO2 levels are almost acceptable, they still exceed the limit for more than 1 h. Overall, the practice of keeping a window open during occupied times is superior to the strategy of opening and closing it every 30 min, even when the doors are open simultaneously. Nevertheless, if the window cannot remain open throughout the occupancy period, a recommended alternative is the installation of CO2 sensors in the rooms. This solution highlights the occupant’s role in improving the IAQ by assisting them in identifying when CO2 levels exceed 1000 ppm, prompting them to open windows or doors more efficiently.
3.5. SARS-CoV-2 Transmission Risk (Probability of Infection, P)
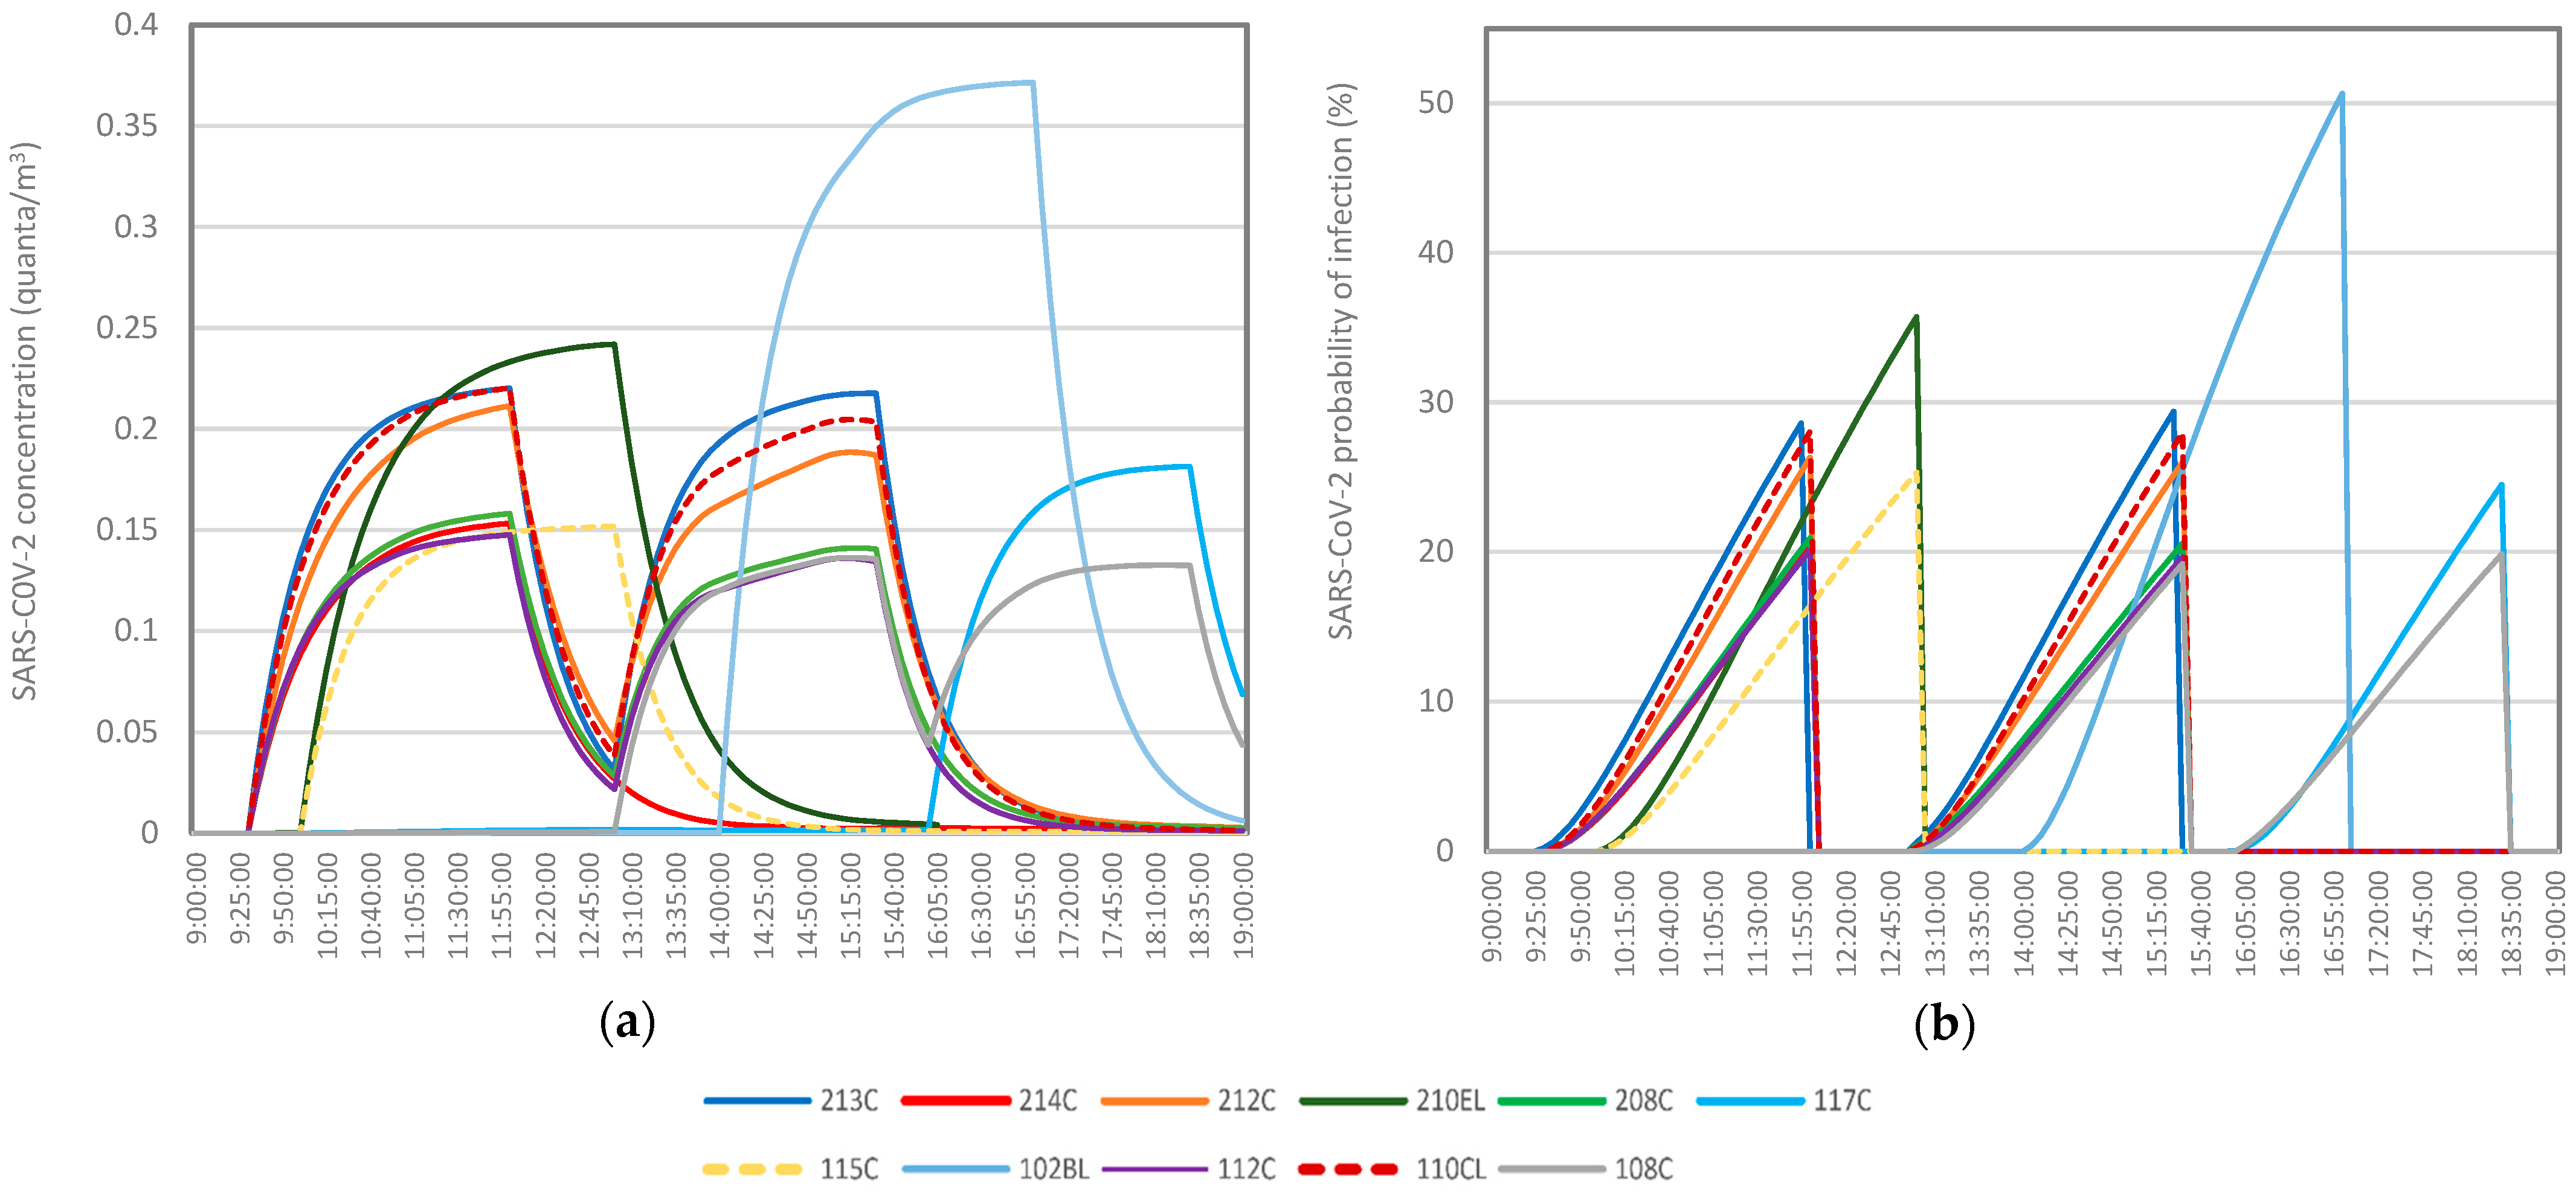
The virus source has been modeled in CONTAM with the same schedule as the occupants’ presence, and the results for its concentration in the building’s current condition when one infector is present in the most occupied zones are shown in
Figure 7a. Furthermore, the P is calculated using Equations (6) and (7), which is presented in
Figure 7b. The P is calculated when the rooms are occupied, and the exposure time to the virus equals to the duration of each class, which varies between 2.5 h and 3 h. In classrooms where two classes are held in a day, the second class, which showed a higher P
mean, is selected as the worst case. The number of infectors is increased to two and five in the CONTAM model using the ‘multiplier’ option.
Table 6 compares the maximum and average P under different ventilation scenarios in the rooms with the highest virus concentration. As P increases with longer exposure times (until the class ends), the maximum values indicate the worst-case scenario if infectors stay in the room for the entire class duration. In cases relying only on mechanical ventilation, the highest P occurs in room 102BL, which indicates it requires increased ventilation, which could be achieved by implementing additional supply diffusers. Otherwise, hybrid ventilation can be an alternative, as shown in
Table 6, where the room exhibits a situation similar to the rest of the zones.
According to
Table 6, transitioning from the building’s actual ventilation to CIBSE recommended rates leads to about 48% reduction in the average transmission risk (P
mean) when one infector is present, while this value becomes about 43% and 34% for two and five infectors. Therefore, an increase in the number of infectors makes mechanical ventilation less effective in cleaning the air, which highlights the need for further actions in extreme conditions. Furthermore, results revealed that applying CIBSE recommendations leads to a decrease in the maximum values of P with one infector, ranging from 40% to 53% in all zones. Consequently, in the next step, CIBSE rates are combined with natural ventilation under three scenarios.
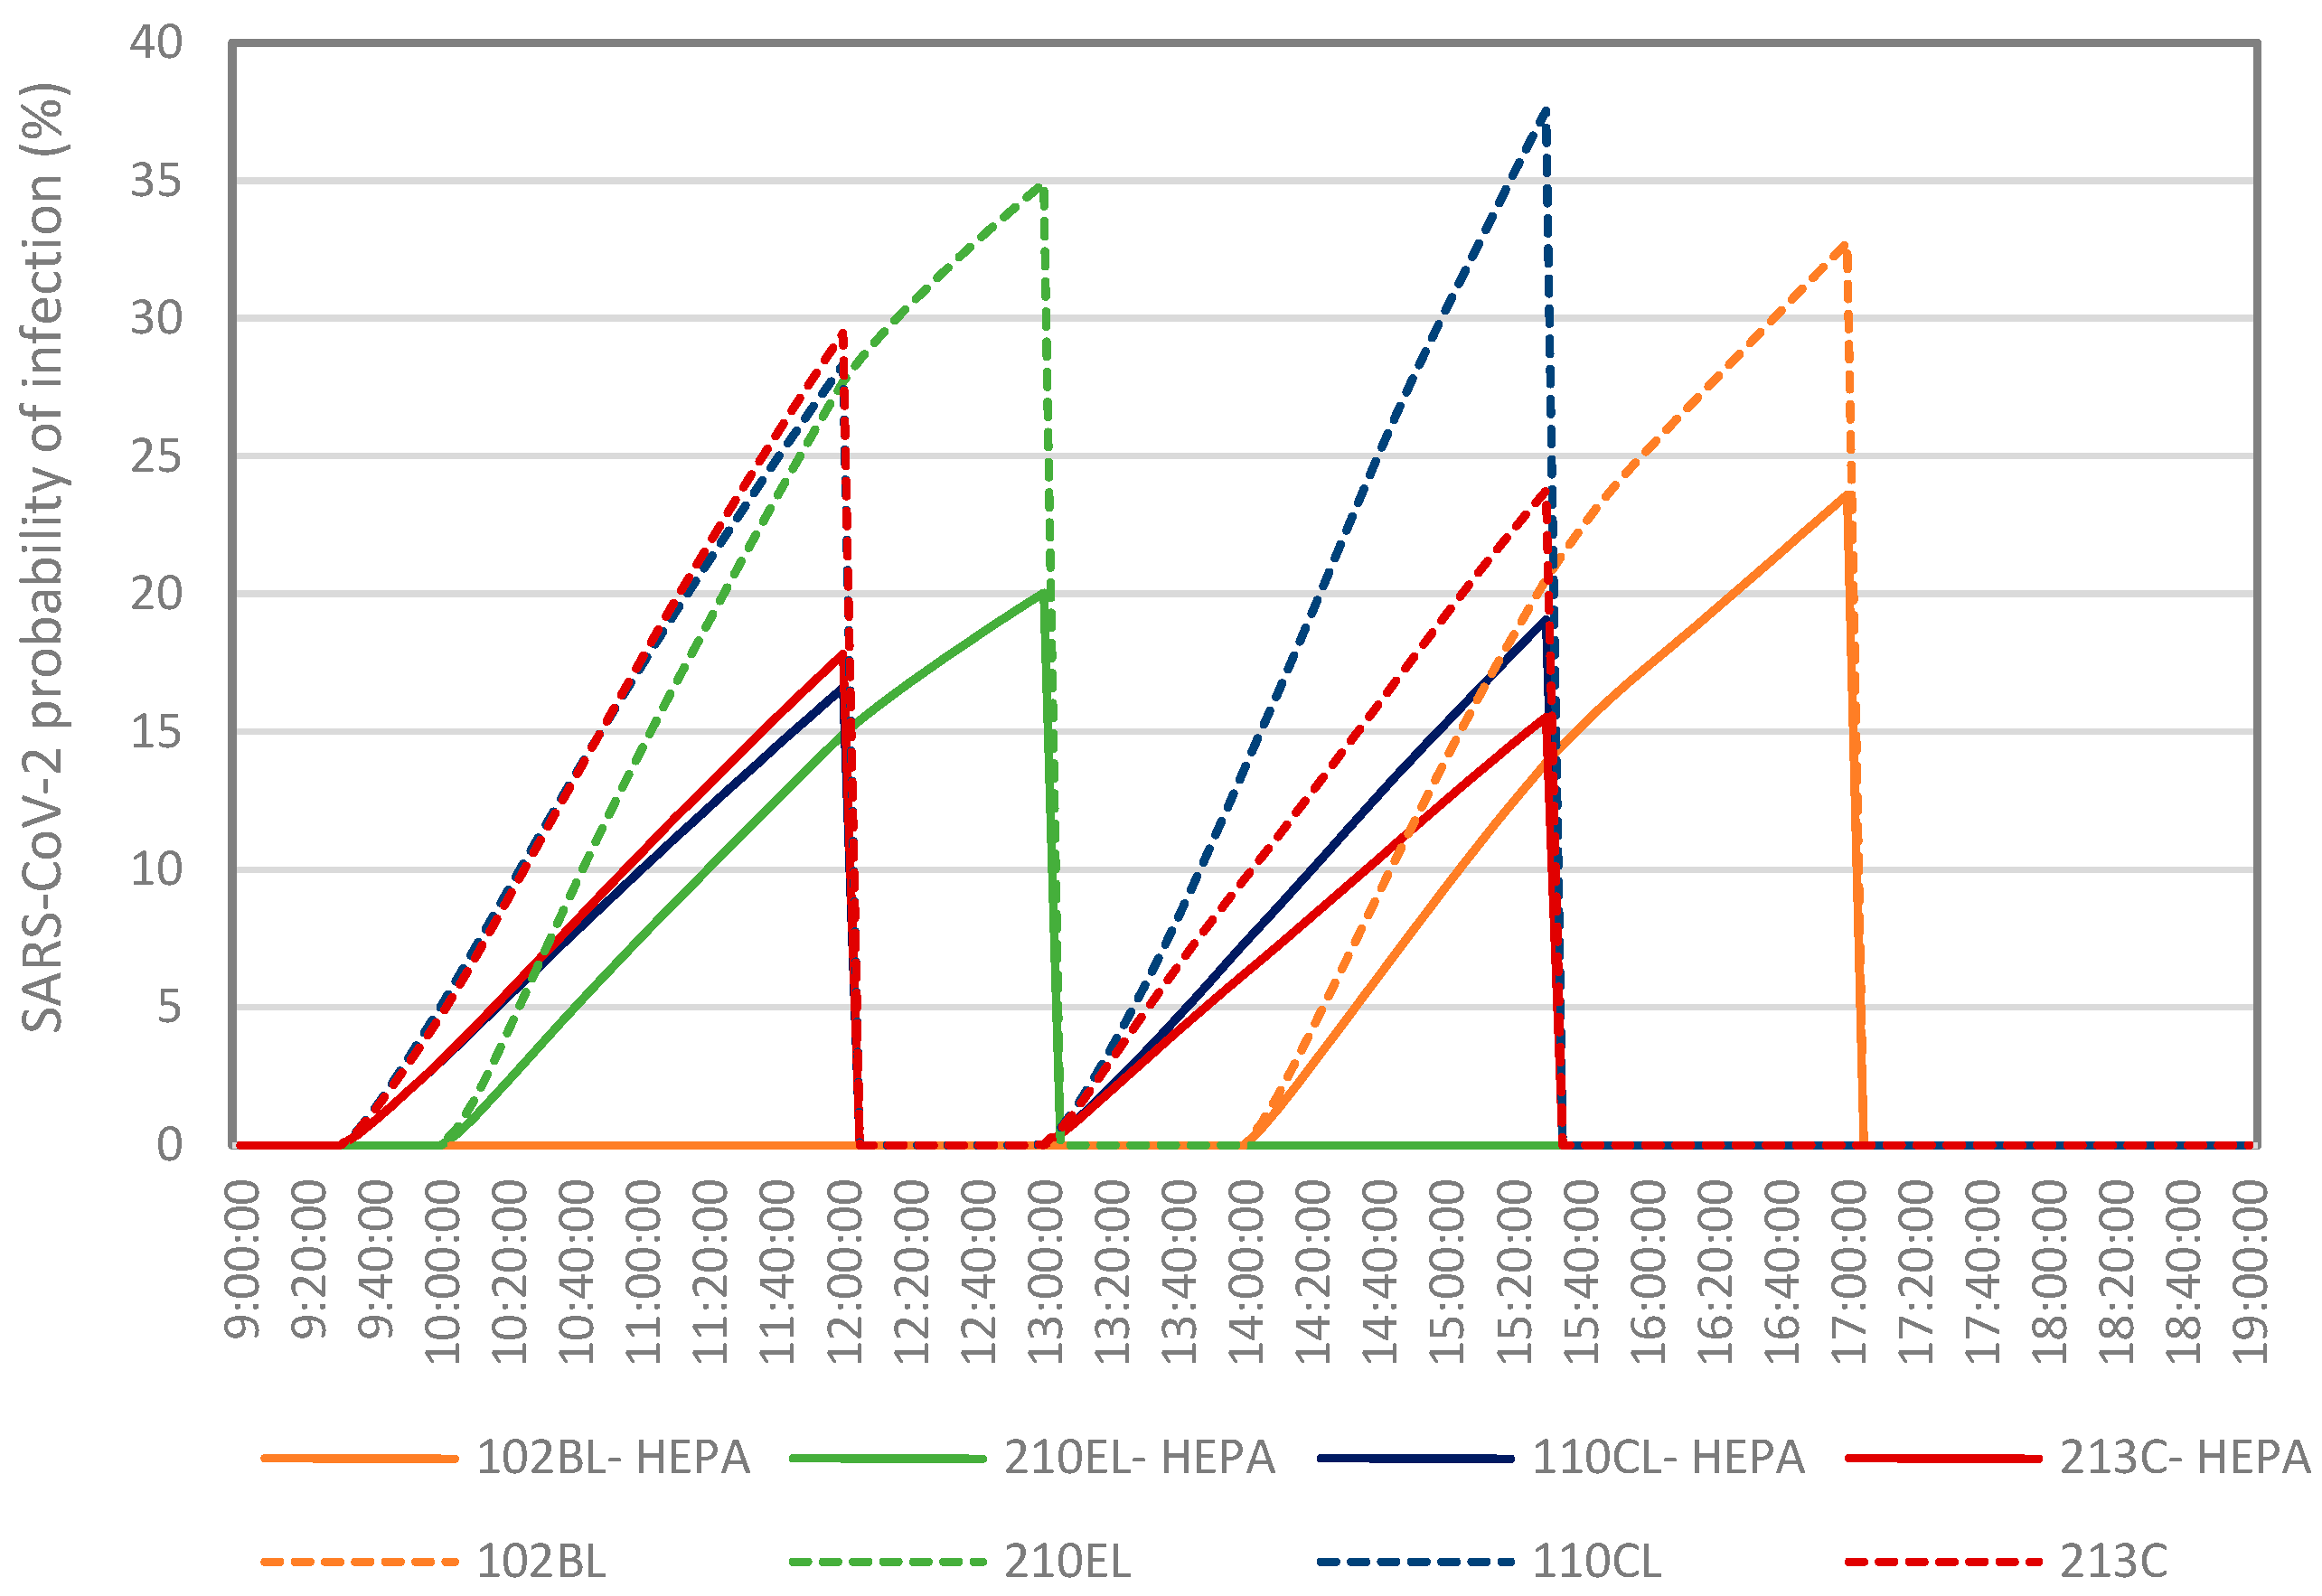
In the case of one infector, applying scenario E to the model resulted in an additional average 38% reduction across all the rooms, with the highest impact observed in room 102BL, showing a 46% reduction. However, all four rooms exhibited almost the same results in scenarios F and G, indicating that when only one infector is present, the lower fraction of opening (30%) starting from the beginning of the class performs similarly to a 67% larger fraction of opening starting from 25 to 15 min after the class begins.
In the case of multiple sources of virus, although scenario G shows a modest decrease in P, in comparison to scenario F, the P values in scenario G have increased, ranging from 5% (in 110CL) to 33% (in 102BL). When five infectors are present, Pmax has decreased in scenario F as opposed to the current condition, with reductions of 70%, 61%, 66%, and 54% in rooms 213C, 210EL, 102BL, and 110CL, respectively. Overall, it can be concluded that, in overall consideration, scenario F is a more suitable choice than scenario G and E for the hybrid ventilation.
In the next step, in scenario F, further measures have been taken to enhance the IAQ when five infectors are present. In this regard, air cleaners equipped with HEPA filters, which are proven to be effective in cleaning the biological and particle contaminants, have been added to the CONTAM model. Accordingly, a deposition source representing the filter, active all the time, has been defined in the most occupied zones.
Figure 8 shows the P with five infectors in rooms 210EL, 102BL, 110CL, and 213C when HEPA filters are added to scenario F of the hybrid ventilation system.
As shown in
Figure 8, implementing the air cleaners makes a significant difference in the P of all rooms having the highest impact on 110CL. In this case, P
mean has additionally reduced by 28%, 45%,33%, and 50% in 102BL, 210EL, 213C, and 110CL, respectively, compared to scenario F. In the case of two infectors, it leads to an average 44% reduction in the P
mean.
4. Discussion
The present study aimed to analyze the current condition of an educational building in the UK in terms of IAQ and propose strategies to enhance the situation for the health and well-being of occupants. The method employed to calculate the actual ventilation rate aligns with approaches used in prior studies [
23,
24,
25,
26], and the results of this study are consistent with values obtained by Harrington et al. [
23] in a study conducted on ten classrooms in Liverpool, UK.
However, it is essential to note that the ventilation rate within the building is not consistent as it is manually adjusted. For example, calculations indicated that on Mondays, the ventilation rate is usually higher than the rest of the week, and there are occasional reductions in rates during the afternoon compared to the mornings. In the building model, a constant ventilation rate is assumed by selecting the most frequently occurring value, yet the real-world fluctuations and the unpredictability of human behavior in altering these rates introduce limitations to the accuracy of actual rate calculations. This issue could be addressed in future studies. Considering this account, a ventilation rate of one ACH was chosen as the recurring value for rooms with five diffusers and a volume of about 200 m3. In the current state of the building, 24 out of 30 rooms had an average CO2 concentration exceeding 1100 ppm during occupancy times in a typical week of the summer semester.
The next step in the study was understanding the gap between the building’s current condition and the recommendation of well-known regulations, including CIBSE guide A, ANSI/ASHRAE 62.1 standard, and Building Bulletin 101. The results revealed a huge gap and the urgency to improve the IAQ by increasing the ventilation. It is noteworthy, however, that classrooms, in reality, are often much less occupied than their maximum capacity (typically below 50%). Therefore, the inadequacy of the ventilation does not lead to harmful indoor air lasting for several hours.
Nevertheless, in this study, the worst-case scenario with the rooms fully occupied was considered to prepare the building for any situation in the future. Following the worst-case approach, the CIBSE recommendation, which proposes higher minimum rates, was selected to apply to the model. In this regard, the CO
2 levels in the classrooms and laboratories, which are mostly occupied for hours, were considered as indicators of ventilation performance, following the approach of previous studies [
10,
23,
38]. The ventilation rates in the rooms were increased by at least about two times and at most about five times until they met the CIBSE requirement. These changes lead to acceptable levels of CO
2 (less than 1000 ppm) in all the rooms, indicating that the minimum ventilation rate recommendation is adequate in the classrooms in the absence of a major source of contaminant in or around the room.
In this study, two main ventilation methods, mechanical and hybrid ventilation, were modelled. For hybrid ventilation, as the duration and extent of window and door opening are not determined in any regulation, eight scenarios were presented in the paper, including the case of constantly keeping them open and intermittent opening. These scenarios, categorized into two groups, examine rooms with no active contaminant source, where CO2 levels indicate IAQ and extreme cases with multiple SARS-CoV-2 virus sources. In the first group, maintaining the door and one window of the rooms constantly 30% open from 15 to 25 min after the classes start was identified as the best scenario where the CO2 levels of all the rooms stayed below the 1000 ppm limit.
The paper proceeded to calculate the transmission risk (P) of the SARS-CoV-2 virus under different ventilation scenarios. The findings revealed a 14% reduction in mechanical ventilation efficacy when the number of infectors increased to 5, highlighting the need for further actions in extreme conditions. Consequently, in the second group of scenarios, natural ventilation is combined with CIBSE-recommended ventilation rates. In this case, the scenario where CIBSE recommended ventilation rates operate in tandem with 30% opening of door and window from the beginning of the classes showed the best results, having a 58–70% reduction from the current condition. Furthermore, in the case of one infector, a 67% increase in the fraction of opening showed the same performance as starting the opening 25 to 15 min earlier (from the beginning of the classes). However, in the case of multiple sources, the starting time factor outperforms the fraction of opening. Therefore, it is suggested that during extreme conditions, the starting time should be from the beginning of the classes even if they are only 30% open, which prevents the piling up of the virus in the enclosed spaces.
In order to provide additional mitigation in the case of multiple sources of virus, the implementation of supplementary measures, such as the integration of air cleaners with HEPA filters, was proposed. This approach demonstrated a significant impact on reducing the P in the rooms with the worst conditions, leading to a 28% to 50% reduction in P
mean. In addition to these measures, strategies to further mitigate transmission risk include the use of face masks and the installation of in-duct MERV filters, where air recirculates in the ventilation system, which was addressed in [
9,
15,
21].
One limitation of the paper is that the methods for enhancing IAQ often conflict with building energy efficiency. Consequently, in recommending the study’s scenarios, both increased ventilation rates and natural ventilation, the desired IAQ was attempted with minimal impact on the building’s energy consumption and occupants’ thermal comfort. The objective was to provide fresh air while causing the least discomfort for occupants and presenting practical scenarios. Therefore, only one window was partially opened at least 15 min after the classes started to mitigate its adverse impact on energy consumption and thermal comfort while maintaining the ventilation rate at the baseline level when there is no active source of contaminant. Additionally, the mechanical ventilation rate did not exceed the recommendations set by CIBSE. Identifying optimized trade-offs between various IAQ improvement strategies and building energy efficiency could be a focus for future studies, which can provide practical insights on achieving a sustainable balance between these two aspects.
It is important to note that the Wells–Riley equation, which was used to calculate the probability of infection, is a simplified model of virus transmission. It does not consider factors such as changes in breathing rate, occupant interactions with infectors and their distance, and the way the virus mixes in the air. In order to have a more detailed understanding of the virus transmission, complex Computational Fluid Dynamics (CFD) models are required, which can be considered in future IAQ studies, even though predicting human behavior remains a challenging aspect. Furthermore, the impact of vaccination and how ventilation systems can complement it may be subjects for future studies. Despite these limitations, the calculated probability of infection results in this study provide valuable insights into the building’s ventilation performance and allow for a comparison of various ventilation systems.
5. Conclusions
The IAQ in a college building in the UK, ventilated by an AHU, has been modeled in CONTAM. The results revealed that if the rooms reach full occupancy, the ventilation system may fail to maintain an acceptable level of fresh air, leading to a potential decrease in academic performance and occupant health. Furthermore, in the presence of an infected person with a virus, such as SARS-CoV-2, the transmission risk to other occupants is very high. This issue proved to be present in various educational buildings, which has been investigated in previous studies [
23,
39,
40]. To address these challenges, a number of useful strategies to enhance IAQ have been investigated, applicable not only to this specific college building but also to other educational facilities.
This study explored the impact of opening fixed windows in a building designed to mitigate noise pollution. While fixed windows effectively reduce noise, the research delved into hypothetical scenarios to assess potential improvements in IAQ when these windows were opened. The investigation aimed to provide insights into the relationship between window operation and IAQ, offering a comprehensive analysis of mechanical and hybrid ventilation systems.
In this context, the study emphasized the important role of occupants in maintaining the class’s safety by promoting the regular opening of windows and doors. Furthermore, it recommended the installation of CO2 monitoring devices in rooms to assist occupants in providing natural ventilation by opening the door and window when the CO2 exceeds the safety limit of 1000 ppm.
The research also demonstrated that achieving acceptable IAQ does not necessarily require opening all windows in classrooms. Keeping only one window open throughout the occupied period of the class can suffice. Furthermore, since both cases of mechanical ventilation with CIBSE requirements and the proposed hybrid ventilation case lead to acceptable results when no active source of contaminant is presented, the final choice between these strategies depends on other factors such as energy efficiency, cost, and environmental footprint. Moreover, it should be noted that, during the heating season, opening a window in the classrooms may not be feasible on most days. On such days, other suggested methods, such as increasing the ventilation rate and implementing air cleaners, would be effective in achieving acceptable IAQ.
Furthermore, this paper focused on assessing the risk for SARS-CoV-2 infection using the well-known Wells–Riley equation. It took into account multiple sources in each room to highlight the performance of ventilation, especially in challenging scenarios such as having five infectors in a classroom. In extreme conditions with multiple sources of virus, in addition to the scenarios related to mechanical and hybrid ventilation, the incorporation of air cleaners in rooms was recommended as an additional measure to further mitigate virus transmission.
Finally, the use of guidelines and regulations in this study contributes to sustainable building practices. The consideration of the SARS-CoV-2 virus as a contemporary health concern aligns with sustainability goals of creating resilient and adaptable built environments. Furthermore, exploring hybrid ventilation scenarios demonstrates a consideration for energy-efficient solutions, a key aspect of sustainability in engineering. The proposal of supplementary measures, such as air cleaners, shows a comprehensive and technologically driven approach to IAQ improvement. Overall, the study contributes to engineering sustainability by prioritizing health, safety, and energy efficiency in indoor environments.


 ,
, 


