1. Introduction
Most of the vehicles used for transportation in Thailand today are internal combustion engine vehicles, which not only affect the carbon dioxide emissions that continue to warm the world but also the health of people and those around them. The Thai government has recognized this problem and is trying to find a solution to the pollution caused by traffic. Therefore, the idea of switching to electric vehicles (EVs) was born as an alternative solution to such problems. However, this change affects many things, whether it is the generation of electricity, environmental aspects, or economic aspects. Therefore, the impact of EVs has three main aspects.
The first concern is the impact of EVs on electricity [
1,
2,
3]. Negative impacts on electricity arise from the fact that an EV charger is considered a large appliance that consumes a significant amount of energy [
4,
5]. This results in the electricity authority having to supply more electricity to the house (in the case of charging the EV at home), and the line must be larger. In addition, the transformers, cut-off devices, and receptacles need to be larger. In a study by Sakib Shahriar [
4], it was found that one of the major challenges is the load on the power grid infrastructure associated with large-scale EV deployment. The solution to this problem is to use smart scheduling algorithms to manage the growing electricity demand from public charging stations. Therefore, if most people switch to EVs, the price of power grid infrastructure will increase significantly. There is a significant demand for energy to charge a large number of EVs at the same time. As a result, electric utilities will need to produce more electricity to supply users, which means power plants will need to be larger. The electrical equipment at the power plants must be increased in size, which increases infrastructure costs. In addition, when EV charging consumes a large amount of electricity in a short period of time, such as fast charging [
6,
7,
8,
9,
10], the electricity may not be produced in time (power shortage). This leads to load imbalance and degradation of power quality. This can lead to power outages in certain areas and affect the reliability and stability of the power supply. Today, researchers around the world are working on ways to control and manage the charging of individual EVs [
11,
12,
13], which is known as “Smart Charging” [
14,
15]. This approach controls the charging of multiple EVs with a limited amount of electric power. The positive impact on electricity is that this EV will drive “Smart Grid” [
16,
17] and “Renewable Energy” [
18,
19,
20] technologies. This increases the likelihood that Vehicle-to-Grid (V2G) will be used [
21,
22,
23]. A smart grid is a future energy system for electric power distribution and will use an intelligent communication system to control power generation more reliably. Smart grids are the key to renewable energy. Therefore, the push for a smart grid is an important by-product of the introduction of EVs. An EV can convert energy back into electricity because the battery in the vehicle is similar to a medium-sized energy storage device. Most people do not drive their cars all the time, but only in the morning. After working in the office, they use it again in the evening. When the car is idle, the battery energy in the EVs can be used to supply electricity when there is a high demand for electricity. However, utilities should also come up with ways to reward them for working together. This valuable technological change is worth hundreds of billions of Thai Baht (THB). Therefore, the impact of electricity is crucial.
The second concern is the impact of EVs on the environment [
24,
25]. The most important factor driving EV technology is how EVs can reduce exhaust emissions. ICE, hybrid cars, and plug-in hybrid cars emit toxic gases that are dangerous to humans and the environment. Many researchers have pointed out that electricity generation releases carbon dioxide from burning coal. The amount of clean energy provided by renewable sources has been constantly increasing. The amount of carbon dioxide emitted by electricity generation is easier to control than the amount emitted from the exhaust pipes of ICE vehicles. The amount of energy generated by this electricity is enormous at any given time. This results in a reduction in per unit gas emissions. Greenhouse gas emissions from all life processes of an EV are well-to-wheel and are much lower than those of an ICE vehicle. In addition, noise pollution is significantly reduced using EVs, which are suitable for populous cities. However, there are still criticisms of battery recycling, which has a negative effect on the environment, as recycling of EV batteries is still very low today. However, in the future, the number of organizations recycling batteries will increase.
The third concern is the impact of EVs on the economy [
26,
27]. From the user’s perspective, EVs can reduce the cost in the long term because they are much more efficient than ICE vehicles and avoid the ever-increasing fuel costs. The starting price of EVs will continue to decrease due to optimized design and mass production. Smart charging technology [
14,
15] reduces power costs during charging. V2G technology [
21,
22,
23] can also help increase user revenue. As smart grids, smart charging, renewable energy, and V2G technologies advance, demand for electricity will decrease, and investment will change. Infrastructure will be significantly improved, and the reliability of the power grid will increase. Thus, the problems that occur with electricity will be reduced. From Thailand’s perspective, a policy requiring all Thais to use EVs would pose many problems for the Thai automotive industry and the country’s economy, as the business of auto parts, car bodies, and car service stations makes up a large part of the economy. In addition, the number of Thai EV experts is still low, so foreigners need to be hired. This will lead to unemployment and a weak economy. There is also the problem of import taxes on EV parts in Thailand, and there is not enough technology in production. Therefore, a gradual adjustment is needed.
In the future, the negative effects of today will be eliminated by the rapid development and use of technology by people. This positive effect is becoming increasingly prominent. Therefore, preparation for various impacts must be studied, analyzed, and planned.
For example, EVs are becoming more and more popular. Many people choose to own these vehicles because of their numerous advantages. EVs, such as cars, motorcycles, scooters, and buses, are not only environmentally friendly but also cheaper in the long run. They save fuel, taxes, and maintenance costs, and one will also experience a quieter and more enjoyable ride. Electric motorcycles (EMC) are one of the main modes of transportation in Thailand and South Asia. The introduction of the EMC in Thailand and the great incentives offered by the government for EVs are great opportunities to own an EMC, which is currently very popular. As Thailand moves towards greater mobility, a variety of transportation options are being introduced to give passengers more options to reach their destination. One such option that is quickly gaining popularity in Thailand’s major cities is the EMC. This is often in the form of a startup business. This trend is creating a lot of hilarity as it makes life easier. You can find EMCs all over the city. Especially on the roads in cities or large villages. More and more EMCs will pass you by.
There are three reasons for the increasing popularity of EMCs in everyday life. The first is the immediate torque and power [
28,
29]. In contrast, an ICE motorcycle takes a long time to accelerate and reach maximum torque. The ICE motorcycle requires a big engine to rotate at high speed, but the electric motor provides maximum power and torque immediately after starting. In addition, power and torque are kept constant throughout the operating range. This suggests that better performance is achieved with a much lighter and smaller EMC. There are also large electric superbikes that can accelerate quickly. Compared to conventional ICE motorcycles, EMCs do not vibrate or shake while driving. When you stop at a red light, many petrol engines do have an optional wheel balancer to reduce vibration, but it does not necessarily cost extra money. You also do not have to worry about accidentally igniting your exhaust header. The second reason is vehicle optimization and upgrades. The best part of owning an EMC is optimizing the vehicle for performance that suits the user’s needs through an application on the smartphone. There are no messy carburetors, engine-timing adjustments, injector profiles, greasy hands, and no missed weekend rides. The EMC is constantly updated with new features. Compared to the ICE motorcycle, one does not have to buy a new model every time the motorcycle is updated because all EMC updates are sent directly to the application, which is also cheaper. The third reason is convenience [
30,
31]. With an EMC, you do not have to worry about running out of fuel, as the charging station is in your garage. EMC maintenance is cheap, and it is also cheaper than an ICE motorcycle in the long run. Thailand is relying on government incentives to become a leader in the field of EVs in Southeast Asia. Therefore, the various types of EVs, such as motorcycles, cars, and buses, are expected to increase on the roads.
The power quality of EMC charging in a residential electrical system is investigated. The pattern of daily electric appliance usage for residential buildings has been replicated at the laboratory level. The laboratory’s power source is isolated from another circuit of the building, and other loads outside of the experimental setup do not interfere with the obtained measurement. The power quality study has been performed by obtaining the total harmonic generated from the circuit without EMC in comparison with the harmonic signal during EMC charging. This process can differentiate harmonics generated from EMC chargers from those in residential buildings and also ensure that all tested cases are based on similar power quality. In this study, three electric motorcycles with the same 72 V battery voltage but different battery capacities of 20 Ah, 30 Ah, and 40 Ah were tested. The test results were considered in terms of power quality, which includes the voltage, current, power factor, active power, reactive power, and apparent power. The power quality, voltage, and current harmonics generated from different motorcycle models and their impact on various electrical circuits were considered in terms of total harmonic distortion (THD). In addition, the harmonic distortion in each order was compared with international standards to demonstrate the impact of electric vehicle charging. We then used the information from each motorcycle model to calculate the break-even point of use compared to ICE motorcycles in terms of distance, total cost, and number of years of use. This provides an informed decision-making tool for electric motorcycle enthusiasts, researchers, and automotive companies to change the use of ICE motorcycles to full-fledged EMCs in the future.
The contributions of this study can be summarized as follows:
Investigation of the effects of the power quality of an EMC when charging in a residential electrical system;
Comparison of power quality when charging the EMCs in three models with different battery capacities and chargers;
Analyze the break-even point of the EMC compared to that of the ICE motorcycle.
The remainder of this paper is organized as follows.
Section 2 describes the behavior of electrical consumption, specifications of EMCs, residential electrical systems, and IEEE standards. All of this is important information for developing power quality tests for residential EMC charging.
Section 3 presents the power quality and harmonics of EMC charging in a residential electrical system to test the suitability of installing a charging system. Because the EMC charger involves power–electronic components, electrical disturbances may occur.
Section 4 presents the calculation of the break-even point when using EMCs compared to ICE motorcycles. Finally, the results and conclusions are presented in
Section 5.
2. Electric Motorcycle Charging in the Residential Power System
To evaluate the power quality impact of electric vehicle charging on residential buildings. The residential electricity consumption pattern has been replicated at the laboratory level using common electric appliances. Three different models of commercial arrival EMC in Thailand have been selected and connected to similar circuits with residential load appliances. The power quality meter will then be used to obtain electrical parameters and harmonic signals generated from the charging unit in combination with electric appliances both before and after charging EMC.
The daily electric appliance usage pattern in replicated residential buildings on both weekdays and weekends can be summarized as shown in
Table 1 and
Table 2, respectively. The commonly used electrical appliances that have been selected for the experimental setup included a refrigerator, air conditioner, television, notebook computer, microwave, induction cooker, air fryer, coffee maker, fans, mobile phones, LED lamps, and an electric motorcycle.
The electric appliance usage pattern can be divided into two forms of electricity consumption: on weekdays and weekends.
Table 1 shows the electricity consumption behavior on weekdays. In general, people consume a lot of electricity between 6:00 p.m. and 8:00 a.m. because this is the time when they return from work, rest, and stay in their homes. This time is divided into cooking and private activities from 6:00 p.m. to 8:00 p.m. and from 5:00 a.m. to 8:00 a.m. From 8:00 p.m. to 5:00 a.m., it is time to go to sleep. From 8:00 a.m. to 6:00 p.m., most people go to work. Therefore, very little electricity was used. EMCs are charged from 8:00 p.m. to 6:00 a.m. Because of the long charging time, it is better to charge them during the night while people are sleeping so that the EMC is ready to use in the morning.
The power consumption behavior on weekends is listed in
Table 2. The power consumption behavior from 8:00 p.m. to 8:00 a.m. was the same as that on weekdays, but more power was consumed from 8:00 a.m. to 8:00 p.m. As Thailand is a hot country, more people use fans and air conditioners during the day. In addition, televisions and computers are used for entertainment as well as cooking at noon. Due to the long charging time, the EMC is charged between 8:00 p.m. and 6:00 a.m., so it is popular to charge at night.
People’s electricity usage patterns on weekdays and weekends are the same between 8:00 p.m. and 8:00 a.m. and different from 8:00 a.m. to 8:00 p.m. Charging of the EMC is performed between 8:00 p.m. and 6:00 a.m. due to the long charging time, and it is popular to charge all night so that the EMC is ready for use in the morning. Therefore, when considering the power quality and effect of EMC charging, the power consumption between 8:00 pm and 6:00 am is mainly considered according to the charging time of each EMC and the battery size.
2.1. Specifications of Electric Motorcycles
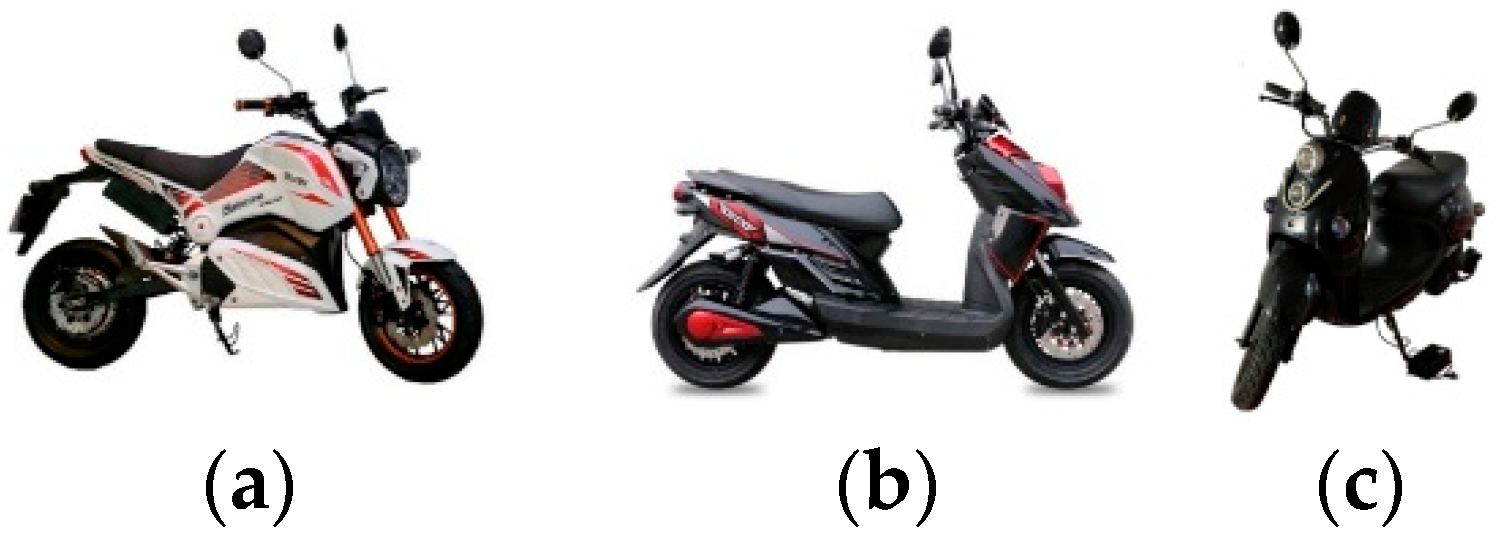
In this experiment, 3 models of EMCs from Hurricane (Thailand), SupperAce (Thailand) and OZOOPU (China) with different battery sizes, as shown in
Figure 1. Each EMC had its own charger.
Table 3 shows the specifications of each MEC brand. The Model X has a steel frame, a 72 V 2000 W BLDC hub motor, and a 72 V 40 Ah lithium-ion battery. It can ride at a maximum speed of 100 km/h with a maximum distance of 108 km/charge. When charged with a 72 V 12 Ah fast charger, it takes approximately 6 h to charge. The second brand was Model Y. It has a 72 V 2000 W BLDC hub motor and a 72 V 30 Ah lithium-ion battery. It can ride at a maximum speed of 80 km/h, with a maximum distance of 70 km/charge. When charged with a 72 V 12 Ah fast charger, the charging time is approximately 4.5 h. Finally, Model Z had a 72 V 1200 W BLDC hub motor and a 72 V 20 Ah lithium-ion battery. It can travel at a maximum speed of 70 km/h and has a maximum distance of 70 km/charge. When charged with a 72 V 12 Ah fast charger, it takes approximately 3 h to charge.
2.2. The Experimental Setup of the Residential Electrical System
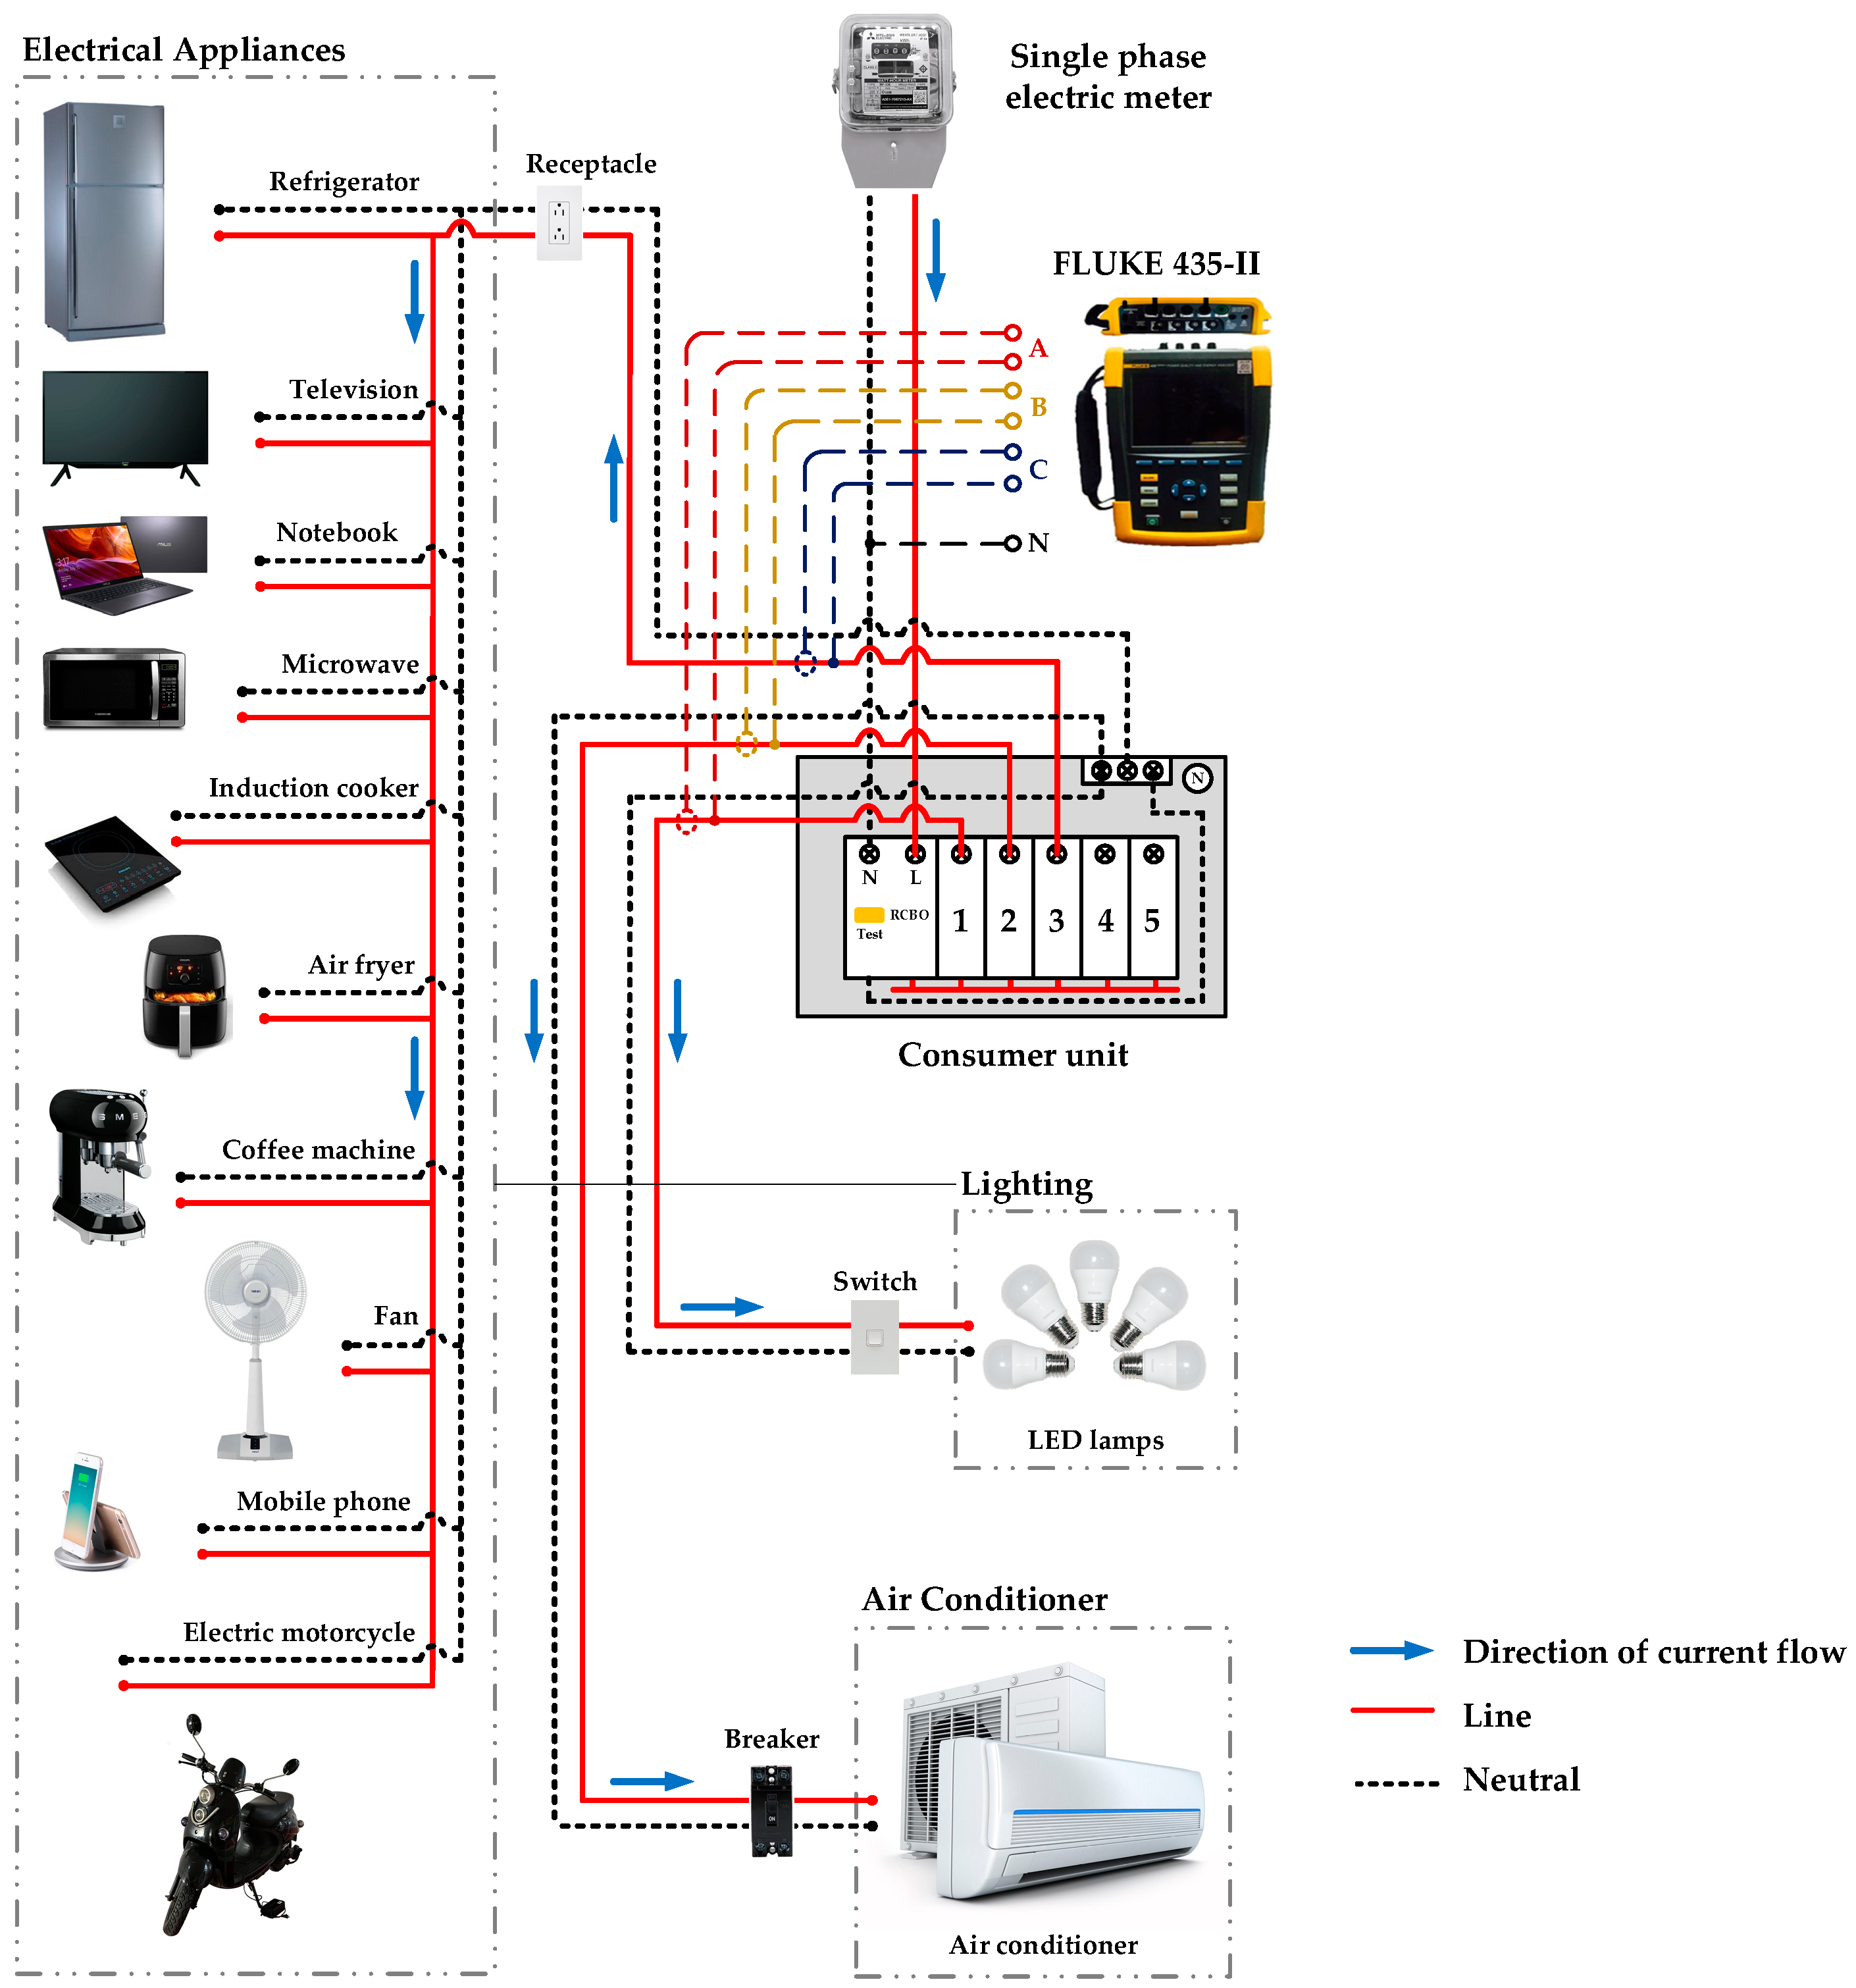
The residential electrical system was simulated in a laboratory experiment, as shown in
Figure 2. The consumer unit was powered by a single-phase electric meter at 230 V. The electricity was then divided into three circuits: lighting, air conditioners, and electrical appliances. The lighting circuits of the eight LED bulbs represent the indoor and outdoor lighting of the house. The air conditioning circuit was a single-phase, 24,000 BTU, 2050 W air conditioner. The electrical appliance circuit consists of a refrigerator, television, notebook, microwave, induction cooker, air fryer, coffee machine, fans, mobile phones, and electric motorcycles. All electrical devices were connected through receptacles in the same circuit.
As shown in
Figure 2, the power quality of each residential power system circuit was measured separately. The power qualities of the lighting, air conditioners, and electrical appliances were measured for each circuit breaker separately to determine the effects of EMC charging on each circuit. A power quality analyzer (FLUKE 435-II) from Fluke Corporation, Everett, Washington, United States was used to record voltage, current, power factor, active power, reactive power, apparent power, voltage harmonics, and current harmonics. All data were recorded in a data logger every 0.25 s throughout the test period, from before the start to the end of the EMC charging.
During these tests, the operating conditions of various electrical appliances were determined. It was found that power consumption behaves the same on weekdays and weekends during the EMC charging period (8:00 p.m. to 6:00 a.m.). Therefore, the behavior of electricity consumption on weekdays and weekends can be considered simultaneously. In addition, EMC charging was tested using three brands with battery sizes of 20 Ah, 30 Ah, and 40 Ah using a fast charger, as shown in
Figure 3. The test results are analyzed and explained in detail in the next section.
3. The EMC Charging Test Results
The power quality of the EMC charging in the residential electrical system was studied and compared using three models with different battery sizes of 40 Ah, 30 Ah, and 20 Ah, as described in
Section 2. Each EMC had its own charger. The test results were measured separately for each circuit breaker, which was divided into the lighting, air conditioning, and receptacle systems. The receptacle consists of various electrical devices and an EMC charger. In this test, the EMCs were charged individually. The test results were recorded using a power quality analyzer (Fluke 435-II) and saved in the form of a power logger. The test results were analyzed in two forms: power quality, which consists of the voltage, current, power factor, active power, reactive power, and apparent power, to study the effects of power quality during charging of the EMC at each circuit breaker. The second form is the voltage and current harmonics, which consider the total harmonic distortion (THD) and harmonic orders 0–40. In addition, the effects of current and voltage harmonics were compared with the IEEE standards to analyze the quality of each EMC charger.
IEEE 519-1992 [
32] is an American and international standard that applies to the case studied. It discusses the effects of harmonic distortion on distribution assets, specifically transformers, power cables, capacitors, metering, relaying, and switch gears. Limits for voltage and current distortions are proposed, as well as limits for individual frequencies. IEEE 519-1992 presents the voltage limits and makes a clear distinction between the THDI and TDD concepts. As far as the actual current harmonic limits are concerned, European standards are identical to those of ICE. Therefore, only the latter will be referred to henceforth.
Table 4 lists the THD limits for different voltage levels. Similarly,
Table 5 lists the limits for the TDD and individual harmonics for each voltage level.
3.1. Power Quality When Charging the EMC Model X
The power quality when charging the EMC Model X (72 V 40 Ah) in a residential electrical system is shown in
Figure 4. The power quality includes voltage, current, power factor, active power, reactive power, apparent power, and harmonics. In this study, the experimental results were collected from 6:50 p.m. to 5:50 a.m., but the EMC charger was operated from 8:00 pm to 4:35 am. The residential electrical system is supplied with single-phase alternating current (AC) power from the utility to power various electrical devices with voltages between 220 and 230 V. The voltages at all three measurement points were the same and did not change significantly; however, they changed slightly depending on the power supply from the electricity authority. The currents are different, as shown in
Figure 4b. The current from the lighting circuit is very low and constant, about 1.05 A, which was used to power eight LED lighting lamps. The current from the air conditioning circuit is the current used to power the air conditioner, which consumes a high current of up to 13.20 A during compressor operation. The current from the receptacle circuit is supplied to the receptacle for delivery to various electrical appliances, including the EMC charger. While the EMC is not charged, the current is low, about 0.75–1.00 A, which fluctuates depending on the operation of the refrigerator compressor. During the charging of the EMC, the current consumption was approximately 4.63–4.75 A. In addition, the currents of the lighting and air conditioner circuits did not change significantly with the charging pattern during the charging of the EMC. The power factor of each circuit is different for each appliance type. In the lighting circuit, the power factor is approximately 0.51 and remains constant throughout the experimental period. In the air conditioner circuit, the power factor is approximately 0.99. Finally, in the receptacle circuit, the power factor is approximately 0.61 before and during the EMC charging, but it oscillates up to 0.93 at the beginning of charging and then decreases again to 0.61. When charging was completed and the plug was not unplugged, the power factor gradually increased to 0.66. The active and apparent powers shown in
Figure 4d,f behave similarly to the current shown in
Figure 4b. The active and apparent power of the lighting circuit was 126 W and 244 VA, respectively, and the active and apparent power of the air conditioner circuit was 2868 W and 2912 VA, respectively. The active and apparent power of the receptacle circuit without charging were 104 W and 174 VA, respectively. However, when the EMC was charged, the powers were 650 W and 1064 VA, respectively. The reactive power is shown in
Figure 4e. The reactive powers of lighting and air conditioner circuits were relatively constant at −22 and 400 VA, respectively, while the reactive power of the receptacle circuit without and with EMC charging was about −14 VA and −100 VA, respectively. A preliminary study of the power quality of the charging Model X’s EMC in residential power systems showed that charging affects the electrical system in a circuit to which the charger is directly connected and does not affect other circuits in the same electrical system. The charging pattern was constant current at the beginning and constant voltage at the end of charging. However, to consider power quality, it is necessary to consider the sequence of voltage and current harmonics.
The voltage and current harmonics when charging the EMC (72 V 40 Ah) in a residential power system are shown in
Figure 5 and
Figure 6, respectively. In addition, the harmonic level of each order can be summarized in
Table 6. In
Figure 5, the voltage harmonics are shown in the order 0–40, where order 0 is the direct current (DC) harmonic, and order 1 is measured at a frequency of 50 Hz with a value of 100%. In this test, the voltage harmonics of the three circuits are equal. Compared to
Table 4 (Voltage Distortion Limits set in IEEE 519-1992), which is an electrical system with a voltage less than 69 kV, the voltage harmonics must have a total voltage harmonic distortion (THD
v) not exceeding 5% and individual voltage harmonic distortion not exceeding 3%. The THD
v of this residential electrical system without and with the EMC charging is 2.08 and 2.24%, respectively, which is well below the limits of IEEE 519-1992. Later, when considering the individual voltage harmonic distortion, it was found that the voltage harmonics do not exceed 3%, with the 5th order harmonic being the highest at 1.94 and 2.11%, the 7th order harmonic being 0.61 and 0.42%, and the 3rd order harmonic being 0.30 and 0.55% for the system without and with electric motorcycle charging, respectively. The individual voltage harmonic distortions are approximately the same in both situations, but the voltage harmonics during charging are higher in sequences three, five, nine, eleven, thirteen, and seventeen than in the sequences without charging. The opposite effect was observed in sequences seven and fifteen. The other voltage harmonics were very low.
In
Figure 6, the current harmonics are shown for orders 0–40, where order 0 is the DC harmonic and order 1 is measured at a frequency of 50 Hz with a value of 100%. The current harmonics are measured separately in each circuit. In the lighting circuit, the harmonic distortion (THD
i) of the current is the highest and was approximately in the systems without EMC at 157.17%. When the EMC was charging, the THD
i of the lighting circuit was reduced to 149.37%. The harmonic current of the air conditioning circuit has a THD
i value of approximately 3.23 and 3.38%, respectively, which are considered to be very close, so the THD
i value is slightly higher in a system that is charging. The receptacle circuit has a THD
i value of approximately 119.90 and 124.16%, respectively, which is a difference of approximately 4.26%. However, when comparing THD
i values in the individual circuits with
Table 5 (current distortion limits for general distribution systems (120 V through 69 kV) specified in IEEE 519-1992), where ISC/IL is less than 20, it was found that THD
i values in the lighting and receptacle circuits exceeded the limits of the IEEE 519-1992 standard. The standard was set at no more than 5%. THD
i in the receptacle circuit was within the standard range and was very low. Therefore, charging the EMC in a residential electrical system can reduce the harmonic current of each order in higher order.
3.2. Power Quality of the EMC Model Y Charging
The power quality of Model Y’s EMC charging (72 V 30 Ah) in a residential electrical system is shown in
Figure 7. The results were collected from 7:24 p.m. to 1:24 a.m.; however, the EMC charger was operated between 8:00 p.m. and 0:32 a.m. The residential electrical system is supplied with one phase electricity and supplies various electrical devices in the house in the range of 220–230 V. The charging voltages in the three circuits are the same and do not change significantly, but they will change slightly depending on the power supply from the electricity authority. The currents in the three circuits have different patterns, as shown in
Figure 7b. The current in the lighting circuit is very low and constant, about 1.05 A, which was used to power the eight LED lamps. The current in the air conditioning circuit is the electricity used to power the air conditioner, which consumes up to 13.20 A of current during compressor operation. The current in the receptacle circuit was supplied to the receptacle. When the EMC is not charging, the electric current is low, about 0.75–1.00 A, which fluctuates depending on the operation of the refrigerator compressor. During charging of the EMC, the current consumption is approximately 3.33–3.66 A due to the use of the EMC charger and electrical appliances. In addition, the currents in the lighting and air conditioner circuits did not change significantly with the charging pattern during the charging of the EMC. The power factor of each circuit varies depending on the type of appliance. In the lighting circuit, the power factor was approximately 0.51 in the pre-charge phase and then increased to 0.55 during EMC charging. In the air conditioning circuit, the power factor was approximately 0.99 over the course of the test. Finally, in the receptacle circuit, the power factor was approximately 0.65 in the early stage test. Then, it oscillates up to 0.74 when charging begins and drops back to 0.58 during EMC charging. The active and apparent powers shown in
Figure 7d,f behave similarly to the current shown in
Figure 7b. The active and apparent powers in the lighting circuit were 124 W and 244 VA, respectively, and those in the air conditioning circuit were 2850 W and 2900 VA. The active and apparent powers in the receptacle circuit without EMC charging were 104 W and 166 VA, but when the EMC charger was used, they were 490 W and 856 VA. Finally, the reactive power is shown in
Figure 7e for both periods, with and without EMC charging. The reactive powers in the lighting and air conditioning circuits were relatively constant at −22 and 432 VA, respectively. The reactive power in the receptacle circuit without charging is about −18 VA and −20 VA when the EMC is charging. A preliminary study on the power quality of charging an EMC in a residential power system showed that charging affects the electrical system in a circuit to which the charger is directly connected and has no effect on other circuits in the same power system. The charging pattern was a constant current at the beginning and a constant voltage at the end of the charging process. However, it is necessary to consider the quality of power, voltage, and current harmonics in terms of total harmonic distortion and individual harmonic distortions.
The voltage and current harmonics during charging of the EMC Model Y in the residential power system are shown in
Figure 8 and
Figure 9, respectively. The harmonic level for each order can be summarized in
Table 7. In
Figure 8, the voltage harmonics are in the order of 0–40. In this test, the voltage harmonics of the three circuits are equal. The voltage harmonic results are compared with
Table 4. The THDv must not exceed 5%, and the individual voltage harmonic distortion must not exceed 3%. The THDv of the system without and with the EMC charging were 1.91 and 2.09%, respectively, which is well below the voltage distortion limits set in IEEE 519-1992. Looking later at the individual voltage harmonic distortion, all voltage harmonics were below 3%, with the 5th harmonic having the highest values of 1.82 and 1.98%. The 7th harmonic had values of 0.45 and 0.46%, and the 3rd harmonic had values of 0.22 and 0.39%. The voltage harmonics with and without charging show that both ranges are similar. However, the system with charging is higher for orders three, five, seven, and nine, and the opposite is true for orders eleven, thirteen, fifteen, and seventeen. The harmonics of other orders are negligible. Therefore, they were not considered in the present study.
Figure 9 shows the current harmonics of the system for orders 0–40. The current harmonics were measured separately in each circuit. The lighting circuit has THDi values of approximately 158.33 and 146.45% without and with the EMC charging, respectively, and the THDi decreases by approximately 11.88%. The current harmonics in the air conditioning circuit have THDi values of about 3.16 and 3.24%, respectively, which are considered very close. The current harmonics of the receptacle circuit have THDi values of approximately 115.39 and 141.46%, respectively, which has a difference of 26.07%. However, comparing the THDi in each circuit with
Table 5, the THDi values of the lighting and receptacle circuits are well above the IEEE 519-1992 standard. The THDi value of the air conditioning circuit remained within the standard range. Subsequently, when considering each order in the lighting circuit, the current harmonics decreased in every order when the EMC was charging. According to the current harmonics of the receptacle circuit, the odd order current harmonics exceeded the IEEE 519-1992 standard for all sequences. The EMC charger significantly reduces the harmonic current in receptacle circuits for high orders but also leads to a significant increase in the harmonic current in the early orders.
3.3. Power Quality of the EMC Model Z Charging
The power quality during charging of an EMC Model Z (72 V 20 Ah) in a residential power system is shown in
Figure 10. The experimental results were collected from 7:09 p.m. to 12:39 a.m.; however, the EMC charger was in operation from 8:00 p.m. to 11:16 p.m. This residential electrical system receives one phase AC power between 220 and 230 V from electricity to power various electrical devices in the home. The charging voltages for all three circuits were the same. The currents were different, as shown in
Figure 10b, where the lighting circuit current was low and constant at approximately 1.08 A. The current of the air conditioning circuit supplies the air conditioner, which consumes up to 12.89 A during compressor operation. The current of the receptacle circuit is supplied to the sockets for various electrical appliances and EMC chargers. When the system is without EMC charging, the electric current is low, about 0.75–1.00 A, which fluctuates depending on the operation of the refrigerator compressor. During Model Z charging, the current consumed was approximately 4.15–4.60 A. In addition, the currents in the lighting and air conditioning circuits did not change significantly with the charging pattern. The power factor of each circuit differs depending on the type of appliance used. In the lighting circuit, the power factor is approximately 0.51 and remains constant throughout the experimental period. In the air conditioning circuit, the power factor is approximately 0.99. Finally, in the receptacle circuit, the power factor is approximately 0.61 in the non-charging period. When the EMC was charging, the power factor was approximately 0.63. After the EMC was fully charged, the power factor was approximately 0.74 and then decreased. The active and apparent powers shown in
Figure 10d,f behave similarly to the current shown in
Figure 10b. The active and apparent powers in the lighting circuit were 126 W and 246 VA, respectively, and those in the air conditioning circuit were 2850 W and 2894 VA, respectively. When the EMC is not charging, the active and apparent powers in the receptacle circuit are 102 W and 170 VA, respectively, but when the motorcycle charger is used, the active and apparent powers are 650 W and 1050 VA, respectively. The reactive power is shown in
Figure 10e. The reactive powers in the lighting and air conditioner circuits were relatively constant at −20 and 400 VA, respectively. The reactive power of the receptacle circuit is about −14 VA when the EMC is not being charged and −80 VA when the EMC is being charged. A study of the power quality when charging the EMC Model Z in a residential power system showed that EMC charging affects the electrical system in a circuit to which the charger is directly connected and does not affect other circuits in the same power system. Therefore, the voltage and current harmonics must also be considered.
The voltage and current harmonics during the charging of the EMC Model Z in the residential power system are shown in
Figure 11 and
Figure 12, respectively. The harmonic level for each order can be summarized in
Table 8. In
Figure 11, voltage harmonics are shown in order from 0 to 40, with order one measured at a frequency of 50 Hz with a value of 100%. The voltage harmonics of the three circuits are equal, showing the comparison between systems without and with EMC charging. The test results are compared with
Table 4, in which the THD
v value should be less than 5% and individual voltage harmonics should be less than 3%. In this experiment, the THD
v of the residential power system without and with EMC charging had a value of 1.70 and 2.07%, which is well below the limits set in IEEE 519-1992. Considering the individual voltage harmonic distortion, all values are not more than 3%, with the 5th harmonic being the highest at 1.58 and 1.94%, the 7th harmonic being 0.49. and 0.41%, and the 3rd harmonic having values of 0.29 and 0.46%. The individual harmonics of the systems with and without EMC charging were similar, but those of the system with EMC charging were higher than those without charging in orders three, five, nine, eleven, thirteen, and seventeen. This is the opposite of orders seven and fifteen. The harmonics of the other orders were very small and therefore not considered.
Figure 12 shows the current harmonics for orders 0 to 40. Each current harmonic was measured separately, and the lighting circuit had the highest THD
i values, approximately 160.75 and 156.76%, respectively, which corresponded to a drop of about 3.99%. The air conditioning circuit THD
i is about 10.95 and 3.25%, respectively, which are considered to be very close. In the system without EMC charging in the receptacle circuit, the THD
i was slightly higher, about 131.28, and it decreased to 124.65% when the EMC was charging. However, comparing the THD
i in each circuit with
Table 5, the THD
i of the lighting and receptacle circuits significantly exceeded the IEEE 519-1992 standard, with the standard setting not exceeding 5%. The THD
i of the air conditioning circuit was considered to be within the standard range. Considering each order in the lighting circuit, the odd order current harmonics exceed the IEEE 519-1992 standards for all orders. The test results show that the current harmonics in the lighting circuit decreased slightly in almost every order when the motorcycle was charged in the power system. The odd order current harmonics in the receptacle circuit exceeded the IEEE 519-1992 standard.
3.4. Comparison of Power Quality between the EMC Models X, Y, and Z during Charging
The test results of the EMC charging in the residential electrical system showed that the charging pattern had a constant current at the beginning and a constant voltage at the end of charging. The residential electrical system was supplied with single-phase AC electricity between 220 and 230 V from the electricity authority to power various electrical devices in the house. The charging voltages of the three circuits are equal and do not change significantly. The current in each circuit is different from the others, with the current in the lighting circuit being low and constant, the current in the air conditioning circuit being the highest, and the current in the receptacle circuit being the current supplied to the socket and passed to various electrical appliances, including the EMC chargers. While the EMC was charging, the current in the lighting and air conditioning circuits did not change significantly with the charging pattern. The power factor of each circuit differs depending on the type of appliance used. In the lighting circuit, the power factor is approximately 0.51 and remains constant throughout the experimental period. In the air conditioning circuit, the power factor is approximately 0.99. Finally, in the receptacle circuit, the power factor is approximately 0.61 before and during the charging of the motorcycle. The active and apparent powers behaved similarly to the current. Finally, the reactive power in the lighting and air conditioning circuits was relatively constant at approximately −22 and 400 VA, respectively. The reactive power in the receptacle circuit is about −14 VA when the motorcycle is not charging and −80 to −100 VA when the EMC is being charged. A preliminary study on the power quality of EMC charging in a residential electrical system showed that charging an EMC affects the electrical system in a circuit to which the charger is directly connected. The other circuits in the same power system were not affected by charging.
Voltage harmonics were considered to be in the order of 0–40. The voltage harmonics of the three circuits are equal and are compared with the values listed in
Table 4 (IEEE 519-1992 standard). The THD
v of this system is much lower than the limits of the IEEE 519-1992 standard. Subsequently, when considering the individual voltage harmonic distortions, all harmonics are not more than 3%. The voltage harmonics during charging are higher in orders three, five, nine, eleven, thirteen, and seventeen than those when the system is not charging, and the opposite effect is observed in orders seven and fifteen.
The current harmonics are shown for the orders 0–40. The current harmonics were measured separately for each circuit; the lighting circuit had the highest THD
i value. When the EMC is charged, the THD
i value in the lighting circuit decreases, whereas the air conditioning and receptacle circuits have a slightly higher THD
i value. However, when comparing the THD
i of each circuit with those listed in
Table 5. The THD
i in the air conditioning circuit was considered to be within the standard range and low. Later, when looking at each order in the lighting circuit, it was found that the odd-sequence current harmonics exceeded the IEEE 519-1992 standard for all orders. When the EMC was charged, the current harmonics decreased for all the orders. The odd order of the current harmonics in the receptacle circuit exceeded the IEEE 519-1992 standard. The current harmonics in the 3rd and 5th orders increased when the EMC was charged, but the current harmonics in orders seven, nine, eleven, thirteen, fifteen, and seventeen decreased.
From the result, it can be seen that EMC charging causes significant distortion in the harmonic pattern, especially in the circuit that EMC is connected to. However, the increasing pattern occurs at low frequency and in odd order. So, the mitigation of this issue can be performed by using a passive low pass filter on the circuit to which EMC is connected to reduce only the harmonics generated from EMC charging. In case the residential building would like to comply with IEEE standards for harmonic signal level, the active filter can adapt to changing electric appliance usage patterns and needs to be installed to generate a signal to compensate for the harmonic signal generated in real time. These two devices can decrease this harmonic signal to a standard level and reduce the impact of the EMC charger on the overall power quality system.
5. Conclusions
EMC charging in the residential electrical system showed that the charging voltages in all circuits of the residential electrical system were the same and did not change significantly. The current in each circuit was different. While the electric motorcycle was charging, the currents in the lighting and air conditioning circuits did not change significantly with the charging pattern, whereas the current in the receptacle circuit had a specific power supply scheme. The power factor of each circuit differed depending on the type of appliance used. The active and apparent power behaved similarly to the current. Finally, the reactive power in the lighting and air conditioning circuits was relatively constant at approximately −22 and 400 VA, respectively. The reactive power in the receptacle circuit was approximately −14 VA when the motorcycle was not being charged and −80 to −100 VA when the electric motorcycle was being charged. Charging an electric motorcycle affects the electrical system in the circuit to which the charger is directly connected. Charging did not affect the other circuits of the same power system.
For harmonics, the THDv of the system was significantly lower than the limits of the IEEE 519-1992 standard. All harmonics are not more than 3%. The voltage harmonics during charging are higher for orders three, five, nine, eleven, thirteen, and seventeen than when the system is not charging, while the opposite effect is observed for orders seven and fifteen. The current harmonics were measured separately for each circuit, and the lighting circuit had the highest THDi value. When the electric motorcycle was charged, the THDi value in the lighting circuit decreased, the air conditioning circuit had a slightly higher THDi value, and the receptacle circuit had a higher THDi value. The THDi in the air conditioning circuit was considered to be within the standard and classified as low. In the lighting circuit, the odd-sequence current harmonics in all orders exceeded the IEEE 519-1992 standard. When the electric motorcycle was charged, the current harmonics decreased in all orders. The receptacle circuit exceeded the IEEE 519-1992 standard. The current harmonics in the 3rd and 5th orders increased, while those of orders seven, nine, eleven, thirteen, fifteen, and seventeen decreased. It can be seen that charging the electric motorcycle in the residential electrical system greatly reduces the harmonic current in each order. To reduce the impact of harmonics generated from the EMC charger, a passive device can be applied to the EMC connected circuit in order to reduce the increasing harmonic signal generated by the charging device. However, to reduce the entire distortion to the standard level, an active filter needs to be installed on the main circuit in order to reduce the harmonic generated from the entire electric appliance.
The cost-effectiveness of using EMC and ICE motorcycles was analyzed using engineering calculations. The sum of motorcycle and energy costs is calculated as follows: For the EMC, the increase in the total price tends to be the same due to similar electricity costs, but the cost of each motorcycle model is quite different for motor and battery prices. Although the cost of ICE motorcycles is lower than that of EMC models, the fuel price is higher. For longer use, ICE motorcycles have a higher total cost than EMC. The total cost of the EMC motorcycle was lower than that of the ICE motorcycle. The longer it was used continuously, the higher the value of the EMC. However, compared to other EMCs that have higher motorcycle costs, this causes the break-even point to be exceeded as distance and time increase. Therefore, if EMCs have not been used for more than five years, they have a lower overall cost than ICE motorcycles.
Next, we looked at the cost of maintenance. For the EMC, the cost of battery replacement must be considered, and for the ICE motorcycle, the cost of engine oil and gear oil must be considered. The increase in the total cost tended to be similar for both motorcycle types. As a result, the graphs of the EMC and ICE motorcycles rarely intersect, indicating that the break-even point cannot be calculated due to the fact that the current cost is higher during EMC use. As the price of batteries decreases, the cost of EMC can be reduced. This trend will help EMC be more cost-effective than ICE motorcycles. In addition, the government supports a policy that encourages the development and reduction of taxes related to electric vehicles. The cost of EMC can be further brought down in the future.


