Abstract
The growing demand for petrochemicals has led to an increase in the number of ships carrying hazardous goods, making the effective regulation of ship tank-washing wastewater collection and discharge more important. To attain this objective, it is crucial to conduct quantitative analyses of the quantity of tank-washing wastewater generated and its geographical spread in the region. However, current estimation methods are plagued by issues such as unreliability and inaccuracy. This study presents a methodology for estimating the quantity of regional tank-washing wastewater, which is based on multi-source data. Using this method to estimate the quantity of tank-washing wastewater generated in the Pearl River Delta region, it was found that in the first quarter of 2018, the demand for tank washing by dangerous goods ships accounted for approximately 7.4% of the total number of berthing events in the study area. If all of these demands were fulfilled, about 15,000 tons of tank-washing wastewater would be generated. A more precise estimation of tank-washing wastewater was achieved, and the geographical dispersal of quantity was identified. Estimating the quantity of tank-washing wastewater in the area forms the foundation for developing facilities for collecting and disposing such wastewater, as well as for the design and site selection of tank-washing stations.
1. Introduction
The expansion of port economies and the heightened demand for petrochemical products have led to an increased number of ships transporting hazardous goods in and out of ports. This trend presents a challenge in preventing and managing water pollution in port areas []. Among the causes of water pollution caused by ships, the most prevalent is the discharge of sewage containing oil and other hazardous substances. The discharge of water pollutants by ships during berthing or sailing, whether intentional or not, must be avoided. To mitigate the marine pollution caused by ships, the International Maritime Organization (IMO) presented the International Convention for the Prevention of Pollution from Ships (MARPOL) in 1973 []. Since then, the content of the Convention has been continuously amended to promote its aims and purposes. In recent years, a set of regulations and standards that control the collection, disposal, and discharge of water pollutants from ships have been implemented in China [,]. These regulations mandate that ships may discharge water pollutants created by them in the sea area, only after taking treatment measures that adhere to the applicable standards, or receive uniform treatment and disposal at terminals.
Chemical tank-washing wastewater is predominantly generated during the tank-washing process that occurs when ships switch between incompatible cargos. Compared to other ship water pollutants, such as domestic sewage, its generation is less extensive but more detrimental to water bodies. Accordingly, stringent restrictions are in place regarding its discharge and disposal processes []. This is particularly true in inland ports, where discharging such water into the water is prohibited and it must be transported to the shore for treatment. However, since the economic value of tank-washing wastewater is not as high as oily wastewater, while its treatment costs are higher, the shoreside is not very motivated to receive it []. This further leads to the insufficient capacity of ports to receive this kind of wastewater, which explains the irregular treatment of wastewater by ships and even illegal discharges []. A few cases of the improper disposal of tank-washing wastewater have been detected under the supervision of maritime agencies, such as the concentration of toxic substances in the treated wastewater being too high [], or the speed of the ship when discharging wastewater at sea not meeting the standard requirements []. These cases may only be a small fraction of the cases and more irregularities may remain undetected. To effectively regulate the discharge of tank-washing wastewater, discussion on the decision making of shipping corporations under government regulation is important, as it may determine the effectiveness of pollution prevention policies []. Before that, an accurate estimation of the quantity of tank-washing wastewater produced in the region must be performed, which aids in the planning of reception and treatment facilities for tank-washing wastewater, as well as for determining their spatial and temporal distribution. These efforts form the foundation for establishing pollution prevention policies, which is crucial to increase the amount of tank-washing wastewater that is received at the shore and prevent its discharge into inland waterways.
In contrast to air and other ship-generated water pollutants, the produced estimates of regional tank-washing wastewater generation mostly rely on port indicators or factual statistics from tank-washing procedures, but not on techniques like inventories of emissions and modelling [,]. The current regulations for facilities that receive water pollutants from ships utilize an empirical formula for calculating the amount of water produced during tank washing []. This formula takes into account various port indicators, including the total number of ships docked, the total tonnage, and the port throughput. However, the parameters used in these formulas rely on fixed values drawn from experience and do not consider differences in tonnage distribution among ships or the varying proportions of cargo types changing between regions. Most estimates based on statistical data suggest that a single wash operation produces between 1% and 4% of a ship’s maximum deadweight tonnage in water []. However, this calculation does not take into account the variations in the amount of water generated by different cargo types during the wash operation and, as such, can only provide an approximate range of water generated. Furthermore, given the low economic efficiency of the process, some ships do not undergo tank washing [], and some tank-washing operations are carried out by unregistered informal organizations that are not under the supervision of maritime administration agencies []. Therefore, statistical data collected directly from tank-washing service providers may not be fully comprehensive in representing the demands for ships’ tank washing in the region.
Achieving an accurate estimation of the quantity of wash water produced on a regional scale depends on obtaining true and comprehensive wash requirements and precisely assessing the water generated by each washing operation. A method for calculating the quantity of water required for a single wash is presented in MARPOL. The coefficients used in this method are determined by the type of cargo, which influences the amount of water produced during each wash. As ships involved in the carriage of dangerous materials are required to submit a declaration to the Management Agency of the Maritime Safety Administration before arriving at port [], disclosing details of the cargo type and loading/unloading operations, it is feasible to accurately estimate the quantity of tank-washing wastewater generated in the area based on this method, in conjunction with the area’s declaration records of ships’ dangerous goods operations. However, as ships’ dangerous goods operations are typically reported to ports or management agencies that cover entire regions, the declaration records kept within a certain region do not fully reflect the operational details of ocean-going ships during their transport voyages across regions or even countries. In response to this situation, the use of automatic identification system (AIS) data to identify a ship’s trans-regional transport voyage to supplement that portion of the information can improve the comprehensiveness and accuracy of the tank-washing requirements determined from the declared records. As a ship monitoring system that reports navigational information such as the ship’s position, speed, and heading in real time, dynamic data from the AIS of ships are widely used to extract behavioral patterns and traffic characteristics of ships [,]. These data are also commonly used in the estimation of the total amount of water pollutants caused by ships on a regional scale, providing detailed and accurate results [,].
This study presents a method to estimate the quantity of wash water produced in the region. This method is based on the calculation method in MARPOL and involves utilizing information from AIS and records of dangerous goods operation declarations to extract information on the ship’s voyage. This information is used to identify the requirement for tank washing and thereby provide insights into the distribution of tank-washing wastewater generation in the region. This study demonstrates the efficacy of the method by employing the Pearl River Delta (PRD) region as an illustration. The findings present significant guidance for the development of structures for receiving and disposing tank-washing wastewater and the placement of tank-washing stations. These efforts will aid in the regulation and management of the creation and release of tank-washing wastewater from ships, thereby lessening their negative effects on the quality of water in harbors and bays near settlements, as well as preserving the safety of the environment and the development of resources in marine waters.
2. Methodology
The process for determining the quantity of tank-washing wastewater is depicted in Figure 1. This included two primary stages:
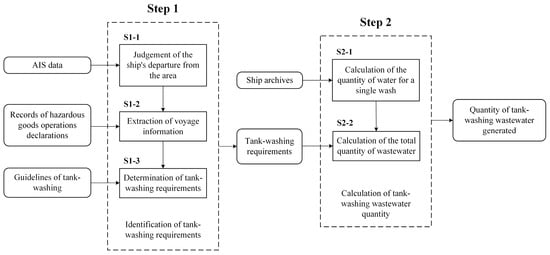
Figure 1.
The process for estimating the quantity of tank-washing wastewater.
- The identification of tank-washing requirements: Assess whether the ship departs from the investigation zone using AIS data and handle the declaration records concerning dangerous goods operation within said zone based on the aforementioned assessment’s outcome. Subsequently, upon retrieving the ship’s voyage data, appraise its tank-washing requirements in light of the cargo category alterations between voyages.
- Calculation of tank-washing wastewater quantity: Calculate the single washing water quantity of various ships using the method proposed in MARPOL, considering the adjustment coefficient based on the cargo loaded during each voyage. Afterwards, combine the tank-washing requirements of each ship with the single washing water quantity to determine the total quantity of tank-washing wastewater produced in the region.
The data used in this methodology consist of the following three items: (1) AIS data, providing real-time ship position, speed, heading, and timestamp information of ships in the study area; (2) records of dangerous goods operation declarations, including detailed information about the dangerous goods operation, such as the ship’s name, location, type of goods, and loading or unloading operations; and (3) the ship archive, which includes information about the ship’s length, breadth, tonnage, number of cargo holds, and capacity.
2.1. Identification of Tank-Washing Requirements
A voyage includes the whole process from the completion of the ship’s operation at the port of discharge to the completion of the ship’s operation at the port of loading and then sailing to the completion of the operation at the new port of discharge, and the ship’s requirement for tank washing is generated in the process of changing cargos between voyages. To determine the requirement for washing between voyages, the AIS data are assessed to establish the ship’s departure from the designated area, and then based on the result, the ship’s operation outside the study area is supplemented with speculations on the type of cargo to extract the complete ship’s voyage information, and then finally, the ship’s requirement for washing is judged whether it is generated during the process of inter-voyage loading or not.
2.1.1. Judgement of the Ship’s Departure from the Area
Ships sailing outside the area will experience a lack of AIS data, used in this study as a measure to determine whether the ship has departed from the area. Identify intervals between the -th AIS data point and the subsequent point sorted by the timestamp. If this interval exceeds a threshold value, the ship’s data are considered missing from that point onwards. The value of the threshold is assigned as , where represents the length of time used for updating the AIS data. However, due to variations in the operating conditions of AIS equipment aboard each ship, the data updating speed may differ from ship to ship. To determine its appropriate value, t is incremented from 0 in 1 min steps. Meanwhile, all neighboring data points of the ship with time intervals less than this value are considered, and the number of these points, , is calculated. Under each step, the growth of is checked and the value corresponding to the maximum of is determined to be suitable.
It is worth noting that a ship may briefly depart from the area due to channel constraints or to avoid certain obstacles, rather than heading to an out-of-area port for operations, and this study aims to recognize the latter behavior, as shown in Figure 2. To achieve this, is compared with the average operating time in the ship’s declared record, and if is greater than , it is determined that the ship’s missing data may be due to a voyage to an out-of-area operation. is calculated by subtracting the initial timestamp from the final timestamp for each undertaking and dividing this value by the total number of operations.
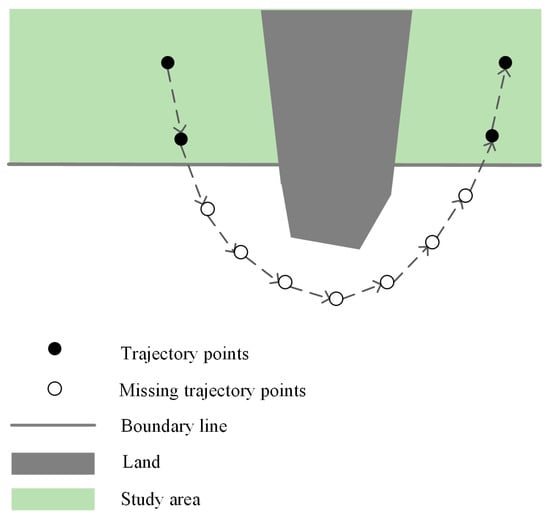
Figure 2.
A ship briefly departs from the study area.
To determine that the ship’s missing data are caused by sailing away from the area, the coordinates of the next trajectory point of the data point where the missing data occur are predicted, and it is determined whether or not the coordinates are located outside the boundary of the area. Considering a ship with uniform acceleration, the acceleration of the ship at the -th data point should be the difference between the ship’s speed at that point and the ship’s speed at the previous data point. Suppose the ship is missing data at the -th data point. In that case, the coordinates of the next trajectory point at that point should be calculated according to the kinematic formula for uniformly accelerated linear motion, as follows:
where and are the longitude and latitude coordinates of the ship’s position at the -th data point, respectively, while and and and are the speed and acceleration components in the longitude and latitude directions, respectively, at the -th data point.
A position judgement is made on the coordinates obtained from the prediction, and if it is outside the study area, the ship is judged to have departed from the study area from the -th data point for a duration of .
2.1.2. Extraction of Voyage Information
Detailed information on the names, locations, cargo types, and operation forms (loading or unloading) of ships that have conducted dangerous goods operations within the region is documented in the records of dangerous goods operation declarations, reflecting the status of ship transportation voyages. To extract voyage information from declaration records of dangerous goods operations in the region, it is crucial to supplement and process the data of dangerous goods operation declaration records. First, sort the events of ships departing from the study area and operation records in the study area by their respective starting time stamps. Next, supplement the operation records of ships outside the region using the operations before and after the ships left the study area. Lastly, extract the ship’s voyage information from the corresponding record data. During this process, there may be voyages where the ship’s loading and unloading operations occur beyond the study area. This portion of the voyage remains unknown.
Figure 3 illustrates an instance of extracting the ship’s voyage information. The processing results in five voyages during the ship’s operations, with one voyage outside the region having an unknown cargo.
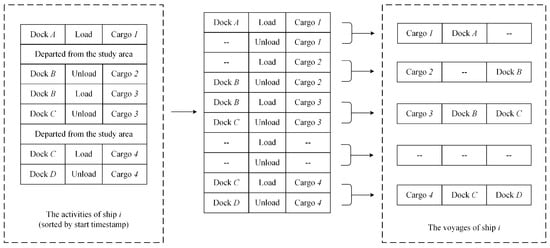
Figure 3.
Extraction of voyage information.
For the part of a ship’s voyage where the cargo onboard is unknown, it becomes imperative to speculate on the types of cargo based on available information. In this study, we assess the possibility of the ship carrying various cargo types during the unknown voyage by evaluating the preference degree of the ship for transporting different cargo categories and subsequently computing the preference degree for all such categories (including those in which the ship has not transported). This situation resembles the personalized recommendation system for e-commerce users. It relies on a portion of the user’s review data to obtain evaluations of all items to provide recommendations.
Collaborative filtering models, such as user-based collaborative filtering [] and item-based collaborative filtering [], are the most prevalent techniques for addressing personalized recommendation issues. The user-based collaborative filtering model calculates a user’s rating of an item they have not rated by summing up other users’ ratings of that item, with the weights being the user’s similarity. In contrast, the item-based collaborative filtering model calculates it by taking a weighted sum of that user’s ratings of other items, where the weight is the item’s similarity. By analyzing the user’s rating data, these models can infer the user’s preferences and ratings for various items []. Subsequently, the models can recommend items to the user based on the ratings, which the user may prefer. The prediction outcome is contingent on the appraisals provided by the user’s “similar users” or the ratings of the user’s “similar items” for the anticipated item. Similar to the user-based collaborative filtering model, when predicting potential cargo types for a ship’s unknown voyage, the ship’s preferences for certain cargo types can be assessed and compared with other ships based on their previous voyages. Therefore, by considering ships comparable to the one in question, it is feasible to compute its preference for all cargo types.
The preference of ship for operational cargo type is calculated as follows:
where is the set of cargo types, including all cargo types that have been carried in the known voyages of ship . denotes the number of voyages among the known voyages of ship in which the operated cargo type is .
For a cargo type that ship has not previously carried on a voyage, the preference of ship to carry cargo type is assumed to be zero in Equation (2). To complement this value, the similarity between ships is used as a weighting value, and the weighted sum of the preferences of all the ships for that cargo type is used as a surmised value, as shown below:
where is the set of ships, which includes all ships except for ship . denotes the degree of similarity between ship and ship , which is measured in the form of cosine similarity:
The probability of ship operating cargo type in an unknown voyage is obtained as:
where is the set of cargo types, including all cargo types.
2.1.3. Determination of Tank-Washing Requirements
The wash requirement calculation produced by ship after its -th voyage is shown in Equation (6), where the expected value is used to determine the wash requirement for the voyage with an unknown type of cargo.
where represents the probability of ship transporting cargo type a during a voyage where the type of cargo onboard is unknown; represents the operational cargo types considered for the -th voyage; represents whether a tank-washing operation is necessary when ship i changes its cargo from type to type , with a value of 1 for required and 0 for unnecessary; and is obtained as:
where indicates whether the operational cargo type of the -th voyage is unknown. If it is unknown, takes the value of 0; otherwise, is equal to .
Tank-washing activities conducted between two unknown voyages are not in the study area and are excluded from the determination of inter-voyage tank-washing requirements in this paper. Consequently, for this situation in Equation (6), is assumed to be equal to 0.
2.2. Calculation of Tank-Washing Wastewater Quantity
The quantity of water produced during a ship’s tank-washing operation relies on the cargo type and the combined volume of its liquid cargo tanks. Details relating to the ship’s dimensions, number of cargo tanks, and capacity are available in its archives. The single wash water of each ship is calculated based on the ship archive data, and the total quantity of water generated by the wash operation in the area is calculated by combining it with its wash demand.
2.2.1. Calculation of the Quantity of Water for a Single Wash
The calculation approach proposed by MARPOL sets the minimal pre-wash water quantity required for individual liquid cargo tanks. The resulting figure must be multiplied by an adjustment coefficient to obtain the amount of wash water produced in diverse scenarios, determined by the category of cargo carried aboard the ship. The formula for this calculation method is given below:
where represents the minimal pre-wash water quantity required for individual liquid cargo tanks, measured in tons; is the capacity of the liquid cargo tank in m3; represents the residual volume of the liquid cargo tank, which varies based on the liquid cargo tank size ; and is an adjustment coefficient, the value of which varies according to the cargo loaded into the liquid cargo tank. The specific values of and are provided in Annex II of MARPOL.
To calculate and distinguish the quantity of water produced by various ships during tank-washing procedures via this method, the quantity of water produced during a single wash by a ship is calculated by adding up the minimum pre-wash water volume of each liquid cargo tank. To determine the appropriate adjustment coefficient, it is essential to classify the cargos transported on a ship’s voyages according to the X, Y, and Z pollution categories outlined in the International Bulk Code (IBC code) []. Briefly, the quantity of water required for a single wash of a ship may be determined using the following equation:
where represents the quantity of water produced by the tank-washing process carried out by ship at the conclusion of its -th voyage, measured in tons; is the adjustment coefficient corresponding to the highest pollution category of the cargo that the ship carried on its -th voyage; represents the number of liquid cargo tanks on ship ; is the capacity of the -th liquid cargo tank in m3; and represents the residual volume of the liquid cargo tank, which varies based on the liquid cargo tank size .
As presented in Equation (9), is dependent on the values of , , , and . Since is obtained according to the values of , , and , these values directly determine the quantity of water for a single wash. However, the ships that are not included in the CSA and CSAD lists of the China Classification Society (CCS) lack the data for the cargo hold number and the capacity of the cargo holds . Therefore, it is not feasible to compute the quantity of water for a single wash of these ships solely from the data listed in the ship archives. The number of cargo holds and the capacity of the liquid cargo tanks of a ship determine the ship’s loading capacity, which is closely related to the main dimensions of the ship, such as the length and width [,,]. To calculate the quantity of water for a single wash of the ship with the missing data, a regression analysis can be used with the ship’s length and width to calculate the value of the part of Equation (9) that excludes the adjustment coefficient (i.e., the value of ”). The information of 2093 ships, which had their length, width, number of cargo holds, and capacity recorded in the ship archives, was extracted as a sample dataset. The dataset was randomly split into a training set and a validation set, with a division of 3:1, respectively, to train and assess a support vector regression (SVR) model. This process was repeated 50 times for cross validation.
SVR is a type of support vector machine (SVM) used for regression problems. It establishes a “spacing band” on both sides of the function, as shown in Figure 4, and allows for a certain bias ε in the samples. The model does not calculate the loss for samples without deviations up to ε and aims to maximize the width of the interval band and minimize the total loss. The SVR model is a supervised learning algorithm that performs effectively without requiring any a priori assumptions on the parameters. As indicated in Table 1, the SVR model exhibited satisfactory performance on the problem of supplementing missing ship data in this paper, with a mean absolute percentage error (MAPE) value of about 17%. It also reveals a high correlation between the main dimensions of the ship and the quantity of water in its single wash.
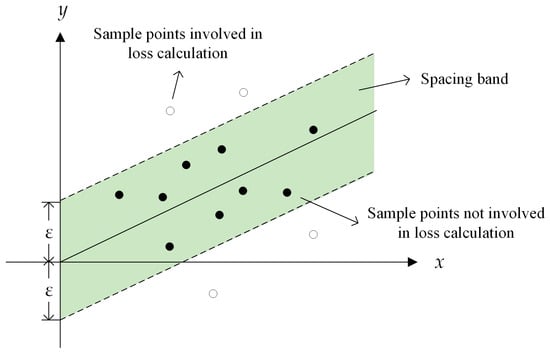
Figure 4.
Support vector regression (SVR).

Table 1.
The performance of the SVR model.
The value derived from the regression of the SVR model can be used to compute the single wash water quantity of ships with the missing data, as shown below:
where is the regression value of ” that is obtained based on the length and width of ship .
2.2.2. Calculation of the Total Quantity of Wastewater
The determination of the total quantity of tank-washing wastewater generated in the region should consider all dangerous goods ships that have operated within the area and their corresponding wash requirements, as illustrated in Equation (11):
where represents the total quantity of tank-washing wastewater generated in the study area within time period ; represents the number of dangerous goods ships that have berthed in the study area within time period ; represents the number of voyages made by ship ; indicates whether the unloading terminal for the -th voyage is situated within the study area, and if it is, then it is 1, and otherwise, it is 0.
3. Empirical Analysis
3.1. Study Area
The Pearl River Delta constitutes a deltaic zone that came into existence from the amassing of sediment carried by the Xijiang, Beijiang, Dongjiang, and supplementary rivers of the Pearl River system. The flat topography and trouble-free water transportation give rise to favorable circumstances for an array of inland ports and harbors. As a vital light industry and foreign trade export base in China, the demand for the water transport of dangerous goods is also escalating. Therefore, regulating water pollutant discharges produced during ship transportation or operations has emerged as a crucial measure to prevent and control pollution in the waters of the region.
At present, there are no ship tank-washing stations built in the PRD Region, and some river trade docks lack sufficient capacity to receive and dispose of pollutants from ships [,]. As a result, except for some large petrochemical ports, most docks are unable to fulfil the demand for ships’ tank washing directly. In these instances, the tank-washing service needs to be provided by third-party tank-washing service providers. This approach may lead to irregularities in the disposal of the ships’ tank-washing wastewater. The methodology for estimating the amount of wash water generated in this research is intended to provide reliable data on the further development of facilities and stations for receiving and disposing tank-washing wastewater, rather than providing an estimate of the current situation. Therefore, in the case of this research, the quantity of tank-washing wastewater generated in the area should be estimated under the assumption that the washing requirements of ships calling at the port can be met at the dock and that the wastewater is generated and received for disposal at the dock rather than discharged into the sea directly.
The study area of this research includes the PRD region and neighboring areas, as illustrated in Figure 5. The AIS data that were gathered encompass the period between 1 January 2018 and 31 March 2018. The declaration records within this specified interval are related to 79 docks dispersed throughout 18 port areas which comprise substantial petrochemical terminals located in the PRD region. The ship archive provides the data for the associated calculation of tank-washing wastewater generation and consists of ship information which is collected by the crawler from various maritime data sources or websites, such as Shipxy.com, HiFleet.com, and China Classification Society (CCS).
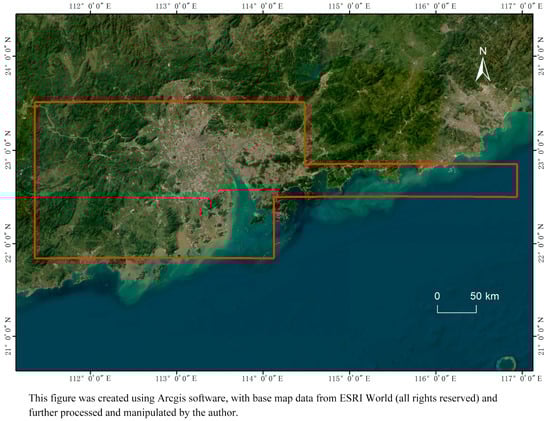
Figure 5.
Study Area.
To prevent unnecessary processing of AIS data for non-dangerous goods ships, the corresponding Mobile Service Identifier on Water (MMSI) is searched in the archives using the ship name in the declaration record. Approximately 4.2 million AIS data items are utilized in this study after being matched and screened against the ships’ MMSI.
3.2. Tank-Washing Requirements
In this research, the guidelines used to determine if a change in the cargo between voyages necessitates a tank-washing operation are based on the chemical compatibility guidelines which were formulated by the United States Coast Guard (USCG) and the established tank-washing regulations for inland ships in the Yangtze River regions []. Each type of cargo must be classified according to both guidelines and assessed for compatibility with the other cargo. If any guideline specifies that a cargo is not compatible with another one, the ship must undergo a tank-washing operation if it is being switched between these two cargos.
The berthing operation information of a ship is obtained using its declaration record and extracted as the ship’s voyage record via the judgement result based on the AIS data. An example of a ship’s voyage record that was extracted is shown in Table 2. Furthermore, the results reveal that there were 842 instances of cargo type changes between voyages for all ships. As shown in Table 3, the process generated a total of 460 wash demands, primarily from oil tankers, chemical tankers, and liquefied petroleum gas (LPG) tankers. According to Lin Hua et al.’s statistical findings [] for the Yangtze River mainstream region, 12.6% of the total operations under the jurisdiction of the Yangtze River Maritime Safety Bureau involved ships changing cargos. Meanwhile, for the PRD region, this study’s findings indicate that this number is slightly higher, at 13.6%. Owing to the variations in the structure of the petrochemical sector across different regions, in conjunction with variations in the types of products used by dangerous chemical enterprises as well as their magnitudes, the cargo changing demand of ships between different regions will differ accordingly.
Table 2.
Voyage record of a tanker whose MMSI is 412431790, named JIAN XING 32.
Table 3.
The processing results.
Furthermore, this study’s results suggest that because of the exemption from mandatory pre-washing in MARPOL (which allows exemption from pre-washing when loading the same or compatible cargo as the previous voyage) and the prevalence of “special dedicated ships” among inland waterway chemical ships [], there is likely to be less demand for tank washing compared to the demand for changing cargo types. The alteration in these two demands over time is illustrated in Figure 6, indicating that the requirement for tank washing is approximately 50% of the demand for changing cargo type. When constructing a tank-washing station, it is crucial to consider the region’s genuine tank-washing needs in order to determine the annual tank-washing capacity, instead of focusing on the demand for the cargo type changeover. This approach ensures an effective allocation of resources.
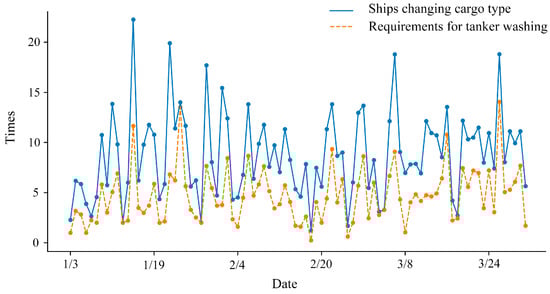
Figure 6.
Tank-washing requirements in the study area.
3.3. Tank-Washing Wastewater Quantity
Calculating the total quantity of tank-washing wastewater generated in the study area based on the ship washing requirements and the quantity of water for a single wash data, a total of about 14,992 tons of tank-washing wastewater was generated during the changeover process of dangerous cargo ship types in the PRD region from 1 January 2018 to 31 March 2018. The wastewater generated via chemical changeover accounted for about 47.3% of the total quantity of tank-washing wastewater, most of which was generated at chemical terminals, as shown in Figure 7, where the percentage of chemical changeover wastewater at chemical terminals was much larger than that at oil terminals. This category of wastewater is classified as a substance containing toxic liquids which require more complex treatment than oily wastewater. Due to the greater environmental hazards presented by this substance, it requires greater scrutiny in the monitoring of its discharges. Therefore, paying meticulous attention to this type of ship tank-washing wastewater is crucial. The spatial distribution of the quantity of tank-washing wastewater generated is shown in Figure 8, where the largest quantity of wastewater is generated in large petrochemical terminals such as Dongguan Shatian Port Area, Zhuhai Gaolan Port Area, and Huizhou Quanwan Port Area.
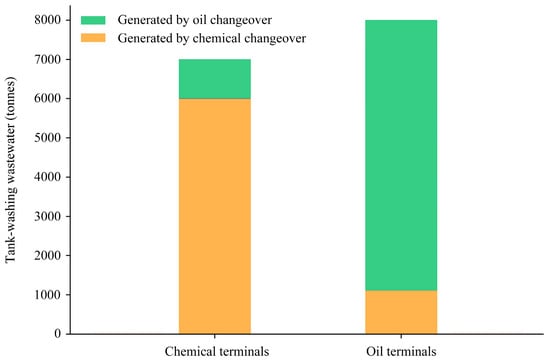
Figure 7.
The quantity of tank-washing wastewater generated in the study area.
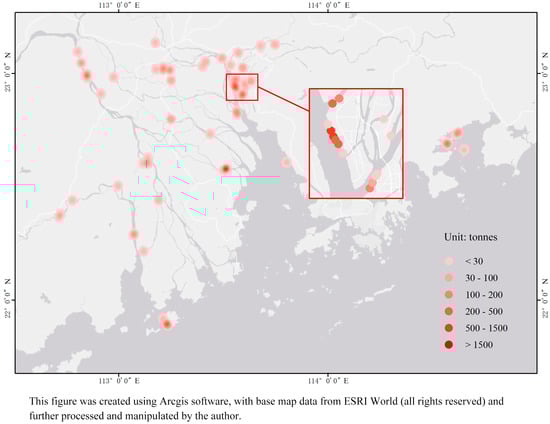
Figure 8.
The distribution of tank-washing wastewater in the study area.
4. Conclusions and Discussion
This study proposes a method to calculate the tank-washing wastewater quantity of a region via the utilization of multi-source data. The proposed method facilitates an accurate and quantitative evaluation of the wastewater quantity generated by washing processes in a large region. When applying the method to estimate the wastewater quantity from tank-washing operations of dangerous cargo ships in the PRD region, it was discovered that around 15,000 tons of tank-washing wastewater was generated during the first quarter of 2018 due to the changing cargos of ships in the study area. Nearly 47.3% of the total was chemical tank-washing wastewater, which was primarily generated at chemical docks. Large petrochemical ports like Shatian Port Area in Dongguan, Gaolan Port Area in Zhuhai, and Quanwan Port Area in Huizhou produced a significant amount of tank-washing wastewater. Additionally, the calculations for tank-washing requirements revealed that the number of such requirements from ships amounted to approximately 7.4% of the total berthing events in the PRD region, which was nearly half the requirement for changing cargo type. Consequently, this research offers some management suggestions for discharging and regulating tank-washing wastewater based on these results.
First, the generation of tank-washing demands and the tank-washing wastewater are concentrated in the ports near large petrochemical industrial parks, while only a small portion is dispersed in other small petrochemical docks. This may cause these small portions to be overlooked, leading to safety accidents caused by the failure of hazardous goods ships to wash, or water pollution caused by ships discharging tank-washing wastewater illegally. These situations should not be allowed to occur in the PRD region, where inland waterways are adjacent to urban residential living areas. Therefore, the government should consider implementing unified supervision of all ships entering the region, endeavoring to achieve the goal of ship tank washing as much as possible and implementing a strict joint-order system for the generation, collection, and disposal of tank-washing wastewater from dangerous goods ships entering the region.
Second, there is potential in the ship tank-washing market in the PRD region. However, there is a need to establish a larger scale of ship tank-washing stations and a tank-washing service industry. At discharge ports, the lack of washing capacity may force ships to travel to other ports for cleaning, which increases empty voyage costs. This may lead to ships being less willing to wash. The provision of sufficient tank-washing services by ports can facilitate the frequent fulfilment of various hazardous goods transportation requirements by ships. This, in turn, can foster the expansion of the petrochemical sector at the port. Therefore, the government should consider providing support to ship cleaning service companies and ships’ water-pollutant-receiving companies. This should include measures such as offering enterprise subsidies and implementing preferential policies, in order to help companies to reduce costs and encourage the provision of services related to tank washing.
Third, tankers produce tank-washing wastewater during maintenance activities. Ships are required to undergo a minimum of two docking and overhaul procedures within 5 years in line with classification society regulations. During the first quarter, 1019 dangerous goods vessels were docked in the study area, resulting in an estimated demand of 102 for tank washing due to ship overhauls. This generated 3292 tons of tank-washing wastewater. Although it is likely that a larger proportion of the wash wastewater generated in this case will be oily wastewater, this part of the wash requirement should still be taken into account in the planning and construction of the tank-washing station, rather than being ignored.
The study results can assist in developing tank-washing wastewater treatment and reception facilities, identifying suitable locations for tank-washing stations, and forecasting the quantity of regional tank-washing wastewater. This can be achieved by incorporating the method employed in this research with the demand prediction model. Moreover, it can enhance the construction of a more detailed spatiotemporal model to help the government to regulate the release of tank-washing wastewater from ships. However, improvements can be made to this research in areas such as the following: (a) the provided case in this research lacks sufficient data on dangerous goods operations at some Shenzhen terminals, which would augment the reliability of the outcomes, and this resulted in the impediment of precise identification of tank-washing demands; (b) as mentioned above, ships may choose to wash while travelling to other locations due to the unavailability of tank-washing services at the discharge port, so the requirement for washing and the generation of tank-washing wastewater within the region may change after the availability of tank-washing services increases, as ships may choose to change cargo types more frequently. This situation may need to be considered in conjunction with some game modelling for further varying outcomes.
Author Contributions
Conceptualization, Y.X. and H.Z.; Methodology, K.Z.; Software, K.Z.; Validation, Y.X. and K.Z.; Investigation, Y.X. and H.Z.; Resources, H.Z.; Data curation, K.Z.; Writing—original draft preparation, K.Z.; Writing—review and editing, Y.X. and H.Z.; Supervision, Y.X.; Project administration, Y.X. All authors have read and agreed to the published version of the manuscript.
Funding
This research received no external funding.
Institutional Review Board Statement
Not applicable.
Informed Consent Statement
Not applicable.
Data Availability Statement
The data presented in this study are available upon request from the corresponding author. The data are not publicly available due to relevant legal requirements.
Conflicts of Interest
The authors declare no conflict of interest.
References
- He, L.; Jia, R.; Jiao, Y.; Liang, Y. A Review of Water Pollution Research in Port Areas in Green Port Construction. Yangtze River 2021, 52, 38–45. (In Chinese) [Google Scholar] [CrossRef]
- International Convention for the Prevention of Pollution from Ships (MARPOL); International Maritime Organization: London, UK, 1973.
- Ministry of Transport of the People’s Republic of China. Provisions of the People’s Republic of China on the Management of the Prevention and Control of Pollution of the Inland Water Environment by Ships. Available online: https://xxgk.mot.gov.cn/gz/202210/W020230620608693846050.pdf (accessed on 3 December 2023).
- Ministry of Transport of the People’s Republic of China. Regulation on the Supervision and Management of the Safety of Carriage of Dangerous Goods by Ships. Available online: https://xxgk.mot.gov.cn/2020/jigou/fgs/202006/t20200623_3308041.html (accessed on 3 December 2023).
- GB 3552-2018; Discharge Standard for Water Pollutants from Ships. China Environmental Science Press: Beijing, China, 2018.
- Wu, X. Analysis of the problem of receiving, transferring and disposing of water pollutants from ships and proposals for countermeasures. Pearl River Water Transp. 2020, 18, 65–66. (In Chinese) [Google Scholar] [CrossRef]
- Chen, J. Yangtze River Ship Washing: Change Bringing Problems. China Waterw. 2019, 618, 17–18. (In Chinese) [Google Scholar] [CrossRef]
- Guangdong Maritime Safety Administraion of the People’s Republic of China. Zhuhai Maritime Safety Bureau Promotes the Rectification of the Industry of Detecting the Concentration of Wash Water on Board Ships. Available online: https://m.thepaper.cn/baijiahao_4631391 (accessed on 3 December 2023).
- Jinshan Maritime Safety Administraion of the People’s Republic of China. Jinshan Maritime Safety Administraion Investigated and Dealt with the Case of Illegal Discharge of Wash Water from Ships. Available online: http://www.zgsyb.com/news.html?aid=667025 (accessed on 3 December 2023).
- Xu, L.; Di, Z.; Chen, J. Evolutionary game of inland shipping pollution control under government co-supervision. Mar. Pollut. Bull. 2021, 171, 112730. [Google Scholar] [CrossRef] [PubMed]
- Ye, J.; Chen, J.; Wen, H.; Wan, Z.; Tang, T. Emissions assessment of bulk carriers in China’s east Coast-Yangtze River maritime network based on different shipping modes. Ocean. Eng. 2022, 249, 110903. [Google Scholar] [CrossRef]
- Shu, Y.; Wang, X.; Huang, Z.; Song, L.; Fei, Z.; Gan, L.; Xu, Y.; Yin, J. Estimating spatiotemporal distribution of wastewater generated by ships in coastal areas. Ocean. Coast. Manag. 2022, 222, 106133. [Google Scholar] [CrossRef]
- JT/T 879-2013; Requirements for the Capacity of Ports, Terminals, Loading and Unloading Stations and Ship Repair and Dismantling Units to Receive Pollutants from Ships. PRC Ministry of Transport (MOT) Maritime Safety Agency: Shanghai, China, 2013.
- Du, Y.; Li, X. Discussion on Receipt and Disposal of Tank Wash Water from Bulk Chemical Ships. Environ. Prot. 2013, 41, 53–55. (In Chinese) [Google Scholar]
- Xue, J.; Chen, C.; Zhang, X.; Wang, Y. Analysis of the operation of the Nantong wash station and suggestions for its promotion and application. In Proceedings of the 2023 Annual Conference on Maritime Management of Inland Waterway Maritime Committee of China Nautical Society, Chongqing, China, 26 May 2023; pp. 69–72. (In Chinese). [Google Scholar]
- Lin, H.; Li, B.; Xu, P. Study on Location Allocation of Tank-cleaning Station for Transportation Vessels along Yangtze River Main Stream Based on Linear System Concept. Logist. Technol. 2017, 36, 112–115. (In Chinese) [Google Scholar]
- Ministry of Transport of the People’s Republic of China. Provisions of the People’s Republic of China Maritime Administrative Licence Conditions. Available online: https://xxgk.mot.gov.cn/2020/gz/202112/W020220808601632894908.pdf (accessed on 3 December 2023).
- Han, P.; Yang, X. Big data-driven automatic generation of ship route planning in complex maritime environments. Acta Oceanol. Sin. 2020, 39, 113–120. [Google Scholar] [CrossRef]
- Liu, L.; Shibasaki, R.; Zhang, Y.; Kosuge, N.; Zhang, M.; Hu, Y. Data-driven framework for extracting global maritime shipping networks by machine learning. Ocean. Eng. 2023, 269, 113494. [Google Scholar] [CrossRef]
- Parks, M.; Ahmasuk, A.; Compagnoni, B.; Norris, A.; Rufe, R. Quantifying and mitigating three major vessel waste streams in the northern Bering Sea. Mar. Policy 2019, 106, 103530. [Google Scholar] [CrossRef]
- Chen, R.; Liu, C.; Xue, Q. Research on Fine Ship Sewage Generation Inventory Based on AIS Data and Its Application in the Yangtze River. Water 2022, 14, 3109. [Google Scholar] [CrossRef]
- Schafer, J.B.; Konstan, J.; Riedl, J.E. Commerce Recommendation Applications. Data Min. Knowl. Discov. 2001, 5, 115–153. [Google Scholar] [CrossRef]
- Sarwar, B.; Karypis, G.; Konstan, J. Item-based collaborative filtering recommendation algorithms. In Proceedings of the 10th International Conference on World Wide Web, Hong Kong, China, 1–5 May 2001; pp. 285–295. [Google Scholar]
- Hasan, M.; Ahmed, S.; Malik, M.A.I.; Ahmed, S. A comprehensive approach towards user-based collaborative filtering recommender system. In Proceedings of the 2016 International Workshop on Computational Intelligence (IWCI 2016), Dhaka, Bangladesh, 12–13 December 2016; pp. 159–164. [Google Scholar]
- IMO ID100E-2016; IBC Code—International Code for the Construction and Equipment of Ships Carrying Dangerous Chemicals in Bulk (2016 Edition). International Maritime Organization: London, UK, 2016.
- Clausen, H.B.; Lützen, M.; Friis-Hansen, A.; Bjørneboe, N. Bayesian and neural networks for preliminary ship design. Mar. Technol. 2001, 38, 349–356. [Google Scholar] [CrossRef]
- Cepowski, T. Determination of regression formulas for main tanker dimensions at the preliminary design stage. Ships Offshore Struct. 2019, 14, 320–330. [Google Scholar] [CrossRef]
- Abramowski, T.; Cepowski, T.; Zvolenský, P. Determination of Regression Formulas for Key Design Characteristics of Container Ships at Preliminary Design Stage. New Trends Prod. Eng. 2018, 1, 247–257. [Google Scholar] [CrossRef]
- Sun, Z. Research on Deepening Treatment Scheme of Water Pollutants from Inland River Ships in Guangdong Province. Transp. Energy Conserv. Environ. Prot. 2022, 18, 25–30. (In Chinese) [Google Scholar]
- Changjiang River Administration of Navigational Affairs, MOT. Guidelines on Tank Washing for River Trade Ships Carrying Bulk Liquid Dangerous Goods on the Mainline of the Yangtze River (for Trial Implementation). Available online: https://cjhy.mot.gov.cn/xxgk/xxgkzl/zhjgg/202308/P020230802387446421245.pdf (accessed on 3 December 2023).
- Li, K. Discussion on Countermeasures for Management of Tank Water Discharge of Inland Bulk Dangerous Chemical Ships. China Waterw. 2019, 3, 48–49. (In Chinese) [Google Scholar] [CrossRef]
Disclaimer/Publisher’s Note: The statements, opinions and data contained in all publications are solely those of the individual author(s) and contributor(s) and not of MDPI and/or the editor(s). MDPI and/or the editor(s) disclaim responsibility for any injury to people or property resulting from any ideas, methods, instructions or products referred to in the content. |
© 2023 by the authors. Licensee MDPI, Basel, Switzerland. This article is an open access article distributed under the terms and conditions of the Creative Commons Attribution (CC BY) license (https://creativecommons.org/licenses/by/4.0/).