Article

Flood Risk and CO2 Mitigation: Analysis of Climate Change Response of Greening Vacant Houses in Old Downtown Metropolitan Areas

1
Department of Urban Planning and Engineering, Kyungsung University, Busan 48434, Republic of Korea
2
Department of Architecture, Pusan National University, Busan 46241, Republic of Korea
3
Department of Urban Planning and Engineering, Pusan National University, Busan 46241, Republic of Korea
*
Author to whom correspondence should be addressed.
Sustainability 2024, 16(1), 114; https://doi.org/10.3390/su16010114
Submission received: 23 November 2023 / Revised: 18 December 2023 / Accepted: 20 December 2023 / Published: 21 December 2023
(This article belongs to the Section Health, Well-Being and Sustainability)

Abstract

:
While greening vacant houses is encouraged as a sustainable strategy, there is a paucity of quantitative research on its effects. The purpose of this study is to evaluate the flood risk and CO2 mitigation effects of greening neglected vacant houses and barren sites in densely built old downtown areas. To achieve this goal, an investigation was conducted of the actual conditions of vacant houses and barren sites in Ami-dong and Chojang-dong in Busan Metropolitan City. Subsequently, four scenarios for greening vacant houses and barren sites were developed, and rainfall runoff simulations were performed using the K-LIDM model. Furthermore, the annual CO2 fixation for greening with trees was calculated using established research formulas. This study found that 73% of vacant houses in the study area remain unoccupied for an extended period, and when demolished, 56% become concrete-paved barren sites. The runoff simulations indicated that greening with trees led to a 1.71% decrease in annual runoff volume in the long-term model, with peak runoff volume reductions of 3.06% and 2.38% during 2-year and 30-year rainfall events in the short-term model, respectively. Planting trees could accommodate 3058 trees, fixing 62,124 kg of CO2 annually. This study demonstrates the climate change response effects of greening vacant houses.

1. Introduction

The area of vacant and abandoned houses is expanding around the original downtown locations in rural and metropolitan areas in South Korea. This is a result of the natural population decline due to the low birth rate, aging population, and movement of the population from city centers to the suburbs [1,2,3]. Neglected and unmanaged vacant houses can cause social problems, such as crime, deterioration of the surrounding landscape, and creating a cycle of producing other vacant houses [1,4,5,6].
South Korea has been implementing various measures to mitigate these problems. The Fifth Comprehensive Land Development Plan (2020–2040) and the Fifth Comprehensive National Environmental Management Plan (2020–2040), which provide the fundamental direction for national land and environmental management, propose strengthening the small-scale maintenance of old abandoned buildings, monitoring vacant houses, and implementing measures to prevent their transition into further vacancy. These plans are aimed at the management and utilization of old buildings and vacant houses, emphasizing sustainable smart shrinking strategies, such as the removal of vacant houses with low development demand or those that are difficult to reuse, in favor of preserving them as green spaces instead of replacing them with artificial structures.
Strategies to preserve vacant houses and idle spaces in city centers as green spaces can have various effects on declining downtown metropolitan areas. Large cities in South Korea developed rapidly during a period of high economic growth since the 1970s, resulting in overcrowded buildings and a scarcity of green spaces [7]. Busan Metropolitan City, the second largest city in South Korea, lacks sufficient land for development because slopes with an inclination of 10° or more occupy more than 50% of its total area [8]. After the Korean War, densely built residential areas for low-income workers were developed on these steep slopes, forming the original downtown residential area with narrow individual building sites and highly inadequate infrastructure, including parks and green areas [9]. Moreover, Busan has become a highly vulnerable region where the amount of runoff during intensive rainfall increases rapidly due to the steep slopes, causing considerable flood damage. In addition, the concentration of houses hinders air circulation, exacerbating heat during summer. If green spaces are provided in these areas, they can offer not only resting and leisure spaces for citizens but also climate change response effects such as flood risk and CO2 mitigation, which are currently being emphasized. However, the reality for local governments is that vacant houses are often neglected for a long time due to a lack of financial resources for maintenance and owners’ non-agreement. Although vacant houses may be demolished through vacant-house maintenance, they are typically left as barren sites with concrete pavements [10].
The effectiveness of the greening strategies emphasized in this policy, particularly concerning the demolition of persistently vacant houses and the management of barren sites left after demolition, requires thorough evaluation prior to their practical application and widespread adoption. Data-driven quantitative assessments can serve as a robust foundation for policy introduction and implementation. The benefits of greening vacant houses and idle spaces have been evaluated from various perspectives in other countries, including increased real estate prices [11], crime suppression [12,13,14], health improvements [12,15], enhanced access to green spaces [16,17], ecosystem connectivity [18], and fire protection [19]. Only Chae et al. [20] and Lee [7] have investigated the effects of greening vacant houses in South Korea. Chae et al. [20] examined the impact of demolishing vacant houses and creating vegetable gardens within a crime-safe village pilot project in Cheonan, Chungcheongnam-do, through a resident survey. Their findings suggest that demolishing vacant houses and engaging in gardening significantly reduced crime-related fears and fostered a sense of community among residents. Lee [7] conducted a simulation to assess the thermal environment improvement from creating green spaces in a densely populated residential area with vacant houses as part of an urban regeneration project in Daegu City. The study revealed that the formation of small-scale green spaces, such as gardens, had a minimal effect on temperature reduction, but the creation of a relatively large park led to a temperature decrease of 1.1–3.7 °C. However, little empirical research has been conducted on the effects of greening strategies in South Korea, partly due to the few instances of greening vacant houses and idle spaces, and the small areas these sites typically cover. Therefore, this study employs simulation analyses to investigate the planning process, focusing on the climate change response effects of green spaces, an aspect that has recently been gaining prominence. The response to climate change can be categorized into mitigation and adaptation strategies [21]. Mitigation strategies involve the reduction of greenhouse gases, such as carbon dioxide, which contribute to global warming. On the other hand, adaptation strategies focus on alleviating the impacts of climate-induced disasters, such as flood risk reduction, addressing damages caused by the changing climate. Given that the greening strategy aims to provide co-benefits in both mitigation and adaptation, this study examines the greening effects of vacant houses and demolished sites in terms of their potential for flood risk and CO2 mitigation effects.
While no previous studies have directly linked flood risk and CO2 mitigation to the greening of vacant houses, research on land cover changes related to these mitigation effects has been conducted. Studies on the flood risk mitigation effect of green spaces in urban planning have provided insights into land use, environmental, and disaster prevention planning. A study conducted by Nagano et al. [22] confirmed that the precipitation interception effect of tree canopies for rainfall exceeding a total of 20 mm ranges from 10% to 26%, with some variation depending on the type of trees. In their study, Choi et al. [23] analyzed surface runoff using simulations for urban areas on sloped terrain when employing low-impact development (LID) techniques such as planting and permeable pavement. The results revealed that with a reduction in impervious surfaces of approximately 1.5%, an expected annual decrease of about 7.4% in surface runoff could be achieved. In their simulation-based assessment of the impact of urban greening on runoff reduction for a short-term rainfall event exceeding 100 mm, Yang and Lee [24] revealed that greening with trees is more effective than greening with grass alone.
Studies on the CO2 mitigation effect of green spaces falls into two categories: those calculating carbon fixation of a unit of green space through direct measurement [25,26], and those determining carbon fixation for a target area using the estimated carbon fixation of a unit of green space [27,28]. The amount of CO2 fixation by trees varies significantly based on the tree species, growth stage, and environmental conditions. Many previous studies have focused on forest trees, determining carbon content from the dry weight of tree biomass. These studies also estimate equations for calculating annual carbon dioxide fixation based on tree attributes such as diameter at breast height and height [25]. In a study conducted by Jo and Cho [26], which measured the annual CO2 fixation for trees planted in urban areas in Korea, it was revealed that trees fix between 0.5 and 19.0 kg of CO2 per tree. Based on the results of these previous studies, research has been conducted to calculate the annual carbon sequestration by green spaces in urban and specific regions. In a study by Jo and Ahn [27] that calculated the comprehensive carbon reduction effects of trees in South Korean single-family residential areas, the total carbon sequestration per house ranged from 59 to 110 kg annually. The study further concluded that indirect effects, such as the reduction in heating and cooling energy consumption due to shade provided by trees, accounted for more than 70% of the overall carbon reduction effects. Lee [28] focused on typical multi-family residential buildings in South Korea, where green spaces accounted for 28% of the building volume. In this scenario, it was estimated that plants would take approximately 44 years to absorb all the CO2 emitted during the construction of the residential buildings.
In summary, this study examines the status of vacant houses and demolished sites in Ami-dong and Chojang-dong, Seo-gu, Busan Metropolitan City; these areas are deteriorated, high-density sloped residential areas in old downtown metropolitan areas with a significant vacancy problem. In addition, this study evaluates the flood risk mitigation and carbon fixation effects of implementing greening policies. To assess the effectiveness of flood risk mitigation, a greening scenario was constructed, utilizing K-LIDM, a runoff analysis model. CO2 fixation effects were evaluated using the annual carbon sequestration formula from previous research. The findings are expected to serve as a reference for utilizing vacant houses as space resources for green spaces in downtown locations, where securing such spaces is challenging. In addition, by quantitatively demonstrating the flood risk mitigation and carbon fixation effects of greening vacant houses, this research aims to support the advancement of greening policies for vacant houses, contributing to the realization of sustainable cities.

2. Materials and Methods

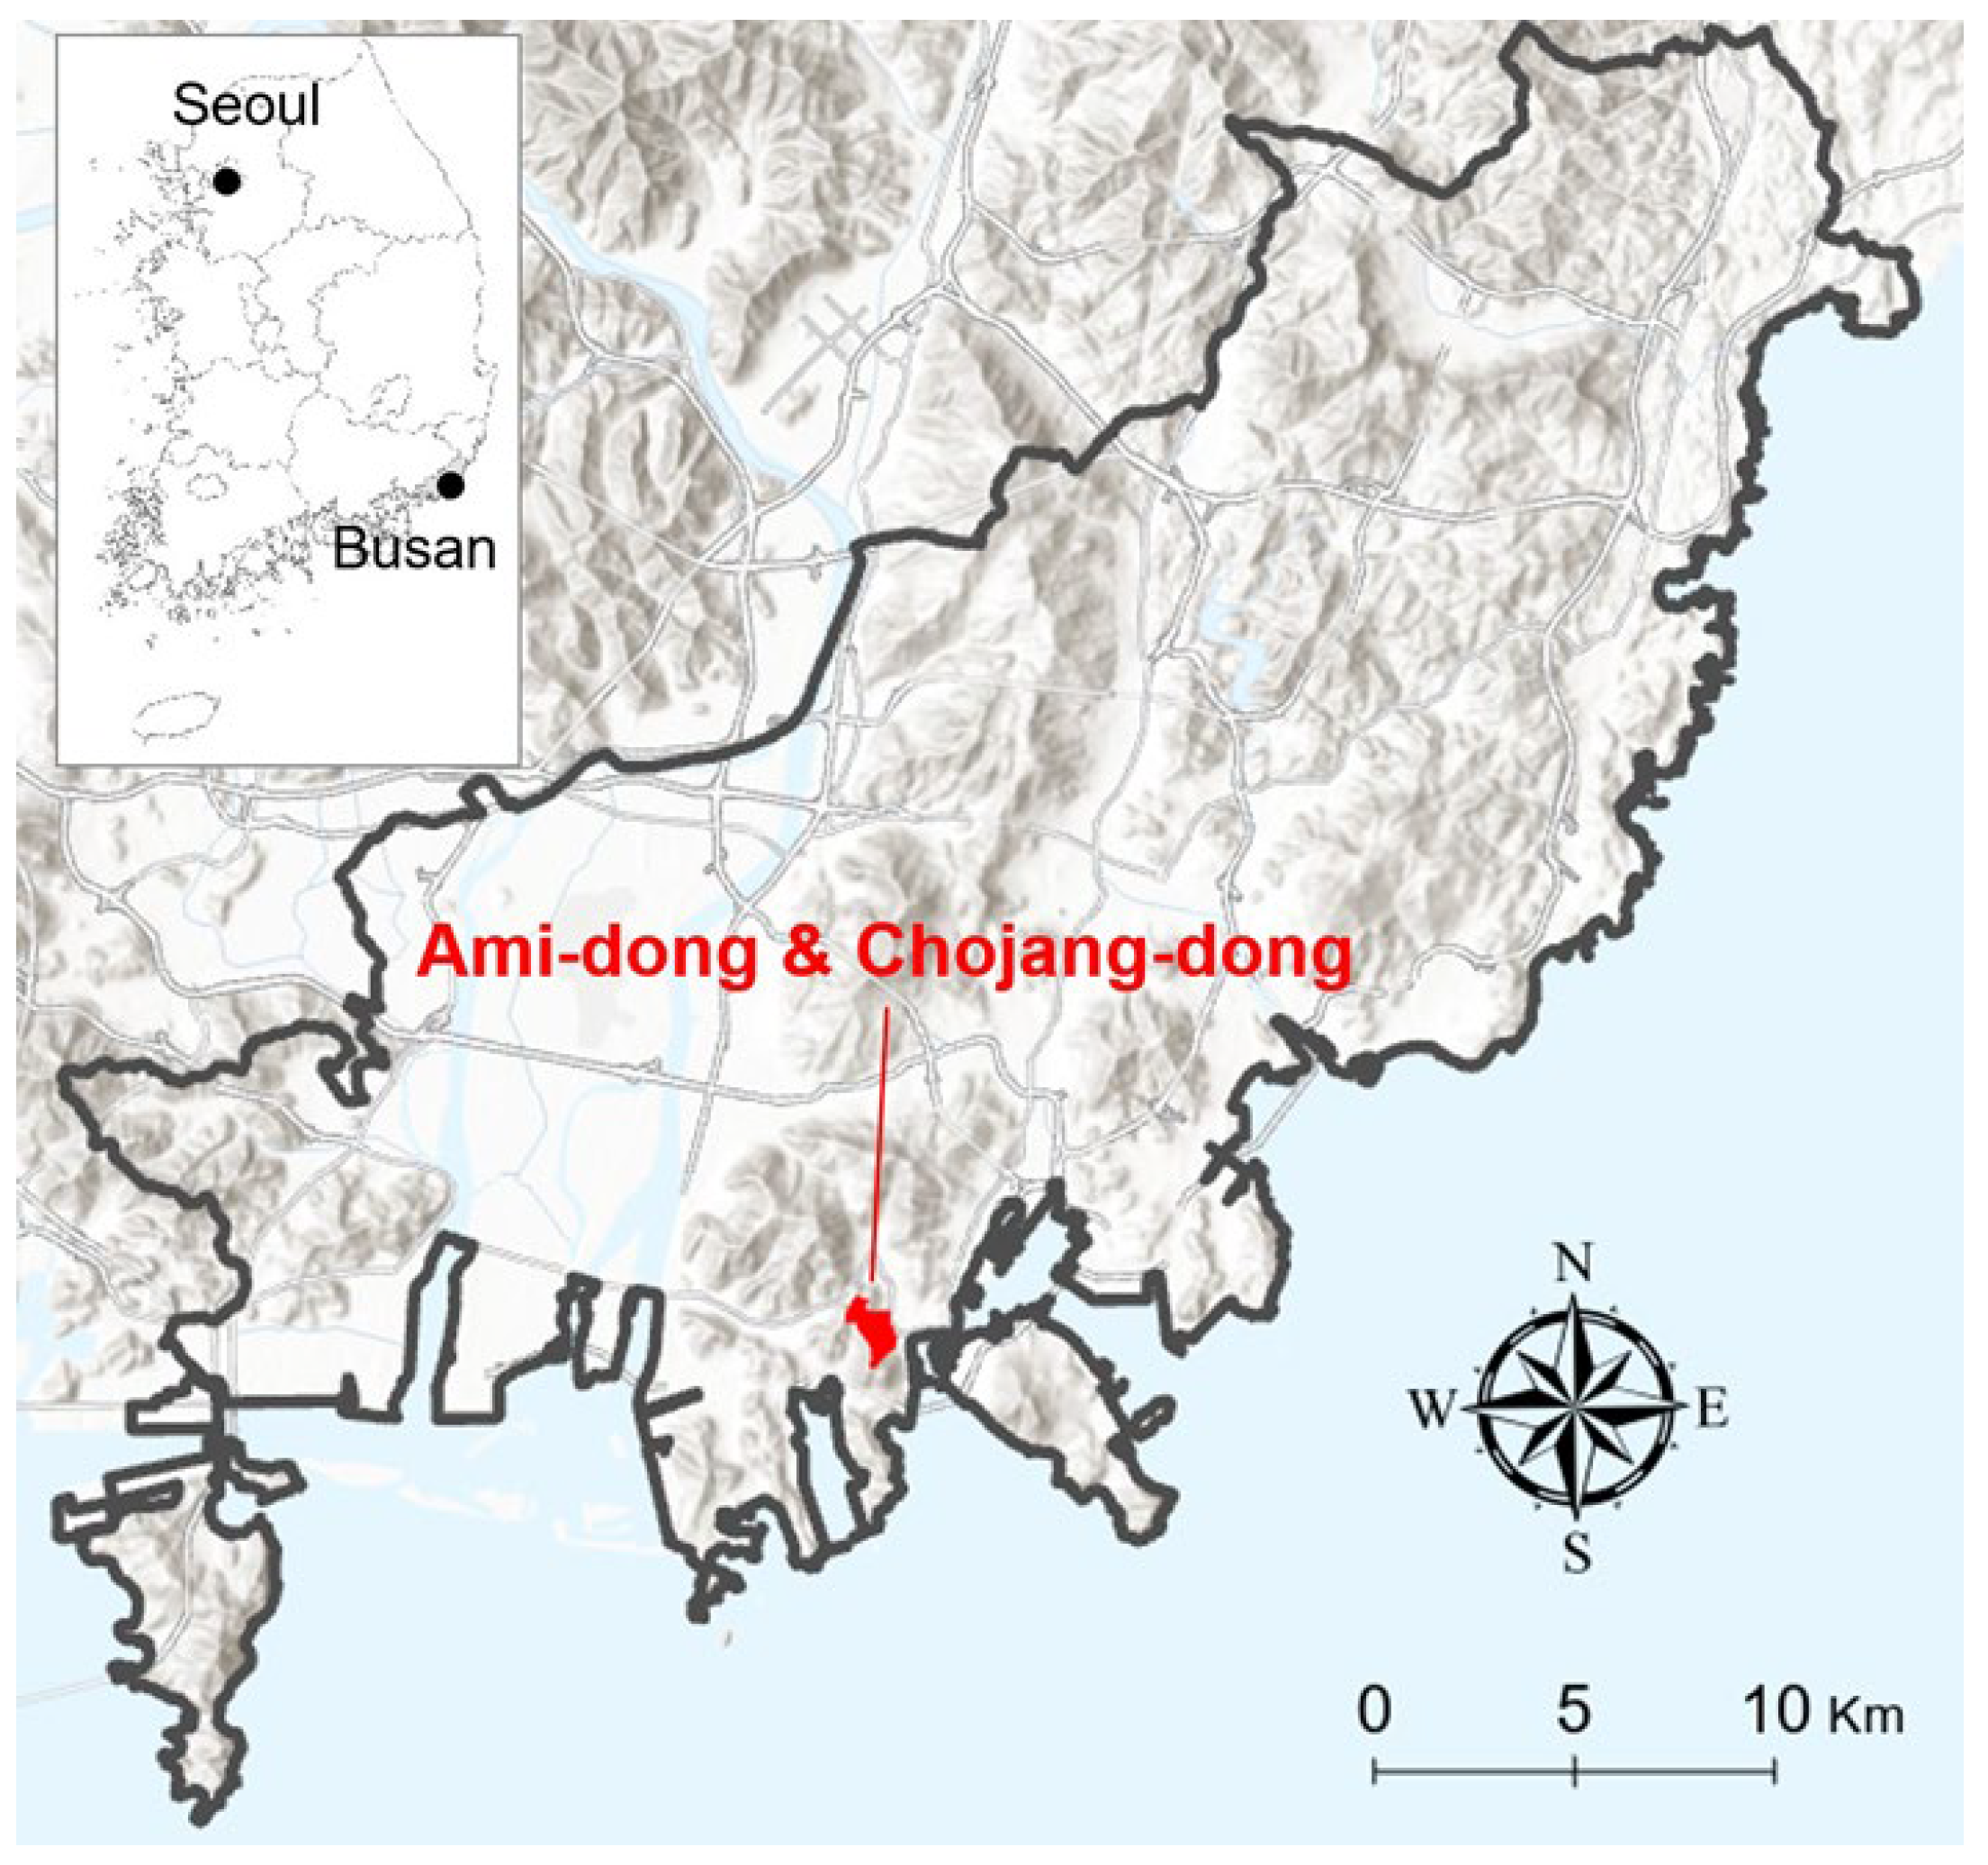
2.1. Study Area and Data

Busan Metropolitan City (35°05′ N, 128°35′ E) is situated at the southeastern tip of the Korean Peninsula and has a warm temperate climate. The annual average temperature is 15.3 °C, and the annual average precipitation is 1646.9 mm. Over the past century, the average temperature has increased by 1.9 °C, and the annual average precipitation has seen an increase of 203.7 mm [29]. The selected areas for this study, Ami-dong and Chojang-dong in Seo-gu, Busan Metropolitan City, are emblematic of urban decline in South Korea’s original downtown regions (Figure 1). The selected areas for this study, Ami-dong and Chojang-dong in Seo-gu, Busan Metropolitan City, are emblematic of urban decline in South Korea’s original downtown regions (Figure 1). These are typical high-density sloped residential areas, characterized by poorly constructed and illegal detached houses on steep slopes. Urban decline has progressed, leading to an increase in vacant houses. Despite local government efforts to maintain various vacant houses, the issue persists and is spreading, necessitating urgent measures for managing these vacant properties [1]. The total area of Ami-dong and Chojang-dong is 1.169 km2. This area between Mount Cheonma and Mount Ami is a typical sloped residential area, with approximately 83% of the land having an inclination of at least 10° [10]. Mountainous and farmland areas make up approximately 32% of the total land [30].
This study simulated greening strategy applications for barren sites that have been neglected after demolition and persistently vacant houses with a long history of neglect, low reuse potential, and a significant negative impact on the surrounding area [1]. Therefore, we utilized data on vacant houses and the most recent statistics on houses left vacant after demolition; specifically, we used data from vacant houses in 2017 and 2020. For the 2017 statistics, we relied on data collected in a study conducted by Jung and Woo [10]. Our research team collected data through a comprehensive local survey in November 2020, following the same conditions as the 2017 survey (Figure 2). The study area consisted of a detached-house site. Vacant houses are defined as unused or unoccupied residences, as determined by criteria such as police notification stickers on vacant and closed houses, the condition of electricity meters (whether functional or attached), the presence of discarded items such as garbage and mail, signs of people entering and leaving the yard, and the use of space for laundry and shoes. Additionally, we sought input from nearby residents to inquire whether these vacant houses had occupants, and their responses were factored into the assessment. Persistently vacant houses are those that had remained vacant from 2017 to 2020. In the subsequent sections, unless explicitly stated otherwise, the term “vacant house” refers to a “persistently vacant house” in the context of greening initiatives.
In the 2020 survey, we examined vacant houses and the conditions of sites following building demolition. Among the sites where buildings were demolished, some were repaired and converted into parking lots, while others remained neglected and unused. In this study, we categorized the used and idle sites as “maintenance” and “barren” sites, respectively (Figure 2). We conducted a comprehensive investigation of both maintenance and barren sites alongside an assessment of land cover conditions and intended use.
The data collected through full-scale local surveys were compiled as geographic information system (GIS) data based on the road name address electronic map. We used this data to assess the conditions of vacant houses and demolished sites in the study area, defining greening scenarios based on these conditions. Subsequently, we calculated flood risk mitigation effects for each greening scenario; we also analyzed the CO2 mitigation effects resulting from tree planting in persistently vacant houses and barren sites.
There are four greening scenarios considered for the analysis of flood risk mitigation: the current scenario (S1), which serves as the base, concrete pavement (S2), ground cover plants (S3), and tree planting (S4) scenarios. The scenarios involve the assumption of demolishing vacant houses and planting ground cover plants or trees. The scenarios are detailed in Table 1.

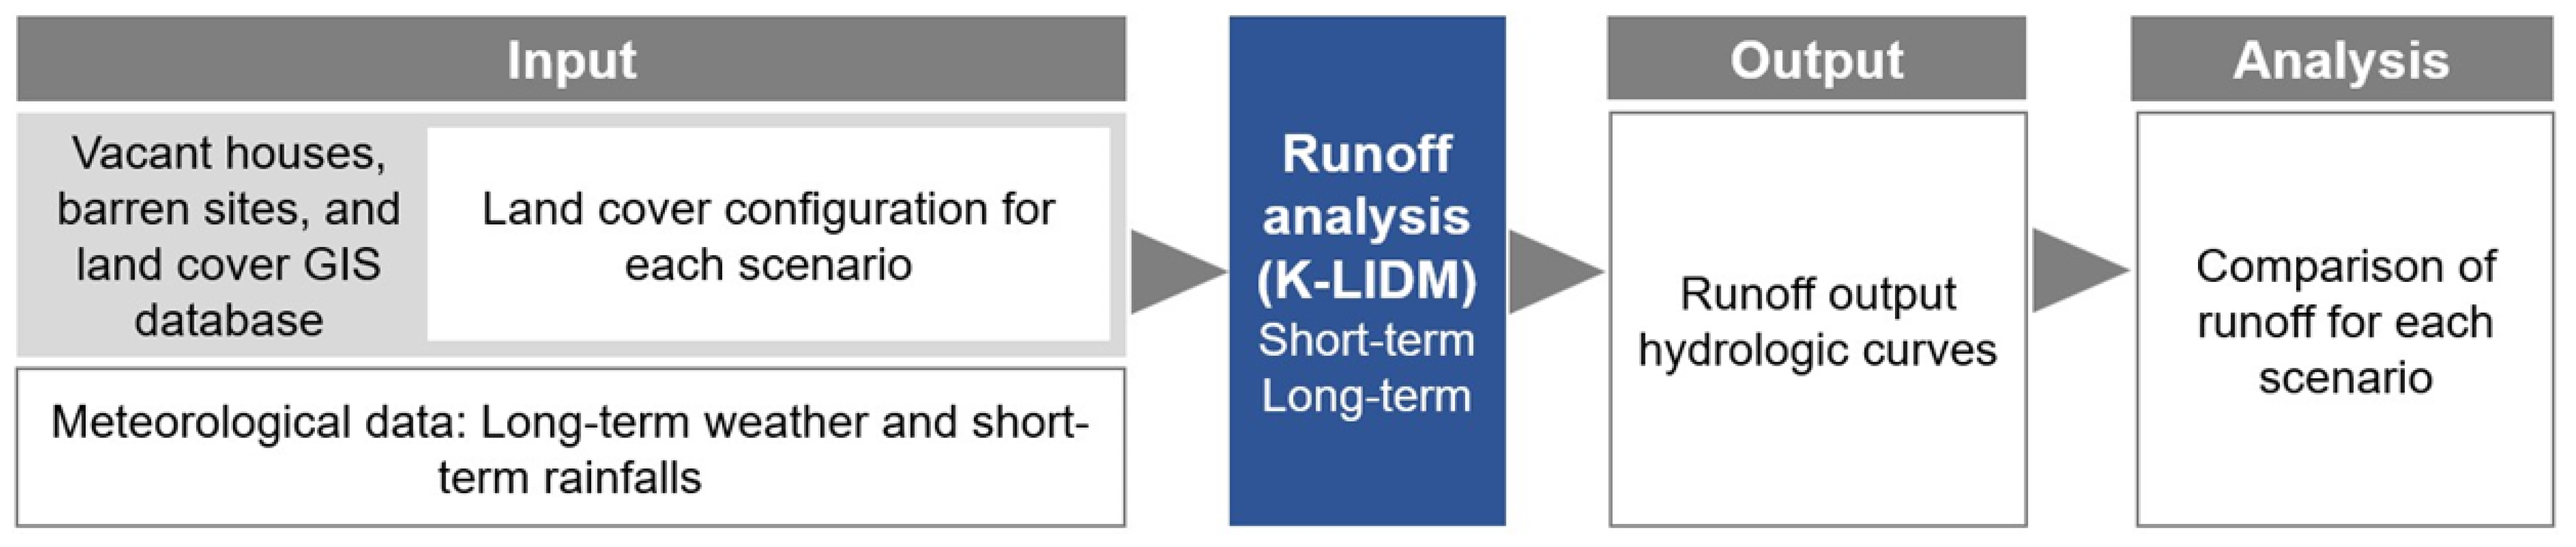
2.2. Analysis Method for Flood Risk Mitigation Effects

In Figure 3, the flow of the analysis for flood risk mitigation effects through greening of vacant houses and barren sites is illustrated. To analyze the flood risk mitigation effects of greening vacant houses, the rainfall runoff characteristics for each scenario were compared and evaluated by using K-LIDM [31], a runoff analysis model developed by Pusan National University’s Korea GI·LID Center. The runoff analysis model takes various forms, and one example is LIDMOD2, a simplified model developed in Excel that is widely used [23]. However, K-LIDM stands out as a suitable model for application in the study area, which includes steep slopes, due to its detailed configuration options for slope angles. Unlike LIDMOD2, K-LIDM allows detailed land cover settings that reflect the basin topography, such as slope, making it particularly well suited for the targeted regions with steep terrain in this research. In addition, it has a rainfall database that includes the study site [32].
The K-LIDM model complements the LID technique analysis function by linking with the stormwater management model (SWMM) [33], a runoff model developed by the U.S. Environmental Protection Agency. This model can assess changes in land cover and water circulation before and after implementing LID techniques. The rainfall runoff calculation was developed based on the hydrological simulation program—Fortran (HSPF) model [34]. The weather conditions can be input using the long- and short-term rainfall databases of the nearest meteorological observation station to the analysis area.
The input values required for runoff analysis using K-LIDM are the land cover areas for each inclination level of the watershed. Table 2 summarizes the input conditions and usage data considered in this study. In K-LIDM, slope inclinations are categorized into three levels: flat (≥0° and <5°), mod (≥5° and <15°), and steep (≥15°). Permeable surface land cover is divided into three types: forest, pasture, and grass. Impermeable surfaces comprise five types: road, roof, driveway, sidewalk, and parking lot. In this study, each land cover area by slope was determined using the site slope raster data from a continuous digital topographic map, land cover map, road name address electronic map, and field survey results. The data were input for each scenario.
The runoff analysis comprised both short-term and long-term analyses. For the short-term runoff analysis, 24 h runoff curves were computed for 2 years and 30 years frequency rainfall events calculated based on precipitation data from the nearest weather station to the study area. Similarly, in the long-term runoff analysis, the annual runoff volumes for typical rainfall patterns in the study area, calculated based on historical rainfall data (2005–2014), were determined. The results were then compared by scenario.

2.3. Analysis Method for CO2 Mitigation Effect

The CO2 mitigation effect of greening must consider both direct CO2 absorption by plants and CO2 emissions resulting from the decomposition of organic matter in soil, as well as energy consumption for green space management in urban green spaces [35]. Furthermore, indirect CO2 mitigation effects, such as reduced cooling energy consumption in the summer due to improved thermal environments resulting from evapotranspiration and solar radiation blocking in green spaces, as well as decreased heating energy consumption in the winter through windbreaks [27,36], are expected. In this study, the carbon inflow from soil due to decomposing fallen leaves and carbon emissions from the soil due to the decomposition of soil organic matter were considered net zero. This is in accordance with the values applied by the Korean Forest Service, following the guidelines for carbon sequestration calculation provided by the Intergovernmental Panel on Climate Change [25]. Moreover, carbon fixation by ground cover plants was excluded from the calculation due to its negligible impact [37]. Carbon emissions from green space maintenance were also excluded from our calculations due to a lack of data; indirect reduction effects were also excluded.
In this study, we selected suitable tree species for greening the study area through a literature review and determined the annual CO2 fixation formulas for these selected trees based on existing studies. The annual CO2 fixation formulas, as mentioned earlier, represent equations that quantify the direct CO2 fixation by plants. In Korea, various studies, led primarily by the Korean Forest Service, have been conducted to derive these estimation formulas for different tree species. Next, by using GIS database on vacant houses and barren sites, we calculated the number of trees that could be planted in the study area. By applying the annual CO2 fixation formulas to this tree count, we calculated the annual CO2 fixation resulting from greening. This allowed us to evaluate the CO2 mitigation effect of greening vacant houses and barren sites.

3. Results

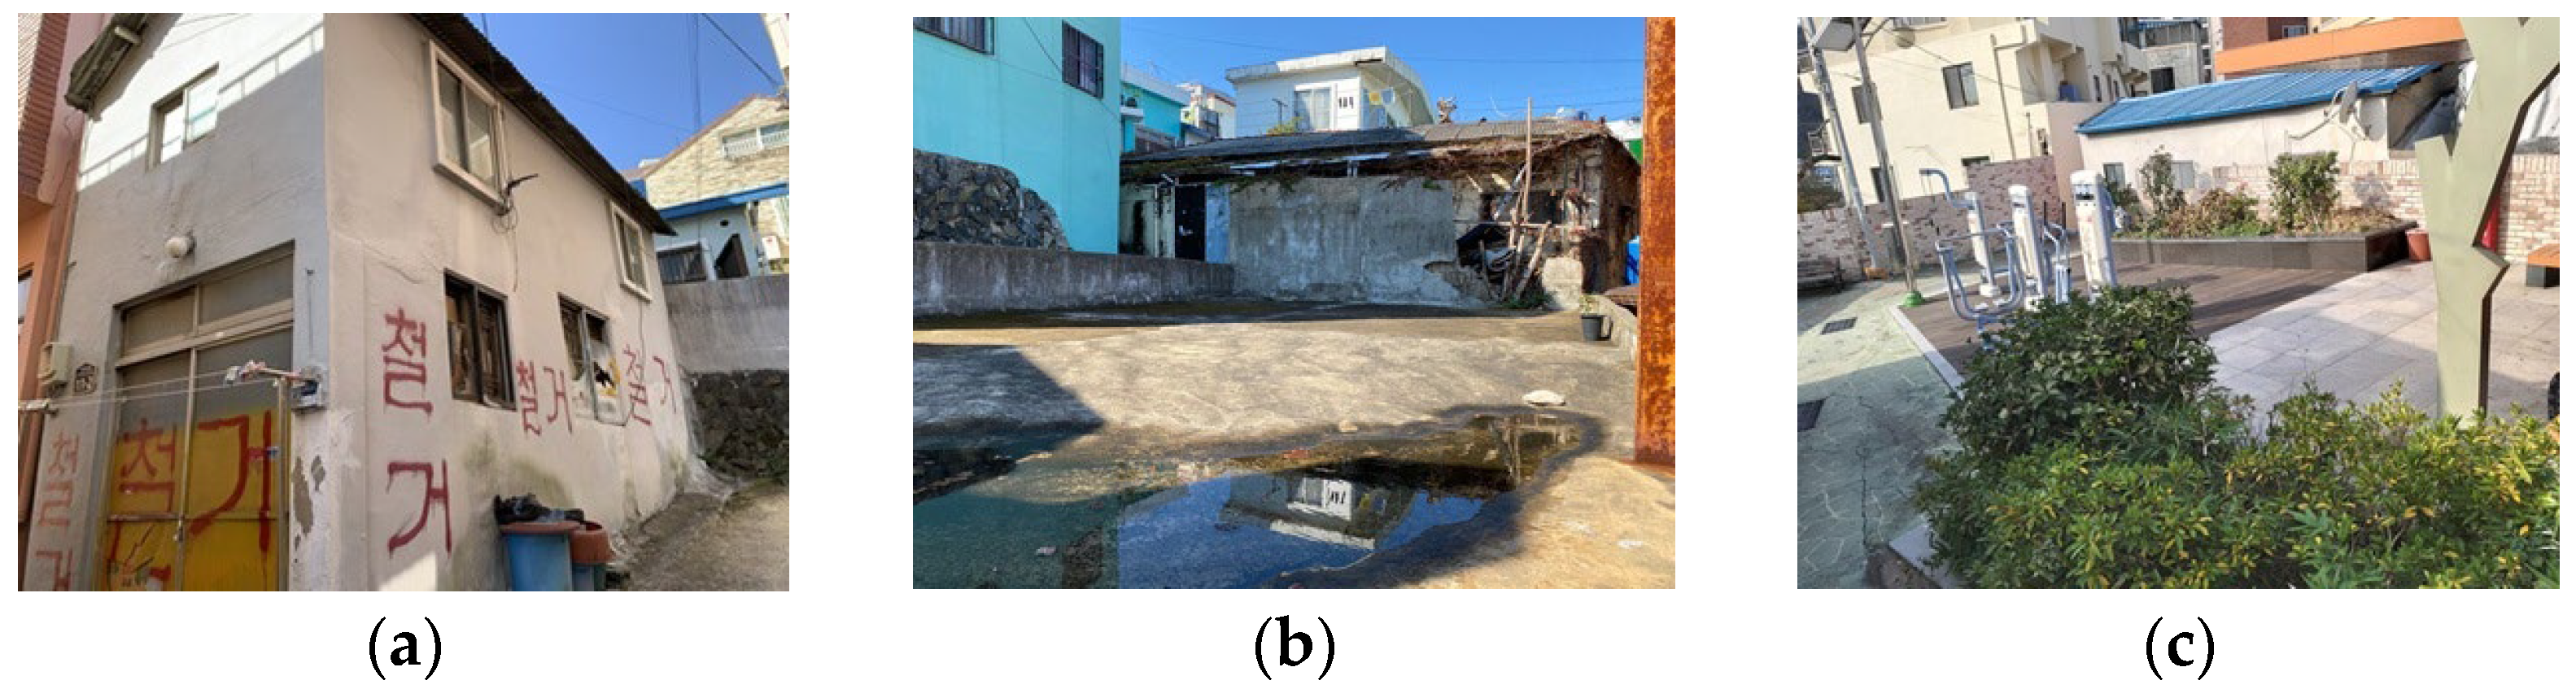
3.1. Current State of Persistently Vacant Houses and Demolished Building Sites in the Study Area

An analysis of changes in vacant houses from 2017 to 2020 reveals that there were 340 vacant houses out of 3787 detached houses in 2017. The number of persistently vacant houses in 2020 was 246, accounting for approximately 72.35% of all vacant houses in 2017. In 2020, 498 of 3675 detached houses were vacant, with 252 new vacant houses. These results suggest that once houses become vacant, they are unlikely to be reused. In the study area, the average annual increase rate of vacant houses was 13.57%, confirming the persistent existence of vacant houses throughout the area.
Table 3 summarizes the surface states of the demolished building sites as of 2020. In the study area, there were 313 demolished building sites. Although the previous uses or reasons for demolition of the buildings could not be determined, it is presumed that most of these sites were detached houses, given the characteristics of the area. Moreover, many vacant houses were demolished as part of a vacant-house maintenance project carried out by the local government; these must also be considered.
A total of 213 sites were left as barren sites after demolition, accounting for 68.05% of all demolished sites. Among them, 177 sites (83.10%) featured impermeable concrete pavement surfaces (Table 3). In this region, the prevalence of concrete pavements was due to post-demolition management challenges. For the barren sites situated on permeable surfaces, there were seven cases where gravel was spread to inhibit plant propagation. Most permeable barren sites were neglected and overgrown with weeds.
Among the demolished sites, 100 sites were reused as parking lots. A review of the usage status of these maintenance sites showed that 33 sites were maintained as roads or sidewalks, 29 were used as communal spaces such as parks or sports facilities, 24 served as vegetable gardens, and 5 were used as parking lots.
Figure 4 depicts the locations of persistently vacant houses and barren sites targeted for greening. Additionally, the positions of maintenance sites are included for reference.

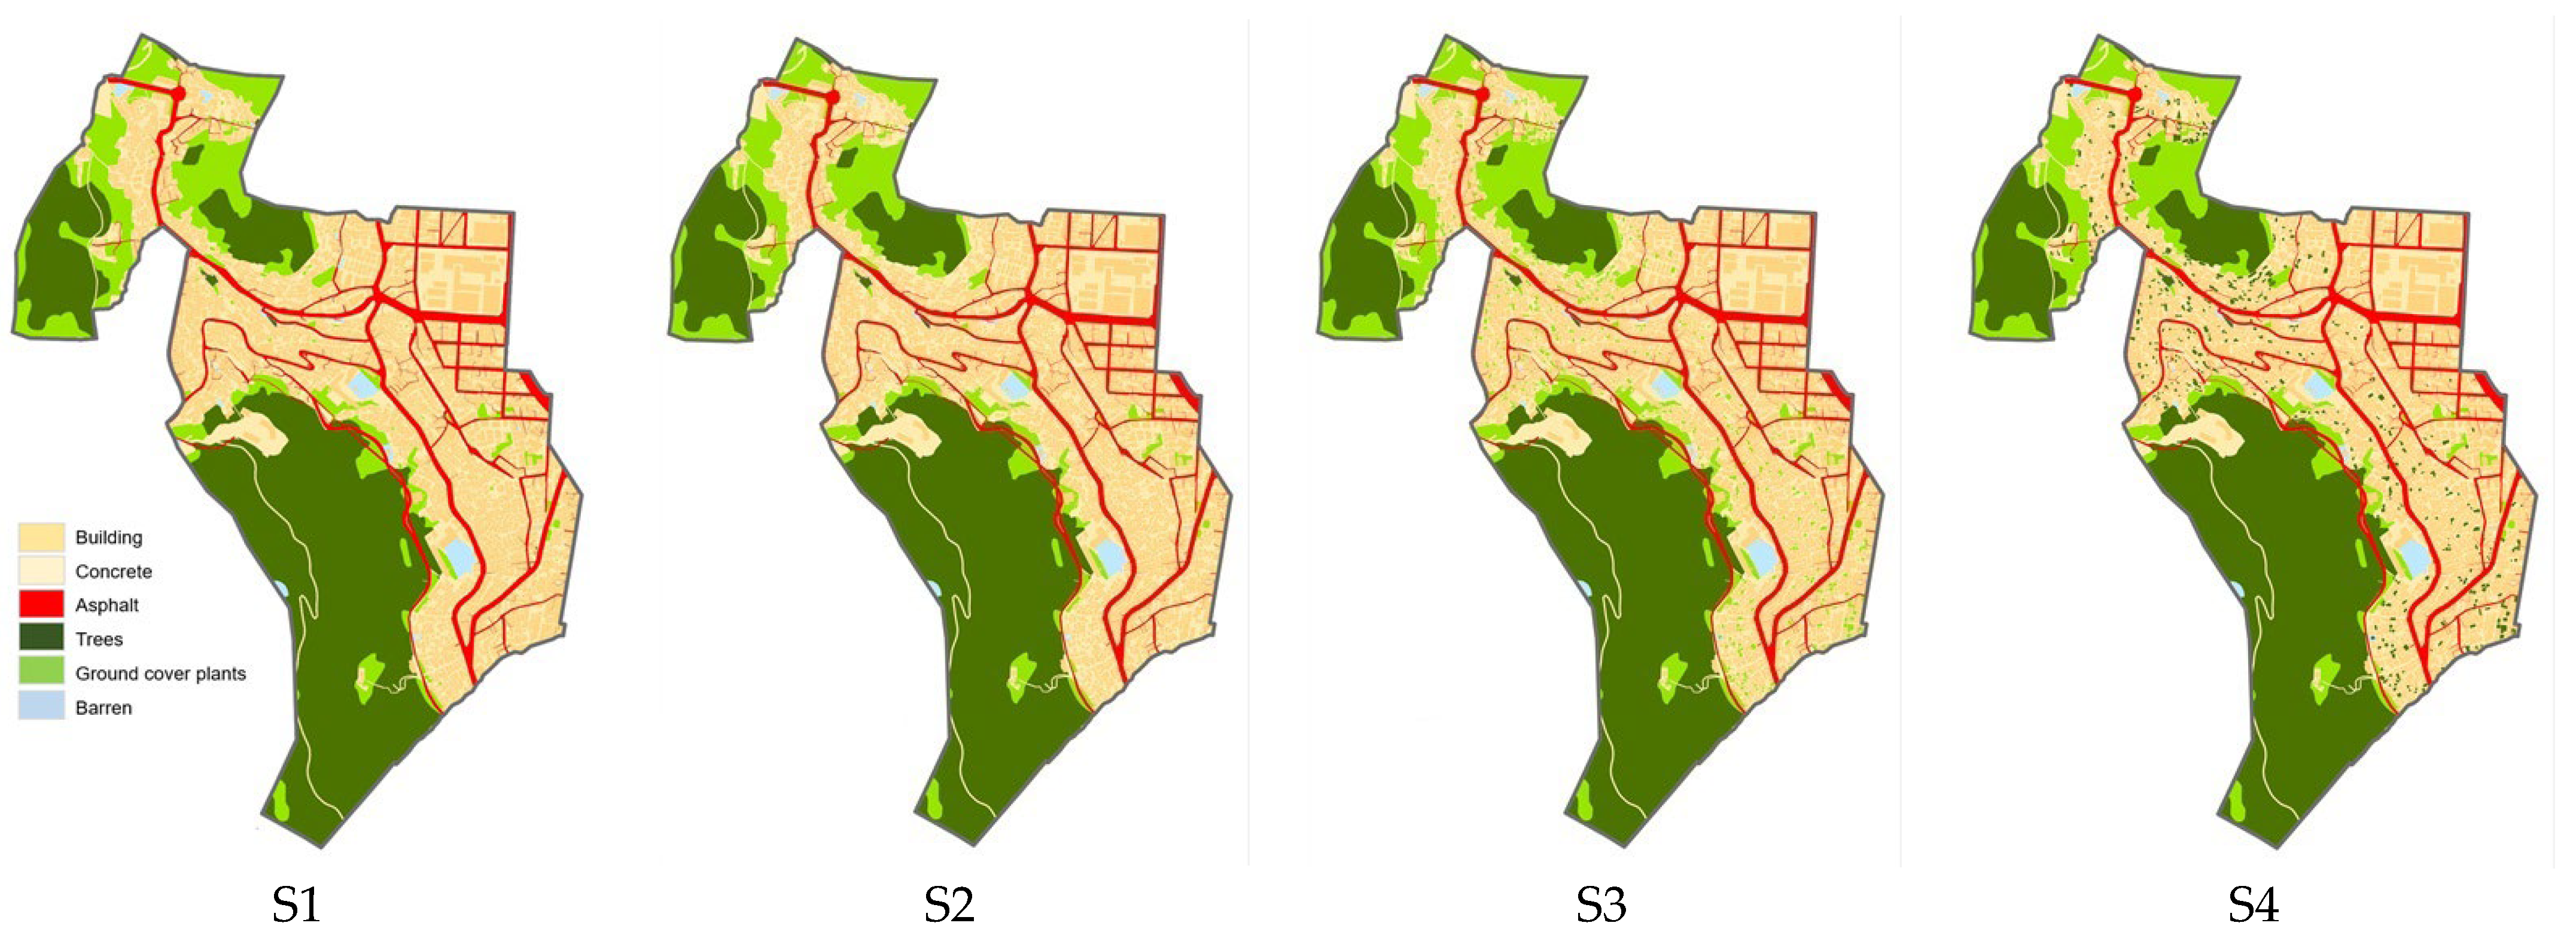
3.2. Deriving Greening Scenarios

Table 4 summarizes the area and percentage of land cover for each scenario. Impermeable surfaces were classified into three types: building, concrete, and asphalt. Permeable surfaces were classified into three types: barren, ground cover plants, and trees. The area calculations were based on field survey results, a road name address electronic map, and a land cover map. Initially, ground surfaces identified as roads in the land cover map were classified as asphalt, and other urban/dry areas were classified as concrete. Building areas were calculated based on the road name address electronic map. The ground surfaces of barren and maintenance sites from field survey data were then incorporated. Forest areas in the land cover map were classified as trees, grassland and agricultural areas as ground cover plants, and barren sites as barren. In the current state (S1), impermeable surfaces in the study area accounted for 53.80% of the total area, whereas buildings accounted for 24.42% of the total area. The study area is surrounded by Mount Ami and Mount Cheonma, resulting in trees covering 33.50% of the total area. The total area of persistently vacant houses and barren sites slated for demolition measured 19,764 m2. The total area being smaller than the administrative district’s area (1.169 km2) is due to the exclusion of areas where large-scale construction projects were underway during the survey period for vacant houses and vacant lots from the analysis. Figure 5 illustrates the land cover for each scenario.

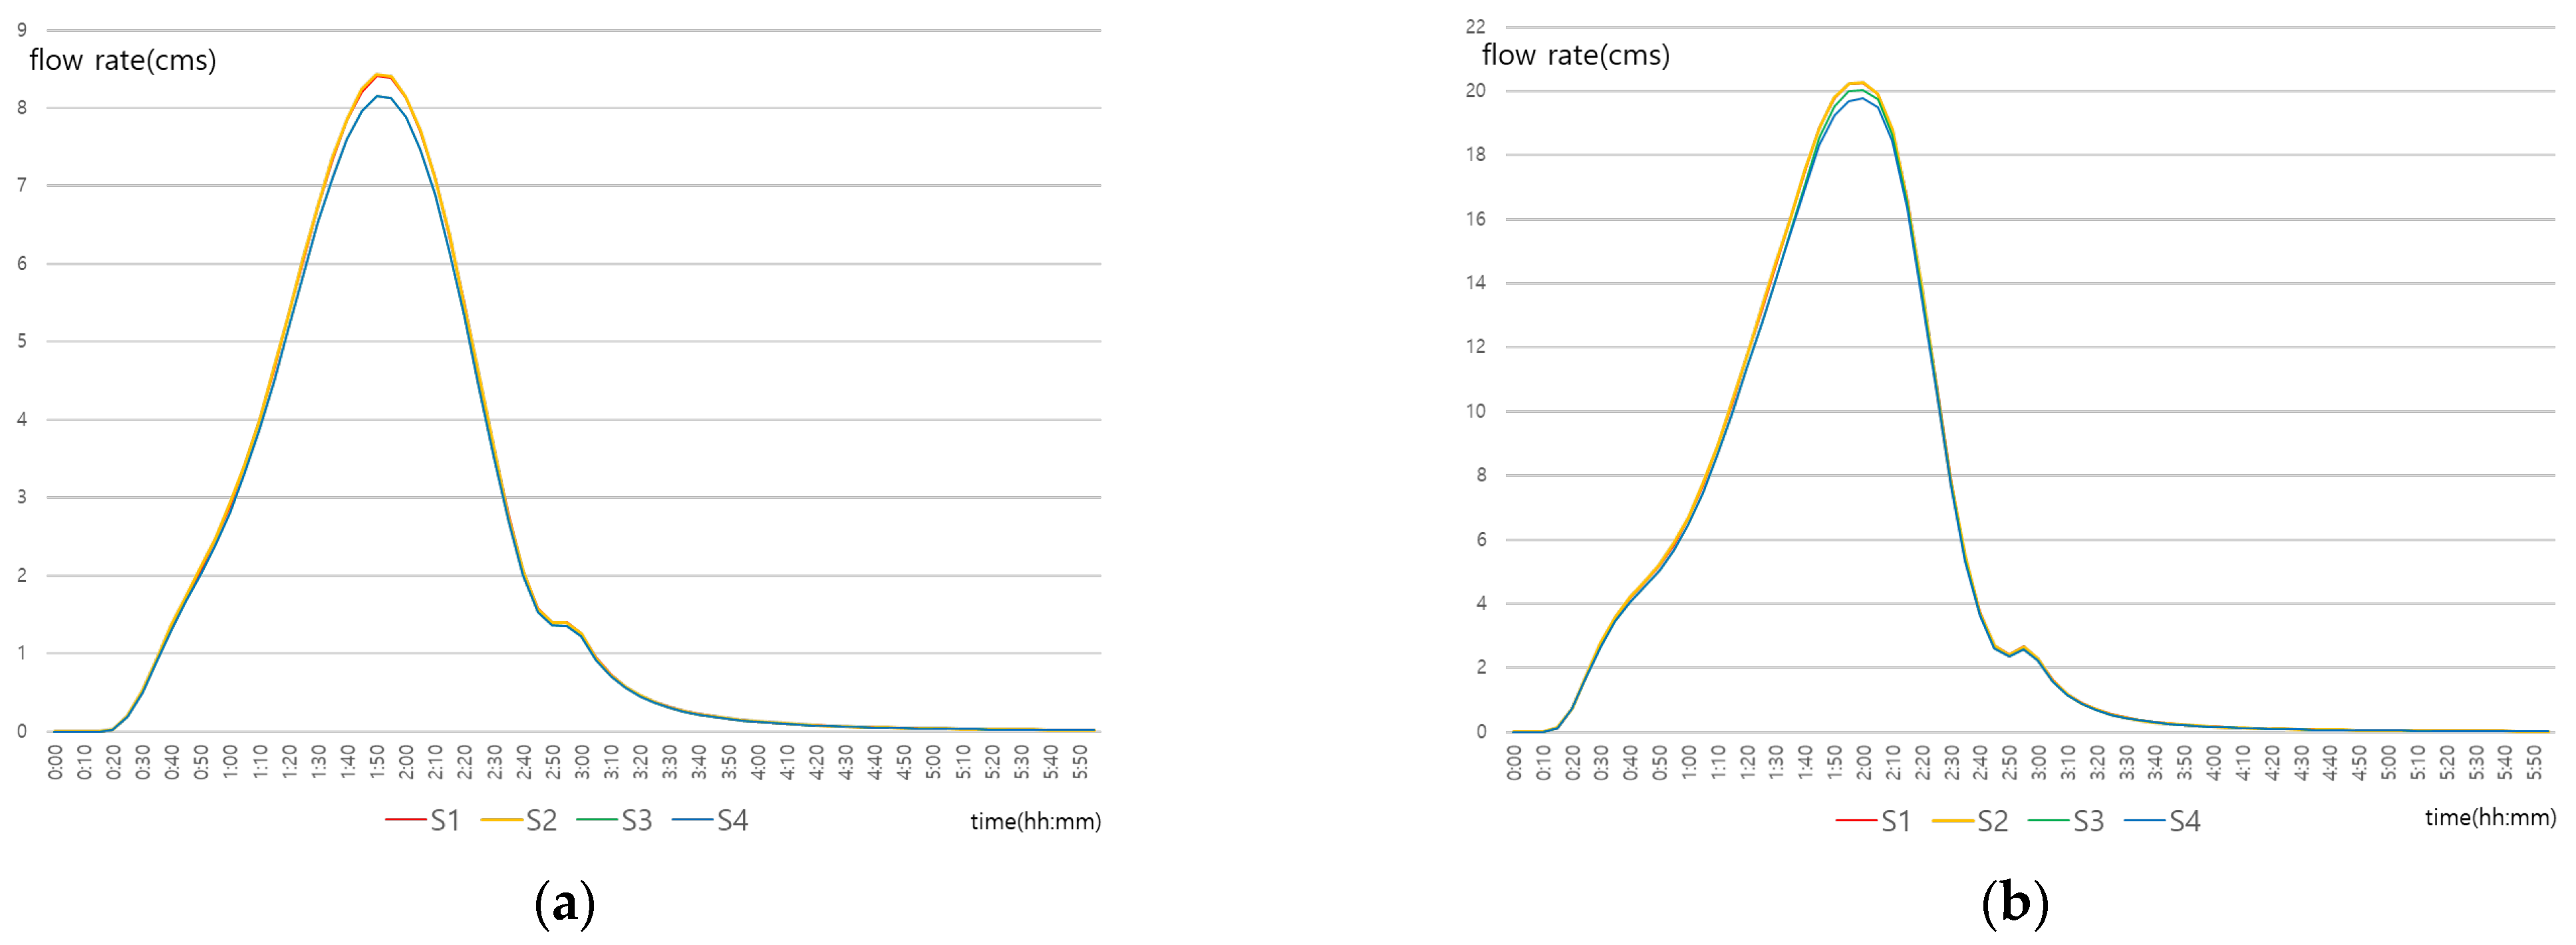
3.3. Flood Risk Mitigation Effect

Rainfall runoff analysis was conducted for each scenario by using K-LIDM to assess the flood risk mitigation effect of greening vacant houses and barren sites. Runoff flow was examined with both long- and short-term runoff models. In the case of the short-term runoff model, data for 30-year and 2-year rainfall events were analyzed over a 180 min period.
For the runoff analysis under the long-term runoff model, the annual average flow rate of rainwater from the target site for each scenario was calculated and compared based on scenario (Table 5). The flow rate increased by 0.16% in S2 compared to that in S1, where both vacant houses and barren sites were paved with concrete. Conversely, the flow rate decreased by 0.91% and 1.71% in S3 and S4, respectively. When compared to S2, which had the highest flow rate, the flow rates in S3 and S4 decreased by 1.07% and 1.86%, respectively.
The results of the short-term rainfall runoff analysis are shown as runoff curves for both 2-year and 30-year rainfall scenarios. In the case of the 2-year rainfall scenario (Figure 6a), S1 and S2 exhibited similar curves, while S3 and S4 showed overlapping curves. Similarly, the 30-year rainfall curves (Figure 6b) showed similarity between S1 and S2, but a slight difference was observed between S3 and S4. Notably, S4 had the smallest flow rate, and the runoff curves did not show variations in peak time across all scenarios.
Table 6 summarizes the peak flow rates for each rainfall scenario. In the 2-year rainfall case, the peak flow rates of S3 and S4 were the same, and the peak flow rate decreased by 0.26 CMS (3.06%) compared with that of S1. The peak flow rate of S2, which was the highest flow rate, increased by 0.02 CMS (0.26%) compared to that of S1. By contrast, the flow reduction rate of S3 and S4 was 3.31%. In the 30-year rainfall case, the peak flow rate decreased in S3 and S4. Compared with that of S1, the peak flow rate of S3 and S4 decreased by 0.20 CMS (0.99%) and 0.48 CMS (2.38%), respectively. The peak flow rate of S2, which was the highest flow rate, increased by 0.01 CMS (0.01%) compared to that of S1. By contrast, the peak flow rate of S3 and S4 decreased by 0.21 CMS (1.04%) and 0.49 CMS (2.43%), respectively.
The decrease in the peak flow rate in the greening scenario was larger for the 2-year rainfall event than for the 30-year rainfall event. In addition, the effect of greening was more prominent during lighter rainfall. Moreover, in the case of the 30-year rainfall event, there was a distinction in the peak flow rates between S3 and S4. This suggests that, during heavy rainfall, S4 exhibits a greater flood risk mitigation effect than S3.

3.4. CO2 Mitigation Effect

The selection of trees suitable for achieving the CO2 mitigation effect was the first step. Subsequently, the resulting CO2 mitigation effect achievable by planting these trees was calculated using an equation based on previous studies.
The following four conditions were established for the trees chosen for greening the target sites: (1) trees of a size suitable for planting in vacant houses and barren sites, (2) landscape trees commonly planted in urban areas in South Korea, (3) trees with a relatively slow growth rate that require infrequent pruning, and (4) deciduous broadleaf trees that effectively block sunlight in summer and allow solar radiation in winter. Condition (3) can be considered a criterion for tree selection from a climate change mitigation perspective.
Before considering condition (1), the average area per site was calculated. Based on the road name address electronic map, the average area per persistently vacant house and barren site slated for demolition was determined to be 38.89 m2. Therefore, it was assumed that the appropriate crown size for trees that could be planted on vacant houses and barren sites after the removal of vacant houses should be within 7.0 m in width. Regarding conditions (2)–(4), it was assumed that deciduous broadleaf trees, such as Chinese maple and red maple, were planted based on research by Lee [38], which established quality evaluation criteria by standardizing the measurements for 15 tree species, considering the primary planting functions of landscape trees. The average diameter at breast height (DBH), mean crown width (W), and mean crown area of Chinese and red maples, as measured by Lee [38], were 13.0 cm, 2.8 m, and 6.2 m2, respectively.
In this study, we utilized equation 1 proposed by Lee [28] to calculate the annual carbon fixation of broadleaf trees for evaluating the CO2 mitigation effect of greening. This equation was developed based on research on Korean trees. It is important to note that the carbon fixation rates of trees vary among different species; even within the same species, they can differ based on factors such as forest type, forest age, growth conditions, stand density, and climate [35]. Consequently, the equation was considered suitable for application in this study.
Annual carbon fixation (CO2 kg/tree·y) = −4.2136 + 1.9006DBH − 0.0068DBH2
The annual carbon fixation per deciduous broadleaf tree planted in the study area can be computed as 19.35 CO2 kg/tree·y by substituting the average value of the DBH as shown in Equation (1). The annual carbon fixation resulting from greening the demolished vacant houses and barren sites (S4) can be determined by multiplying the annual carbon fixation per tree by the number of trees to be planted. The number of trees that can be planted was calculated by dividing the total area of vacant houses and barren sites by the canopy area of the trees (6.2 m2). Therefore, 3211 trees could be planted. Therefore, the annual carbon fixation resulting from the greening of vacant houses and barren sites in the study area with trees was calculated to be 62,123.78 CO2 kg/y.

4. Discussion

4.1. Climate Change Response Effects of Greening Vacant Houses

In the analyzed study area characterized by steep slopes and dense residential development, greening initiatives covering 246 persistently vacant houses and 213 barren sites, totaling an area of 19,764 square meters (approximately 2% of the analyzed area), demonstrated a reduction in annual runoff volume of 0.91% for the ground cover plants scenario and 1.71% for the tree planting scenario in the long-term runoff model. Although these values are slightly lower when compared to the findings of Choi et al. [23] (7.4% reduction in annual runoff volume with 1.7% reduction in impervious surfaces), it is essential to consider that Choi et al. [23] incorporated LID techniques, including permeable surface materials, unlike the straightforward planting applied in this study. Thus, the observed reduction remains a reasonable outcome. The combination of additional LID techniques, such as rainwater storage layers and permeable pavement, has the potential to enhance flood risk mitigation effects further in the future.
In the short-term runoff model, the peak runoff reduction effect due to greening was more pronounced for the 2-year rainfall event compared to the 30-year rainfall event. Additionally, in the case of the 30-year rainfall event, differences in the effectiveness of greening were observed between ground cover plants and trees, with tree planting demonstrating a 1.39% higher peak runoff reduction effect. These results align with the findings of Yang and Lee [24], supporting the conclusion that tree planting as part of greening initiatives is effective in reducing flood risk for the region.
In both the long-term and short-term runoff models, applying the common practice of post-demolition concrete pavement to all vacant houses (Concrete Scenario) resulted in an increase in runoff compared to the current state. Considering the upward trend in precipitation due to climate change, persisting with concrete pavement for vacant houses poses an elevated flood risk for the region. The study area is adjacent to an area with a high risk of flooding due to inland water [39]; therefore, greening is expected to increase local disaster safety. Therefore, integrating greening of vacant houses into vacant-house management strategies is imperative to mitigate the increasing flood risk associated with climate change.
The CO2 mitigation effect of greening was assessed by calculating the annual CO2 fixation of planted trees. Trees suitable for greening vacant houses and barren sites include deciduous broadleaf trees with relatively slow growth that do not require frequent pruning, such as Chinese or red maples. A total of 3211 of these trees can be planted, enabling a substantial carbon fixation of 62,123.78 CO2 kg/y. According to the National Greenhouse Gas Statistics of the National Statistical Office, the annual carbon dioxide emission per capita in South Korea was 14,088 kg in 2018 [40]. Therefore, greening persistently vacant houses and barren sites in Ami-dong and Chojang-dong with trees can offset the emitted CO2 equivalent to approximately 4.4 people per year.
Due to the condition of densely populated residential areas, there were limitations on the types of trees that could be planted, and, therefore, the impact of this effect may not be significant. However, considering indirect CO2 mitigation effects, such as those demonstrated by Jo and Ahn [27], including shade formation and winter windbreak effects provided by trees leading to a reduction in heating and cooling energy consumption, vacant-house greening has the potential for further CO2 mitigation effects.
From the above discussion, it can be concluded that greening of vacant houses, especially through tree planting, has the potential for flood risk mitigation and climate change response, including carbon dioxide reduction. Although individual effects may appear small due to the versatility of green spaces, combining these effects can significantly improve environmental conditions.

4.2. Sustainable Management of Vacant Houses in Old Downtown Metropolitan Areas

The policy implications derived from this study highlight that greening vacant houses and idle spaces can be a sustainable management plan for vacant houses in a low-growth era, as emphasized by many previous studies [11,12,13,14,15,16,17,18,19,20]. However, in reality, most vacant houses are typically left as concrete pavements after demolition, as observed in the study area. The survey results of this study revealed that 56.55% of the 313 sites where buildings were demolished were left neglected with concrete pavement. The burden of management may be a primary reason why current barren sites are paved with concrete rather than greened. Improperly managed barren sites that have been neglected after demolition can adversely affect the living environment; thus, developing a green space management plan is essential to implement the greening strategy. In some areas of Japan and the USA, residents have been hired for green management after greening demolished sites [41]; the greening of vacant houses could be facilitated by providing similar incentives such as hiring residents for green management. The effect of greening on responses to climate change was also verified in this study. However, the flood risk and CO2 mitigation effects are difficult for residents to experience directly; if the cooperation of the residents is necessary for greening, a plan to provide corresponding incentives should be presented.

5. Conclusions

This study aimed to evaluate the climate change response effects of greening vacant houses and barren sites in deteriorated high-density residential areas within old downtown metropolitan areas. The current status of demolished building sites was identified in the study area of Ami-dong and Chojang-dong, Seo-gu, Busan Metropolitan City. Furthermore, the effects of greening were quantitatively evaluated in terms of flood risk and CO2 mitigation effects.
The analysis of flood risk mitigation effects involved constructing four greening scenarios for vacant houses and barren sites. A comparison of runoff quantities for each scenario was conducted using the K-LIDM runoff analysis model, encompassing both short-term and long-term runoff models. The CO2 reduction effects were assessed by assuming the greening of all vacant houses and barren sites in the study area with trees and calculating the annual CO2 fixation amount using a previous CO2 fixation estimation formula for trees.
This study’s results can be summarized as follows. Firstly, in the study area, there is a tendency for vacant houses to remain unoccupied for extended periods once they become vacant. Furthermore, when these houses are demolished, they are frequently left neglected with concrete pavement, highlighting the insufficiency of efforts in securing green spaces in vacant-house management. Secondly, the flood risk mitigation effect of greening long-neglected vacant houses and barren sites is most effective when utilizing trees for greening. Compared with the current state in the long-term runoff model, a reduction of 1.71% in annual runoff volume was observed. In the short-term runoff model, a reduction of 3.06% in peak runoff volume for a two-year rainfall event and 2.38% for a 30-year rainfall event was anticipated. Lastly, greening strategies with trees resulted in a CO2 mitigation effect, fixing an annual amount of 62,123.78 kg of CO2. In conclusion, greening long-neglected vacant houses and barren sites within high-density residential areas with trees proves effective in reducing regional flood risk caused by climate change and mitigating greenhouse gas emissions.
This study is significant because it simulated and quantitatively analyzed the effects of greening vacant houses in terms of climate change response, a subject area with limited prior research. The findings of this study are expected to change the perceptions of residents and local governments about the greening of vacant houses. However, this study focused only on a few benefits of green spaces, such as flood risk mitigation and carbon fixation, and was confined to an area-specific analysis, limiting the generalizability of its results. Future research should explore a broader range of greening effects, including its impact on the thermal environment and application across various regions. Furthermore, for the runoff analysis, it is imperative to conduct analyses that reflect the latest rainfall patterns along with updates to precipitation data.

Author Contributions

Conceptualization, Y.K.; methodology, Y.K.; software, Y.K.; formal analysis, Y.K.; investigation, Y.K. and T.L.; resources, Y.K.; data curation, Y.K. and T.L.; writing—original draft preparation, Y.K.; writing—review and editing, Y.K.; visualization, Y.K.; supervision, S.Y. and J.E.K.; project administration, S.Y. and J.E.K.; funding acquisition, S.Y. and J.E.K. All authors have read and agreed to the published version of the manuscript.

Funding

This research was funded by the Korea Environmental Industry & Technology Institute (KEITI) through the Digital Infrastructure Building Project for Monitoring, Surveying, and Evaluating the Environmental Health, funded by the Korea Ministry of Environment (MOE), grant number 2021003330002; the National Research Foundation (NRF), Korea, under project BK21 FOUR; Korea Ministry of Environment (MOE) as Graduate School Specialized in Climate Change; and National Research Foundation of Korea (NRF) grant funded by the Korea government (MSIT), grant number RS-2023-00218875.

Institutional Review Board Statement

Not applicable.

Informed Consent Statement

Not applicable.

Data Availability Statement

The data supporting the findings of this study are available upon request. Please contact the corresponding author for access.

Acknowledgments

We would like to thank Woo and Jung for providing the data on vacant houses. We would also like to thank Shin and Jang for providing technical advice on the K-LIDM simulation model.

Conflicts of Interest

The authors declare no conflict of interest.

References

  1. Kamata, Y.; Kang, J.E. A study on the occurrence, persistence, and reuse of vacant houses in deteriorated high-density residential areas of old downtowns of large cities: Focused on Ami-dong and chojang-dong in Busan. J. Korea Plan. Assoc. 2021, 56, 73–86. [Google Scholar] [CrossRef]
  2. Lee, D.G.; Kim, J.H.; Lee, J.W.; Ha, J.M. A study on a physical factor for empty of house in multi-family housing. Proc. Annu. Conf. Archit. Inst. Korea 2005, 25, 453–456. [Google Scholar]
  3. Noh, M.J.; Yoo, S.J. A study on the cause of abandoned vacant houses. Korea Real Estate Rev. 2016, 26, 7–21. [Google Scholar]
  4. Han, H.S. The impact of abandoned properties on nearby property values. Hous. Policy Debate 2014, 24, 311–334. [Google Scholar] [CrossRef]
  5. Han, S.K. A study on spatial cluster and fixation process of the vacant houses in Iksan. Korea Spat. Plan. Rev. 2018, 97, 17–39. [Google Scholar]
  6. Shai, D. Income, housing, and fire injuries: A census tract analysis. Public Health Rep. 2006, 121, 149–154. [Google Scholar] [CrossRef] [PubMed]
  7. Lee, G.W. The Impacts of Creation of Small Green Areas within Urban Regeneration Projects on the Formation of Wind Paths and the Thermal Environment: Focused on Indongchon, One of the Urban Regeneration and Revitalization Areas in Daegu. Korea Inst. Ecol. Archit. Environ. 2021, 21, 91–100. [Google Scholar]
  8. 2030 Busan City Master Plan (Revised). Available online: https://www.busan.go.kr/depart/agora0703 (accessed on 14 November 2022).
  9. Jung, I.A. Urban Tissue and Vacant Spaces’ Occurrence Pattern in Old Hillside Residential Area: Focused on Hillside Residential Area Surrounding Old Downtown in Busan. Ph.D. Thesis, Pusan National University, Busan, Republic of Korea, 2019. [Google Scholar]
  10. Jung, I.A.; Woo, S.K. Analysis of the vacant spaces occurrence and areal characteristics in old hillside residential area: Focused on hillside residential areas surrounding old downtown in Busan. J. Archit. Inst. Korea 2019, 35, 115–125. [Google Scholar]
  11. Heckert, M.; Mennis, J. The economic impact of greening urban vacant land: A spatial difference-in-differences analysis. Environ. Plan. A 2012, 44, 3010–3027. [Google Scholar] [CrossRef]
  12. Branas, C.C.; Cheney, R.A.; MacDonald, J.M.; Tam, V.W.; Jackson, T.D.; Ten Have, T.R. A difference-in-differences analysis of health, safety, and greening vacant urban space. Am. J. Epidemiol. 2011, 174, 1296–1306. [Google Scholar] [CrossRef]
  13. Garvin, E.C.; Cannuscio, C.C.; Branas, C.C. Greening vacant lots to reduce violent crime: A randomised controlled trial. Inj. Prev. 2013, 19, 198–203. [Google Scholar] [CrossRef] [PubMed]
  14. Kondo, M.; Hohl, B.; Han, S.; Branas, C. Effects of greening and community reuse of vacant lots on crime. Urban Stud. 2016, 53, 3279–3295. [Google Scholar] [CrossRef] [PubMed]
  15. South, E.C.; Kondo, M.C.; Cheney, R.A.; Branas, C.C. Neighborhood blight, stress, and health: A walking trial of urban greening and ambulatory heart rate. Am. J. Public Health 2015, 105, 909–913. [Google Scholar] [CrossRef] [PubMed]
  16. Heckert, M. Access and equity in greenspace provision: A comparison of methods to assess the impacts of greening vacant land: Access and equity in greenspace provision. Trans. GIS 2013, 17, 808–827. [Google Scholar] [CrossRef]
  17. Krusky, A.M.; Heinze, J.E.; Reischl, T.M.; Aiyer, S.M.; Franzen, S.P.; Zimmerman, M.A. The effects of produce gardens on neighborhoods: A test of the greening hypothesis in a post-industrial city. Landsc. Urban Plan. 2015, 136, 68–75. [Google Scholar] [CrossRef]
  18. Frazier, A.E.; Bagchi-Sen, S. Developing open space networks in shrinking cities. Appl. Geogr. 2015, 59, 1–9. [Google Scholar] [CrossRef]
  19. Futagami, T.; Nishi, Y.; Ohnishi, J. Research on the promotion of greenery as a measure of urban incombustibility. J. Jpn. Soc. Civ. Eng. Ser. F6 (Saf. Probl.) 2020, 76, I_89–I_96. [Google Scholar] [CrossRef] [PubMed]
  20. Chae, I.B.; Seo, S.Y.; Lee, K.H. Effects of the Safe Village Pilot Project on crime prevention of neighborhood: Focused on the Wonseong-1dong in Cheon-an. J. Urban Des. Inst. Korea 2015, 16, 5–18. [Google Scholar]
  21. IPCC Sixth Assessment Report. Working Group III: Mitigation of Climate Change. Available online: https://www.ipcc.ch/report/ar6/wg3/ (accessed on 14 November 2022).
  22. Nagano, R.; Nanko, K.; Sogo, K.; Sugimoto, H. Evaluation of canopy rainfall interception by three broad-leaved spices in urban area. Evaluation of canopy rainfall interception by three broad-leaved spices in urban area. J. Jpn. Soc. Reveg. Technol. 2018, 44, 81–86. [Google Scholar] [CrossRef]
  23. Choi, H.S.; Kim, D.H.; Jo, S.Y. Application and Effects of Low Impact Development in Urban Regeneration of Waterfront Areas; Korea Environment Institute: Seoul, Republic of Korea, 2010. [Google Scholar]
  24. Yang, B.; Lee, D.K. Planning strategy for the reduction of runoff using urban green space. Sustainability 2021, 13, 2238. [Google Scholar] [CrossRef]
  25. Son, Y.; Lee, K.; Kim, R.; Pyo, J.; Park, I.; Son, Y.; Kim, C. Carbon Emission Factors by Major Tree Species for Forest Greenhouse Gas Inventory; Korea Forest Research Institute: Seoul, Republic of Korea, 2010. [Google Scholar]
  26. Jo, H.K.; Cho, D.H. Annual CO2 uptake by urban popular landscape tree species. J. Korean Inst. Landsc. Archit. 1998, 26, 38–53. [Google Scholar]
  27. Jo, H.K.; Ahn, T.W. Difference of direct and indirect CO2 uptake associated with tree cover between residential neighborhoods. Korean J. Environ. Ecol. 1999, 13, 254–260. [Google Scholar]
  28. Lee, G.G. Sustainability Indicators of Greenspace in Apartment Sites. Ph.D. Thesis, Seoul National University, Seoul, Republic of Korea, 2003. [Google Scholar]
  29. 100-Year Observatory (Busan). Available online: https://www.kma.go.kr/busan/html/info/bsob.jsp (accessed on 14 December 2023).
  30. Seo-gu Statistical Yearbook. Available online: https://www.bsseogu.go.kr (accessed on 14 December 2023).
  31. Korea GI LID Center. Available online: http://www.pnugilid.or.kr/ (accessed on 26 April 2022).
  32. Urban Water Cycle Infrastructure-Low Impact Development Research Team. K-LIDM User’s Manual; Ministry of Land, Infrastructure, and Transport: Sejong, Republic of Korea, 2017. [Google Scholar]
  33. Storm Water Management Model (SWMM). Available online: https://www.epa.gov/water-research/storm-water-management-model-swmm (accessed on 17 December 2023).
  34. Hydrological Simulation Program—FORTRAN (HSPF). Available online: https://www.epa.gov/ceam/hydrological-simulation-program-fortran-hspf (accessed on 17 December 2023).
  35. 2006 IPCC Guidelines for National Greenhouse Gas Inventories Volume 4 Agriculture, Forestry and Other Land Use. Available online: https://www.ipcc-nggip.iges.or.jp/public/2006gl/vol4.html (accessed on 17 December 2023).
  36. Akbari, H.; Kurn, D.M.; Bretz, S.E.; Hanford, J.W. Peak power and cooling energy savings of shade trees. Energy Build. 1997, 25, 139–148. [Google Scholar] [CrossRef]
  37. Lee, H.W.; Lee, K.G. Sustainability Assessment on Land Development Projects? Developing and Pilot Testing an Assessment System in the View of Greenspace Volume; Korea Environment Institute: Seoul, Republic of Korea, 2007. [Google Scholar]
  38. Lee, B.H. A Study on the Standardized Form and Its Quality Assessment of Some Landscape Plants in Korea. Master’s Thesis, Kyungwon University, Gyeonggi, Republic of Korea, 2006. [Google Scholar]
  39. Urban Flood Disaster Information Map of Busan. Available online: https://www.busan.go.kr/depart/disastermap (accessed on 14 November 2022).
  40. National Greenhouse Gas Statistics. Available online: https://kosis.kr/ (accessed on 26 April 2022).
  41. Fukuoka, T. Strategic Implementation of Vacant Lot Greening for Shrinking City; In case of Vacant Lot Greening in City of Philadelphia. In Annual Report of the Sustainable Humanosphere Course; Kobe University: Kobe, Japan, 2015. [Google Scholar]
Figure 1. Map of Busan Metropolitan City, Ami-dong, and Chojang-dong. The map background is based on Esri, NASA, NGA, USGS.
Sustainability 16 00114 g001
Figure 2. Photographs of vacant houses, barren sites, and maintenance sites: (a) Vacant house; (b) Barren site; (c) Maintenance site.
Sustainability 16 00114 g002
Figure 3. Flowchart of flood risk mitigation effects analysis.
Sustainability 16 00114 g003
Figure 4. The distribution of vacant houses, barren sites, and maintenance sites in study area. The map background is based on Esri, NASA, NGA, USGS.
Sustainability 16 00114 g004
Figure 5. Land cover for each scenario.
Sustainability 16 00114 g005
Figure 6. Flow rate comparison for short-term runoff: (a) Short-term runoff (2-year); (b) Short-term runoff (30-year).
Sustainability 16 00114 g006
Table 1. Greening scenarios.
ScenarioPersistently Vacant HousesSurface of Barren Site
S1: CurrentCurrent stateCurrent state
S2: ConcreteConcrete pavement after demolitionConcrete pavement
S3: Ground cover plantsPavement with ground cover plants after demolitionGround cover plants and pavement
S4: TreePlanting ground cover plants + trees after demolitionPlanting ground cover plants and trees
Table 2. K-LIDM input conditions.
ItemsDescription/Input ValuesData
SurfaceImpermeableBuilding roof areaEach surface area by slope is calculated and inputLand cover map of the Ministry of Environment (2021); road name address electronic map of the Ministry of Public Administration and Security (2020.9); full-scale local survey data (2020)
Parking area
Road area
Sidewalk area
PermeableTree area
Grassland area
SoilGood infiltrating soils/moderate infiltrating soilsK-LIDM default
Slope-Continuous digital topographic map v2 (1:5000)
Weather conditionsShort-term runoff2-year 180 min, 30-year 180 minBusan weather station data provided by K-LIDM
Long-term runoff2005–2014
Table 3. Surface states of demolished sites in 2020 (number of sites).
Type of SitePerviousnessVegetationTotal Number of Sites
AbsentPresent
BarrenImpermeable177-213
Permeable729
MaintenanceImpermeable63-100
Permeable433
Table 4. Area and percentage of land cover according to scenarios.
ItemS1S2S3S4
Area *RateAreaRateAreaRateAreaRate
Impermeable surfaceBuilding27.3024.4226.0723.3226.0723.3226.0723.32
Concrete19.5317.4720.8818.6818.9116.9118.9116.91
Asphalt13.3211.9213.3211.9213.3211.9213.3211.92
Sum.60.1553.8060.2853.9258.3052.1558.3052.15
Permeable surfaceTrees37.4533.5037.4433.4937.4433.4939.4235.26
Ground cover plants13.0211.6712.9111.5514.8913.3212.9111.55
Barren1.191.041.161.041.161.041.161.04
Sum.51.6546.2051.5246.0853.4947.8553.4947.85
Total area111.79
* 10,000 m2.
Table 5. Flow rate comparison of long-term runoff analysis by scenario.
ItemS1S2S3S4
Average flow rate (CMS *)12.6812.7012.5712.47
Change rate (%)Based on S1-+0.16−0.91−1.71
Based on S2--−1.07−1.86
* m3/s.
Table 6. Short-term runoff peak flow rate by scenario.
ItemS1S2S3S4
Flow rate of 2-year rainfall (CMS *)8.418.438.158.15
Change rate (%)Based on S1-+0.26−3.06−3.06
Based on S2--−3.31−3.31
Flow rate of 30-year rainfall (CMS)20.2420.2520.0419.76
Change rate (%)Based on S1-+0.05−0.99−2.38
Based on S2--−1.04−2.43
* m3/s.
Disclaimer/Publisher’s Note: The statements, opinions and data contained in all publications are solely those of the individual author(s) and contributor(s) and not of MDPI and/or the editor(s). MDPI and/or the editor(s) disclaim responsibility for any injury to people or property resulting from any ideas, methods, instructions or products referred to in the content.

