Article

Evaluation of Fiscal and Non-Fiscal Policies for Electric Vehicles—A Multi-Criterion Sorting Approach

by
Isabel Clímaco
1 and
Carlos Henggeler Antunes
2,*
1
ISCAC, Coimbra Polytechnic Institute, IPC, Quinta Agrícola, Bencanta, 3040-316 Coimbra, Portugal
2
Department of Electrical and Computer Engineering, INESC Coimbra—Institute for Systems Engineering and Computers at Coimbra, University of Coimbra, Pólo II, 3030-290 Coimbra, Portugal
*
Author to whom correspondence should be addressed.
Sustainability 2023, 15(7), 6213; https://doi.org/10.3390/su15076213
Submission received: 12 January 2023 / Revised: 28 March 2023 / Accepted: 30 March 2023 / Published: 4 April 2023
(This article belongs to the Section Economic and Business Aspects of Sustainability)

Abstract

:
This work presents a multi-criterion approach to evaluate the performance of countries regarding fiscal and non-fiscal policies for promoting electric vehicles. The ELECTRE TRI method is used to classify the performance of countries into categories according to the degree of fulfilment of those policies. This multi-criterion decision analysis method assigns the entities under evaluation to predefined ordered categories of merit (sorting problem). This is accomplished by comparing the entities under evaluation with reference profiles that establish the frontiers between the categories. The model considers fiscal (vehicle registration tax benefits, taxation of internal combustion engine company cars, consumer purchase incentives, tax shares in consumer prices of gasoline vs. electricity) and non-fiscal (traffic regulation incentives, charging infrastructure) potential policies to define a comprehensive set of evaluation criteria. The ELECTRE TRI method allows for robust conclusions by enabling the comparison of results obtained with different preference expression parameters, according to the distinct aims and scope of the decision problem. Illustrative results are presented allowing for the assessment of each country’s performance in this setting.

1. Introduction

Air pollution is one of the most relevant public concerns regarding environmental issues associated with energy use. The transport sector is one of the main contributors to climate change due to greenhouse gases (GHG) emissions mostly in urban areas [1]. Road transportation was the largest source of carbon dioxide (CO2) emissions in the European Union (EU) in 2020, accounting for 26 percent of total CO2 emissions [2], above the electricity and heat generation sectors. Passenger cars were the major source of road transportation-related CO2 emissions (CO2) in the EU, with 60 per cent of the total [3]. A fall equivalent to more than 200 million tons of CO2 from the transport sector was registered during the COVID-19 pandemic lockdowns, but a rebound has been witnessed since then [4].
The EU has ensued a steady path for the decarbonization of the transport sector. A 90% reduction in transportation emissions by 2050 was advocated in [5]. Hence, electrification of road transportation has become a major trend for sustainable mobility and a strategy for reducing air pollutant emissions, improving air quality and enhancing energy efficiency [6]. The EU addressed this challenge by introducing the EU Directive (2009/33/EC) to achieve the clean and energy-efficient road transport vehicles target. The European Parliament and Council adopted Regulation 2019/631, which announced CO2 emission standards for new passenger cars and light commercial vehicles (vans) in the EU, considering a set of reduction targets of 15% and 37.5% for the tailpipe CO2 emissions of newly registered cars for the years 2025 and 2030, respectively [7]. More recently, in October 2022, the European Parliament and Council reached a more ambitious agreement to ensure that all new cars and vans registered in Europe will be zero-emission by 2035, and legislative proposals of the “fit for 55” package are underway that relate to the transport sector [8]. The European Commission has announced a ban on sales of all internal combustion engine vehicles (ICEV) by 2035 to materialize the path towards the objective of being climate neutral by 2050.
In the last few years, the share of electric vehicle (EV), encompassing battery EV (BEV) and plug-in hybrid EV has been growing, rising strongly in the last couple of years. According to the IEA global EV outlook [9], in 2021, nearly 10% of global car sales were EV, 4 times more than the market share in 2019. The total number of EV on the world’s roads is now about 16.5 million, 3 times more than the ones in 2018. In 2022, the global sales of EV reached 2 million units in the first quarter, up 75% from the same period in 2021.
In the EU, EV registrations jumped from 1.06 million in 2020 to 1.73 in 2021, which represents an increase from 10.7% to 17.8% in the share of total new car registrations with comparable values for BEV and PHEV [10]. In 2021, the highest shares of EV in national new car registrations were in Norway (86%), Iceland (64%), Sweden (46%), Denmark (35%) and Finland (31%) [10]. Around 560 thousand EV were sold throughout Europe in the second quarter of 2022 [11].
It is well known that the higher initial cost gap between EV and conventional ICEV is one of the most important market barriers. Despite other factors that can dissuade potential buyers, as the density of charging points, and the differences of the policy measures promoting EV among European countries, public incentives are still imperative to overcome the acquisition cost gap. In general, countries with no or weak policy interventions have low EV adoption rates, and countries with stronger instrument policies have higher adoption rates [12,13,14].
Various policies have been implemented in several countries to promote EV, contributing to a long-term shift of economies that is consistent with climate stabilization concerns. These policies include the support for research and development of more advanced EV technologies and demand side incentives. These incentives at the consumer side may comprise the substantial taxation of fossil fuels (gasoline and diesel), low electricity taxes for EV charging, tax exemptions or subsidies for EV, higher vehicle registration taxes or annual circulation taxes for ICEV and CO2 based vehicle taxes. Complementary policies include the development of the charging infrastructure, access to bus lanes, free parking spots and free access to low emission zones.
In order to promote EV adoption on a large scale, several European governments have begun to offer packages of monetary incentives for new EV purchases and non-monetary incentives such as free parking or other traffic regulations favoring EV, along with financial support for the development of extensive charging infrastructures [15]. Although there is a fragmentation of European policies, some EU countries are in the top of battery EV new registrations worldwide [16]. Germany is an interesting case since it has some of the largest ICEV manufactures worldwide, and nevertheless it recently registered an expressive growth in EV penetration. Germany also has a national ambitious climate target of becoming GHG neutral by 2050, which will contribute to the promotion of EV. In contrast, the Netherlands does not have a major car manufacturer but has long been the country with the second highest EV market worldwide, even though it has recently experienced a significant decrease in EV sales [17]. The Netherlands and Germany signed a national agreement aiming to reduce CO2 emissions in the mobility sector by 17% and 60% by 2030 and 2050, respectively [18]. Outside the EU, Norway is currently the European leader in EV market share; since it is not an ICEV producer, its government does not face severe industrial resistance to the growing penetration of EV [19]. Furthermore, Norway follows a strong national climate policy, which aims to achieve carbon-neutrality by 2050 and have all new cars emission-free by 2025 [20,21].
More recently, the study in [22] examined the influence of fiscal policy instruments on the rapid market uptake of battery and hybrid vehicles in Norway. The author points out the particular role of taxing internal combustion engine vehicles rather than subsidizing electric vehicles, considering all of them CO2-differentiated. Outside Europe, the work in [23] analyzed the differences in New Zealand private drivers concerning car buying motivations, perceptions and attitudes towards EV. The authors segmented drivers into four attitudinal groups according to their characteristics potentially affecting EV readiness to provide evidence for targeting and improving policy instruments and social marketing. The results show that the group of so-called “EV positives”—the mainstream consumers who seem more concerned about some EV characteristics (EV range, EV expense, charging-related inconvenience, etc.)—might be the prime target for public policies that potentially increase EV adoption rates. The influence of various incentive policies and socio-economic factors on the EV market share is analyzed in [24], using a quantitative model for panel data of 20 countries from 2015 to 2019. The main factors considered in the study included purchase subsidies, registration tax benefits, ownership tax benefits, valued added tax benefits, charging density, as well as the household disposable income. This study pointed out, as main policy suggestions, that financial incentives should not be eliminated in the short-term, that the importance of deployment of charging infrastructure as a prerequisite for mass market adoption and that government policies should be based on income levels to adapt to different economic backgrounds. The authors concluded that a combination of policy instruments should be adopted if accelerating the electrification of transport is the main goal. The study in [25] addressed the consumer behavior toward EV purchases by examining the antecedents of EV purchase intention, which are classified into three main categories: consumer characteristics, EV characteristics, and EV-related policies. The work in [26] presented the results of EV sales up to 2021 and proposed volatility assessment and short-term forecasting using normalized monthly sales analysis, concluding that, in cases where authorities and regulators are the main driving forces of change, the EV market requires proper goal setting and open access market data. However, it should be noticed that some studies question the EV dissemination optimism (e.g., in [27]), namely concerning the corresponding impacts on the generation and transmission/distribution grids segments, concluding that if all private transport become electric, energy consumption will increase to such a level that it would be impossible to be satisfied by the actual energy producing companies.
The controversy regarding BEV subsidization or taxation has been addressed in [28], which assessed whether BEV subsidies are justified (and by what amount) with reference to the carbon component by developing a simulation model to estimate and monetize the Well-to-Wheel CO2 emissions of some car segments in European countries. The fuel consumption and emission estimates can be derived using the micro-level modelling approaches reviewed in [29], including traffic network-, behavioral- and agent-based models. The economic evaluation of the CO2 emissions offers a basis for taxation and subsidizing policies. The willingness to pay for electric vehicles should consider a set of recognizable attributes, such as driving range, charging time, fuel cost saving, pollution reduction and performance, which has been studied in [30].
In this setting, the current perception is that the growing share of EV will play a decisive role in the decarbonization of the economy due to the importance of road transportation in economic, environmental and energy dimensions. Therefore, the assessment of the impact of existing and prospective policies on the promotion of electric mobility is of utmost importance. This evaluation involves the need to consider multiple, conflicting and incommensurate axes of the evaluation defined according to the aims and scope of the decision support context.
Multi-criterion decision analysis (MCDA) methods are adequate for this purpose because of their capability to encompass multiple evaluation criteria in a consistent framework, including preference information parameters, which can be exploited in the choice, ranking or sorting perspectives. In this study, we adopted a sorting model to evaluate the policies of countries to promote electric mobility, which leads to the assignment of policies to predefined ordered categories of merit, which are defined by reference profiles, according to multiple criteria. The MCDA model is then tackled by the ELECTRE TRI method, which is based on the construction and exploitation of an outranking relation under the sorting perspective. This method allows for the incorporation of preferences by means of criterion weights as well as indifference, preference and veto thresholds. Different (quantitative or qualitative) scales can be used for each criterion. The weights are scale-independent, expressing the criterion importance coefficients, i.e., their “voting power” for the assessment of the outranking relation. The veto threshold allows for a non-compensatory effect by imposing a penalty on a very weak performance on some criterion even if the performances in the other criteria are very good. In comparison with (additive) multi-attribute value theory (MAVT) approaches, the ELECTRE TRI method does not require the verification of strong axioms and conditions. However, it may need a large number of parameters to be elicited, which in turn make the outcomes of the decision process more robust.
The main contribution of this paper is the development of a comprehensive MCDA evaluation framework devoted to the sorting problem using the ELECTRI TRI method to derive meaningful insights regarding the assessment of countries according to fiscal and non-fiscal policies for promoting electric vehicles. This method is supplied with preference information parameters to be elicited from decision makers, thus enabling us to accommodate different perspectives of this study, namely to shape policy recommendations. This decision support framework is flexible to be adapted to other settings and purposes by adding/removing criteria or changing the preference expression parameter values required.
This introduction section presented the context and aims of the study. In Section 2, an overview of the ELECTRE TRI method is made. The multi-criterion evaluation model is presented in Section 3. Illustrative results are discussed in Section 4. The main conclusions are drawn and hints for future development of this type of studies are presented in Section 5.

2. The ELECTRE TRI Method

The ELECTRE (Elimination and Choice Translating Reality) methods aim to provide decision support in problems in which a set of alternatives (entities, courses of action, etc.) should be evaluated according to multiple, conflicting, and incommensurate evaluation criteria [31,32]. These methods are based on the construction and exploitation of an outranking relation devoted to the choice, ranking or sorting problems.
The ELECTRE-TRI method [33] aims to assign each of the m alternatives ai (i = 1, …, m) under evaluation to predefined ordered categories of merit considering a set of n evaluation criteria gj (j = 1, …, n)—sorting problem. Each category is delimited by two reference profiles: bjh−1/bjh are the lower/upper limit of category Ch (h = 1, …, k) for criterion gj (Figure 1).
Indifference (qj), preference (pj) and veto (vj) thresholds may be considered when comparing the alternatives with the reference profiles for each criterion gj. The indifference threshold allows for some imprecision in the comparison: the difference between the scores of the alternative under evaluation and the reference profile being considered is not relevant for criterion gj if it is not higher than qj. The preference threshold allows for some gradation in the comparison when the difference of the scores is between qj and pj, one score being unquestionably better if the difference is higher than pj. The veto threshold (vj) enables us to introduce a non-compensatory component in the evaluation, i.e., vetoing the conclusion that an alternative is at least as good as the reference profile if the former is much worse than the latter by a difference greater than vj in criterion gj, although it may be better in all other criteria.
The assignment of an alternative to a category results from comparing its performance with the reference profiles in each criterion to assess whether or not the outranking relation between them can be established. An alternative ai outranks the reference profile bh (denoted ai S bh) if ai is at least as good as bh considering their performances in each criterion. If ai is not worse than bh in every criterion, then ai S bh. Even if there are some criteria for which ai is worse than bh, then ai may still outrank bh, depending on the relative importance of those criteria and the differences in the evaluations in face of the threshold values (small differences may be ignored, whereas vary large differences may oppose a veto to the outranking). Weights (kj, j = 1, …, n) are not used to construct some type of aggregate score (e.g., by means of weighted sums) as in MAVT approaches but are understood as the “voting power” of each criterion to determine the outranking relation.
A credibility index of the outranking relation, σ(ai,bh), is calculated considering the performance differences, the criterion weights and the indifference, preference and veto thresholds. The outranking relation is validated by comparing the credibility index with a cutting level λ (λ∈[0.5,1]). If σ(ai,bh) ≥ λ and σ(bh,ai) ≥ λ, then ai is indifferent to bh; if σ(ai,bh) ≥ λ and σ(bh,ai) < λ, then ai is preferred to bh (ai S bh and not bh S ai); if σ(ai,bh) < λ and σ(bh,ai) ≥ λ, then bh is preferred to ai (bh S ai and not ai S bh); if σ(ai,bh) < λ and σ(bh,ai) < λ, then ai and bh are incomparable (not ai S bh and not bh S ai). The pessimistic (conjunctive) variant of ELECTRE TRI is used in this work, in which each action ai is assigned to the highest category Ch+1 such that ai outranks bh [34].

3. The MCDA Model

3.1. Context for the MCDA Model

The higher price of EV compared with ICEV is one of the main reasons for the low market share of EV in many countries. Then, the success of EV uptake is significantly determined by various factors influencing buying behavior. The governments of European countries have adopted different fiscal and other types of incentives to attract more consumers to a raise the EV fleet. Depending on the existing tax structure in a country, there are differences on how incentives for BEV are deployed. Countries such as Germany, France, Italy and UK support their policy mostly on subsidies, while others such as Norway, Netherlands and Portugal focus on taxation benefits to incentivize BEV. However, these two different approaches have a quite different impact on car segments. If purchase subsidies seem to have a relatively high effect on smaller BEV and a lower effect on larger BEVs, on the other hand, taxes benefits based on emission, such as in Norway, increase the benefit for BEV over ICE in higher segments [35]. Nevertheless, in general, countries aim to reduce or even remove the incentives for BEVs over ICE when the market will reach zero-emission mobility or when ICEV are banned. It is expected that, on average, BEV will reach the same price (before incentives) as equivalent ICEV models between 2025 and 2027 [36]. This trend will help the EU achieve the 100% electric light-duty sales by 2035, according to the target established in the European Green Deal [37]. Although an accelerated adoption rate is being witnessed in several countries (particularly in Germany), it is not predictable that all Member States follow the same trajectory. In the Green Deal compliant scenario, the Nordic Group (which includes Netherlands and Norway, who is outside of the EU) would reach the 100% BEV as early as 2030. The Western group (including Germany, France and the UK, who is now outside the EU) will achieve 100% BEV in 2034 or even sooner in the case of Germany as the market leader of this group [36]. The Southern group (including Italy, Spain, and Portugal) is expected to follow a similar trajectory as the Western group with a small time-lag. Governments are hastening the transition by support fiscal and non-fiscal incentives for companies and private drivers. Since large public subsidies may not be feasible in the long term, public authorities are expected to engage in more revenue neutral instruments such as bonus-malus (or feebate) taxation, already adopted in France and Italy, which reveals to be a much more financially sustainable policy option [36]. Until BEV reach price parity with ICEV counterparts, the existing financial incentives are not expected to be eliminated in the short term. Given the difference in GDP and purchasing power between countries (specially between the Southern group and the other ones), targeted public support might be needed to extend in time, even after EV models reach price parity. In addition, governments should expand the scale of charging points increasing their density as a prerequisite for EV mass market adoption. According to the IEA Announced Pledges Scenario [9], the number of public chargers needs to expand ninefold and reach over 15 million units in 2030 to provide consumers with adequate and convenient coverage.

3.2. Definition of the Criteria and Input Data

In this context, the criteria to be considered in the evaluation model as well as the scores of the entities under evaluation resulted from an extensive literature review and interviews with voluntary participants (economists, managers, engineers, graduate students) with some degree of expertise on fiscal and non-fiscal policies as well as in the transport sector.
The entities under evaluation are the following countries: France, Germany, Italy, Netherlands, Norway, Portugal and the UK, for which complete and reliable data could be found [2,3,9,10,11].
The selected criteria and respective measurement units are the following:
  • Traffic regulation incentives (g1) [–]—Relates to the free use of bus/fast/high occupancy vehicle lanes, parking spots, toll bridges, ferries; higher score for countries with more permissions in a scale of 4 levels [0, 1, 2, 3].
  • Benefits in the taxation of ICEV company cars (g2) [EUR]—lower benefits stimulate the adoption of EV.
  • Consumer purchase incentives and uptake of EV (g3) [EUR]—Electric vehicle purchase incentives
  • Tax benefits (g4) [–]—Register tax and VAT benefits given to BEVs; higher score for countries with more tax benefits in a scale of 4 levels [0, 1, 2, 3].
  • Public fast charging points per 100 km of highway (g5) [#]—A proxy for how pervasive the charging networks is in each country.
  • Ratio of tax shares in consumer prices of gasoline vs. electricity (g6) [EUR]—A proxy for capturing if higher ratios are likely to influence more the consumers’ option for buying an EV.
The performance data of each country in each criterion are displayed in Table 1.
The ELECTRE TRI method requires the definition of the categories that the entities under evaluation will be assigned to by specifying the reference profiles as well as the indifference (qj), preference (pj) and (optional) veto (vj) threshold values for each criterion and reference profile (Table 2). The categories to classify the countries are defined as C1–Low, C2–Average and C3–Good, referring to the merit of fiscal and non-fiscal policies in promoting EV. Further categories could be considered, depending on the purposes of the study. In this illustrative study, no veto thresholds were considered, which means that an alternative with a bad score in a given criterion may be classified in the best category.
The cutting level (λ) was defined as λ∈[0.50,1], i.e., a “simple majority” meaning that an alternative is at least as good as a category reference profile only if at least 50% of the criterion weights “vote” for the concordance. The higher the value of λ is, the more “qualified” is the majority required.
The imprecision of the decision maker’s preferences associated with the criterion weights may be captured by linear constraints on the weights. The weights for all criteria were defined satisfying 0.10 ≤ kj ≤ 0.50 for j = 3, 4, 5, 0.05 ≤ kj ≤ 0.20 for j = 2, 6 and 0.05 ≤ kj ≤ 0.50 for j = 1.

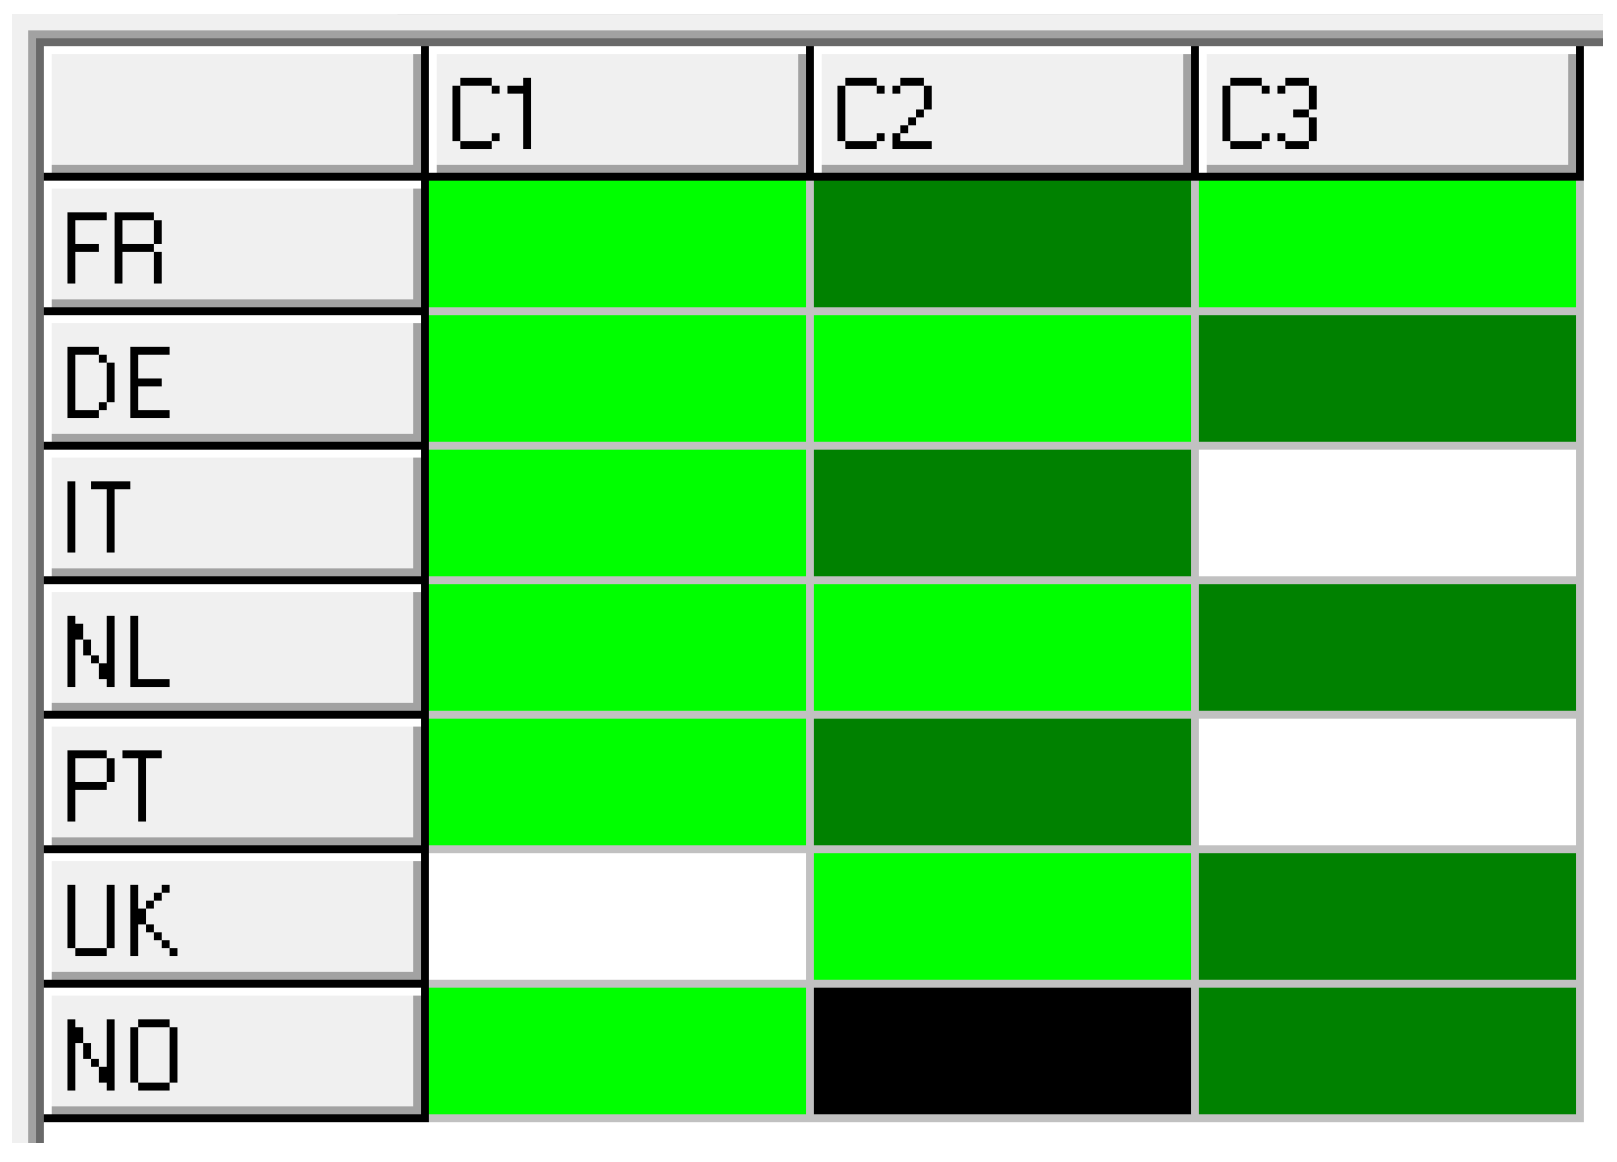
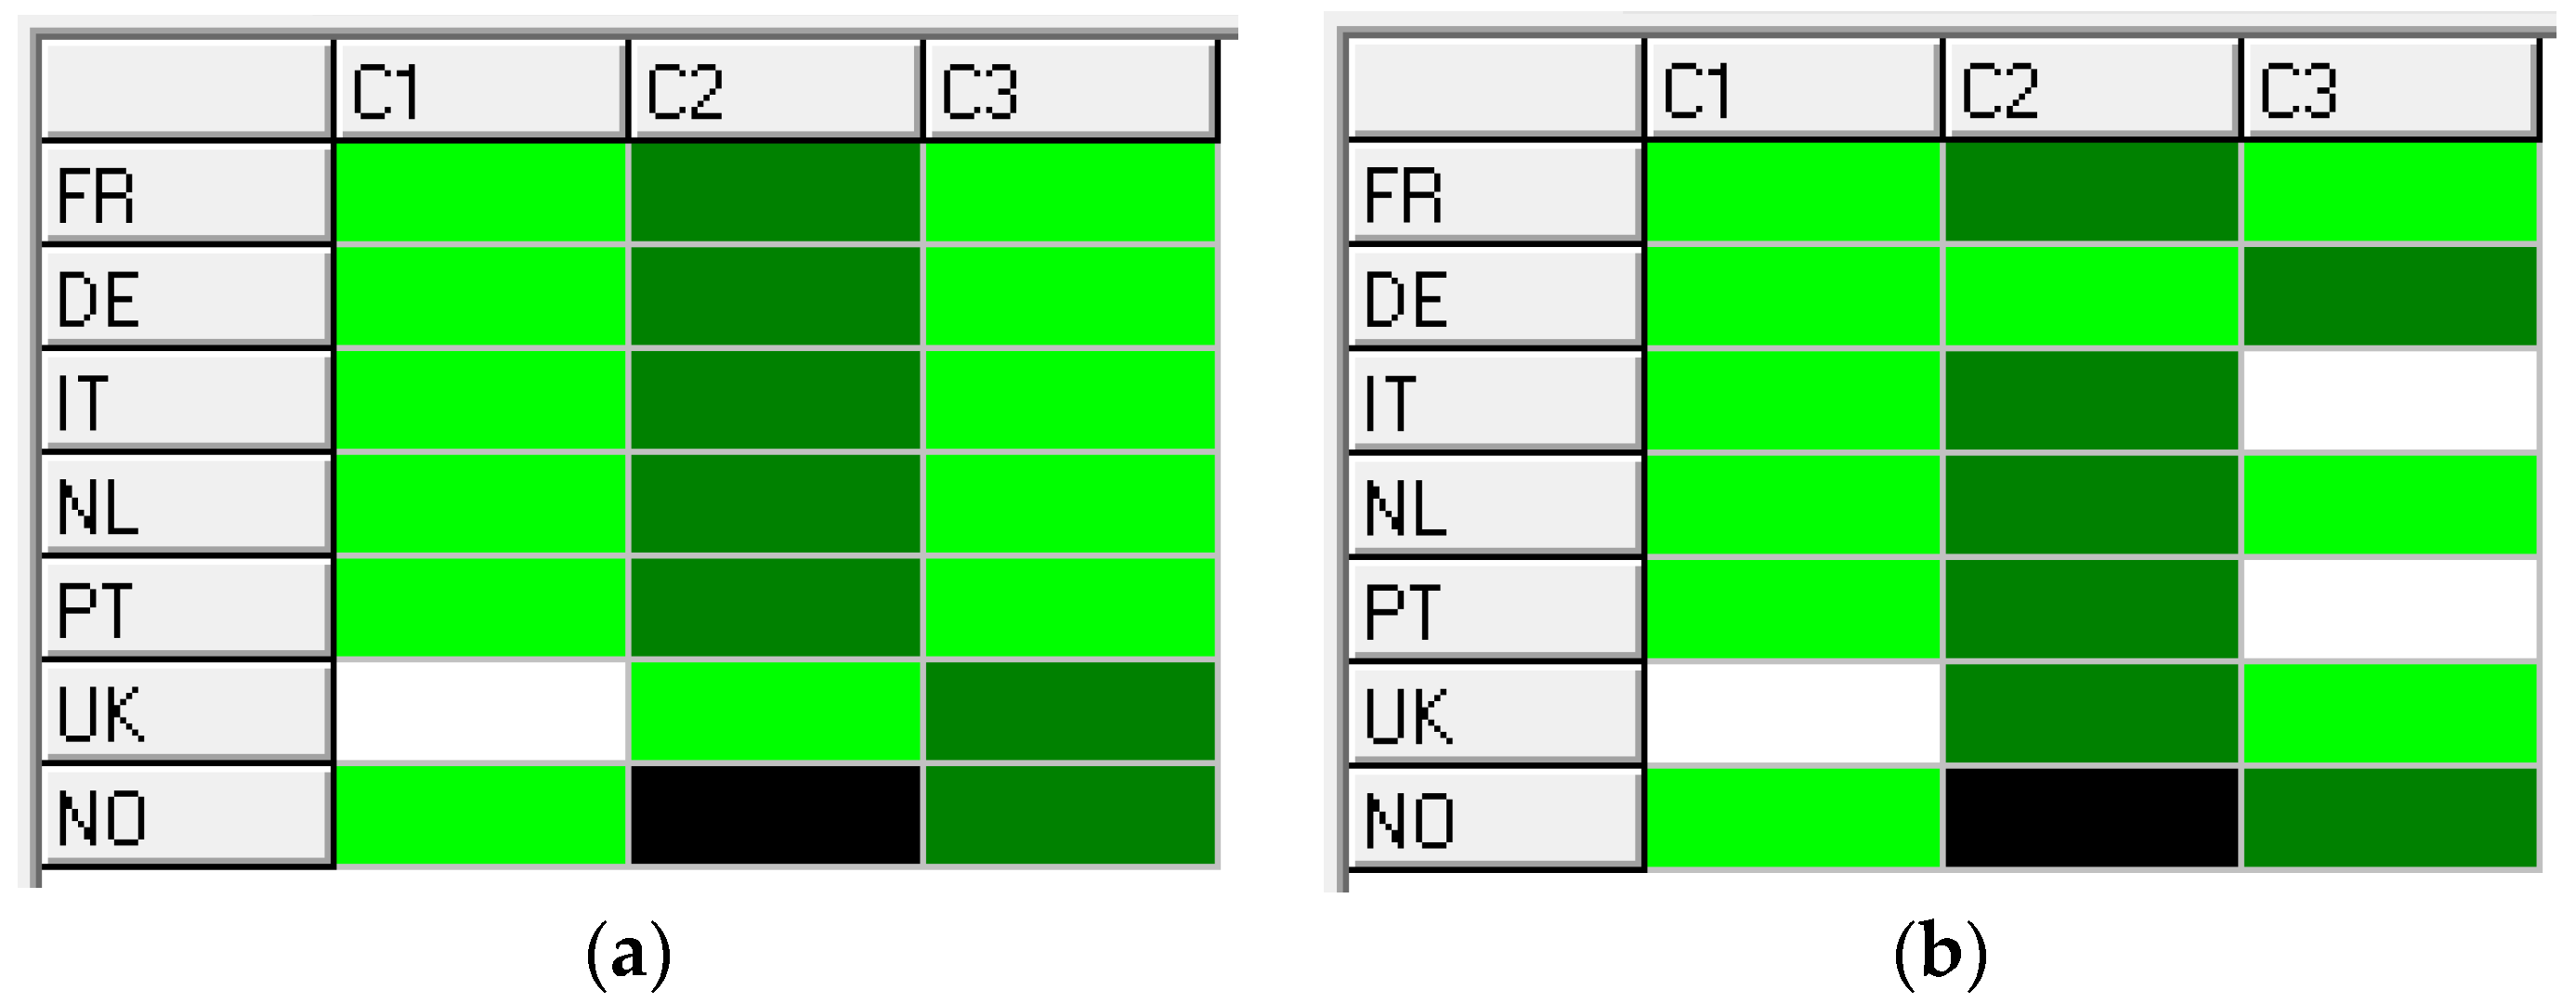
4. Results and Discussion

In the following displays of illustrative results obtained with the IRIS package, the green cells indicate the categories that each alternative can be assigned to without violating any bounds or constraints, e.g., on the weights. The dark green cells denote the category assignments corresponding to the inferred combination of parameter values, i.e., the central combination of parameters respecting all those constraints. The black cells indicate categories to which an alternative cannot be assigned to, i.e., when the alternative is good enough to be better than the previous category, then it is able to reach the next category, with respect to the category denoted by the dark cell [34].
Figure 2 displays the assignment of alternatives to the categories considering the cutting level λ ≥ 0.50, without any further constraints than the weight bounds stated above. The central combination of weights respecting the lower/upper bounds leads to Germany, the UK and Norway being classified in the best category C3, France, Italy and Portugal in the middle category C2, and Netherlands in the lower category C1. However, it is possible to have a feasible combination of weights such that France, Italy, Netherlands. and Portugal are classified in the best category (possibly not simultaneously, i.e., using different sets of parameter values satisfying all the bounds). Norway cannot be classified in the middle category, i.e., as it is good enough to be better than C1; then, it reaches C3 without being assigned to C2. Figure 2, Figure 3, Figure 4, Figure 5 and Figure 6 are screen copies of the interface that the IRIS package offers to users.
The assignment results after increasing the classification exigency corresponding to imposing the cutting level λ ≥ 0.66 (i.e., a “qualified majority” of criteria is required in favor of the concordance to validate the outranking relation) are displayed in Figure 3. With the central combination of weights, no country attains the best category C3, with France, Germany and the UK assigned to the middle category C2 for the central weight combination. The United Kingdom is never classified in the lower category C1.
If the decision maker wants to assess the results giving more importance to the incentive criteria g3 and g4 (EV purchase incentives and tax benefits, respectively), then the weight constraint k3 + k4k1 + k2 + k5 + k6 is imposed. The corresponding assignment results are displayed in Figure 4, leading that all countries are classified in the lower category C1 except the UK, which is sorted into the middle category C2 for the central weight combination, with no country sorted into the best category C3, considering the central weight combination. Note that there are other specific weight sets that enable all countries to be classified in the best category.
Let us suppose that the decision maker wants to give more importance to the non-fiscal incentive criteria g1 and g5 (traffic regulation incentives and public fast charging points per 100 km of highway, respectively); then, the weight constraint k1 + k5k2 + k3 + k4 + k6 is imposed. The resulting assignment is displayed in Figure 5, leading that Germany, Netherlands, UK, and Norway are classified in the best category C1, while the other countries are sorted into the middle category C2 for the central weight combination.
Figure 6 displays the assignment results if the relative importance between the set of fiscal and non-fiscal incentive criteria is translated into the weight constraints k3 + k4k1 + k5 (a) and k1 + k5k3 + k4 (b), thus representing decision makers with different perspectives or who want to assess the change in the results resulting from distinct preference information to reach more robust conclusions.
These results are just illustrative of the information required and the outcomes offered by an MCDA model designed to evaluate fiscal and non-fiscal policies for the promotion of EV. Other sets of parameters (e.g., different indifference and preference thresholds or even imposing a veto threshold) and constraints (e.g., restrictions on weights) conveying the decision makers’ preferences could be forthrightly investigated in this framework to derive further insights to shape public policies encompassing measures of different nature to promote the adoption of EV.

5. Conclusions

The importance of road transportation in economic, environmental and energy dimensions requires the assessment of the impact of existing and prospective diversified policies on the promotion of electric mobility. This paper offers a multi-criterion evaluation model and an illustrative study using the ELECTRE TRI method considering fiscal and non-fiscal policies (i.e., involving or not monetary incentives) for promoting electric vehicles. The entities under evaluation (a selection of countries) were assigned to ordered categories of merit according to the fulfilment of those policies. The evaluation model considered fiscal (vehicle registration, annual registration, subsidies, ratio of tax shares in consumer prices of gasoline vs. electricity) and non-fiscal (traffic regulations, charging infrastructure) policies to define a comprehensive set of evaluation criteria.
The ELECTRE TRI method enables us to evaluate the alternatives according to their absolute performance with respect to predefined profiles and not in comparison with other alternatives. This method also enabled to deal effectively with criteria with performances measured in different scales, including qualitative ones. Additionally, ELECTRE TRI does not require setting a precise numerical value to express the importance of each criterion, which helps the decision maker interactively express different preference information and assess the corresponding impact on the results.
The multi-criterion evaluation framework herein developed can be easily adapted to assess other countries or other type of entities, including new criteria, categories, instantiation of parameters reflecting different decision makers’ perspectives and preferences, etc., with the aim to reach robust conclusions and design appropriate policies since the success of EV uptake is significantly determined by multiple factors influencing buying behavior. Therefore, further research should be conducted refining this multi-criterion evaluation framework for different perspectives of analysis including the interplay between increased energy consumption due to the penetration of EV and the heterogenous effects associated with the promotion of renewable energy generation, environmental legislation, support to R&D programs and energy efficiency initiatives (using schemes as the one developed in [38]).

Author Contributions

Conceptualization, I.C. and C.H.A.; methodology, C.H.A.; validation, I.C.; formal analysis, I.C. and C.H.A.; investigation, I.C.; data curation, I.C.; writing—original draft preparation, I.C. and C.H.A.; writing—review and editing, I.C. and C.H.A.; visualization, C.H.A.; funding acquisition, I.C. All authors have read and agreed to the published version of the manuscript.

Funding

This work has been supported by FCT under project grant UIDB/00308/2020.

Data Availability Statement

Not applicable.

Conflicts of Interest

The authors declare no conflict of interest.

References

  1. IEA. World Energy Outlook. 2022. Available online: https://www.iea.org/reports/world-energy-outlook-2022 (accessed on 10 January 2023).
  2. Distribution of Carbon Dioxide Emissions in the European Union in 2020. Available online: https://www.statista.com/statistics/999398/carbon-dioxide-emissions-sources-european-union-eu/ (accessed on 1 March 2023).
  3. Carbon Dioxide Emissions from Road Transportation in the European Union (EU-27) from 1990 to 2020. Available online: https://www.statista.com/statistics/1236763/road-transportation-greenhouse-gas-emissions-eu-by-mode/ (accessed on 1 March 2023).
  4. Davis, S.J.; Liu, Z.; Deng, Z.; Zhu, B.; Ke, P.; Sun, T.; Guo, R.; Hong, C.; Zheng, B.; Wang, Y.; et al. Emissions rebound from the COVID-19 pandemic. Nat. Clim. Chang. 2022, 12, 412–414. [Google Scholar] [CrossRef]
  5. European Environmental Agency. CO2 Performance of New Passenger Cars in Europe. Available online: https://www.eea.europa.eu/ims/co2-performance-of-new-passenger (accessed on 10 January 2023).
  6. Ayodele, B.V.; Mustapa, S.I. Life Cycle Cost Assessment of Electric Vehicles: A Review and Bibliometric Analysis. Sustainability 2020, 12, 2387. [Google Scholar] [CrossRef] [Green Version]
  7. Available online: http://eur-lex.europa.eu/legal-content/EN/TXT/?uri=CELEX%3A32019R0631 (accessed on 10 January 2023).
  8. Available online: https://www.consilium.europa.eu/en/press/press-releases/2022/06/02/fit-for-55-package-council-adopts-its-position-on-three-texts-relating-to-the-transport-sector/ (accessed on 10 January 2023).
  9. IEA. Global EV Outlook 2022. Available online: https://www.iea.org/reports/global-ev-outlook-2022 (accessed on 10 January 2023).
  10. Available online: https://www.eea.europa.eu/ims/new-registrations-of-electric-vehicles (accessed on 10 January 2023).
  11. Available online: https://www.statista.com/statistics/642799/eu-total-sales-electric-vehicles/ (accessed on 10 January 2023).
  12. Sierzchula, W.; Bakker, S.; Maat, K.; van Wee, B. The influence of financial incentives and other socio-economic factors on electric vehicle adoption. Energy Policy 2014, 68, 183–194. [Google Scholar] [CrossRef]
  13. Hardman, S.; Chandan, A.; Tal, G.; Turrentine, T. The effectiveness of financial purchase incentives for battery electric vehicles—A review of the evidence. Renew. Sustain. Energy Rev. 2017, 80, 1100–1111. [Google Scholar] [CrossRef]
  14. Rietmann, N.; Lieven, T. How policy measures succeeded to promote electric mobility—Worldwide review and outlook. J. Clean. Prod. 2019, 206, 66–75. [Google Scholar] [CrossRef]
  15. Lutsey, N. Transition to a Global Zero-emission Vehicle Fleet: A Collaborative Agenda for Governments. The International Council on Clean Transportation (ICCT). 2015. Available online: https://theicct.org/publications/transition-global-zero-emission-vehicle-fleet-collaborative-agenda-governments (accessed on 10 January 2023).
  16. European Alternative Fuels Observatory. On the Electrification Path: Europe’s Progress towards Clean Transportation. Available online: https://www.eafo.eu/sites/default/files/2021-03/EAFO%20Europe%20on%20the%20electrification%20path%20March%202021.pdf (accessed on 10 January 2023).
  17. International Energy Agency. International Energy Agency. Hybrid and Electric Vehicles—The Electric Drive Delivers. April 2015. Available online: https://ieahev.org/wp-content/themes/newTheme/assets/pdfs/2015_annual_report.pdf (accessed on 10 January 2023).
  18. Witkamp, B.; van Gijlswijk, R.; Bolech, M.; Coosemans, T.; Hooftman, N.S. The Transition to a Zero Emission Vehicles Fleet for Cars in the EU by 2050: Pathways and Impacts: An Evaluation of Forecasts and Backcasting the COP21 Commitments. European Alternative Fuels Observatory. 2017. Available online: https://cris.vub.be/ws/portalfiles/portal/35220288/The_Transition_to_a_ZEV_car_fleet_EU_2050_an_EAFO_study.pdf (accessed on 10 January 2023).
  19. Bakker, S.; Maat, K.; van Wee, B. Stakeholders interests, expectations, and strategies regarding the development and implementation of electric vehicles: The case of the Netherlands. Transp. Res. Part A Policy Pract. 2014, 66, 52–64. [Google Scholar] [CrossRef]
  20. Figenbaum, E. Perspectives on Norway’s supercharged electric vehicle policy. Environ. Innov. Soc. Transit. 2017, 25, 14–34. [Google Scholar] [CrossRef] [Green Version]
  21. Milne, R. Reality of Subsidies Drives Norway’s Electric Car Dream. Financial Times. 2017. Available online: https://www.ft.com/content/84e54440-3bc4-11e7-821a-6027b8a20f23 (accessed on 10 January 2023).
  22. Fridstrøm, L. The Norwegian Vehicle Electrification Policy and Its Implicit Price of Carbon. Sustainability 2021, 13, 1346. [Google Scholar] [CrossRef]
  23. Broadbent, G.; Metternicht, G.; Wiedmann, T. Increasing Electric Vehicle Uptake by Updating Public Policies to Shift Attitudes and Perceptions: Case Study of New Zealand. Energies 2021, 14, 2920. [Google Scholar] [CrossRef]
  24. Xue, C.; Zhou, H.; Wu, Q.; Wu, X.; Xu, X. Impact of Incentive Policies and Other Socio-Economic Factors on Electric Vehicle Market Share: A Panel Data Analysis from the 20 Countries. Sustainability 2021, 13, 2928. [Google Scholar] [CrossRef]
  25. Ivanova, G.; Moreira, A.C. Antecedents of Electric Vehicle Purchase Intention from the Consumer’s Perspective: A Systematic Literature Review. Sustainability 2023, 15, 2878. [Google Scholar] [CrossRef]
  26. Pelegov, D.V.; Chanaron, J.-J. Electric Car Market Analysis Using Open Data: Sales, Volatility Assessment, and Forecasting. Sustainability 2023, 15, 399. [Google Scholar] [CrossRef]
  27. Vrabie, C. Electric Vehicles Optimism versus the Energy Market Reality. Sustainability 2022, 14, 5388. [Google Scholar] [CrossRef]
  28. Cavallaro, F.; Danielis, R.; Nocera, S.; Rotaris, L. Should BEVs be subsidized or taxed? A European perspective based on the economic value of CO2 emissions. Transp. Res. Part D Transp. Environ. 2018, 64, 70–89. [Google Scholar] [CrossRef]
  29. Nocera, S.; Basso, M.; Cavallaro, F. Micro and Macro modelling approaches for the evaluation of the carbon impacts of transportation. Transp. Res. Procedia 2017, 24, 146–154. [Google Scholar] [CrossRef]
  30. Hidrue, M.K.; Parsons, G.R.; Kempton, W.; Gardner, M.P. Willingness to pay for electric vehicles and their attributes. Resour. Energy Econ. 2011, 33, 686–705. [Google Scholar] [CrossRef] [Green Version]
  31. Roy, B.; Bouyssou, D. Aide Multicritère à la Décision: Méthodes et Cas; Economica: Paris, France, 1993; Available online: https://basepub.dauphine.fr/handle/123456789/4522 (accessed on 10 January 2023).
  32. Roy, B. The outranking approach and the foundations of electre methods. Theory Decis. 1991, 31, 49–73. [Google Scholar] [CrossRef]
  33. Mousseau, V.; Slowinski, R.; Zielniewicz, P. A user-oriented implementation of the ELECTRE-TRI method integrating preference elicitation support. Comput. Oper. Res. 2000, 27, 757–777. [Google Scholar] [CrossRef]
  34. Dias, L.C.; Mousseau, V. IRIS: A DSS for multiple criteria sorting problems. J. Multi-Criteria Decis. Anal. 2003, 12, 285–298. [Google Scholar] [CrossRef] [Green Version]
  35. FIER Automotive & Mobility; Weken, H.; Bestebreurtje, E.; van der Wilt, S.; Kroon, R. Dutch BEV Policy In an International Perspective. June 2021. Available online: https://www.rvo.nl/sites/default/files/2021/07/Dutch%20BEV%20policy%20in%20an%20international%20perspective%20-%20June%202021.pdf (accessed on 10 January 2023).
  36. Transport & Environment. Break-up with Combustion Engines—How Going 100% Electric for New Cars & Vans by 2035 is Feasible in all EU Countries. May 2021. Available online: https://ecodes.org/images/que-hacemos/01.Cambio_Climatico/Incidencia_politicas/Movilidad/20210510_Break-up_with_combustion_engines_BriefingBloomergNEF_Study.pdf (accessed on 10 January 2023).
  37. European Green Deal. Available online: https://ec.europa.eu/info/strategy/priorities-2019-2024/european-green-deal_en (accessed on 10 November 2021).
  38. Wang, Q.; Li, S.; Pisarenko, Z. Heterogeneous effects of energy efficiency, oil price, environmental pressure, R&D investment, and policy on renewable energy—Evidence from the G20 countries. Energy 2020, 209, 118322. [Google Scholar] [CrossRef]
Figure 1. Categories in ELECTRE TRI.
Sustainability 15 06213 g001
Figure 2. Assignment of alternatives to categories for the cutting level λ ≥ 0.50 (no additional constraint on the weights in addition to the pre-established bounds).
Sustainability 15 06213 g002
Figure 3. Assignment of alternatives to categories for the cutting level λ ≥ 0.66 (no additional constraint on the weights in addition to the pre-established bounds).
Sustainability 15 06213 g003
Figure 4. Assignment of alternatives to categories for the cutting level λ ≥ 0.50 with the weight constraint k3 + k4k1 + k2 + k5 + k6, in addition to weight bounds.
Sustainability 15 06213 g004
Figure 5. Assignment of alternatives to categories for the cutting level λ ≥ 0.50 with the weight constraint k1 + k5k2 + k3 + k4 + k6, in addition to weight bounds.
Sustainability 15 06213 g005
Figure 6. Assignment of alternatives to categories for the cutting level λ ≥ 0.50 with the weight constraints (a) k3 + k4k1 + k5 and (b) k1 + k5k3 + k4, in addition to weight bounds.
Sustainability 15 06213 g006
Table 1. Inputs for the evaluation model.
Criteria Countryg1 (max)g2 (min)g3 (max)g4 (max)g5 (max)g6 (max)
France012%6.000 €1181.43
Germany212%4.000 €0471.09
Italy130%6.000 €0132.86
Netherlands122%02351.07
Portugal09%02121.16
UK113%5.220 €21301.61
Norway320%036552.03
Table 2. Reference profiles and thresholds.
Criteriag1g2g3g4g5g6
ParameterTraffic regulation incentives [-]Benefits in the taxation of company cars [%]Consumer purchase incentives [EUR]Tax benefits [-]Public fast charging points per 100 km of highway (#)Ratio tax shares in consumer prices of gasoline vs. electricity [-]
g(b1)1121500181.2
q101200010.1
p112400120.2
g(b2)2840002202.0
q201400010.2
p212600130.3
Disclaimer/Publisher’s Note: The statements, opinions and data contained in all publications are solely those of the individual author(s) and contributor(s) and not of MDPI and/or the editor(s). MDPI and/or the editor(s) disclaim responsibility for any injury to people or property resulting from any ideas, methods, instructions or products referred to in the content.

