
Analysis of Dynamic Connectedness Relationships among Clean Energy, Carbon Emission Allowance, and BIST Indexes


Abstract
1. Introduction
2. Review of the Literature
3. Methodology
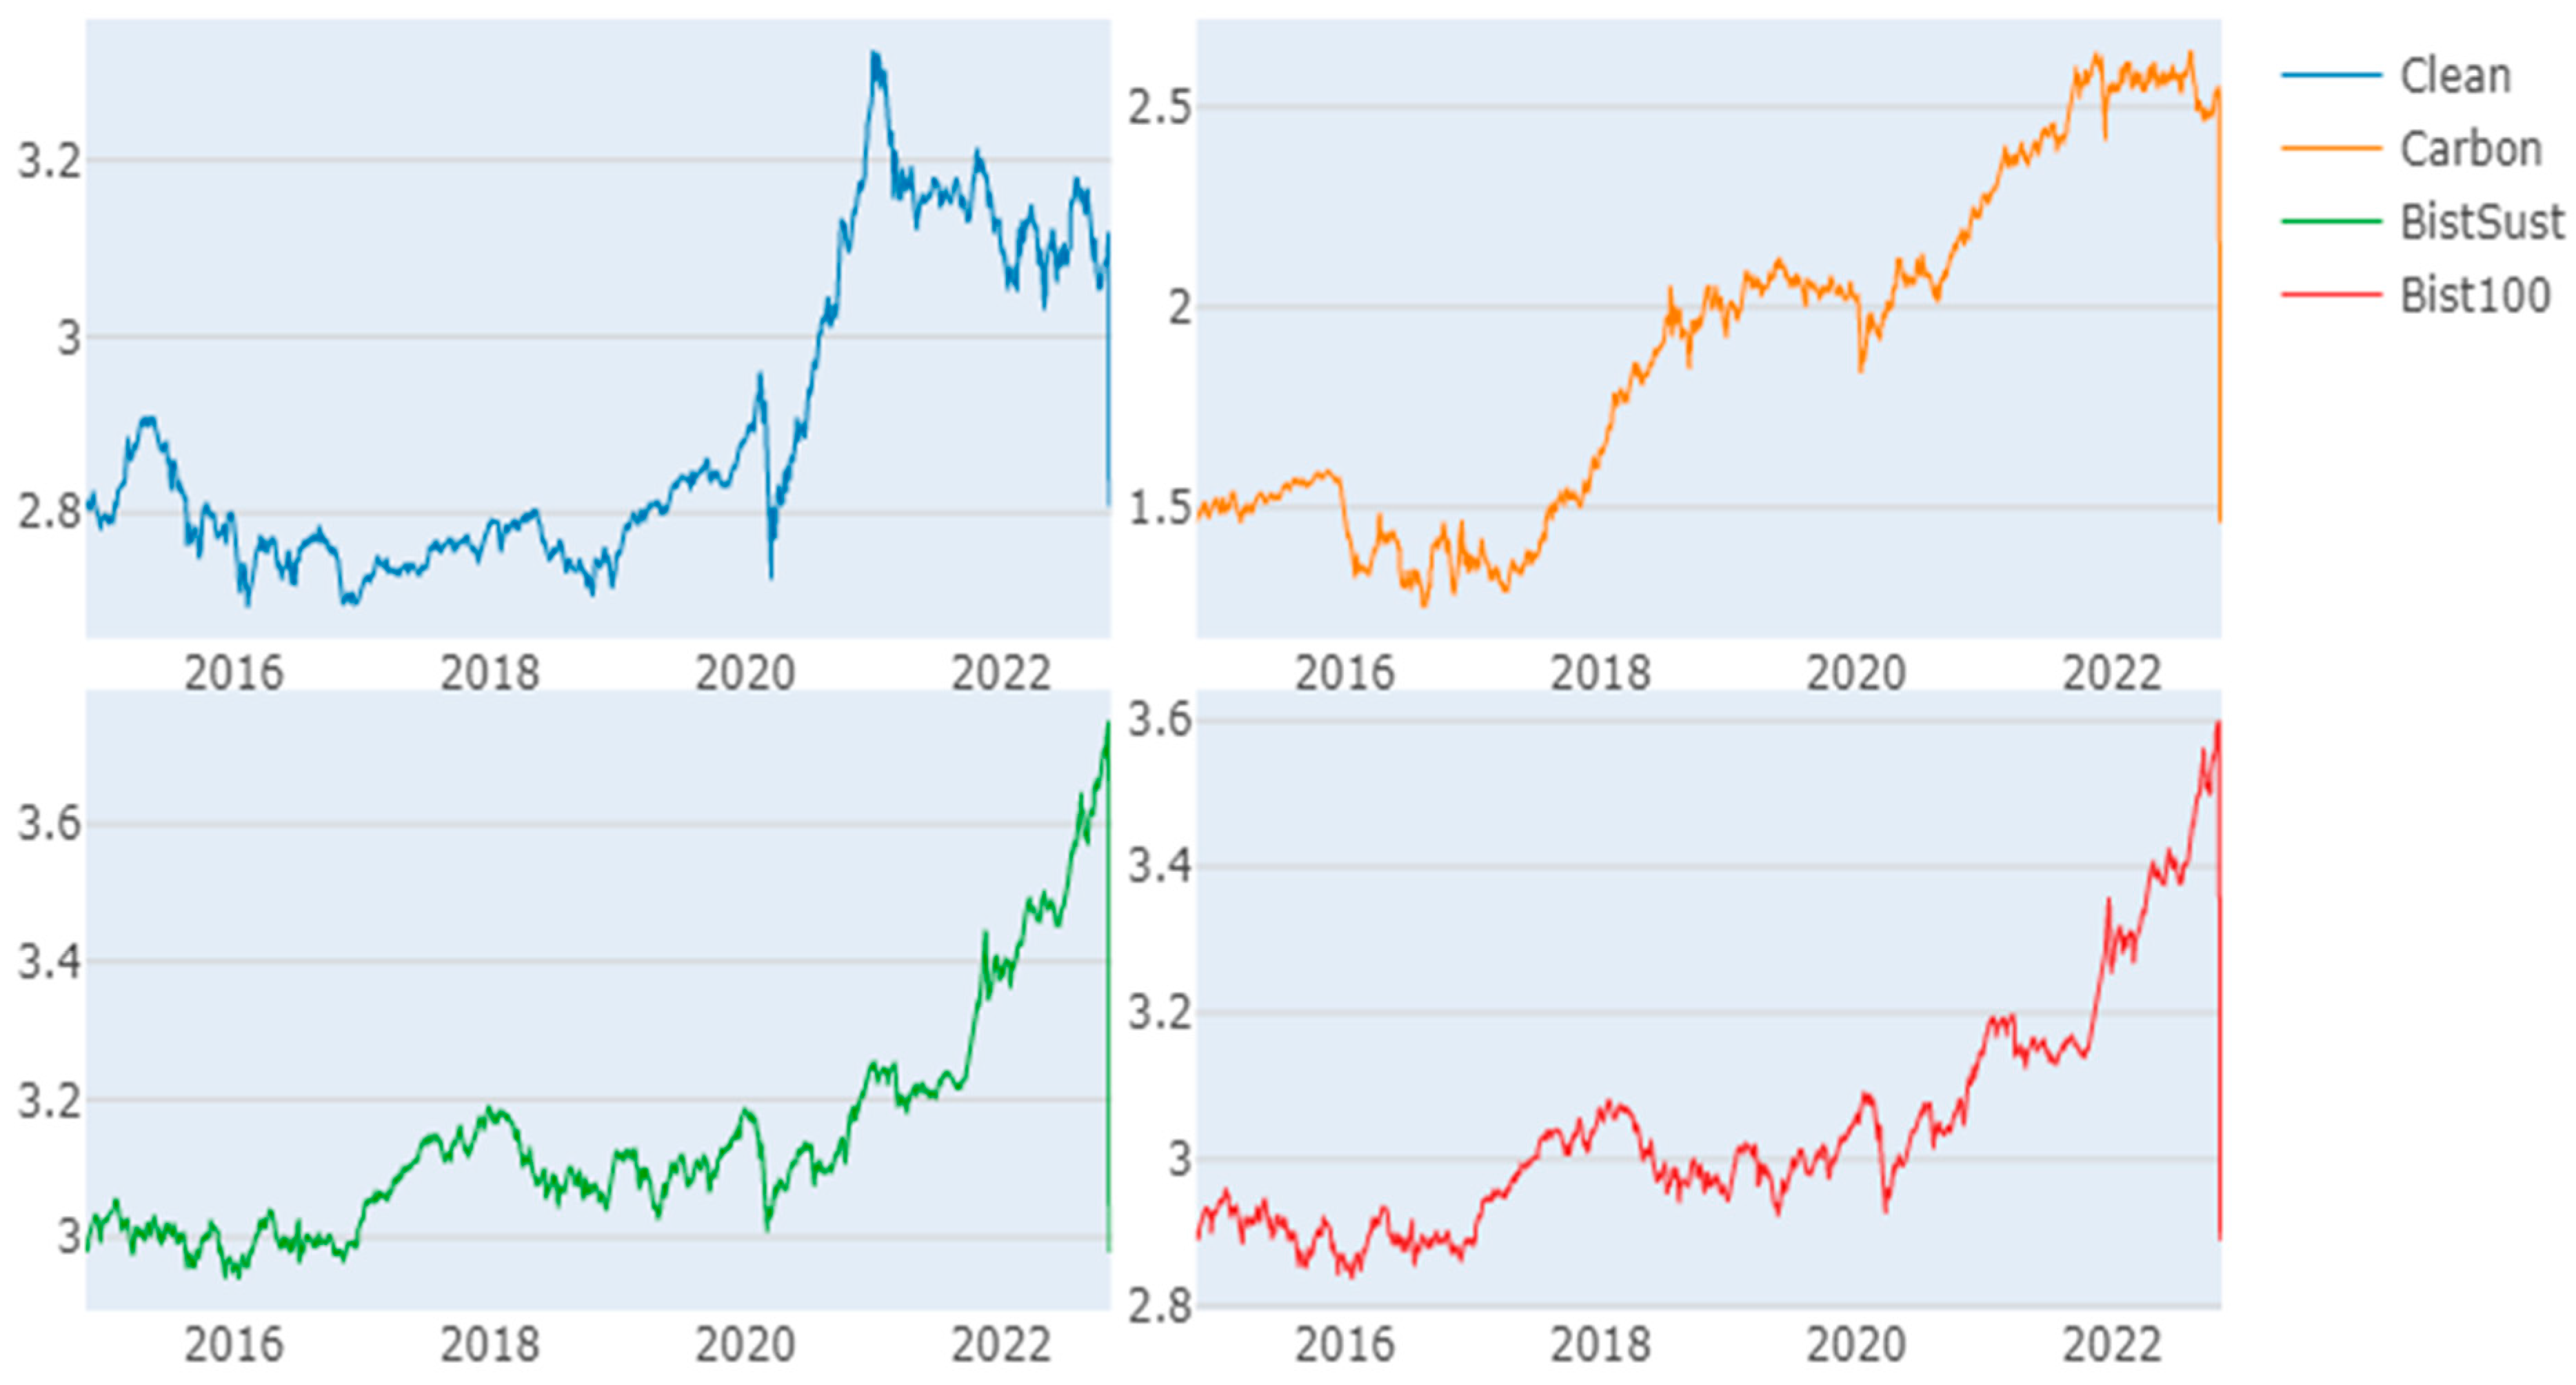
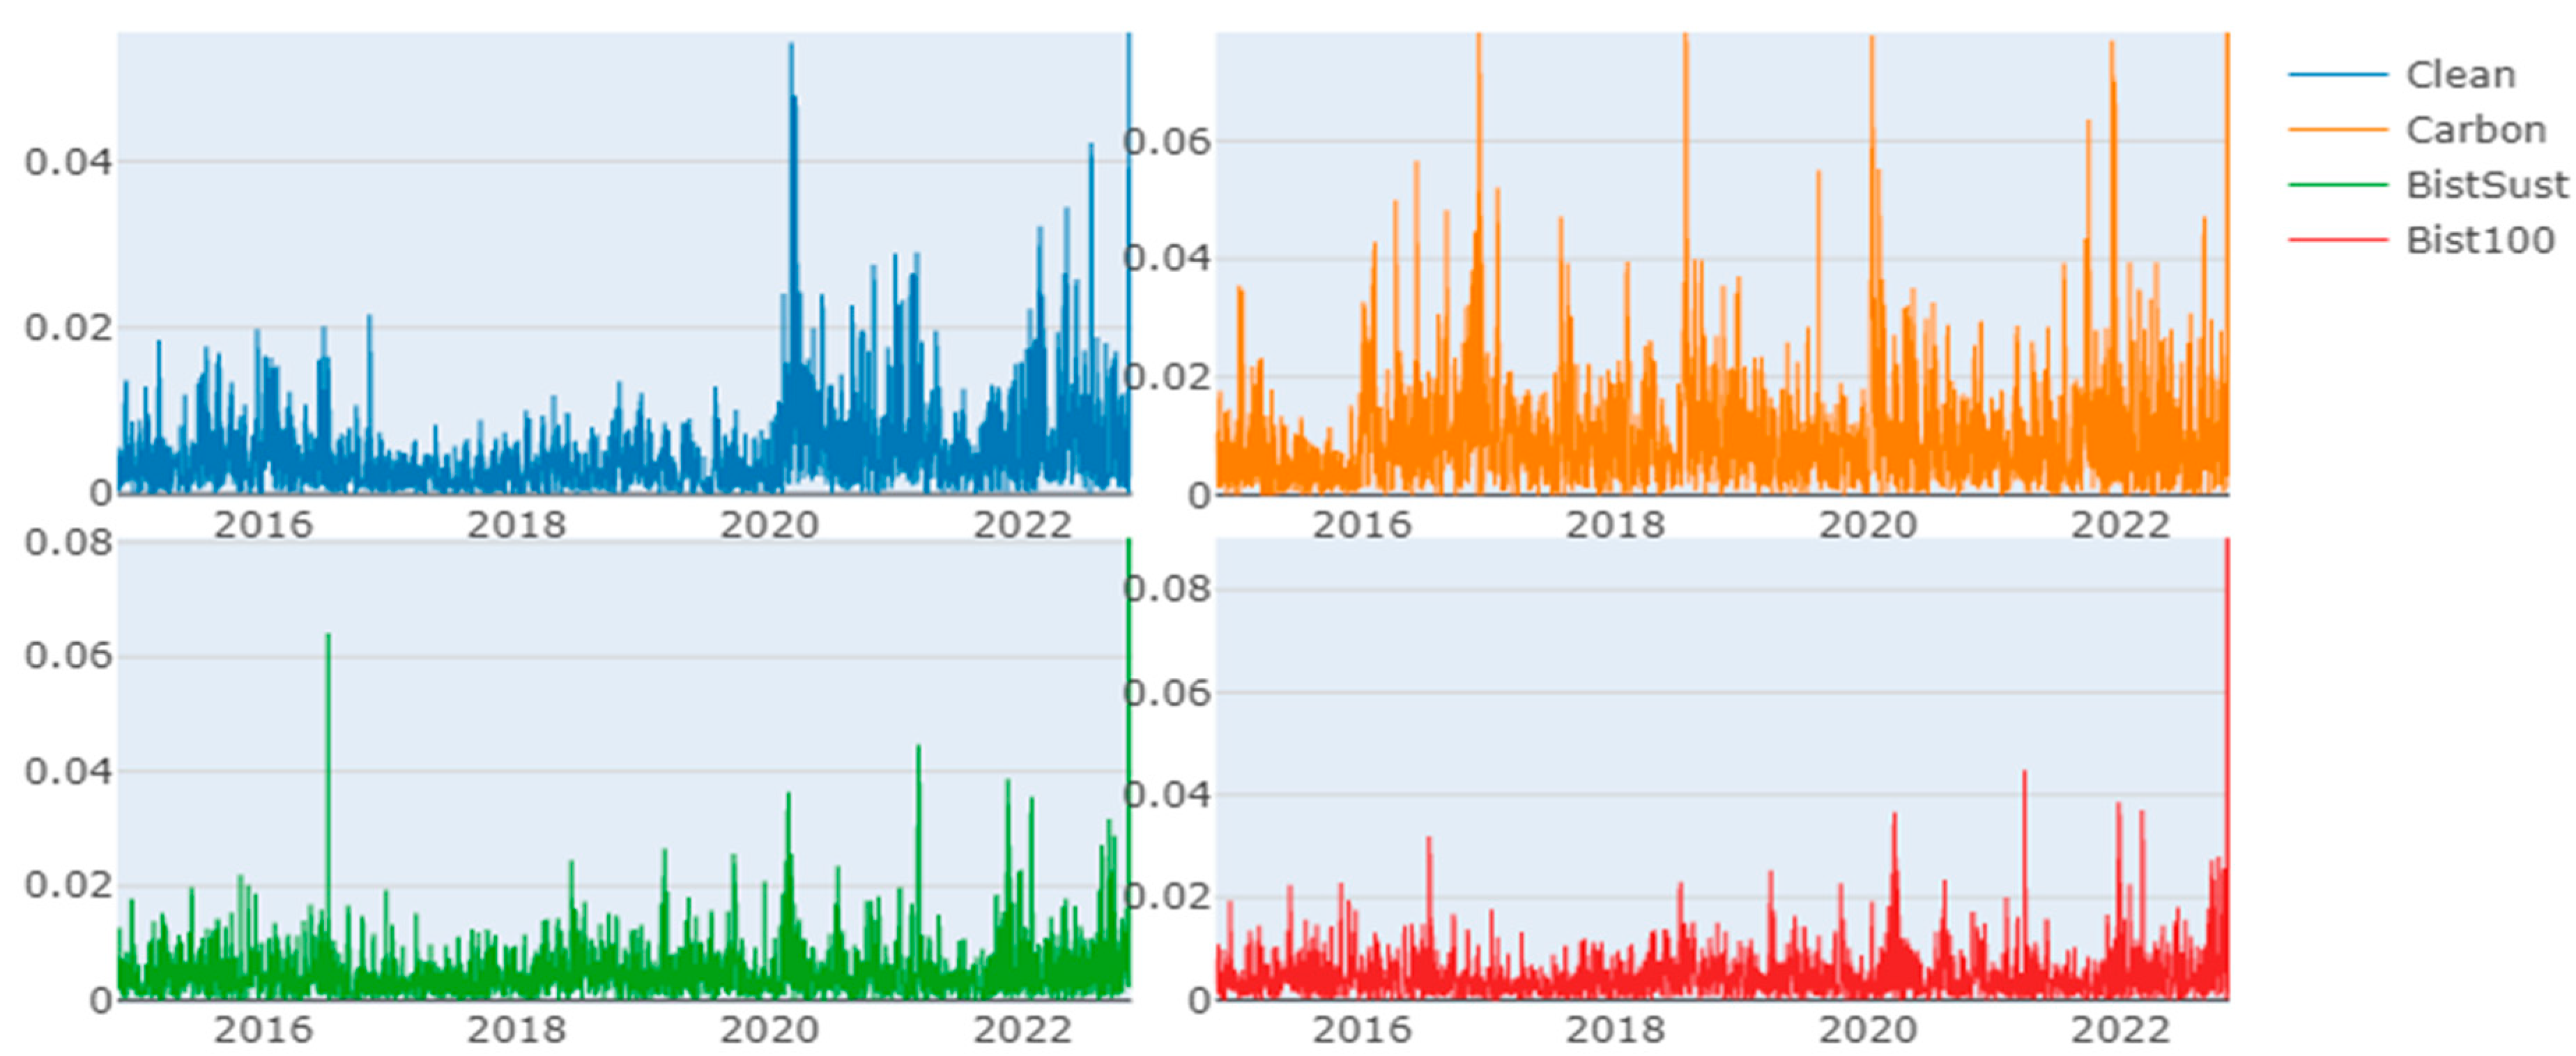
3.1. Dataset
3.2. Method
4. Findings
5. Discussion and Conclusions
5.1. Limitation and Future Research
5.2. Implications of the Study
Author Contributions
Funding
Institutional Review Board Statement
Informed Consent Statement
Data Availability Statement
Conflicts of Interest
References
- Wen, F.; Zhao, L.; He, S.; Yang, G. Asymmetric relationship between carbon emission trading market and stock market: Evidences from China. Energy Econ. 2020, 91, 104850. [Google Scholar] [CrossRef]
- Kocaarslan, B.; Soytas, U. Reserve currency and the volatility of clean energy stocks: The role of uncertainty. Energy Econ. 2021, 104, 105645. [Google Scholar] [CrossRef]
- Monasterolo, I.; Raberto, M. The EIRIN flow-of-funds behavioural model of green fiscal policies and green sovereign bonds. Ecol. Econ. 2018, 144, 228–243. [Google Scholar] [CrossRef]
- Wang, X.; Li, J.; Ren, X. Asymmetric causality of economic policy uncertainty and oil volatility index on time-varying nexus of the clean energy, carbon and green bond. Int. Rev. Financ. Anal. 2022, 83, 102306. [Google Scholar] [CrossRef]
- Naeem, M.A.; Peng, Z.; Suleman, M.T.; Nepal, R.; Shahzad, S.J.H. Time and frequency connectedness among oil shocks, electricity and clean energy markets. Energy Econ. 2020, 91, 104914. [Google Scholar] [CrossRef]
- Asl, M.G.; Canarella, G.; Miller, S.M. Dynamic asymmetric optimal portfolio allocation between energy stocks and energy commodities: Evidence from clean energy and oil and gas companies. Resour. Policy 2021, 71, 101982. [Google Scholar] [CrossRef]
- Tan, X.; Geng, Y.; Vivian, A.; Wang, X. Measuring risk spillovers between oil and clean energy stocks: Evidence from a systematic framework. Resour. Policy 2021, 74, 102406. [Google Scholar] [CrossRef]
- Fahmy, H. The rise in investors’ awareness of climate risks after the Paris Agreement and the clean energy-oil-technology prices nexus. Energy Econ. 2022, 106, 105738. [Google Scholar] [CrossRef]
- Hau, L.; Zhu, H.; Sun, W.; Yu, K. Flight-to-quality or not? Evidence from China’s green bond and green equity markets during COVID-19 crisis. Appl. Econ. Lett. 2022, 1–7. [Google Scholar] [CrossRef]
- Chang, K.L.; Lee, C.; He, C.W. Four types of tail dependence structures between US dollar index and S&P 500 stock returns: 1990–2019. Appl. Econ. Lett. 2022, 1–6. [Google Scholar] [CrossRef]
- Lu, X.; Liu, K.; Liang, X.S.; Lai, K.K.; Cui, H. The dynamic causality in sporadic bursts between CO2 emission allowance prices and clean energy index. Environ. Sci. Pollut. Res. 2022, 29, 77724–77736. [Google Scholar] [CrossRef] [PubMed]
- Gomez-Gonzalez, J.E.; Hirs-Garzon, J.; Sanín-Restrepo, S. Dynamic relations between oil and stock markets: Volatility spillovers, networks and causality. Int. Econ. 2021, 165, 37–50. [Google Scholar] [CrossRef]
- Song, Y.; Ji, Q.; Du, Y.J.; Geng, J.B. The dynamic dependence of fossil energy, investor sentiment and renewable energy stock markets. Energy Econ. 2019, 84, 104564. [Google Scholar] [CrossRef]
- Jiang, Y.; Wang, J.; Lie, J.; Mo, B. Dynamic dependence nexus and causality of the renewable energy stock markets on the fossil energy markets. Energy 2021, 233, 121191. [Google Scholar] [CrossRef]
- Harrison, J.S.; Freeman, R.E.; Abreu, M.C.S.D. Stakeholder theory as an ethical approach to effective management: Applying the theory to multiple contexts. Rev. Bras. Gestão Negócios 2015, 17, 858–869. [Google Scholar] [CrossRef]
- Saleem, I.; Tahir, S.H.; Batool, Z. Beyond diversity: Why the inclusion is imperative for boards to promote sustainability among agile non-profit organisations? Int. J. Agil. Syst. Manag. 2021, 14, 254–275. [Google Scholar] [CrossRef]
- Stammer, D.; Van de Wal, R.S.W.; Nicholls, R.J.; Church, J.A.; Le Cozannet, G.; Lowe, J.A.; Behar, D.; Hinkel, J. Framework for high-end estimates of sea level rise for stakeholder applications. Earth’s Future 2019, 7, 923–938. [Google Scholar] [CrossRef]
- Attanasio, G.; Preghenella, N.; De Toni, A.F.; Battistella, C. Stakeholder engagement in business models for sustainability: The stakeholder value flow model for sustainable development. Bus. Strategy Environ. 2022, 31, 860–874. [Google Scholar] [CrossRef]
- Marcon Nora, G.A.; Alberton, A.; Ayala, D.H.F. Stakeholder theory and actor-network theory: The stakeholder engagement in energy transitions. Bus. Strategy Environ. 2023, 32, 673–685. [Google Scholar] [CrossRef]
- Febi, W.; Schäfer, D.; Stephan, A.; Sun, C. The impact of liquidity risk on the yield spread of green bonds. Financ. Res. Lett. 2018, 27, 53–59. [Google Scholar] [CrossRef]
- Glomsrød, S.; Wei, T. Business as unusual: The implications of fossil divestment and green bonds for financial flows, economic growth and energy market. Energy Sustain. Dev. 2018, 44, 1–10. [Google Scholar] [CrossRef]
- Bachelet, M.J.; Becchetti, L.; Manfredonia, S. The green bonds premium puzzle: The role of issuer characteristics and third-party verification. Sustainability 2019, 11, 1098. [Google Scholar] [CrossRef]
- Tang, D.Y.; Zhang, Y. Do shareholders benefit from green bonds? J. Corp. Financ. 2020, 61, 101427. [Google Scholar] [CrossRef]
- Lebelle, M.; Lajili Jarjir, S.; Sassi, S. Corporate green bond issuances: An international evidence. J. Risk Financ. Manag. 2020, 13, 25. [Google Scholar] [CrossRef]
- Kanamura, T. Are green bonds environmentally friendly and good performing assets? Energy Econ. 2020, 88, 104767. [Google Scholar] [CrossRef]
- Tolliver, C.; Keeley, A.R.; Managi, S. Policy targets behind green bonds for renewable energy: Do climate commitments matter? Technol. Forecast. Soc. Chang. 2020, 157, 120051. [Google Scholar] [CrossRef]
- Wang, J.; Lu, X.; He, F.; Ma, F. Which popular predictor is more useful to forecast international stock markets during the coronavirus pandemic: VIX vs. EPU? Int. Rev. Financ. Anal. 2020, 72, 101596. [Google Scholar] [CrossRef]
- Jin, Y.; Gao, X.; Wang, M. The financing efficiency of listed energy conservation and environmental protection firms: Evidence and implications for green finance in China. Energy Policy 2021, 153, 112254. [Google Scholar] [CrossRef]
- Hammoudeh, S.; Ajmi, A.N.; Mokni, K. Relationship between green bonds and financial and environmental variables: A novel time-varying causality. Energy Econ. 2020, 92, 104941. [Google Scholar] [CrossRef]
- Chang, C.L.; Ilomäki, J.; Laurila, H.; McAleer, M. Causality between CO2 emissions and stock markets. Energies 2020, 13, 2893. [Google Scholar] [CrossRef]
- Zhao, L.; Wen, F.; Wang, X. Interaction among China carbon emission trading markets: Nonlinear Granger causality and time-varying effect. Energy Econ. 2020, 91, 104901. [Google Scholar] [CrossRef]
- Ji, Q.; Zhang, D.; Geng, J.B. Information linkage, dynamic spillovers in prices and volatility between the carbon and energy markets. J. Clean. Prod. 2018, 198, 972–978. [Google Scholar] [CrossRef]
- Wang, Y.; Guo, Z. The dynamic spillover between carbon and energy markets: New evidence. Energy 2018, 149, 24–33. [Google Scholar] [CrossRef]
- Gargallo, P.; Lample, L.; Miguel, J.A.; Salvador, M. Co-movements between EU ETS and the energy markets: A VAR-DCC-GARCH approach. Mathematics 2021, 9, 1787. [Google Scholar] [CrossRef]
- Umar, M.; Farid, S.; Naeem, M.A. Time-frequency connectedness among clean-energy stocks and fossil fuel markets: Comparison between financial, oil and pandemic crisis. Energy 2022, 240, 122702. [Google Scholar] [CrossRef]
- Tiwari, A.K.; Abakah, E.J.A.; Gabauer, D.; Dwumfour, R.A. Dynamic spillover effects among green bond, renewable energy stocks and carbon markets during COVID-19 pandemic: Implications for hedging and investments strategies. Glob. Financ. J. 2022, 51, 100692. [Google Scholar] [CrossRef]
- Mensi, W.; Naeem, M.A.; Vo, X.V.; Kang, S.H. Dynamic and frequency spillovers between green bonds, oil and G7 stock markets: Implications for risk management. Econ. Anal. Policy 2022, 73, 331–344. [Google Scholar] [CrossRef]
- Kamal, J.B.; Hassan, M.K. Asymmetric connectedness between cryptocurrency environment attention index and green assets. J. Econ. Asymmetries 2022, 25, e00240. [Google Scholar] [CrossRef]
- Madaleno, M.; Dogan, E.; Taskin, D. A step forward on sustainability: The nexus of environmental responsibility, green technology, clean energy and green finance. Energy Econ. 2022, 109, 105945. [Google Scholar] [CrossRef]
- Antonakakis, N.; Gabauer, D. Refined Measures of Dynamic Connectedness Based on TVP-VAR; MPRA Paper No. 78282; University Library of Munich: Munich, Germany, 2017. [Google Scholar]
- Diebold, F.X.; Yilmaz, K. Measuring financial asset return and volatility spillovers, with application to global equity markets. Econ. J. 2009, 119, 158–171. [Google Scholar] [CrossRef]
- Diebold, F.X.; Yilmaz, K. Better to give than to receive: Predictive directional measurement of volatility spillovers. Int. J. Forecast. 2012, 28, 57–66. [Google Scholar] [CrossRef]
- Diebold, F.X.; Yilmaz, K. On the network topology of variance decompositions: Measuring the connectedness of financial firms. J. Econom. 2014, 182, 119–134. [Google Scholar] [CrossRef]
- Koop, G.; Pesaran, M.H.; Potter, S.M. Impulse Response Analysis in Nonlinear Multivariate Models. J. Econom. 1996, 74, 119–147. [Google Scholar] [CrossRef]
- Pesaran, H.H.; Shin, Y. Generalized impulse response analysis in linear multivariate models. Econ. Lett. 1998, 58, 17–29. [Google Scholar] [CrossRef]
- Koop, G.; Korobilis, D. A new index of financial conditions. Eur. Econ. Rev. 2014, 71, 101–116. [Google Scholar] [CrossRef]
- Elliott, G.; Rothenberg, T.J.; Stock, J.H. Efficient tests for an autoregressive unit root. Econometrica 1992, 64, 813–836. [Google Scholar] [CrossRef]
- Fisher, T.J.; Gallagher, C.M. New weighted portmanteau statistics for time series goodness of fit testing. J. Am. Stat. Assoc. 2012, 107, 777–787. [Google Scholar] [CrossRef]
- Hanif, W.; Hernandez, J.A.; Mensi, W.; Kang, S.H.; Uddin, G.S.; Yoon, S.M. Nonlinear dependence and connectedness between clean/renewable energy sector equity and European emission allowance prices. Energy Econ. 2021, 101, 105409. [Google Scholar] [CrossRef]
- Tu, Q.; Mo, J.; Liu, Z.; Gong, C.; Fan, Y. Using green finance to counteract the adverse effects of COVID-19 pandemic on renewable energy investment-The case of offshore wind power in China. Energy Policy 2021, 158, 112542. [Google Scholar] [CrossRef]


| Clean | Carbon | BistSust | Bist100 | |
|---|---|---|---|---|
| Mean | 2.89 | 1.893 | 3.141 | 3.041 |
| Median | 2.796 | 1.848 | 3.088 | 2.770 |
| Std. Dev. | 8.162 | 6.510 | 8.643 | 8.351 |
| Skewness | 0.863 *** | 0.207 *** | 1.576 *** | 1.390 *** |
| Kurtosis | −0.754 *** | −1.261 *** | 2.232 *** | 1.611 *** |
| Jarque–Bera | 295.309 (0.000) | 146.579 (0.000) | 1241.040 (0.000) | 858.883 (0.000) |
| Observation | 1997 | 1997 | 1997 | 1997 |
| ADF | −29.1768 (0.000) | −29.5029 (0.000) | −47.2091 (0.000) | −15.4165 (0.000) |
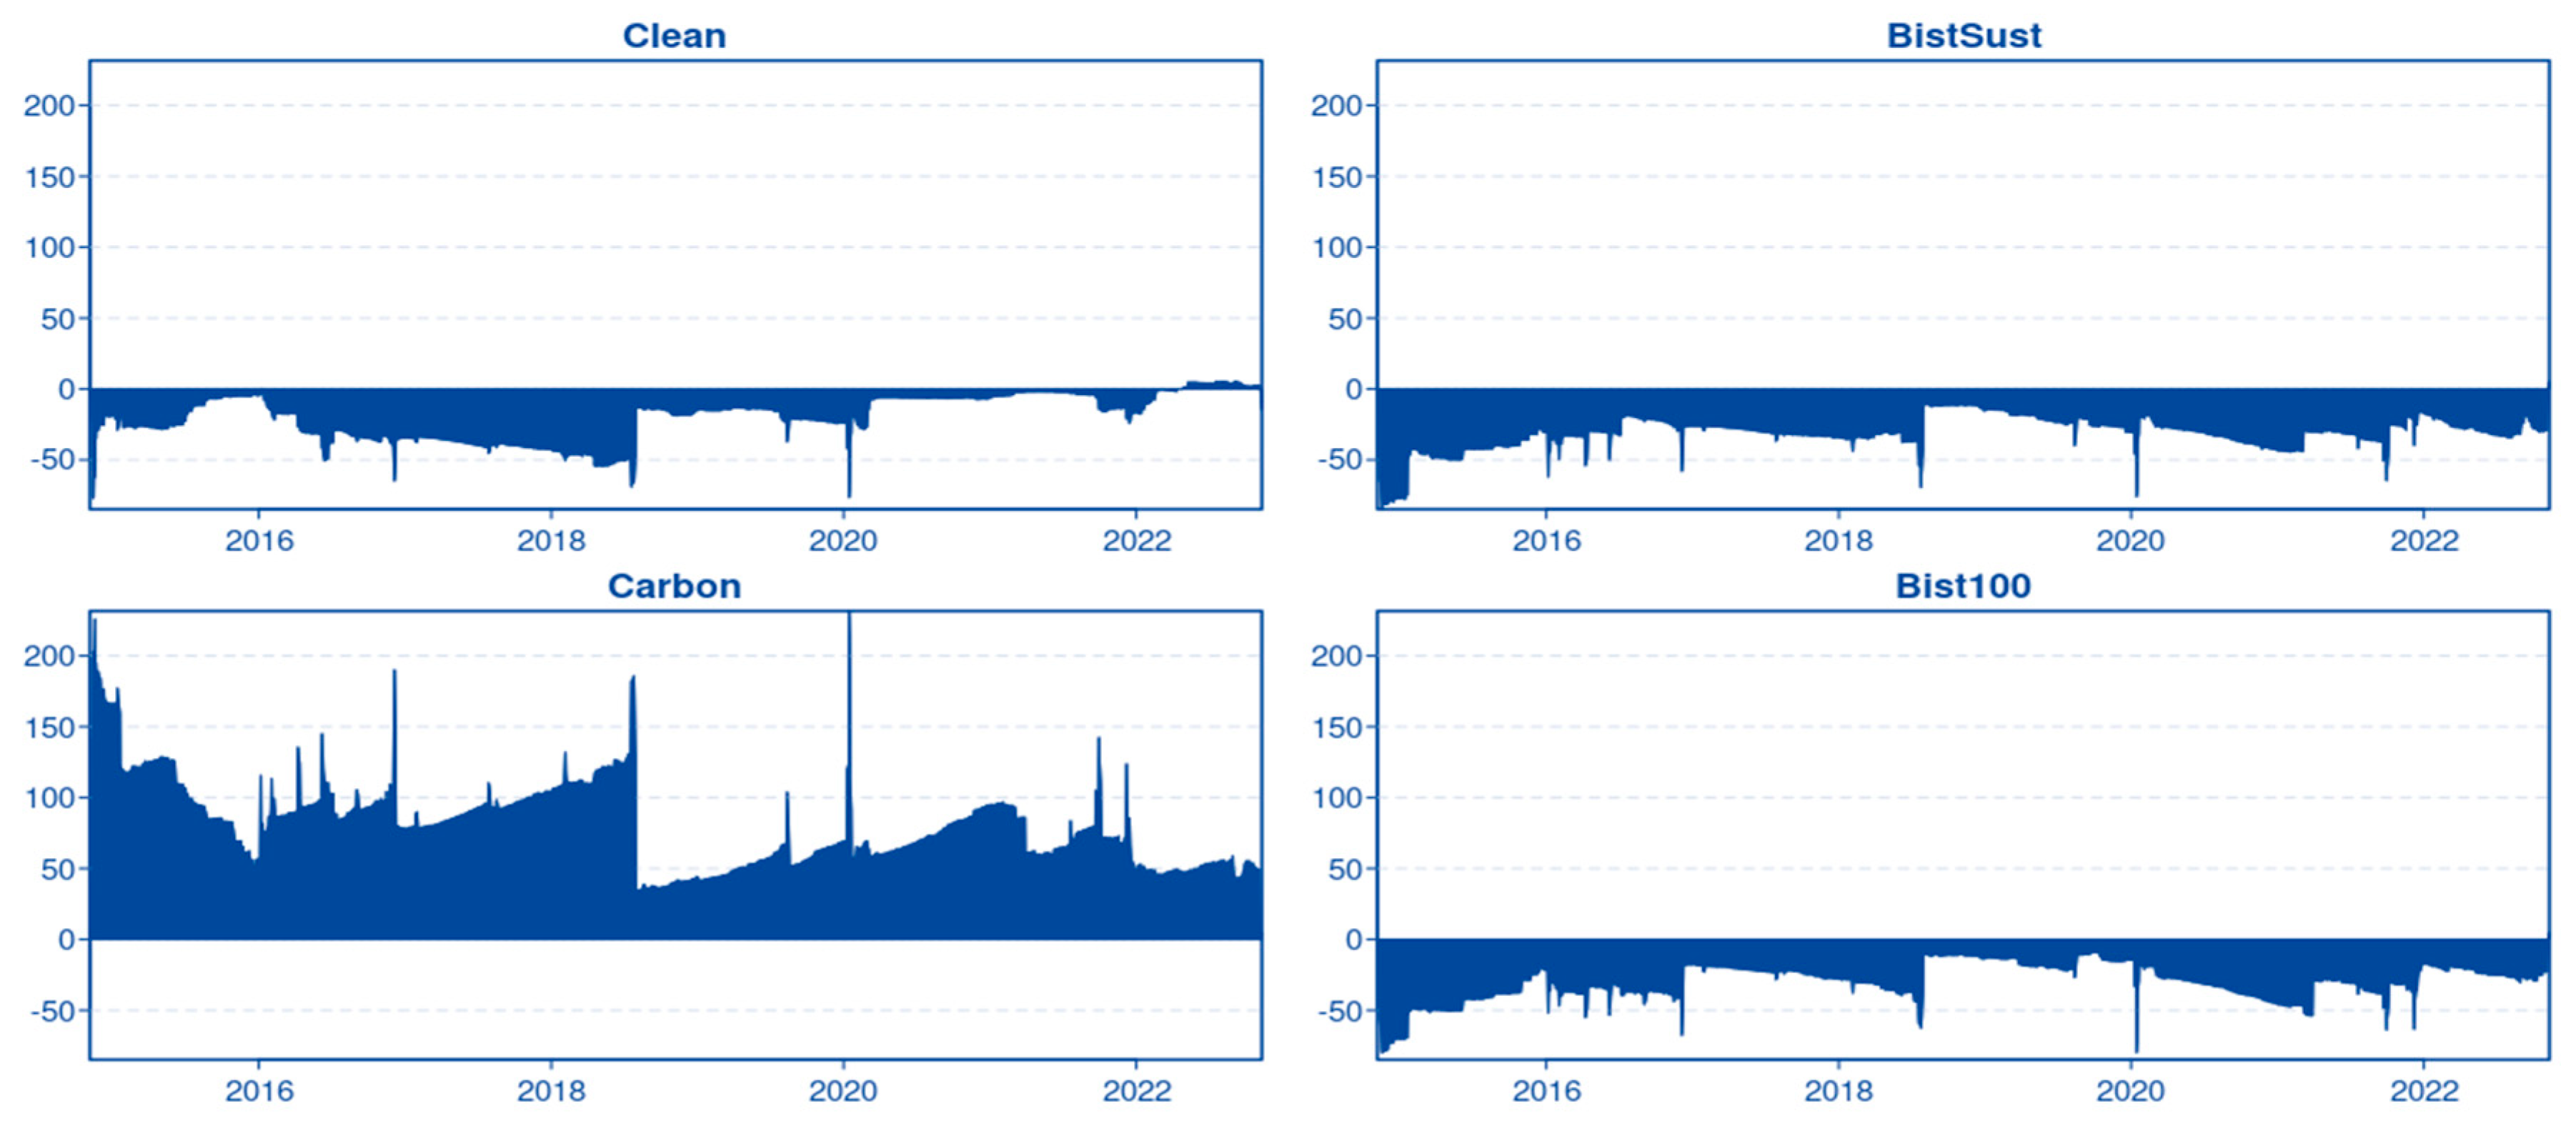
| Clean | Carbon | BistSust | Bist100 | Volatility Received (FROM) | |
|---|---|---|---|---|---|
| Clean | 60.98 | 21.77 | 8.39 | 8.86 | 39.02 |
| Carbon | 4.34 | 79.51 | 7.96 | 8.20 | 20.49 |
| BistSust | 7.78 | 39.17 | 38.44 | 14.61 | 61.56 |
| Bist100 | 7.23 | 39.77 | 14.41 | 38.59 | 61.41 |
| Volatility spilled over (TO) | 19.34 | 100.71 | 30.76 | 31.67 | 182.49 |
| NET | −19.68 | 80.22 | −30.80 | −29.73 | 60.83 |
Disclaimer/Publisher’s Note: The statements, opinions and data contained in all publications are solely those of the individual author(s) and contributor(s) and not of MDPI and/or the editor(s). MDPI and/or the editor(s) disclaim responsibility for any injury to people or property resulting from any ideas, methods, instructions or products referred to in the content. |
© 2023 by the authors. Licensee MDPI, Basel, Switzerland. This article is an open access article distributed under the terms and conditions of the Creative Commons Attribution (CC BY) license (https://creativecommons.org/licenses/by/4.0/).
Share and Cite
Doğan, M.; Raikhan, S.; Zhanar, N.; Gulbagda, B. Analysis of Dynamic Connectedness Relationships among Clean Energy, Carbon Emission Allowance, and BIST Indexes. Sustainability 2023, 15, 6025. https://doi.org/10.3390/su15076025
Doğan M, Raikhan S, Zhanar N, Gulbagda B. Analysis of Dynamic Connectedness Relationships among Clean Energy, Carbon Emission Allowance, and BIST Indexes. Sustainability. 2023; 15(7):6025. https://doi.org/10.3390/su15076025
Chicago/Turabian StyleDoğan, Mesut, Sutbayeva Raikhan, Nurbossynova Zhanar, and Bodaukhan Gulbagda. 2023. "Analysis of Dynamic Connectedness Relationships among Clean Energy, Carbon Emission Allowance, and BIST Indexes" Sustainability 15, no. 7: 6025. https://doi.org/10.3390/su15076025
APA StyleDoğan, M., Raikhan, S., Zhanar, N., & Gulbagda, B. (2023). Analysis of Dynamic Connectedness Relationships among Clean Energy, Carbon Emission Allowance, and BIST Indexes. Sustainability, 15(7), 6025. https://doi.org/10.3390/su15076025