
Evaluation of Different Potassium Management Options under Prevailing Dry and Wet Seasons in Puddled, Transplanted Rice

 ,
,  and
and 
Abstract
1. Introduction
2. Materials and Methods
2.1. Field Site
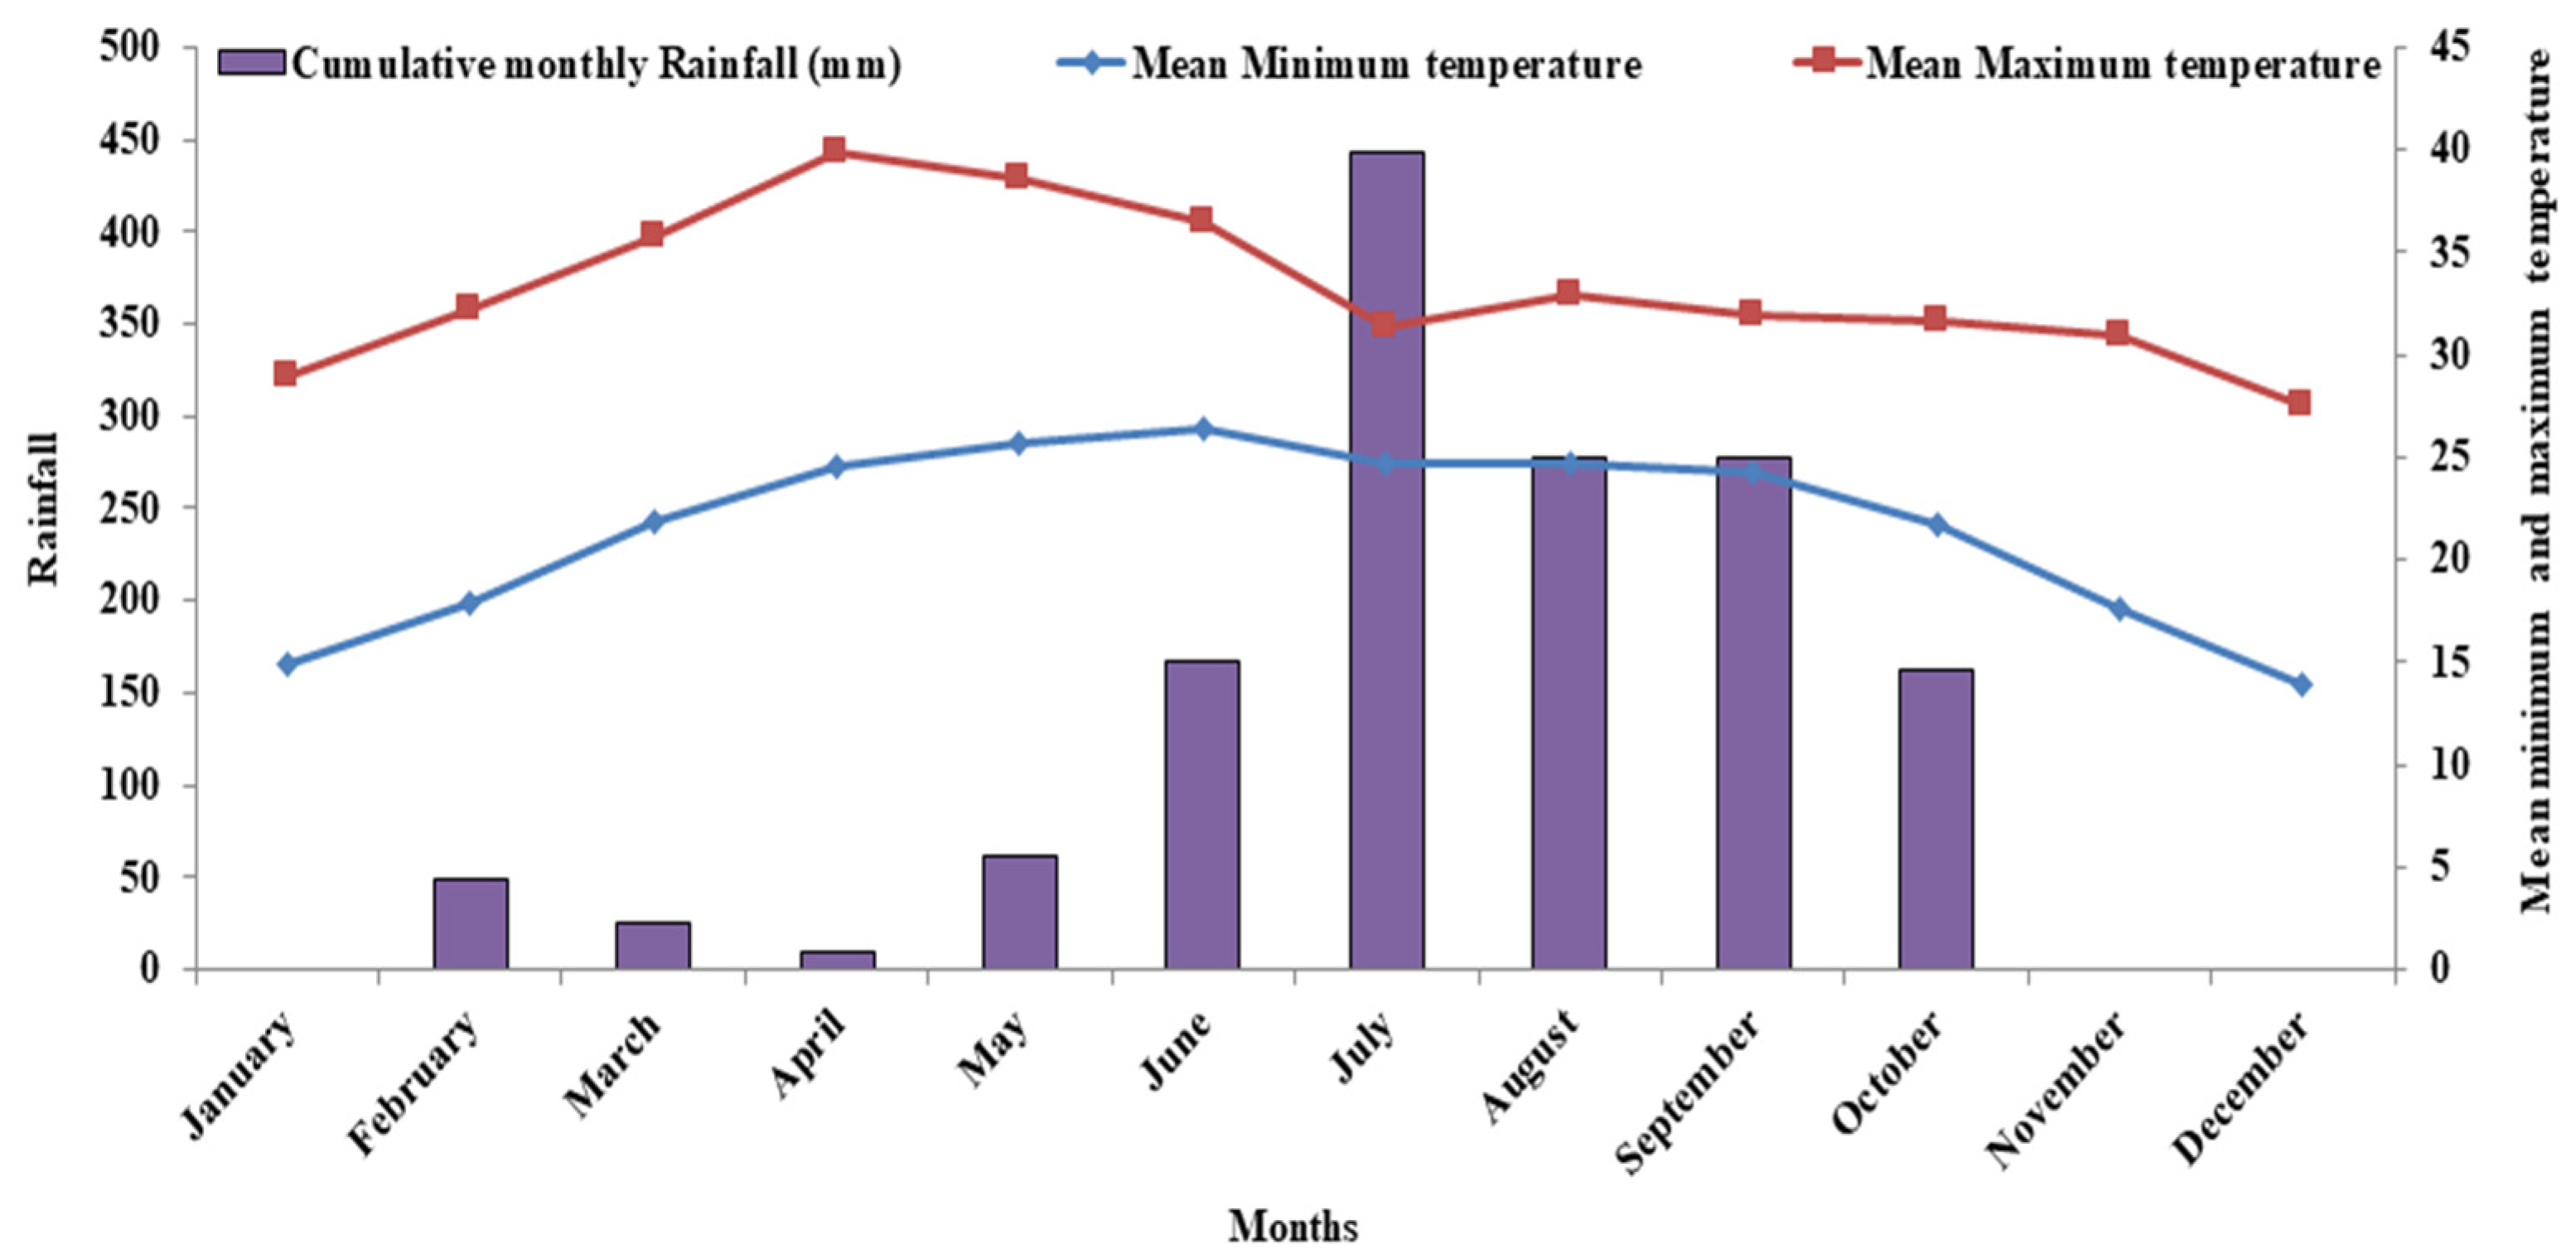
2.2. Climate
2.3. Experimental Design
2.4. Crop and Nutrient Management
2.5. Growth, Yields, and Yield Component Analysis
2.6. Plant Sampling and Analysis
- 1.
- Nutrient (N/P/K) uptake by grain/straw
- 2.
- Harvest index of potassium (KHI)
- 3.
- Agronomic efficiency of K (AEK) (kg kg−1)
- 4.
- Recovery efficiency of K (REK) (%)
- 5.
- Ratio between N, P, and Kwhere,
2.7. Potassium Balance
2.8. Soil Available K
2.9. Global Warming Potential (GWP) Analysis
2.10. Statistical Analysis
3. Results
3.1. Plant Biomass as Affected by K Management at M.T., P.I., and Harvest Stages
3.2. Yield-Attributing Characters
3.3. Grain Yields
3.4. Plant K Uptake as Affected by K Management at M.T., P.I., and Harvest Stages
3.5. Nitrogen and Phosphorus Uptake
3.6. K/N and K/P Ratios
3.7. Potassium Harvest Index (KHI), Agronomic Efficiency (A.E.), and Recovery Efficiency (RE)
3.8. Soil Available K at M.T., P.I., and Harvest Stages
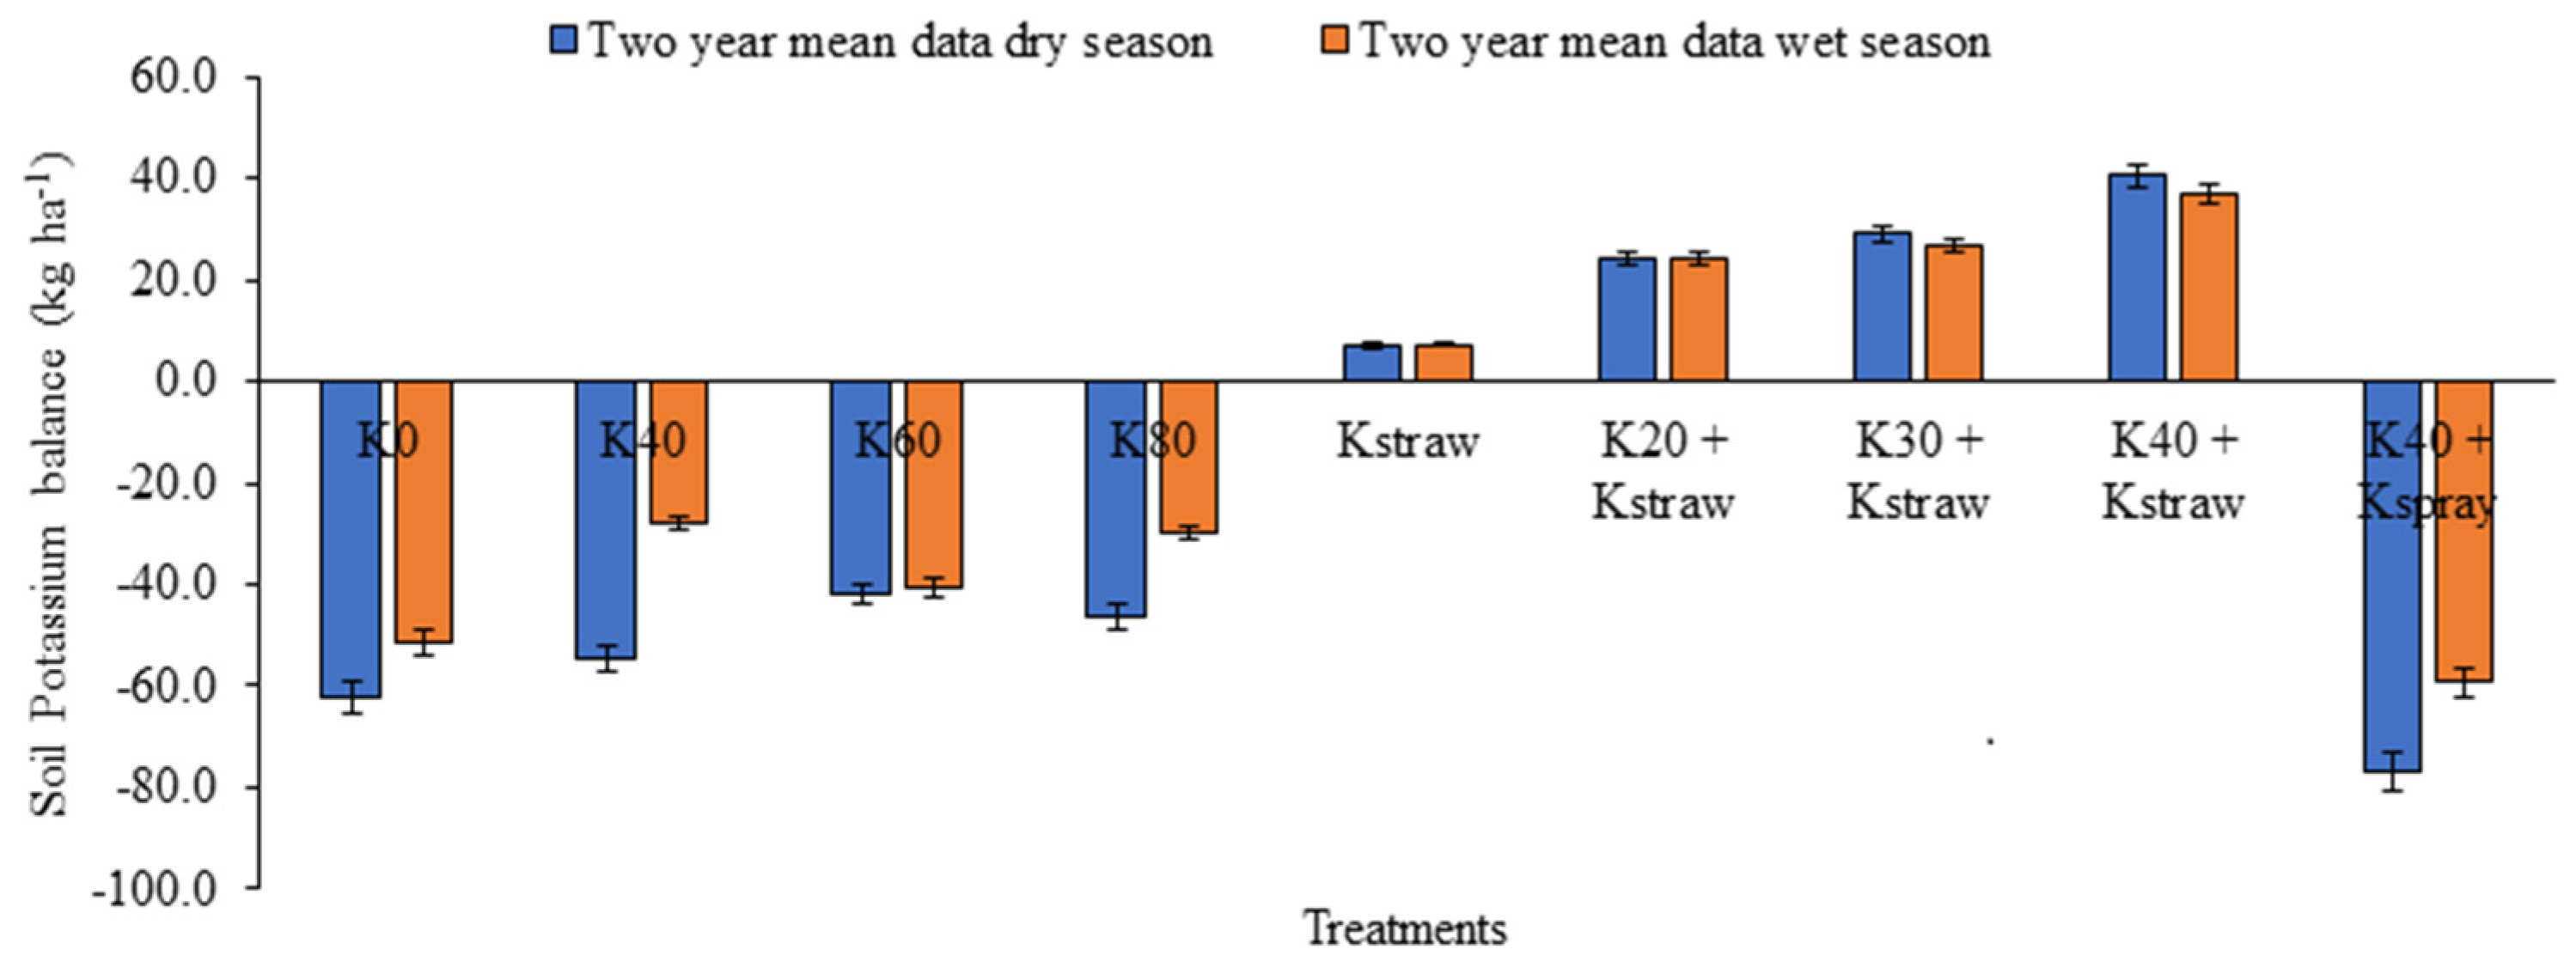
3.9. Soil Potassium Balance
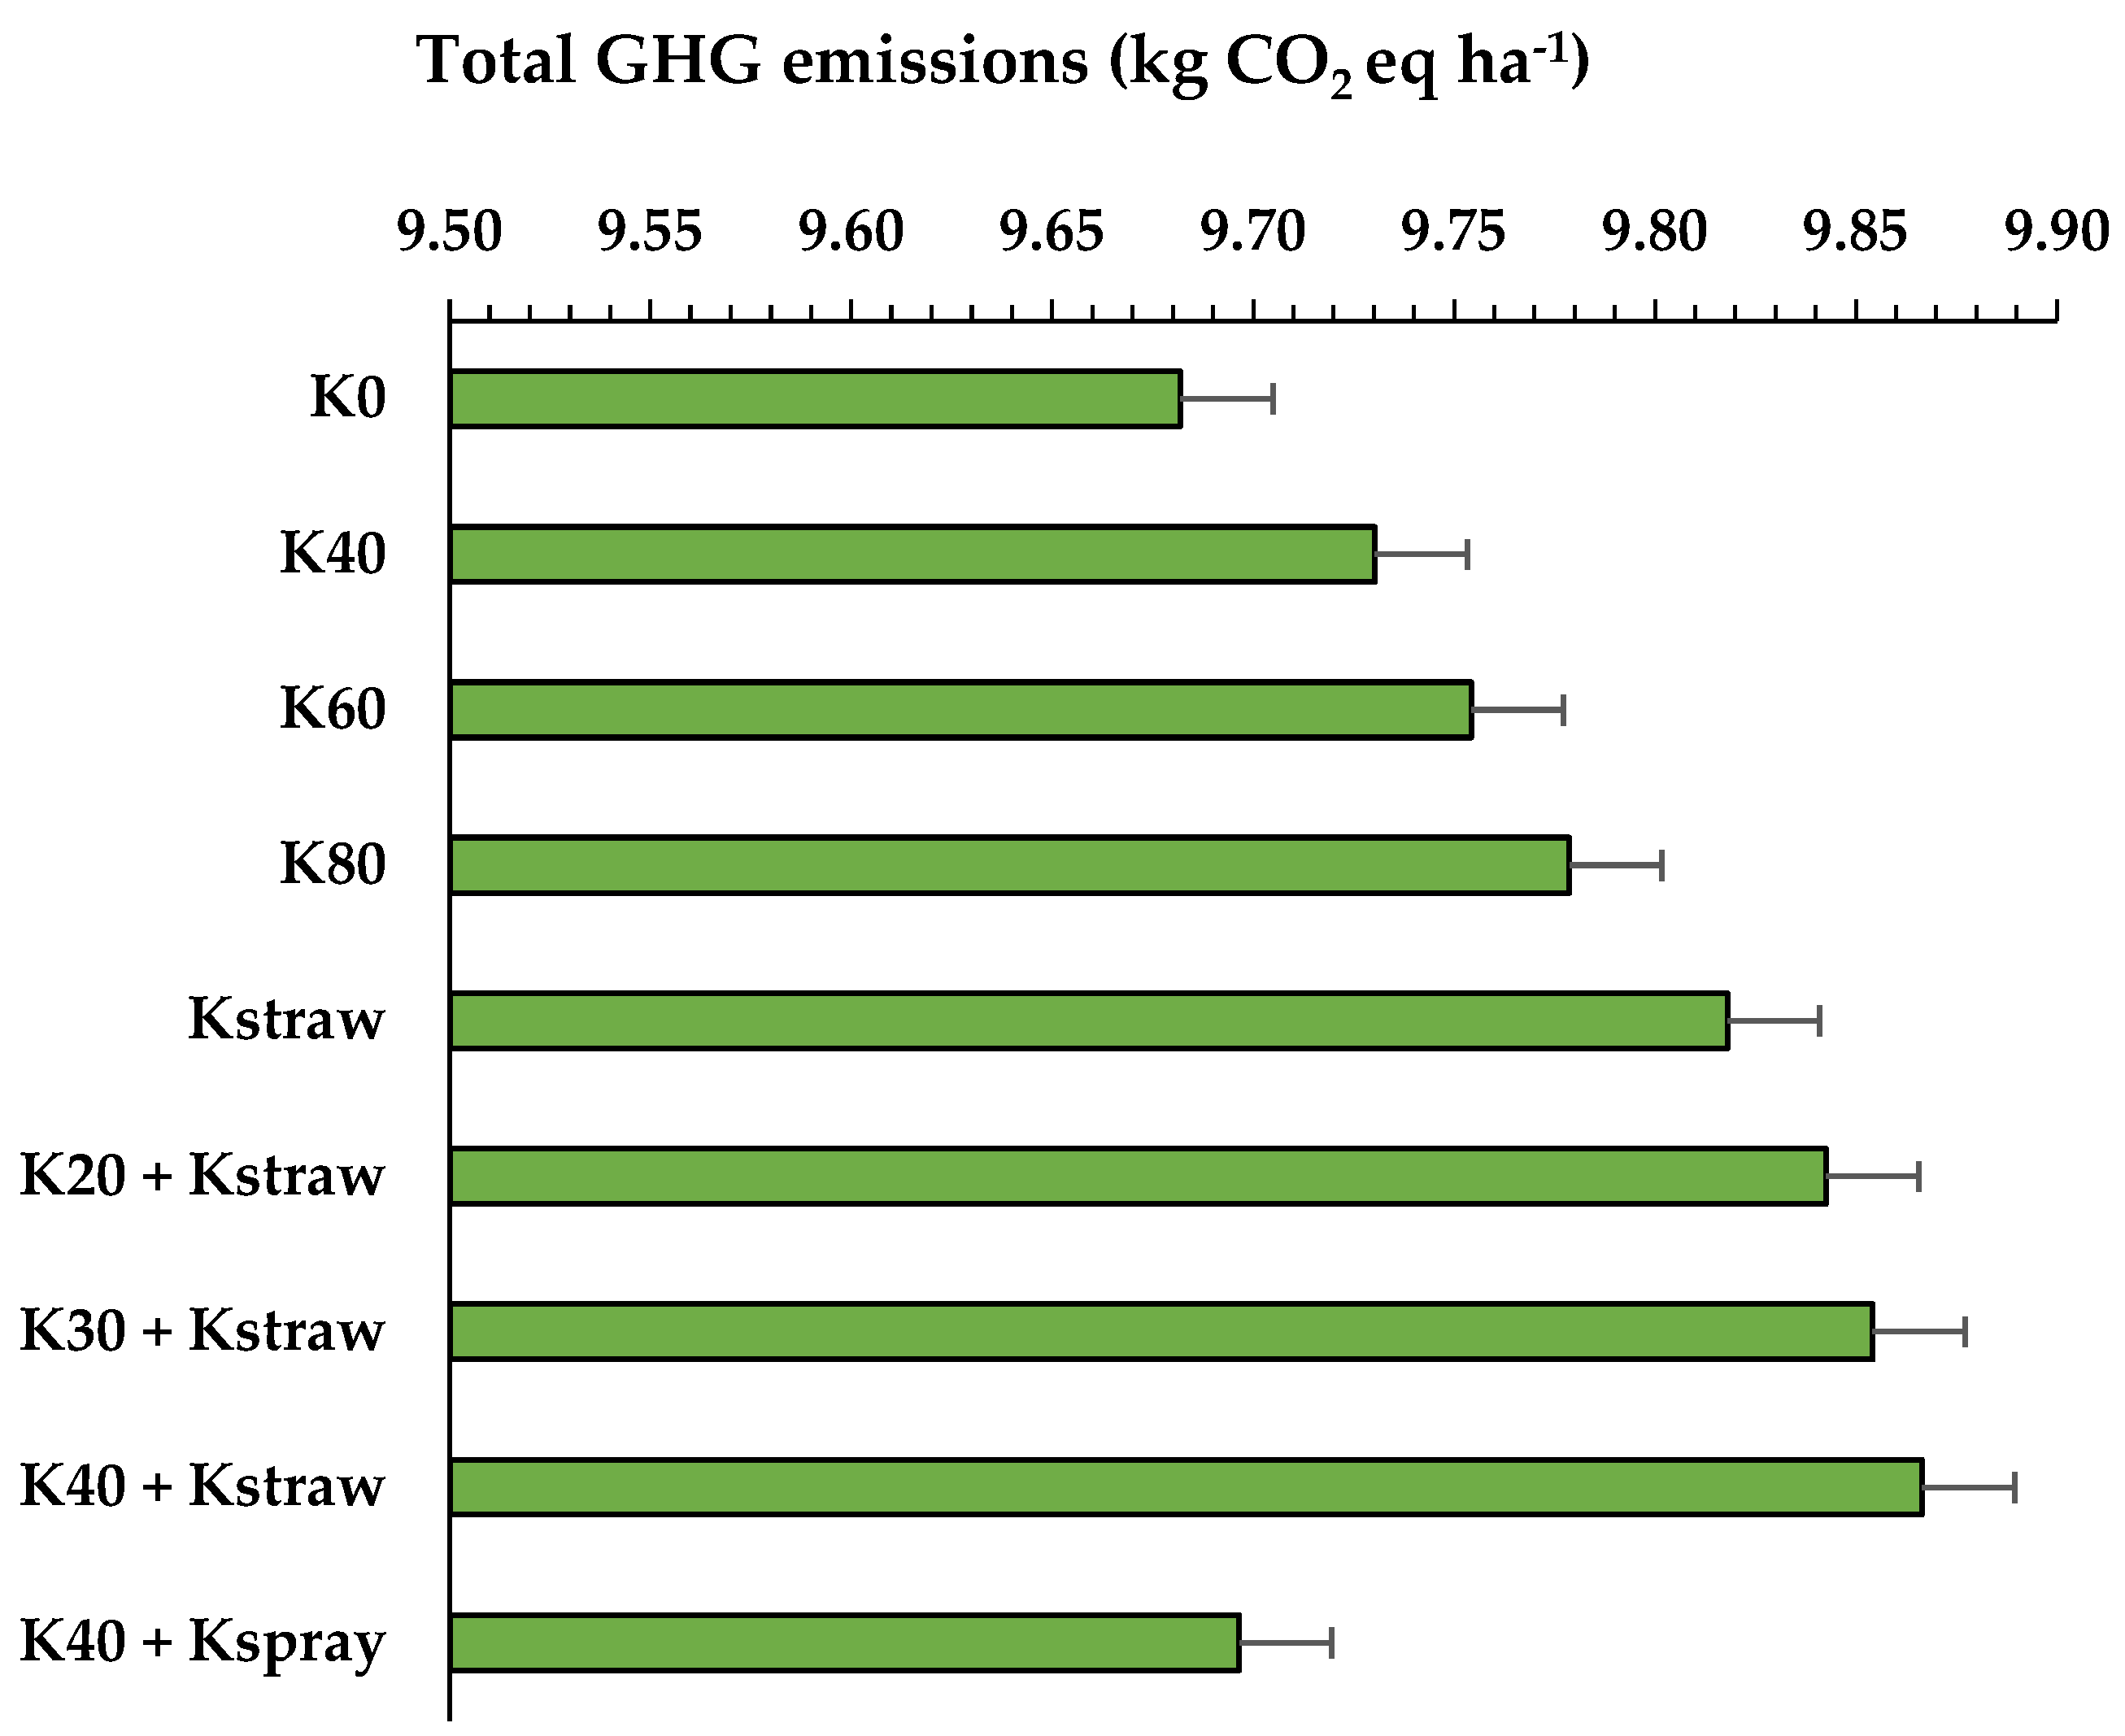
3.10. GHG Estimation under Different Potassium Management Options
4. Discussion
4.1. Effect of Potassium Management Strategy on Crop Yields
4.2. Effect of Potassium Management Strategy on Potassium Uptake
4.3. Effect of Potassium Management Strategy on Potassium Efficiency and Balance
4.4. Effect of Potassium Management Strategy on Greenhouse Gases
5. Conclusions
Author Contributions
Funding
Institutional Review Board Statement
Informed Consent Statement
Data Availability Statement
Acknowledgments
Conflicts of Interest
References
- FAO. FAOSTAT Production Data. 2020. Available online: www.fao.org/faostat/en/#data (accessed on 20 December 2022).
- Yuan, S.; Linquist, B.A.; Wilson, L.T.; Cassman, K.G.; Stuart, A.M.; Pede, V.; Miro, B.; Saito, K.; Agustiani, N.; Aristya, V.E.; et al. Sustainable intensification for a larger global rice bowl. Nat. Commun. 2021, 12, 7163. [Google Scholar] [CrossRef] [PubMed]
- Kumar, P.; Shinoj, P.; Raju, S.S.; Kumar, A.; Rich, K.M.; Msangi, S. Factor demand, output supply elasticities and supply projections for major crops of India. Agric. Econ. Res. Rev. 2010, 23, 1–14. [Google Scholar]
- Mohapatra, S.; Rout, K.; Khanda, C.; Mukherjee, S.; Mishra, A.; Mahapatra, S.; Mishra, M. Role of potassium on insect pests and diseases of puddled transplanted rice cv. Lalat Odisha. Oryza-Int. J. Rice 2017, 54, 314. [Google Scholar] [CrossRef]
- Padbhushan, R.; Sharma, S.; Kumar, U.; Rana, D.; Kohli, A.; Kaviraj, M.; Parmar, B.; Kumar, R.; Annapurna, K.; Sinha, A.K.; et al. Meta-Analysis Approach to Measure the Effect of Integrated Nutrient Management on Crop Performance, Microbial Activity, and Carbon Stocks in Indian Soils. Front. Environ. Sci. 2021, 9, 724702. [Google Scholar] [CrossRef]
- Sharma, S.; Padbhushan, R.; Kumar, U. Integrated Nutrient Management in Rice–Wheat Cropping System: An Evidence on Sustainability in the Indian Subcontinent through Meta-Analysis. Agronomy 2019, 9, 71. [Google Scholar] [CrossRef]
- Prasad, R.; Shivay, Y.S.; Kumar, D. Current Status, Challenges, and Opportunities in Rice Production. Rice Prod. Worldw. 2017, 1–32. [Google Scholar] [CrossRef]
- Öborn, I.; Andrist-Rangel, Y.; Askegaard, M.; Grant, C.; Watson, C.; Edwards, A. Critical aspects of potassium management in agricultural systems. Soil Use Manag. 2005, 21, 102–112. [Google Scholar] [CrossRef]
- Zhao, X.; Wang, H.; Lu, D.; Chen, X.; Zhou, J. The effects of straw return on potassium fertilization rate and time in the rice–wheat rotation. Soil Sci. Plant Nutr. 2019, 65, 176–182. [Google Scholar] [CrossRef]
- Sardans, J.; Peñuelas, J. Potassium: A neglected nutrient in global change. Glob. Ecol. Biogeogr. 2015, 24, 261–275. [Google Scholar] [CrossRef]
- Seal, A.; Bera, R.; Mukhopadhy, K.; Bhattachar, P. Potassium Fixation Capability of Some Acid Alfisols Developed under Tropical Environment in Eastern India. Int. J. Soil Sci. 2006, 1, 128–133. [Google Scholar] [CrossRef]
- Goswamy, N.N.; Banerjee, N.K. Phosphorous, Potassium and Other Macro Elements. Soils and Rice; IRRI Publication: Los Banos, Philippines, 1978; pp. 561–568. [Google Scholar]
- Randhwa, N.S.; Tandon, H.L.S. Advances in soil fertility and fertilizer use research in India. Fertil. News 1982, 27, 11–26. [Google Scholar]
- Kumari, S.; Kumari, P.; Kumari, R.; Padbhushan, R.; Kohli, A.; Kumari, V.; Kumari, K.; Kumar, G. Effect of STCR based Nutrient Management on Quantity-Intensity Relationship of Potassium in Rice based Cropping Systems of Indo Gangetic Plains. Biol. Forum—Int. J. 2021, 13, 616–626. [Google Scholar]
- Lu, D.; Li, C.; Sokolwski, E.; Magen, H.; Chen, X.; Wang, H.; Zhou, J. Crop yield and soil available potassium changes as affected by potassium rate in rice–wheat systems. Field Crop. Res. 2017, 214, 38–44. [Google Scholar] [CrossRef]
- Mandal, B.K.; Khanda, C.M. Nutrient mining in agro-climatic zones of West Bengal. Fertil. News 2001, 46, 63–71. [Google Scholar]
- Boakakati, K.; Bhattacharyya, H.C.; Karmakar, R.M. Nutrient mining in agro-climatic zones of Assam. Fertil. News 2001, 46, 61–63. [Google Scholar]
- Kumar, P.; Mishra, A.K.; Chaudhari, S.K.; Singh, R.; Yadav, K.; Rai, P.; Sharma, D.K. Conservation agriculture influences crop yield, soil carbon content and nutrient availability in rice–wheat system of north-west India. Soil Res. 2022, 60, 624–635. [Google Scholar] [CrossRef]
- Sahu, G.C.; Mishra, A. Soils of Orissa and its Management. Orissa Rev. 2005, 16, 56–60. [Google Scholar]
- Xu, X.; Du, X.; Wang, F.; Sha, J.; Chen, Q.; Tian, G.; Zhu, Z.; Ge, S.; Jiang, Y. Effects of Potassium Levels on Plant Growth, Accumulation and Distribution of Carbon, and Nitrate Metabolism in Apple Dwarf Rootstock Seedlings. Front. Plant Sci. 2020, 11, 904. [Google Scholar] [CrossRef]
- Mishra, A.K.; Arya, R.; Tyagi, R.; Grover, D.; Mishra, J.; Vimal, S.R.; Mishra, S.; Sharma, S. Non-Judicious Use of Pesticides Indicating Potential Threat to Sustainable Agriculture. In Sustainable Agriculture Reviews 50: Emerging Contaminants in Agriculture; Kumar Singh, V., Singh, R., Lichtfouse, E., Eds.; Springer: Cham, Switzerland, 2021; pp. 383–400. [Google Scholar] [CrossRef]
- Perera, G.S.N.; Sirisena, D.N.; Duminda, D.M.S. Second Annual Research Sessions; Rajarata University of Sri Lanka: Mihintale, Sri Lanka, 2011. [Google Scholar]
- Li, X.; Li, Y.; Wu, T.; Qu, C.; Ning, P.; Shi, J.; Tian, X. Potassium fertilization combined with crop straw incorporation alters soil potassium fractions and availability in northwest China: An incubation study. PLoS ONE 2020, 15, e0236634. [Google Scholar] [CrossRef]
- Yadav, R.L. Fertilizer productivity trends in a Rice-Wheat cropping system under Long-Term use of chemical fertilizers. Exp. Agric. 1998, 34, 1–18. [Google Scholar] [CrossRef]
- Wihardjaka, A.; Kirk, G.; Abdulrachman, S.; Mamaril, C. Potassium balances in rainfed lowland rice on a light-textured soil. Field Crop. Res. 1999, 64, 237–247. [Google Scholar] [CrossRef]
- Chivenge, P.; Rubianes, F.; Van Chin, D.; Van Thach, T.; Khang, V.T.; Romasanta, R.R.; Van Hung, N.; Van Trinh, M. Rice Straw Incorporation Influences nutrient Cycling and Soil Organic Matter. In Sustainable Rice Straw Management; Gummert, M., Hung, N.V., Chivenge, P., Douthwaite, B., Eds.; Springer International Publishing: Cham, Switzerland, 2020; pp. 131–144. [Google Scholar] [CrossRef]
- Kundu, C.; Sarkar, R.K. Effect of foliar application of potassium nitrate and calcium nitrate on performance of rainfed lowland rice (Oryza sativa). Indian J. Agron. 2009, 54, 428–432. [Google Scholar]
- Ravichandran, M.; Sriramachandrasekharan, M.V. Optimizing timing of potassium application in productivity enhancement of crops. Karnataka J. Agric. Sci. 2011, 24, 75–80. [Google Scholar]
- Venkateshwarlu, M.; Ghosh, S.K.; Patra, P.K.; Pal, B.; Reddy, G.K. To study the effect of fertilizer and organic manure on dynamic changes of K under cropping sequence. Int. J. Appl. Biol. Pharm. Technol. 2014, 5, 114–120. [Google Scholar]
- Son, T.T.; Anh, L.X.; Ronen, Y.; Holwerda, H.T. Foliar potassium nitrate application for paddy rice. Better Crops 2012, 96, 29–31. [Google Scholar]
- Babu, Y.J.; Nayak, D.R.; Adhya, T.K. Potassium application reduces methane emission from a flooded field planted to rice. Biol. Fertil. Soils 2005, 42, 532–541. [Google Scholar] [CrossRef]
- Jackson, M.L. Chemical Soil Analyses; Prentice Hall, Inc.: Inglewood Cliffs, NJ, USA, 1973. [Google Scholar]
- Fageria, N.K.; Dos Santos, A.B.; De Moraes, M.F. Yield, Potassium Uptake, and Use Efficiency in Upland Rice Genotypes. Commun. Soil Sci. Plant Anal. 2010, 41, 2676–2684. [Google Scholar] [CrossRef]
- Hazra, K.K.; Venkatesh, M.S.; Ghosh, P.K.; Ganeshamurthy, A.N.; Kumar, N.; Nadarajan, N.; Singh, A.B. Long-term effect of pulse crops inclusion on soil–plant nutrient dynamics in puddled rice (Oryza sativa L.)-wheat (Triticum aestivum L.) cropping system on an Inceptisol of Indo-Gangetic plain zone of India. Nutr. Cycl. Agroecosystems 2014, 100, 95–110. [Google Scholar] [CrossRef]
- Hanway, J.; Heidel, H. Soil analysis methods as used in Iowa State college soil testing laboratory. Iowa State Coll. Agric. Bull. 1952, 57, 1–3. [Google Scholar]
- Feliciano, D.; Nayak, D.R.; Vetter, S.H.; Hillier, J. CCAFS-MOT—A tool for farmers, extension services and policy-advisors to identify mitigation options for agriculture. Agric. Syst. 2017, 154, 100–111. [Google Scholar] [CrossRef]
- Bouwman, A.F.; Boumans, L.J.M.; Batjes, N.H. Estimation of global NH3volatilization loss from synthetic fertilizers and animal manure applied to arable lands and grasslands. Glob. Biogeochem. Cycles 2002, 16, 8-1–8-14. [Google Scholar] [CrossRef]
- Smith, P.; Powlson, D.; Glendining, M.; Smith, J. Potential for carbon sequestration in European soils: Preliminary estimates for five scenarios using results from long-term experiments. Glob. Chang. Biol. 1997, 3, 67–79. [Google Scholar] [CrossRef]
- Ogle, S.M.; Breidt, F.J.; Paustian, K. Agricultural management impacts on soil organic carbon storage under moist and dry climatic conditions of temperate and tropical regions. Biogeochemistry 2005, 72, 87–121. [Google Scholar] [CrossRef]
- Panse, V.G.; Sukhatme, P.V. Statistical Methods for Agricultural Workers, 2nd ed.; Indian Council of Agricultural Research: New Delhi, India, 1954. [Google Scholar]
- Gomez, K.A.; Gomez, A.A. Statistical Procedures for Agricultural Research; John Wiley and Sons: New York, NY, USA, 1984. [Google Scholar]
- Meena, H.M.; Sharma, R.P.; Sankhyan, N.K.; Sepehya, S. Effect of Continuous Application of Fertilizers, Farmyard Manure and Lime on Soil Fertility and Productivity of the Maize-Wheat System in an Acid Alfisol. Commun. Soil Sci. Plant Anal. 2017, 48, 1552–1563. [Google Scholar] [CrossRef]
- Armengaud, P.; Sulpice, R.; Miller, A.J.; Stitt, M.; Amtmann, A.; Gibon, Y. Multi-level analysis of primary metabolism provides new insights into the role of potassium nutrition for glycolysis and nitrogen assimilation in Arabidopsis thaliana roots. Plant Physiol. 2009, 150, 772–785. [Google Scholar] [CrossRef] [PubMed]
- Atapattu, A.J.; Prasantha, B.D.R.; Amaratunga, K.S.P.; Marambe, B. Increased rate of potassium fertilizer at the time of heading enhances the quality of direct seeded rice. Chem. Biol. Technol. Agric. 2018, 5, 22. [Google Scholar] [CrossRef]
- Sarkar, I.U.; Islam, N.; Jahan, A.; Islam, A.; Biswas, J.C. Rice straw as a source of potassium for wetland rice cultivation. Geol. Ecol. Landsc. 2017, 1, 184–189. [Google Scholar] [CrossRef]
- Khan, A.W.; Mann, R.A.; Saleem, M.; Majeed, A. Comparative rice yield and economic advantage of foliar KNO3 over soil applied K2SO4. Pak. J. Agric. Sci. 2012, 49, 481–484. [Google Scholar]
- Surekha, K.; Reddy, K.P.C.; Kumari, A.P.P.; Cruz, P.C.S. Effect of Straw on Yield Components of Rice (Oryza sativa L.) Under Rice-Rice Cropping System. J. Agron. Crop. Sci. 2006, 192, 92–101. [Google Scholar] [CrossRef]
- Graham, S.L.; Laubach, J.; Hunt, J.E.; Mudge, P.L.; Nuñez, J.; Rogers, G.N.; Buxton, R.P.; Carrick, S.; Whitehead, D. Irrigation and grazing management affect leaching losses and soil nitrogen balance of lucerne. Agric. Water Manag. 2021, 259, 107233. [Google Scholar] [CrossRef]
- Xue, X.; Lu, J.; Ren, T.; Li, L.; Yousaf, M.; Cong, R.; Li, X. Positional difference in potassium concentration as diagnostic index relating to plant K status and yield level in rice (Oryza sativa L.). Soil Sci. Plant Nutr. 2015, 62, 31–38. [Google Scholar] [CrossRef]
- Kumbhar, D.D.; Sonar, K.R. Performance of rice varieties grown under upland conditions. J. Indian Soc. Soil Sci. 1979, 28, 178–183. [Google Scholar]
- Panda, N. Fertiliser management in lowland rice. Oryza 1984, 21, 46–57. [Google Scholar]
- Ye, T.; Li, Y.; Zhang, J.; Hou, W.; Zhou, W.; Lu, J.; Xing, Y.; Li, X. Nitrogen, phosphorus, and potassium fertilization affects the flowering time of rice (Oryza sativa L.). Glob. Ecol. Conserv. 2019, 20, e00753. [Google Scholar] [CrossRef]
- Batra, A.L. Response of symbiotic N2 fixation and assimilate partitioning to K supply in alfalfa. Crop Sci. 1982, 22, 89–92. [Google Scholar]
- Saha, P.; Miah, M.; Hossain, A.; Rahman, F.; Saleque, M. Contribution of rice straw to potassium supply in rice-fallow-rice cropping pattern. Bangladesh J. Agric. Res. 1970, 34, 633–643. [Google Scholar] [CrossRef]
- Martin, H.W.; Sparks, D.L. On the behavior of non-exchangeable potassium in soils. Commun. Soil Sci. Plant Anal. 1985, 16, 133–162. [Google Scholar] [CrossRef]
- Wang, H.-Y.; Shen, Q.-H.; Zhou, J.-M.; Wang, J.; Du, C.-W.; Chen, X.-Q. Plants use alternative strategies to utilize nonexchangeable potassium in minerals. Plant Soil 2011, 343, 209–220. [Google Scholar] [CrossRef]
- Bell, M.J.; Ransom, M.D.; Thompson, M.L.; Hinsinger, P.; Florence, A.M.; Moody, P.W.; Guppy, C.N. Considering Soil Potassium Pools with Dissimilar Plant Availability. In Improving Potassium Recommendations for Agricultural Crops; Murrell, T.S., Mikkelsen, R.L., Sulewski, G., Norton, R., Thompson, M.L., Eds.; Springer: Cham, Switzerland, 2021. [Google Scholar] [CrossRef]
- Kumar, G.; Kumari, R.; Shambhavi, S.; Kumar, S.; Kumari, P.; Padbhushan, R. Eight-year Continuous Tillage Practice Impacts Soil Properties and Forms of Potassium under Maize-based Cropping Systems in Inceptisols of Eastern India. Commun. Soil Sci. Plant Anal. 2022, 53, 602–621. [Google Scholar] [CrossRef]
- Sapkota, T.B.; Vetter, S.H.; Jat, M.; Sirohi, S.; Shirsath, P.B.; Singh, R.; Jat, H.S.; Smith, P.; Hillier, J.; Stirling, C.M. Cost-effective opportunities for climate change mitigation in Indian agriculture. Sci. Total. Environ. 2018, 655, 1342–1354. [Google Scholar] [CrossRef]


| Treatments | Nitrogen (kg ha−1) | Phosphorus (kg ha−1) | Potassium (Chemical Fertilizer) (kg ha−1) | Potassium (Straw) (kg ha−1) | Potassium Nitrate (Foliar) (%) | Zinc (kg ha−1) |
|---|---|---|---|---|---|---|
| K0 | 117 | 40 | - | - | - | 5 |
| K40 | 117 | 40 | 40 | - | - | 5 |
| K60 | 117 | 40 | 60 | - | - | 5 |
| K80 | 117 | 40 | 80 | - | - | 5 |
| Kstraw | 117 | 40 | - | 45 | - | 5 |
| K20 + Kstraw | 117 | 40 | 20 | 45 | - | 5 |
| K30 + Kstraw | 117 | 40 | 30 | 45 | - | 5 |
| K40 + Kstraw | 117 | 40 | 40 | 45 | - | 5 |
| K40 + Kspray | 117 | 40 | 40 | - | 1 | 5 |
| Treatments | Dry Season | Wet Season | ||||
|---|---|---|---|---|---|---|
| Mid Tillering | Panicle Initiation | Harvest | Mid Tillering | Panicle Initiation | Harvest | |
| K0 | 1450 ab | 3970 ab | 7100 b | 1540 ab | 3890 a | 8560 d |
| K40 | 1550 ab | 4170 ab | 7580 b | 1570 ab | 3820 a | 9190 cd |
| K60 | 1530 ab | 4560 a | 8640 ab | 1580 ab | 4340 a | 11,070 abc |
| K80 | 1510 ab | 4250 ab | 9780 a | 1780 a | 4180 a | 11,560 a |
| Kstraw | 1210 b | 3720 b | 7720 b | 1350 b | 4330 a | 9540 bcd |
| K20 + Kstraw | 1250 b | 3710 b | 8130 ab | 1870 a | 3930 a | 8650 d |
| K30 + Kstraw | 1350 b | 3720 b | 8970 ab | 1420 ab | 4270 a | 11,060 abc |
| K40 + Kstraw | 1400 ab | 3940 ab | 8280 ab | 1320 b | 4330 a | 10,300 bcd |
| K40 + Kspray | 1650 a | 4580 a | 10,060 a | 1440 ab | 4480 a | 11,230 ab |
| Treatment | Effective Tillers m−2 | No. of Spikelet Panicle−1 | Filled Grains (%) | Test Weight (g) | Gr. Yield (t ha−1) | St. Yield (t ha−1) | Harvest Index |
|---|---|---|---|---|---|---|---|
| Dry Season | |||||||
| K0 | 227 c | 87 b | 86.1 bc | 25.2 b | 2.69 b | 4.41 c | 0.37 abc |
| K40 | 277 ab | 93 ab | 86.1 bc | 25.3 b | 3.21 b | 4.38 c | 0.42 a |
| K60 | 294 a | 98 ab | 90.7 ab | 25.7 ab | 3.51 ab | 5.13 abc | 0.41 ab |
| K80 | 273 abc | 101 a | 89.6 abc | 26.2 ab | 3.43 ab | 6.35 a | 0.35 c |
| Kstraw | 228 c | 88 ab | 84.6 c | 25.2 b | 2.82 b | 4.90 bc | 0.37 abc |
| K20 + Kstraw | 238 bc | 95 ab | 89.3 abc | 25.3 b | 3.17 b | 4.96 bc | 0.39 abc |
| K30 + Kstraw | 238 bc | 95 ab | 91.2 ab | 25.5 ab | 3.48 ab | 5.48 abc | 0.39 bc |
| K40 + Kstraw | 233 bc | 94 ab | 91.0 ab | 25.4 b | 3.08 b | 5.20 abc | 0.37 abc |
| K40 + Kspray | 313 a | 99 ab | 94.2 a | 27.0 a | 3.84 a | 6.22 ab | 0.38 abc |
| Wet Season | |||||||
| K0 | 400 a | 98 a | 84.1 ab | 25.8 a | 4.21 c | 4.35 c | 0.49 a |
| K40 | 406 a | 103 a | 82.0 b | 25.0 a | 4.34 bc | 4.84 abc | 0.47 a |
| K60 | 440 a | 99 a | 87.5 a | 25.9 a | 4.72 bc | 6.35 ab | 0.43 a |
| K80 | 436 a | 110 a | 85.5 ab | 26.4 a | 5.27 a | 6.69 a | 0.43 a |
| Kstraw | 375 a | 101 a | 84.6 ab | 26.3 a | 4.55 bc | 4.99 b | 0.48 a |
| K20 + Kstraw | 408 a | 99 a | 86.8 a | 25.2 a | 4.39 bc | 4.26 c | 0.51 a |
| K30 + Kstraw | 440 a | 104 a | 86.6 ab | 26.8 a | 5.17 ab | 5.89 abc | 0.47 a |
| K40 + Kstraw | 460 a | 104 a | 86.9 a | 27.0 a | 4.94 b | 5.37 abc | 0.48 a |
| K40 + Kspray | 444 a | 102 a | 85.1 ab | 26.9 a | 5.35 a | 5.88 ab | 0.48 a |
| Treatment | Mid Tillering | Panicle Initiation | Harvest | ||
|---|---|---|---|---|---|
| Straw | Grain | Total | |||
| Dry Season | |||||
| K0 | 16.12 abc | 43.37 c | 65.68 d | 7.29 c | 74 d |
| K40 | 17.40 ab | 49.73 bc | 90.52 cd | 10.59 bc | 100 cd |
| K60 | 18.46 a | 67.53 a | 104.62 abc | 12.29 b | 117 abc |
| K80 | 17.86 ab | 52.68 bc | 133.75 a | 13.34 ab | 147 a |
| Kstraw | 13.38 c | 46.15 bc | 99.03 bc | 12.13 b | 112 bc |
| K20 + Kstraw | 14.35 b | 49.21 bc | 78.35 cd | 13.31 b | 92 cd |
| K30 + Kstraw | 14.79 b | 46.11 bc | 108.87 abc | 14.62 ab | 123 abc |
| K40 + Kstraw | 16.57 ab | 53.02 bc | 97.28 bcd | 10.47 bc | 107 c |
| K40 + Kspray | 19.08 a | 56.74 ab | 121.25 ab | 17.66 a | 139 ab |
| Wet Season | |||||
| K0 | 24.58 a | 67.93 ab | 73.56 c | 13.23 c | 87 d |
| K40 | 24.66 a | 62.04 b | 83.47 bc | 13.49 c | 97 cd |
| K60 | 26.41 a | 83.51 ab | 130.49 a | 17.42 ab | 148 a |
| K80 | 30.65 a | 80.42 ab | 138.67 a | 16.89 abc | 156 a |
| Kstraw | 21.93 a | 77.35 ab | 88.62 bc | 14.62 bc | 103 bcd |
| K20 + Kstraw | 29.18 a | 66.30 ab | 72.90 c | 14.24 bc | 87 d |
| K30 + Kstraw | 22.88 a | 82.17 ab | 120.93 ab | 16.79 abc | 138 abc |
| K40 + Kstraw | 22.84 a | 79.52 ab | 99.46 abc | 18.72 a | 118 abcd |
| K40 + Kspray | 23.38 a | 85.67 a | 124.18 ab | 18 ab | 142 ab |
| Treatment | Dry Season | Wet Season | ||
|---|---|---|---|---|
| Nitrogen | Phosphorus | Nitrogen | Phosphorus | |
| (Nutrient Uptake) kg ha−1 | ||||
| K0 | 50.0 c | 10.1 d | 67.5 c | 21.5 d |
| K40 | 57.0 bc | 13.3 bcd | 70.2 c | 23.8 cd |
| K60 | 63.2 abc | 14.0 bc | 82.6 abc | 32.9 a |
| K80 | 68.7 ab | 17.7 a | 90.8 ab | 32.9 a |
| Kstraw | 54.2 bc | 11.8 cd | 78.6 bc | 25.7 bcd |
| K20 + Kstraw | 57.2 bc | 14.9 abc | 71.8 c | 21.5 d |
| K30 + Kstraw | 64.1 bac | 16.1 ab | 87.8 ab | 31.0 ab |
| K40 + Kstraw | 57.0 bc | 13.8 bc | 80.6 abc | 28.3 abcd |
| K40 + Kspray | 75.5 a | 17.9 a | 94.4 a | 30.6 abc |
| Treatment | Dry Season | Wet Season | ||
|---|---|---|---|---|
| K/N | K/P | K/N | K/P | |
| K0 | 1.47 a | 7.3 bc | 1.29 b | 4.04 a |
| K40 | 1.76 a | 7.54 bc | 1.38 ba | 4.08 a |
| K60 | 1.85 a | 8.33 ab | 1.79 a | 4.5 a |
| K80 | 2.14 a | 8.34 ab | 1.71 ab | 4.72 a |
| KStraw | 2.07 a | 9.47 a | 1.31 b | 4.02 a |
| K20 + Kstraw | 1.61 a | 6.18 c | 1.21 b | 4.06 a |
| K30 + Kstraw | 1.92 a | 7.66 abc | 1.57 ab | 4.44 a |
| K40 + Kstraw | 1.88 a | 7.79 abc | 1.47 ab | 4.18 a |
| K40 + Kspray | 1.84 a | 7.76 abc | 1.51 ab | 4.65 a |
| Treatment | Dry Season | Wet Season | ||||
|---|---|---|---|---|---|---|
| KHI | AE | RE | KHI | AE | RE | |
| K0 | 0.10 a | 0.15 a | ||||
| K40 | 0.11 a | 12.83 ab | 66.6 b | 0.16 a | 3.33 b | 25.4 ab |
| K60 | 0.11 a | 13.56 ab | 71.8 ab | 0.12 a | 8.56 b | 101.9 ab |
| K80 | 0.09 a | 9.13 ab | 92.2 ab | 0.11 a | 8.21 b | 86.0 ab |
| Kstraw | 0.11 a | 2.78 b | 85.6 ab | 0.15 a | 7.63 b | 36.5 ab |
| K20 + Kstraw | 0.15 a | 7.26 ab | 28.8 b | 0.17 a | 2.77 b | 0.50 b |
| K30 + Kstraw | 0.12 a | 10.51 ab | 66.3 b | 0.12 a | 12.80 b | 67.9 ab |
| K40 + Kstraw | 0.10 a | 4.47 ab | 39.4 b | 0.16 a | 8.55 b | 36.9 ab |
| K40 + Kspray | 0.13 a | 27.56 a | 157.5 a | 0.13 a | 27.40 a | 133.1 a |
| Treatment | Maximum Tillering | Panicle Initiation | Harvest | |||
|---|---|---|---|---|---|---|
| 0–15 cm | 15–30 cm | 0–15 cm | 15–30 cm | 0–15 cm | 15–30 cm | |
| Dry Season | ||||||
| K0 | 68.4 d | 42.1 b | 56.2 d | 45.9 c | 47.9 c | 46.8 b |
| K40 | 89.2 c | 46.9 b | 65.7 c | 56.1 bc | 51.1 c | 50.2 ab |
| K60 | 104.0 ab | 67.4 a | 82.4 ab | 63.5 b | 74.6 ab | 52.5 ab |
| K80 | 117.7 a | 78.4 a | 94.7 a | 72.2 a | 79.6 a | 62.5 a |
| KStraw | 108.5 ab | 57.1 ab | 87.5 ab | 52.8 bc | 58.5 bc | 48.1 b |
| K20 + KStraw | 84.3 bc | 42.2 b | 67.0 bc | 46.1 c | 50.9 c | 48.4 b |
| K30 + KStraw | 94.2 bc | 50.3 ab | 81.1 ab | 50.4 bc | 66.6 b | 47.0 b |
| K40 + KStraw | 90.3 bc | 64.6 a | 83.5 ab | 58.2 bc | 78.8 a | 47.3 b |
| K40 + KSpray | 92.0 bc | 48.7 b | 69.1 bc | 52.0 bc | 57.8 bc | 48.2 b |
| Wet Season | ||||||
| K0 | 42.3 d | 33.1 b | 29.0 d | 28.0 c | 35.6 c | 46.9 b |
| K40 | 52.3 cd | 39.9 b | 39.2 c | 33.9 bc | 47.6 b | 47.3 b |
| K60 | 59.1 c | 38.2 b | 47.4 b | 43.7 a | 63.3 a | 70.9 a |
| K80 | 71.6 b | 45.8 ab | 44.2 bc | 42.3 a | 46.0 b | 62.5 a |
| KStraw | 48.6 cd | 42.0 b | 55.8 a | 37.1 b | 45.2 b | 51.7 b |
| K20 + KStraw | 64.9 bc | 43.6 b | 37.0 c | 34.6 b | 48.1 b | 47.1 b |
| K30 + KStraw | 81.6 a | 51.3 a | 55.8 a | 46.1 a | 59.5 a | 59.4 a |
| K40 + KStraw | 66.9 bc | 55.3 a | 46.2 b | 43.2 a | 46.3 b | 54.0 ab |
| K40 + KSpray | 50.1 cd | 41.8 b | 39.0 c | 36.5 b | 43.7 bc | 50.5 ab |
Disclaimer/Publisher’s Note: The statements, opinions and data contained in all publications are solely those of the individual author(s) and contributor(s) and not of MDPI and/or the editor(s). MDPI and/or the editor(s) disclaim responsibility for any injury to people or property resulting from any ideas, methods, instructions or products referred to in the content. |
© 2023 by the authors. Licensee MDPI, Basel, Switzerland. This article is an open access article distributed under the terms and conditions of the Creative Commons Attribution (CC BY) license (https://creativecommons.org/licenses/by/4.0/).
Share and Cite
Mohapatra, S.; Rout, K.K.; Khanda, C.; Mishra, A.; Yadav, S.; Padbhushan, R.; Mishra, A.K.; Sharma, S. Evaluation of Different Potassium Management Options under Prevailing Dry and Wet Seasons in Puddled, Transplanted Rice. Sustainability 2023, 15, 5819. https://doi.org/10.3390/su15075819
Mohapatra S, Rout KK, Khanda C, Mishra A, Yadav S, Padbhushan R, Mishra AK, Sharma S. Evaluation of Different Potassium Management Options under Prevailing Dry and Wet Seasons in Puddled, Transplanted Rice. Sustainability. 2023; 15(7):5819. https://doi.org/10.3390/su15075819
Chicago/Turabian StyleMohapatra, Suchismita, Kumbha Karna Rout, Chandramani Khanda, Amit Mishra, Sudhir Yadav, Rajeev Padbhushan, Ajay Kumar Mishra, and Sheetal Sharma. 2023. "Evaluation of Different Potassium Management Options under Prevailing Dry and Wet Seasons in Puddled, Transplanted Rice" Sustainability 15, no. 7: 5819. https://doi.org/10.3390/su15075819
APA StyleMohapatra, S., Rout, K. K., Khanda, C., Mishra, A., Yadav, S., Padbhushan, R., Mishra, A. K., & Sharma, S. (2023). Evaluation of Different Potassium Management Options under Prevailing Dry and Wet Seasons in Puddled, Transplanted Rice. Sustainability, 15(7), 5819. https://doi.org/10.3390/su15075819