Article

Study on Carbon Emission Measurement in Building Materialization Stage

State Key Laboratory Base of Eco-Hydraulic Engineering in Arid Area, Xi’an University of Technology, Xi’an 710048, China
*
Author to whom correspondence should be addressed.
Sustainability 2023, 15(7), 5717; https://doi.org/10.3390/su15075717
Submission received: 28 February 2023 / Revised: 20 March 2023 / Accepted: 23 March 2023 / Published: 24 March 2023

Abstract

:
The construction industry plays a pivotal role in energy conservation and emission reduction. Therefore, it is of great significance to conduct research on quantifying carbon emissions in this industry to accelerate the establishment of a standardized carbon emission accounting system and achieve the goals of carbon peak and carbon neutrality. In this study, the focus is on the building materialization stage, and a carbon emission accounting system is established using the carbon emission factor method. This system is applied to calculate the carbon emissions of 15 residential buildings in Shaanxi Province. Results indicate that the carbon concentration during the materialization stage ranges from 372.43 kgCO2/m2 to 525.88 kgCO2/m2, and the building material production stage accounts for 94.27% of the total emissions. Additionally, by analyzing the carbon emission composition of the sample buildings, the primary factors that influence carbon emissions during the residential building materialization stage are identified, and corresponding carbon reduction strategies are proposed. The sensitivity coefficients of carbon reduction strategies vary significantly across different stages, with the building material production stage exhibiting the highest sensitivity coefficient. Thus, it is imperative to prioritize carbon reduction strategies that target the building material production stage.

1. Introduction

In recent years, due to global warming, carbon emission reduction has become the key to the sustainable development of the construction industry [1,2]. According to the China Building Energy Consumption and Carbon Emissions Research Report (2022) [3], in 2020, the carbon emissions in the building materialization stage (carbon emissions of 2.82 billion tCO2 in the building material production stage and carbon emissions of 100 million tCO2 in the construction stage) accounted for 29.2% of the national carbon emissions, while the carbon emissions in the operation stage accounted for 21.7% of the national carbon emissions. It can be seen that the materialization stage plays an important role in carbon emission during the whole building life cycle. Although previous studies have found that the building operation stage accounts for 82–86% of total carbon emissions [4], the absolute amount of carbon emissions in the materialization stage is more significant when carbon emissions are considered on an annual scale [5]. Considering that there are a large number of new projects in different regions at the same time every year, the carbon emissions generated by agglomeration have been paid attention to by researchers. In addition, with the vigorous promotion of low-energy green building projects such as net zero buildings, carbon emissions in the operation stage have a further decreasing trend. Driven by the national dual-carbon goal [6], the sustainable goal should now shift to the carbon emission impact in the building materialization stage [7].
The materialization stage is an integral part of the life cycle of a building. Various studies have divided the life cycle of a building into four stages. For instance, Leif et al. [8] divided it into four stages: material production, construction, operation, and demolition. Taking into account the carbon emission characteristics in each stage of the building’s life cycle and the needs of the calculation model, this paper adopts four stages, namely the planning and design stage, the materialization stage, the use and maintenance stage, and the demolition and recycling stage. The materialization stage refers to the whole process of the building, from the production of building materials to the formation of an engineering structure.
Building carbon emissions research has traditionally focused on the life cycle assessment [1,9,10]. The materialization stage, being the key stage of the life cycle, frequently appears in various studies with embodied carbon emissions as the keywords. The scope of calculation for embodied carbon emissions and carbon emissions during the materialization stage tends to be consistent [11], although some researchers have given different definitions. For instance, Li et al. [12] defined embodied carbon emissions as the greenhouse gas emissions that occur during the production, transportation, and construction process of building materials and components. This article’s scope of calculation for embodied carbon emissions also included carbon emissions during the maintenance and renovation stages of the building. Furthermore, the research on carbon emissions during the materialization stage yielded similar conclusions. Luo et al. [13] analyzed and calculated the CO2 emissions during the materialization stage of 78 office buildings and found that steel, concrete, mortar, and wall materials were the main sources of CO2 emissions during this stage, as well as the largest contributors to the overall emissions. Zhang and Wang [14] compared process-based methods and input–output analysis methods for calculating embodied carbon emissions in the construction industry, and concluded that process-based methods could achieve the desired level of detail for specific processes, but may be subject to truncation errors due to system boundary limitations. Moreover, the study highlighted that material production is the primary contributor to embodied carbon emissions, comprising 80% to 90% of the total emissions.
Several studies have investigated the carbon emissions of different sub-stages within the materialization stage. Proietti et al. [15] compared the carbon footprint of reflective foil with other insulation materials and suggested measures to reduce emissions. Gerilla et al. [16] analyzed the emissions of CO2, NOX, SOX, and SPM during the construction phase of Japanese timber structures and reinforced concrete structures and found that CO2 had the greatest environmental impact. Li et al. [17] used the life cycle assessment method to study the carbon footprint of precast concrete piles in the construction stage and created a database of carbon emission factors for construction machinery and equipment. Atmaca et al. [18] calculated the carbon emissions of common residential buildings in Turkey and found that emissions from the transportation phase were 6.5% higher than those from the construction phase.
Considering the significant impact of building materials on building carbon emissions, there has been a constant emergence of studies on sustainable building materials in recent years. Researchers have mostly focused on discovering the physical [19,20], economic [21], and ecological [22] impacts of sustainable building materials. Xiao et al. [23] conducted strength, drying shrinkage, and carbon emission analysis on concrete prepared with natural aggregates, recycled aggregates, and carbonized recycled aggregates, and found that the carbon emissions of carbonized fully recycled aggregate concrete are 7.1% to 13.3% lower than those of natural and recycled concrete, with a CO2 intensity of 13.4% to 18.4% lower. Zhang et al. [24] suggested that surface decoration of building components can also be completed in the prefabrication process, which can reduce material waste and, thus, corresponding emissions. Furthermore, to reduce the carbon emission factor of materials, waste materials and substitutes can be utilized to lower emissions from steel and cement [25] production. However, reducing carbon emissions in the building materialization stage necessitates not only the use of sustainable building materials but also measures that can be implemented during the construction phase [26].
Based on the reviewed studies, although the conclusions on the contributors to carbon emissions are generally consistent, the lack of a unified carbon emission calculation model and system boundary for the materialization phase has led to a lack of comparability across studies. In this regard, the uncertainty of life cycle assessment (LCA) [27] has already caught the attention of researchers, especially as it has hampered efforts to reduce carbon emissions in the early design stage. Furthermore, research on carbon reduction measures has focused specifically on the carbon reduction potential of materials and operation stages, with little emphasis on other stages. Additionally, Chen et al. [28] found that there is a significant difference in the embodied carbon emissions of building materials in different regions. To address these gaps, this study aims to achieve the following: (1) focus on the materialization phase as the research object, establish a relatively complete carbon emission accounting system for this phase, and provide a calculation framework for subsequent comparative research; (2) analyze the characteristics and patterns of carbon emissions in the materialization phase of 15 residential buildings located in Xi’an, and provide literature support for research on building carbon emissions in the northwest region; and (3) based on carbon emission data, study the main factors affecting carbon emissions, analyze carbon reduction strategies covering the entire materialization phase, and quantify their impact on carbon emissions through sensitivity analysis, to promote the development of low-carbon buildings.

2. Carbon Emission Accounting System in Building Materialization Stage

The carbon emission accounting in the building materialization stage refers to the whole process of collecting, counting, and calculating the carbon emission from the activities of carbon emission in the materialization stage of the building. Specifically, the building materialization stage encompasses three sub-stages: building material production, building construction, and building material transportation, with the carbon emission calculation boundaries of these three sub-stages illustrated in Figure 1.

2.1. Carbon Emission Accounting Basis

2.1.1. Accounting Method

There are presently three methods for calculating carbon emissions: the measurement method, the input–output method [29], and the emission factor method [30]. Due to the ease of data acquisition, simplicity of calculation, wide coverage, and suitability for macro and micro scenarios, the emission factor method is currently a widely used method for calculating carbon emissions in the construction industry. Therefore, this article selects the emission factor method to quantitatively study the carbon emissions of the building materialization stage. The basic principle of this method is as follows:
C = E i × ε i
where E i refers to the activity level data, including material consumption, construction machinery consumption, and transportation volume, and ε i represents the carbon emission factor, including the carbon emission factor of materials, energy, construction machinery, and transportation.

2.1.2. Determination of Carbon Emission Factors

The carbon emission factor is a fundamental parameter used to calculate carbon emissions, reflecting the amount of carbon emitted per unit of product in production activities. It correlates energy and material consumption with carbon emissions, simplifying the calculation process. In this study, relevant standards, regulations, literature, and reports from both domestic and international sources were collected to summarize existing carbon emission factor information. Based on principles such as authority, regional applicability, and timeliness, the selection and calculation of carbon emission factors were conducted, ultimately categorizing them into four groups: energy, building materials, construction machinery, and transportation.

2.2. Construction of Carbon Emission Accounting Model

The different sources of carbon emissions in the building materialization stage can be divided into three sub-stages. The total carbon emissions in the materialization stage can be represented as the sum of the carbon emissions in the building material production stage, the construction stage, and the material transportation stage:
C = C M + C C + C T
where C is the total amount of carbon emissions generated in the materialization stage, kgCO2; C M refers to the carbon emissions generated in the production stage of building materials; C C denotes the carbon emissions produced in the construction stage; and C T is the carbon emissions generated during the transportation of building materials.

2.2.1. Building Material Production Stage

The carbon emissions in the production stage of building materials originate from the significant energy consumption involved in mining and processing raw materials, as well as in the transportation and further processing of these materials to obtain finished building material products. The calculation formula for carbon emissions during this stage is as follows:
C M = i = 1 n M Q i × M i
where M Q i refers to the consumption of the i-th building material (i = 1, 2, 3,…, n) and M i is the carbon emission factor of the i-th building material.

2.2.2. Building Construction Stage

The carbon emissions during the construction phase originate from the energy consumption of the construction production area and the office living area. The energy sources consumed by construction machinery include fossil fuels and electricity, and the factors affecting their carbon emissions mainly include machinery specifications and equipment consumption rates. The energy consumed by construction personnel in their offices and living areas mainly includes electricity and gas, such as lighting, computers, air conditioning, heating, and other equipment. Carbon emissions from construction machinery are the main part of carbon emissions during the construction phase. The carbon emissions calculation formula for this phase is as follows:
C C = i = 1 n P Q i × P i + W Q i × W i
where P Q i is the consumption of the i-th machinery in the main construction process (i = 1, 2, 3,…, n); P i refers to the carbon emission factor of the i-th machinery; W Q i refers to the consumption of the i-th energy used in office and living areas; and W i is the carbon emission factor of the i-th energy.

2.2.3. Building Material Transportation Stage

The transportation of building materials is an essential link in the materialization process. The accounting scope of this stage includes the transportation of processed building materials from the material processing plant to the construction site. The transportation of building materials from the mining site to the material processing plant is within the scope of the building material production stage, and therefore, this part of the carbon emissions is not considered to avoid duplication. The transportation of building materials generates carbon emissions through the consumption of energy by transportation machinery. The specific calculation formula is as follows:
C T = i = 1 n T Q i × L i × T i
where T Q i is the weight of the i-th building material (i = 1, 2, 3,…, n); L i represents the transportation distance of the i-th building material transportation machinery; T i is the carbon emission factor per unit weight of building materials for a given transportation distance.

2.3. Data Sources and Function Units

To calculate the carbon emissions during the materialization phase of a building, it is necessary to obtain carbon emission activity level data [31] for each phase. The production phase of building materials can be obtained through design drawings and bills of quantities, or by using BIM [32] to obtain the amount of building materials consumed through software such as Glodon or Revit. Information on the specifications, model, and fuel consumption of construction machinery in the construction phase is obtained from the bill of quantities and construction organization design, while energy consumption data of construction personnel are obtained from the construction organization design and on-site management data. The activity level data for the transportation of building materials are mainly the energy consumption of the transportation process. Information on the amount of building materials transported, distance, transportation mode, transportation tools, etc., comes from the entry and exit records of the construction company and the relevant information provided by the material supplier. If data collection is difficult, experience values and relevant standards in the area where the building is located can be used for estimation.
A functional unit is a quantified description of the performance of a product system, which can standardize the inputs and outputs of the product system, making the results comparable. In order to compare the carbon emissions of different construction projects horizontally, this paper introduces the concept of “carbon concentration” [33], which refers to the ratio of the total carbon emissions of a building to its area, that is, the carbon emissions per unit area of the building, with the unit of kgCO2/m2.

3. Case Study

3.1. Carbon Emission Patterns in the Residential Building Materialization Stage

3.1.1. Basic Information of Residential Buildings

This article collected a total of 15 residential buildings, all located in Xi’an, Shaanxi Province, as part of the same project. The structural form of all buildings is a frame-shear structure, with a seismic fortification intensity of 8 degrees. The construction period of these 15 residential buildings ranges from April 2016 to December 2020. The inventory data on these residential buildings were provided by Shaanxi Provincial Construction Engineering Company and estate developers. Details on the number of floors and building area can be found in Table 1.
Among the 15 residential buildings collected, the number of floors ranges from 14 to 34, all of which belong to high-rise residential buildings. The building areas range from 10,489.48 m2 to 49,157.09 m2, with a total construction area of 380,185.93 m2.

3.1.2. Measurement and Analysis of Carbon Emission

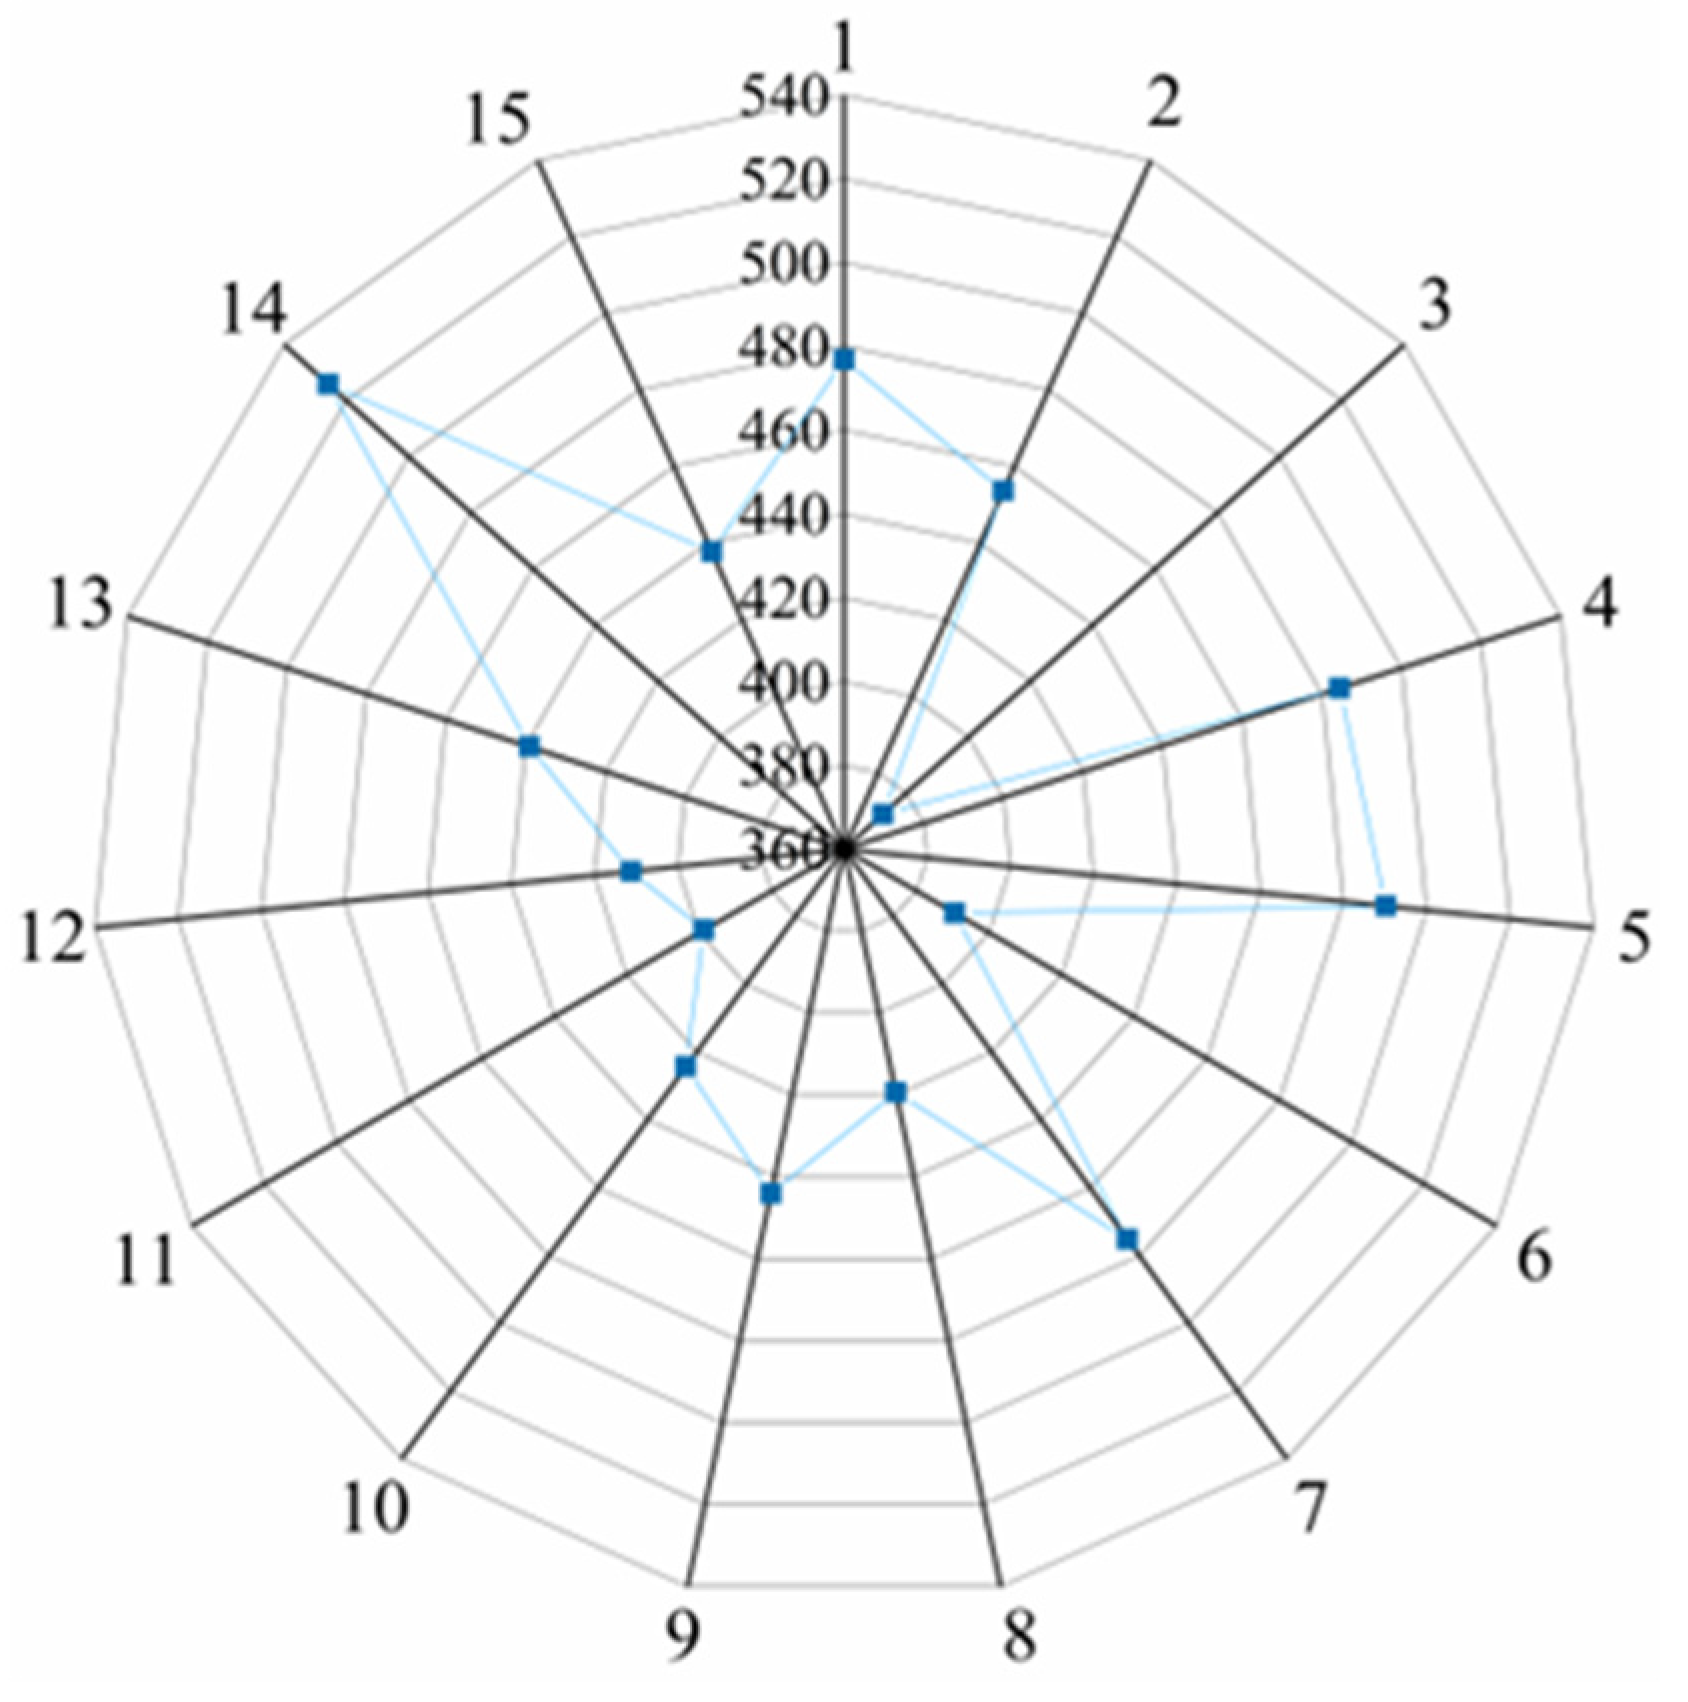
By calculating the consumption of materials, machinery, and the transportation process of 15 residential buildings, the carbon emissions of 15 residential buildings in the material production, construction, and material transportation stages were obtained, and the carbon concentration of each stage was further calculated, as shown in Table 2 and Figure 2.
According to Figure 2 and Figure 3, the carbon concentration range of the residential building materialization stage is 372.43 kgCO2/m2 to 525.88 kgCO2/m2, with an average carbon concentration of 442.91 kgCO2/m2. The average carbon concentration of the building material production stage is 417.53 kgCO2/m2, accounting for 94.27% of the entire materialization stage. The average carbon concentration of the construction stage is 16.75 kgCO2/m2, accounting for 3.78%, and the average carbon concentration of the building material transportation stage is 8.63 kgCO2/m2, accounting for 1.95%.
The average carbon concentration was analyzed by SPSS, and the confidence intervals of the mean carbon concentration in each sub-stage were obtained. As shown in Table 3, it can be seen that the upper and lower limits of the confidence interval of the mean carbon concentration in each stage have a small difference.

3.1.3. Construction Indicators and Carbon Emissions

Number of Building Layers and Carbon Concentration

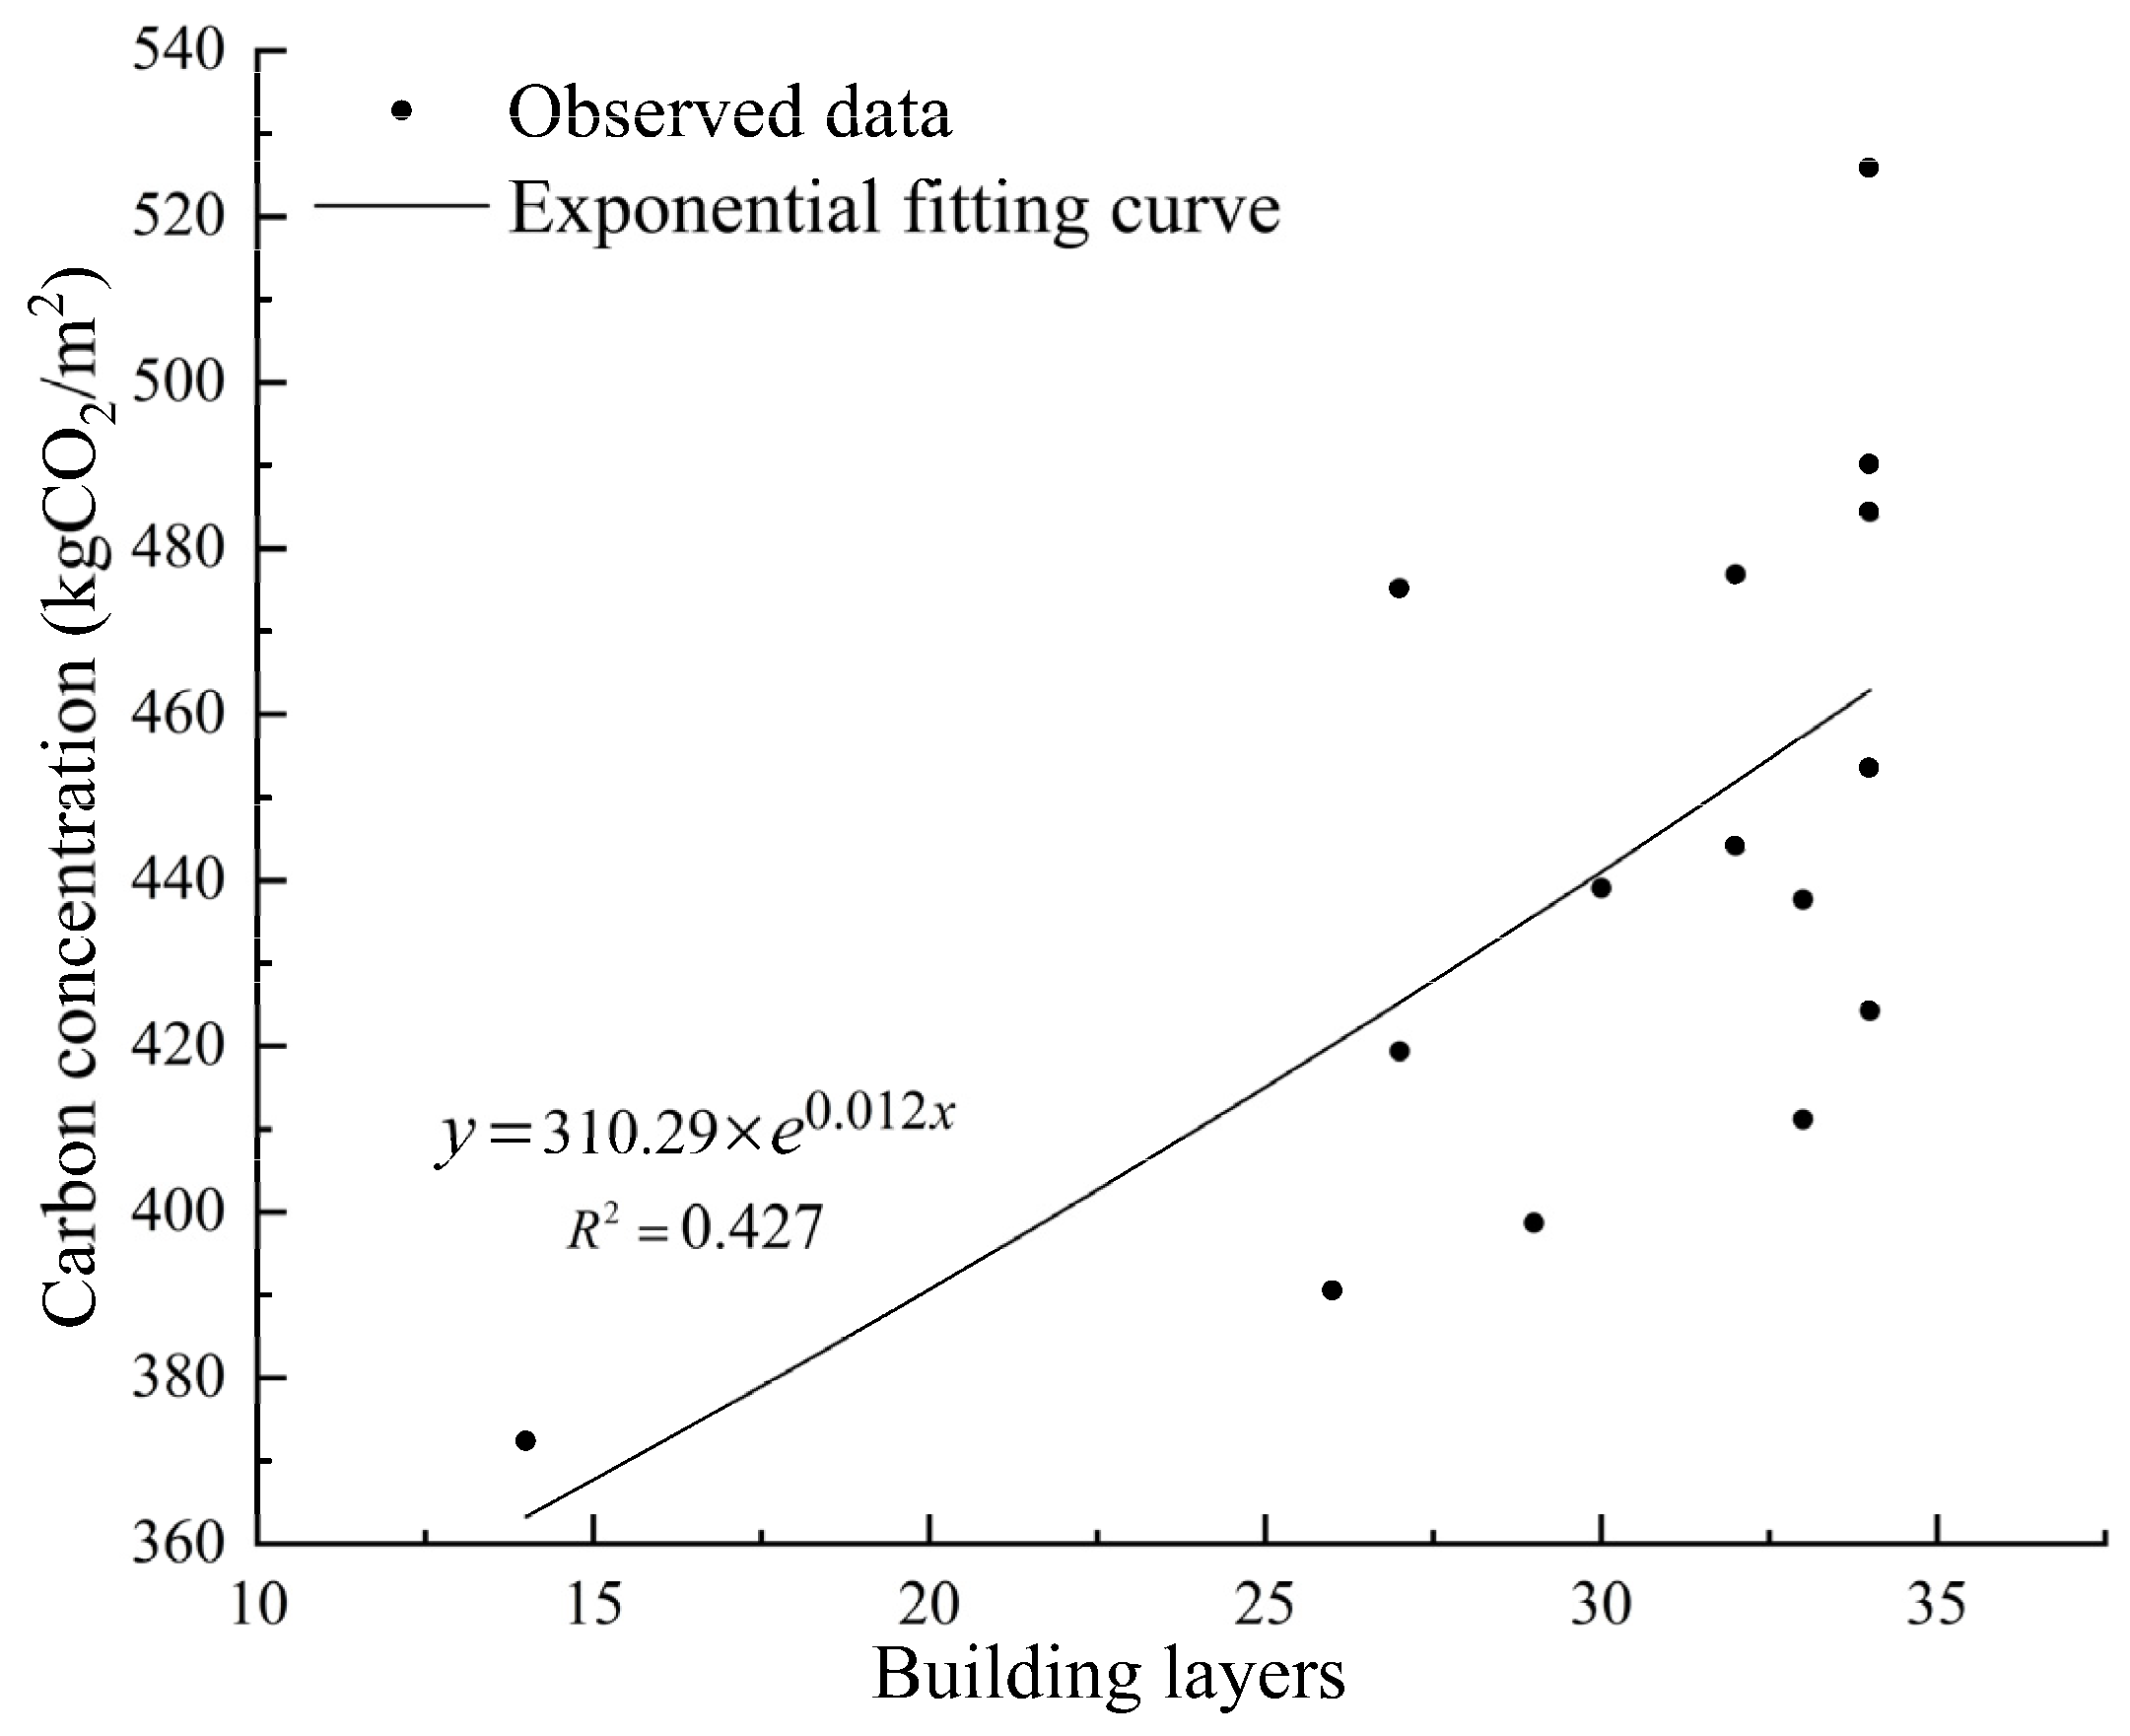
To explore the relationship between the number of building layers and carbon concentration in the materialization stage, a scatter plot was generated using the observed data, as shown in Figure 4. It can be found that there is a high level of variability in carbon concentration with respect to building layers, and the correlation between the two is not strong. In order to further analyze the relationship between building floors and carbon concentration, a trend analysis was conducted using SPSS. The exponential function provided the best fit for building floors and carbon concentration with an R2 of 0.427 and a significance level of 0.008. The constant and building floors were found to be significant at a level of 0.000 and 0.008, respectively. The expression for carbon concentration during the materialization stage is given by the following: carbon concentration = 310.29 × exp (0.012 × building layers).
Although the exponential function provided a relatively good fit, the accuracy of the model is still not high enough, and the correlation between building floors and carbon concentration during the materialization stage is not strong. It should be noted that the buildings analyzed in this study have different floor plans, and the relationship between building floors and the building area is not proportional. For example, buildings 4 and 5 both have 34 floors, but the difference in building area is 17,128.52 m2. Building 4 has unit sizes of 110 m2 and 120 m2, while building 5 has unit sizes of 90 m2 and 100 m2, resulting in a high degree of variability and a weak correlation between the two variables.

Building Area and Carbon Emission

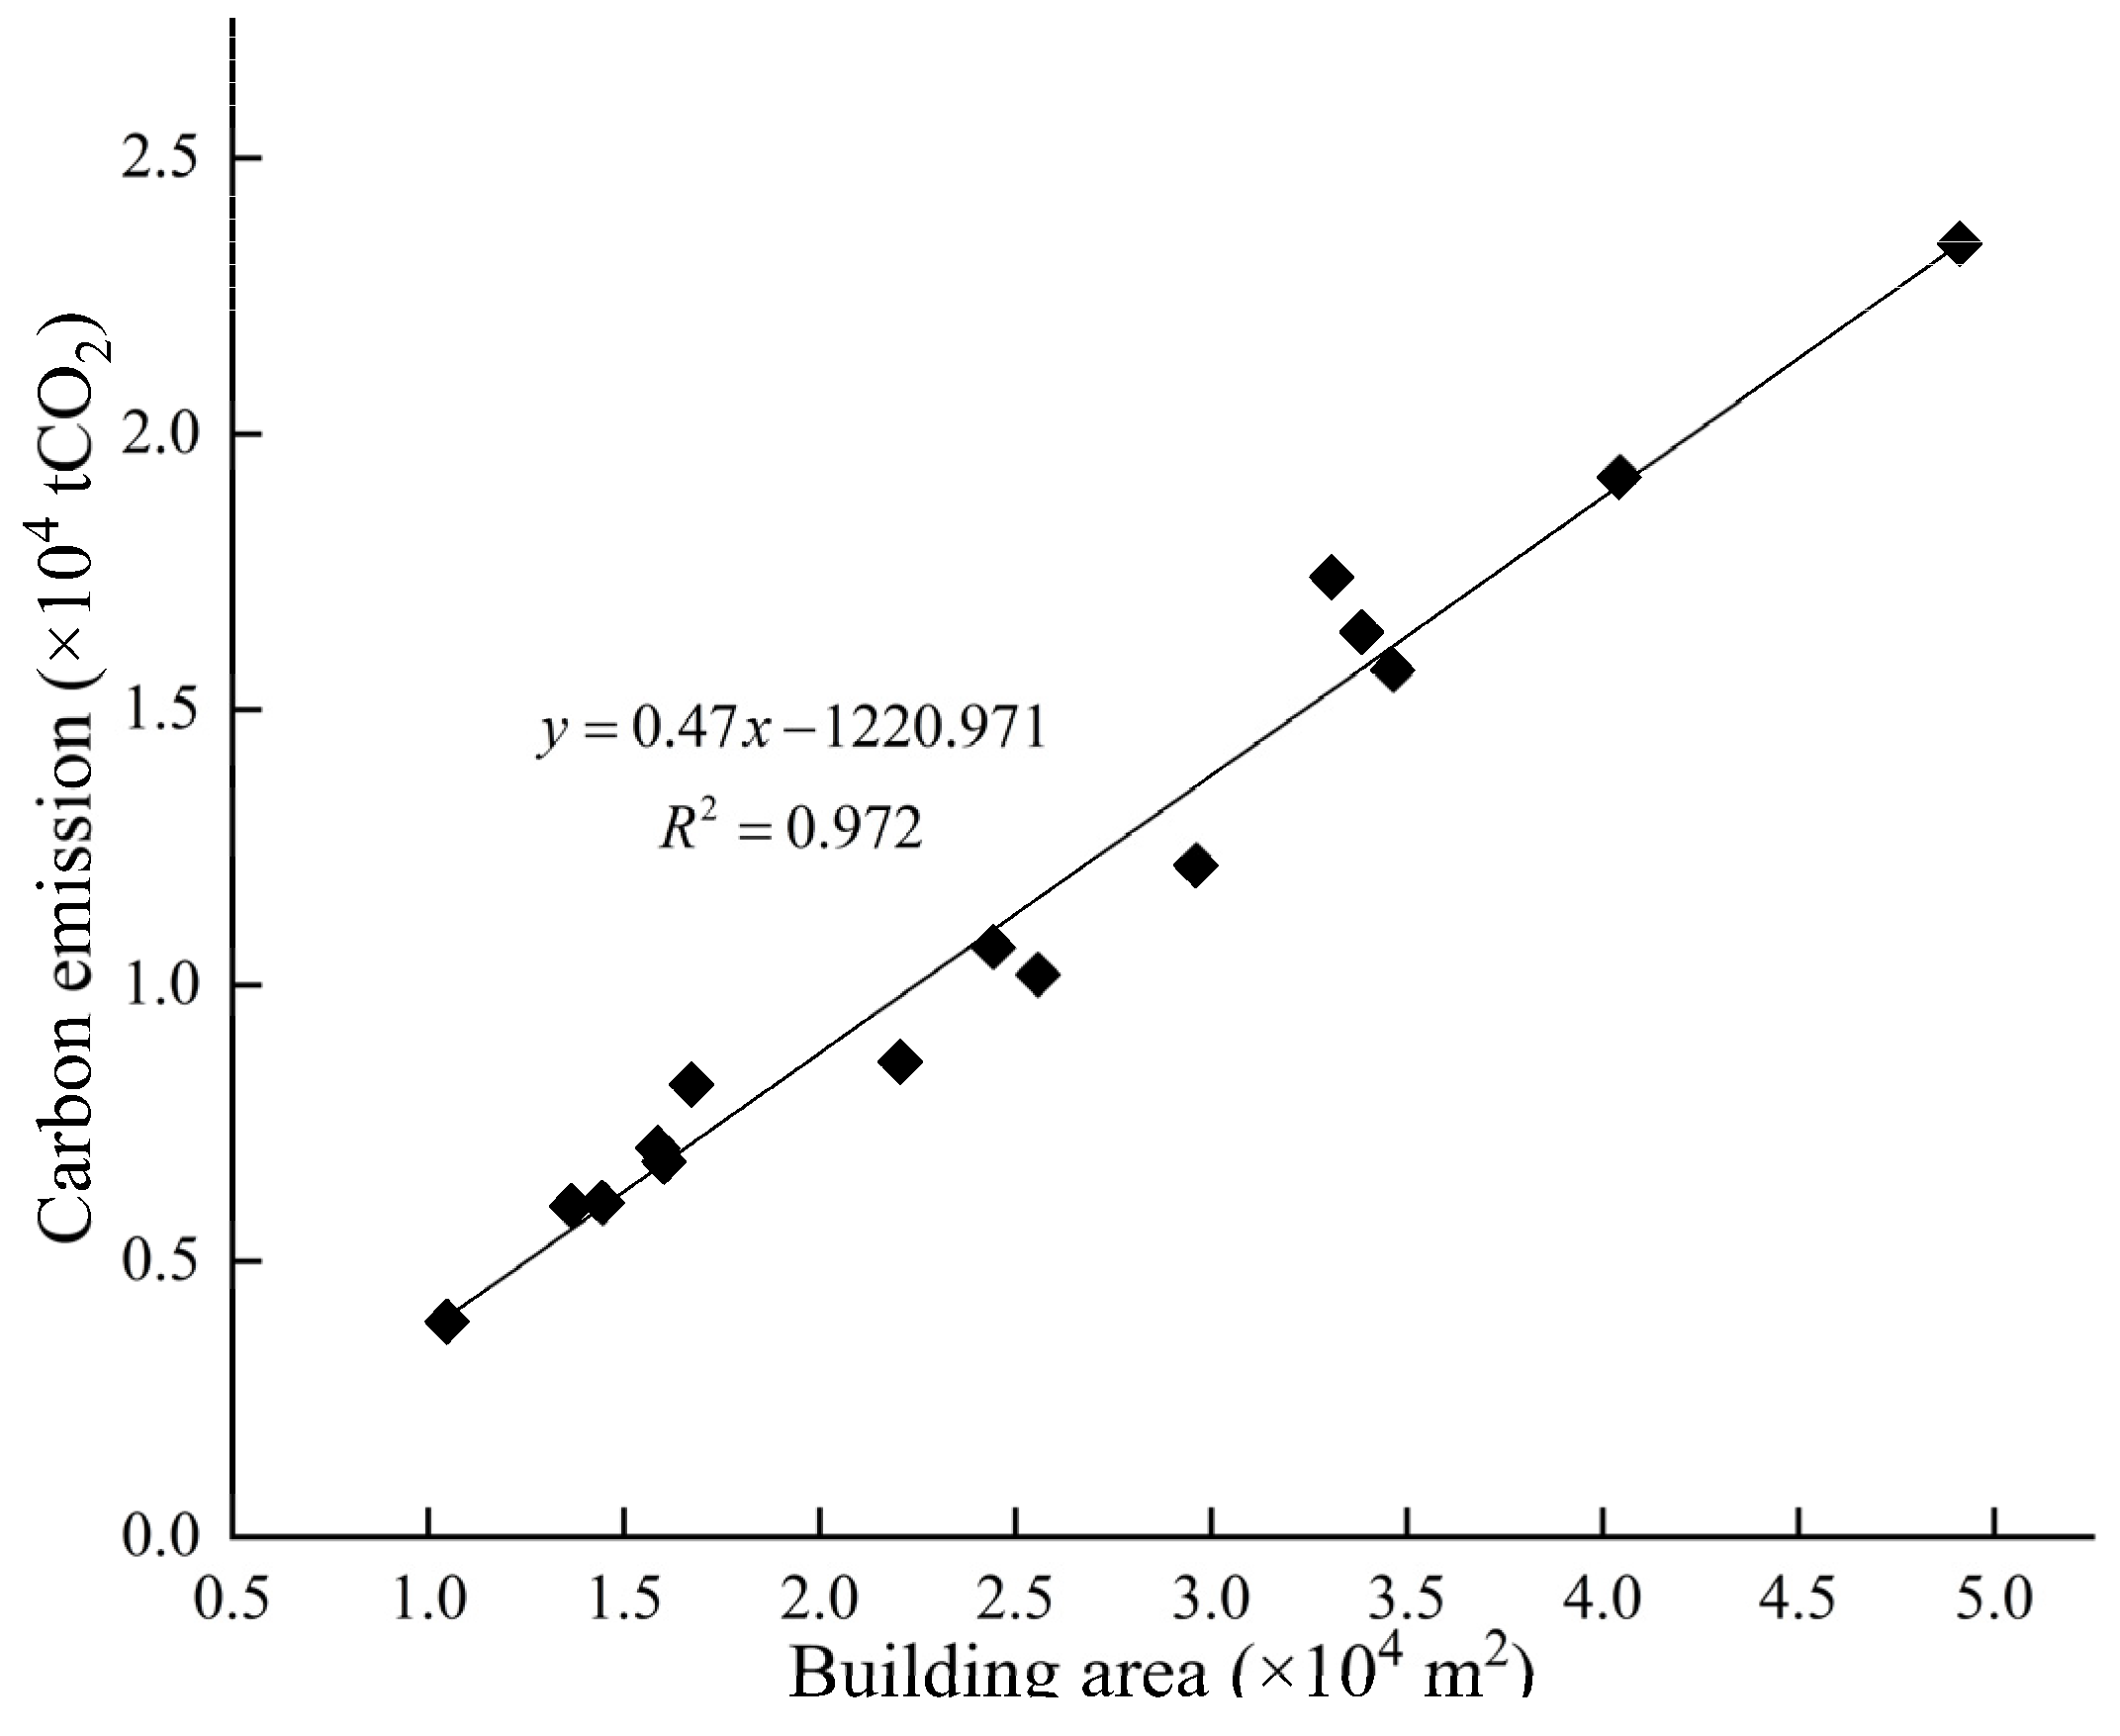
The scatter plot in Figure 5 illustrates a significant correlation between building area and carbon emissions during the materialization phase. The linear regression analysis using one variable resulted in an R2 of 0.972, indicating a strong relationship and good fit. The expression can be described as follows: carbon emissions = 0.474 × building area—1220.971.

Carbon Concentration in Building Material Production Stage

The carbon concentration of the building material production stage accounts for 94.27% of the whole residential building materialization stage, which is the key stage to study the carbon emission of the residential building materialization stage. Table 4 shows the carbon concentration of building materials in 15 residential buildings, which is the main content of carbon concentration in the building material production stage.
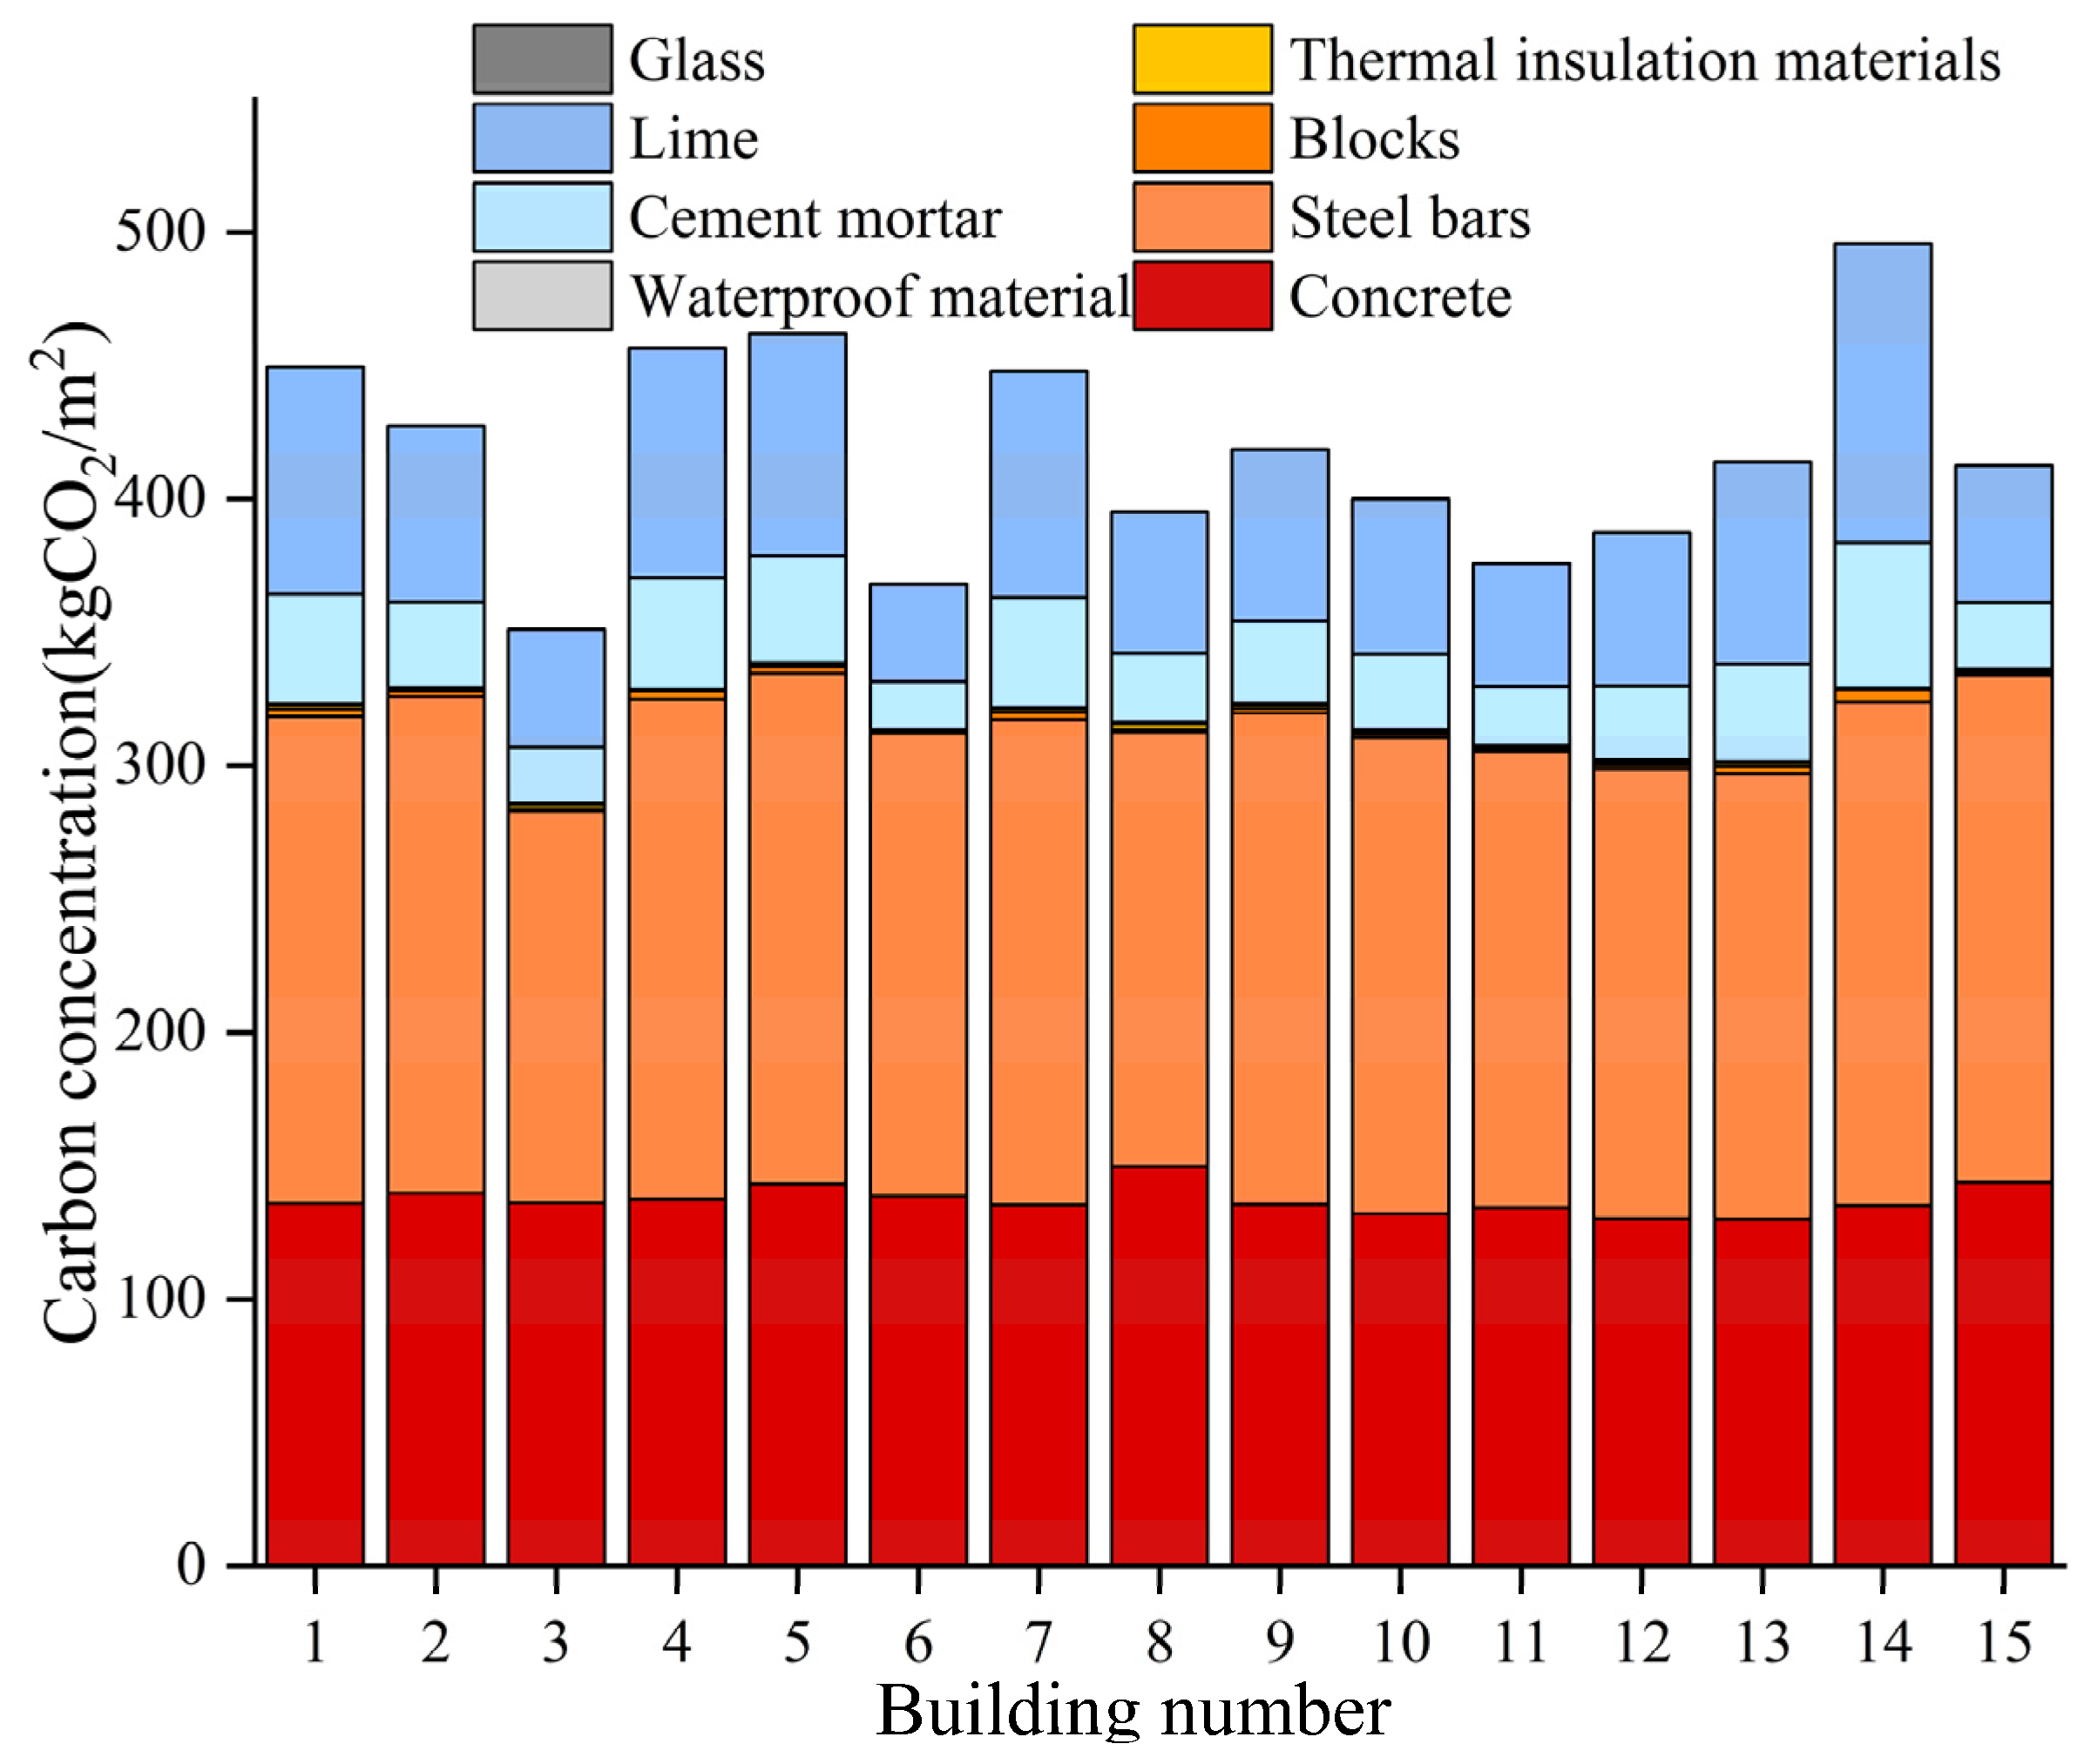
Figure 6 shows the carbon concentrations of various building materials. It can be seen that steel bars, concrete, lime, and cement mortar have higher carbon concentrations and can be the focus of carbon reduction research. The average carbon concentrations of steel bars and concrete are 177.37 kgCO2/m2 and 137.21 kgCO2/m2, respectively, accounting for 42.48% and 32.86% of the total average carbon concentration of building materials. They contribute the most to carbon emissions during the production phase of building materials. The average carbon concentrations of blocks, waterproof materials, insulation materials, and glass are all below 3 kgCO2/m2, with the average carbon concentration of glass being the smallest, at only 0.01 kgCO2/m2.

4. Discussion

The key to reducing carbon emissions in the residential building materialization stage is to analyze the main factors impacting carbon emissions, and develop corresponding decarbonization strategies.

4.1. Major Influencing Factors

In the previous research, the production stage of building materials is the highest carbon emission stage in the whole materialization stage, reaching about 94%. Among them, the carbon concentration of concrete, steel, cement mortar, and lime accounts for about 97% of the total material carbon concentration. The main energy consumption on construction sites is fossil energy, such as gasoline, diesel, and electricity [10].
During the construction process, the normal operation of some large construction machinery, temporary office spaces, and the daily lives of construction personnel all require a large amount of fossil fuel and electricity consumption, particularly the energy consumption of lifting machinery, metal processing machinery, and concrete machinery [34].
The carbon emissions from building material transportation are mainly determined by factors such as the type and quality of transported materials, transportation distance, transportation mode, and transportation equipment. Therefore, choosing different transportation machinery, transportation modes, and transportation distances will have a significant impact on carbon emissions during the building material transportation stage [35].
On construction sites, the carbon sequestration capacity of the original land vegetation is changed due to construction [36], resulting in an increase in carbon emissions from building production. The rational layout of traffic roads on-site will directly affect the carbon emissions generated by building material transportation and construction machinery, and the use of existing buildings will also affect carbon emissions during the construction process.
Different construction processes will result in different carbon emissions. For example, on-site prepared concrete will produce more carbon emissions than factory-prefabricated concrete [37]. The choice of prefabricated components, dust control measures, and excavation methods will all affect the carbon emissions during the building materialization stage.

4.2. Carbon Reduction Strategy and Sensitivity Analysis

In this section, based on the literature [38] and standard specifications, decarbonization strategies for each stage of residential building materialization are proposed. The case in Section 3 is used as the research object to analyze the sensitivity of decarbonization strategies and further verify the carbon reduction effect of these strategies.

4.2.1. Sensitivity Analysis Method

Sensitivity analysis [39] refers to using quantitative analysis to measure the degree of influence of key indicators by changing the parameters within a system. Sensitivity analysis can identify the factors that have the greatest and most sensitive impact on the system, providing quantitative data support for system optimization. This article uses sensitivity coefficients to measure the contribution of decarbonization strategies, with the calculation formula as follows:
λ i = C 1 C 0 ÷ C 0 × 100 %
where λ i is the sensitivity coefficient of the i-th carbon reduction strategy; C 1 refers to the carbon concentration using the i-th carbon reduction strategy; C 0 denotes the carbon concentration in the residential building materialization stage.
The larger the | λ i | is, the higher the sensitivity of the i-th carbon reduction strategy is, and the more vulnerable the carbon concentration of residential buildings is to this strategy.

4.2.2. Sensitivity Analysis at Different Stages

In order to obtain sensitivity coefficients for the three sub-stages, three scenarios were set. Scenario 1 involved an increase in carbon concentration during the material production stage by 20%, while the carbon concentration during the other stages remained unchanged. Scenario 2 involved an increase in carbon concentration during the construction stage by 20%, while the carbon concentration during the other stages remained unchanged. Scenario 3 involved an increase in carbon concentration during the material transportation stage by 20%, while the carbon concentration during the other stages remained unchanged. By calculation, the carbon concentration C1 and sensitivity coefficients for the three scenarios were obtained, as shown in Table 5.
The table above shows that the sensitivity coefficient rankings for different stages are as follows: Scenario 1 > Scenario 2 > Scenario 3. This indicates that the stage with the greatest impact on carbon concentration during the residential building materialization process is the building material production stage, followed by the construction stage, and finally, the building material transportation stage.

4.2.3. Carbon Reduction Strategy and Strategy Sensitivity

Material Production Stage

Use green building materials. Green building materials are those that have a smaller environmental impact, lower energy consumption, and lower carbon emissions. Examples include eco-cement, high-impact PVC pipes, recycled aggregate concrete, cement products, and “wood-like” composite materials made from industrial waste and agricultural straw. There are many types of green building materials, but for the purposes of this discussion, we will focus on recycled aggregate concrete and eco-cement. Studies have shown that using recycled aggregate concrete instead of conventional concrete can save up to two-thirds of the amount of concrete used [40]. Eco-cement, when compared to traditional cement, reduces energy consumption during production by 40% and carbon emissions by 25%. Assuming that the case building uses recycled aggregate concrete and eco-cement, it could reduce carbon emissions by 93.96 kgCO2/m2, with a sensitivity coefficient of 21.17%.
Improve the recycling rate of building materials. During construction, reusable building materials should be maximized to avoid excessive waste. There are many types of reusable building materials, such as steel, wood, doors, windows, and concrete. Metals, such as steel, have particularly high recycling rates. For example, the carbon emission factor for newly produced steel is about six times that of recycled steel. The reuse rate of common building materials [41] is shown in Table 6. Steel accounts for 41.62% of the carbon emissions from all building materials, and its recycling rate is as high as 95%. The carbon emission factor for virgin steel is 2701 kgCO2/t, while the carbon emission factor for steel produced using electric arc furnaces is 393.10 kgCO2/t, a reduction of approximately 85.45%. Assuming that the case building uses recycled steel, it could reduce carbon emissions by 148.39 kgCO2/m2, with a sensitivity coefficient of 33.44%.
Use high-performance building materials. High-performance building materials offer advantages such as high durability and strength. Compared to general building materials, they require fewer resources to achieve the same performance requirements, have higher efficiency, and can effectively reduce carbon emissions during the building materialization process. Examples include high-performance cement concrete and high-strength reinforcement bars. Taking high-strength reinforcement bars and high-strength concrete as examples, both require less material consumption to meet building design requirements. According to Shuai’s research [42], using HRB400 reinforcement bars can save 10–14% of steel compared to HRB335 reinforcement bars, and using C50 concrete can save 18.61% of concrete compared to C30 concrete. Therefore, assuming that the case study residential building adopts HRB400 reinforcement bars and C50 concrete, carbon emissions can be reduced by 50.21 kgCO2/m2 with a sensitivity coefficient of 11.32%.

Construction Stage

Adopt green construction technology. Green construction refers to construction activities that maximize resource conservation and minimize negative impacts on the environment through scientific management and technology, while ensuring engineering quality and safety, achieving “Energy saving, land saving, water saving, material saving and environmental protection” [43]. Examples include dry construction methods, the use of prefabricated components, and the promotion of prefabricated construction. Prefabricated construction is a new trend in the construction industry that is more environmentally friendly and has higher production efficiency than cast-in-place construction. Cao et al. [44] conducted research on a residential building with a construction area of 8964 m2 and found that prefabricated construction can reduce carbon emissions by 7.67 kgCO2/m2 compared to cast-in-place construction. Therefore, assuming the case where the residential building uses prefabricated construction, it will reduce carbon emissions by 1,173,771.78 kgCO2, with a sensitivity coefficient of 1.73%. Shen [45] proposed that using green construction technology can reduce the comprehensive environmental burden by about 22%. Assuming the case building uses green construction technology during the construction process, it will reduce carbon emissions by 8.67 kgCO2/m2, with a sensitivity coefficient of 1.95%.
Increase the green area. Vegetation can absorb CO2 from the atmosphere and reduce the carbon sink caused by land use. Increasing the green area of the construction site not only reduces carbon emissions but also improves the ecological environment. Assuming the green space ratio of the case building is 30%, and the vegetation types include deciduous trees, dense shrubs, and tall grasslands, with planting areas accounting for 40%, 35%, and 25% of the green area, respectively, and the construction period is three years, as shown in Table 7, it will reduce carbon emissions by a total of 10.88 kgCO2/m2, with a sensitivity coefficient of 2.45%.

Material Transportation Stage

Utilize locally sourced building materials. Employing building materials that are locally processed greatly reduces the transportation distance [46], lowers the energy consumption during transportation, and therefore reduces the carbon emissions during the transportation phase. Taking the example of the case building, the transportation distance of all materials was reduced by 10 km, resulting in a reduction of 2.24 kgCO2/m2 in carbon emissions during the building material transportation phase, that is, a reduction of 2.24 kgCO2/m2 in carbon emissions during the entire materialization stage with a sensitivity coefficient of 0.50%.
Choose appropriate transportation machinery. When selecting transportation machinery, it is preferable to choose machinery with a large carrying capacity, light weight, low energy consumption, and low carbon emissions. For example, for short-distance transportation within the city, lightweight trucks should be used, while for long-distance transportation outside the city, heavy-duty trucks should be chosen, which have a large carrying capacity, high transportation efficiency, and a small carbon emission factor. In special circumstances, specialized trucks can be used, or they can be used in combination according to the needs. Using the example of the case building, lightweight trucks should be used for transportation distances within 30 km, and heavy-duty diesel trucks should be used for transportation distances greater than 30 km, resulting in a reduction of 0.05 kgCO2/m2 in carbon emissions during the materialization stage with a sensitivity coefficient of 0.01%.

4.2.4. Summary of Carbon Reduction Strategy

The carbon reduction strategies for the three sub-stages, along with their corresponding carbon reduction amounts and sensitivity coefficients, are summarized in Table 8 based on the above analysis.
The table shows that the sensitivity coefficients for different carbon reduction strategies vary greatly. Specifically, the sensitivity coefficients for carbon reduction strategies in the building material production stage are all greater than 10%, those in the building construction stage are greater than 1%, and those in the building material transportation stage are less than 1%.

5. Conclusions

To achieve the sustainable development of the construction industry, this study used the carbon emission factor method to establish a total model and sub-models for the carbon emissions during the materialization stage of buildings. Taking 15 residential buildings in Shaanxi Province as an example, the carbon emissions during the materialization stage were calculated and analyzed, and the effects of the building layer, area, and building materials on the carbon emissions were statistically analyzed. Finally, an analysis of the influencing factors of carbon emissions during the materialization stage of residential buildings was conducted to derive carbon reduction strategies, and a sensitivity analysis was performed on the carbon reduction strategies for each stage of materialization to evaluate their importance. The main conclusions of this study are as follows:
(1)
The range of carbon concentration during the materialization stage of the 15 residential buildings is between 372.43 kgCO2/m2 and 525.88 kgCO2/m2, with an average concentration of 442.91 kgCO2/m2. The relationship between the building layer and carbon concentration during the materialization stage is weak, and the degree of dispersion is large. The area of a building is linearly related to the carbon emissions during the materialization stage, and the expression for this relationship is the carbon emissions = 0.474 × building area—1220.971. The carbon concentration during the production stage of building materials accounts for 94.27% of the total carbon concentration, with the highest carbon concentrations found in steel bars and concrete, which account for 42.48% and 32.86% of the total carbon concentration of building materials, respectively;
(2)
The sensitivity coefficients of carbon reduction strategies for different stages differ significantly. The sensitivity coefficients for carbon reduction strategies during the production stage of building materials are all greater than 10%, while those for carbon reduction strategies during the construction stage of buildings are greater than 1%, and those for carbon reduction strategies during the transportation stage of building materials are less than 1%;
(3)
The stage of building residential buildings with the highest sensitivity to carbon reduction strategies is the production of building materials, followed by the construction stage, while the transportation stage has the lowest sensitivity. In order to effectively reduce the carbon emissions of residential buildings throughout the materialization stage, it is necessary to focus on carbon reduction strategies such as improving the recycling rate of building materials, using green building materials, using high-performance building materials, and increasing green areas. The absolute position of the carbon emissions of building materials in the materialization stage suggests that potential carbon reduction measures are likely to be related to materials, which is consistent with the current popular research direction.
The carbon emission accounting framework proposed in this study for the materialization stage of buildings can provide theoretical references for quantifying carbon emissions and actual applications, serving as a carbon reduction basis for decision makers and designers. However, this article still has some limitations: in order to make carbon emissions regression relatively reliable, this study only focused on one type of framework structure, and considering that the carbon emissions of buildings in different regions differ, in future research, the sample size and research level can be increased, such as expanding the study to different structural types and different climate zones of buildings to supplement existing conclusions and improve the generalizability of research results. In addition, the carbon reduction strategies discussed in this study did not consider the costs associated with strategy changes. In reality, stakeholders are more concerned with the best choice after balancing environmental, cost, and other objectives. Therefore, future carbon reduction strategy analyses can consider developing a comprehensive evaluation index that takes into account multiple objectives to adapt to the direction of action in the real world.

Author Contributions

Conceptualization, S.C. and X.Z.; methodology, H.Z.; software, X.Z.; validation, X.Z. and H.Z.; data curation, H.Z.; writing—original draft preparation, X.Z.; writing—review and editing, X.Z. and S.C.; visualization, X.Z.; supervision, S.C.; project administration, S.C. funding acquisition, S.C. All authors have read and agreed to the published version of the manuscript.

Funding

This research was funded by the National Natural Science Foundation of the China Youth Program (No. 42107183).

Institutional Review Board Statement

Not applicable.

Informed Consent Statement

Not applicable.

Data Availability Statement

Not applicable.

Conflicts of Interest

The authors declare no conflict of interest.

References

  1. Zhang, Y.; Jiang, X.; Cui, C.; Skitmore, M. BIM-Based Approach for the Integrated Assessment of Life Cycle Carbon Emission Intensity and Life Cycle Costs. Build. Environ. 2022, 226, 109691. [Google Scholar] [CrossRef]
  2. You, K.; Ren, H.; Cai, W.; Huang, R.; Li, Y. Modeling Carbon Emission Trend in China’s Building Sector to Year 2060. Resour. Conserv. Recycl. 2023, 188, 106679. [Google Scholar] [CrossRef]
  3. Cai, W.; Wu, Y.; Ni, J. 2022 China Building Energy Consumption and Carbon Emissions Research Report; Professional Committee of Building Energy and Emissions: Chongqing, China, 2022. [Google Scholar]
  4. Zhang, X.; Wang, F. Life-Cycle Assessment and Control Measures for Carbon Emissions of Typical Buildings in China. Build. Environ. 2015, 86, 89–97. [Google Scholar] [CrossRef]
  5. Zhu, C.; Li, X.; Zhu, W.; Gong, W. Embodied Carbon Emissions and Mitigation Potential in China’s Building Sector: An Outlook to 2060. Energy Policy 2022, 170, 113222. [Google Scholar] [CrossRef]
  6. Wu, Y.; Xu, B. When Will China’s Carbon Emissions Peak? Evidence from Judgment Criteria and Emissions Reduction Paths. Energy Rep. 2022, 8, 8722–8735. [Google Scholar] [CrossRef]
  7. Trinh, H.T.M.K.; Chowdhury, S.; Nguyen, M.T.; Liu, T. Optimising Flat Plate Buildings Based on Carbon Footprint Using Branch-and-Reduce Deterministic Algorithm. J. Clean. Prod. 2021, 320, 128780. [Google Scholar] [CrossRef]
  8. Gustavsson, L.; Joelsson, A.; Sathre, R. Life Cycle Primary Energy Use and Carbon Emission of an Eight-Storey Wood-Framed Apartment Building. Energy Build. 2010, 42, 230–242. [Google Scholar] [CrossRef]
  9. Luo, X.; Ren, M.; Zhao, J.; Wang, Z.; Ge, J.; Gao, W. Life Cycle Assessment for Carbon Emission Impact Analysis for the Renovation of Old Residential Areas. J. Clean. Prod. 2022, 367, 132930. [Google Scholar] [CrossRef]
  10. Li, X.; Xie, W.; Xu, L.; Li, L.; Jim, C.Y.; Wei, T. Holistic Life-Cycle Accounting of Carbon Emissions of Prefabricated Buildings Using LCA and BIM. Energy Build. 2022, 266, 112136. [Google Scholar] [CrossRef]
  11. Cabeza, L.F.; Boquera, L.; Chàfer, M.; Vérez, D. Embodied Energy and Embodied Carbon of Structural Building Materials: Worldwide Progress and Barriers through Literature Map Analysis. Energy Build. 2021, 231, 110612. [Google Scholar] [CrossRef]
  12. Li, X.; Yang, F.; Zhu, Y.; Gao, Y. An Assessment Framework for Analyzing the Embodied Carbon Impacts of Residential Buildings in China. Energy Build. 2014, 85, 400–409. [Google Scholar] [CrossRef]
  13. Luo, Z.; Yang, L.; Liu, J. Embodied Carbon Emissions of Office Building: A Case Study of China’s 78 Office Buildings. Build. Environ. 2016, 95, 365–371. [Google Scholar] [CrossRef] [Green Version]
  14. Zhang, X.; Wang, F. Assessment of Embodied Carbon Emissions for Building Construction in China: Comparative Case Studies Using Alternative Methods. Energy Build. 2016, 130, 330–340. [Google Scholar] [CrossRef]
  15. Proietti, S.; Desideri, U.; Sdringola, P.; Zepparelli, F. Carbon Footprint of a Reflective Foil and Comparison with Other Solutions for Thermal Insulation in Building Envelope. Appl. Energy 2013, 112, 843–855. [Google Scholar] [CrossRef]
  16. Gerilla, G.P.; Teknomo, K.; Hokao, K. An Environmental Assessment of Wood and Steel Reinforced Concrete Housing Construction. Build. Environ. 2007, 42, 2778–2784. [Google Scholar] [CrossRef]
  17. Li, X.-J.; Zheng, Y. Using LCA to Research Carbon Footprint for Precast Concrete Piles during the Building Construction Stage: A China Study. J. Clean. Prod. 2020, 245, 118754. [Google Scholar] [CrossRef]
  18. Atmaca, A.; Atmaca, N. Carbon Footprint Assessment of Residential Buildings, a Review and a Case Study in Turkey. J. Clean. Prod. 2022, 340, 130691. [Google Scholar] [CrossRef]
  19. Ma, Z.; Shen, J.; Wang, C.; Wu, H. Characterization of Sustainable Mortar Containing High-Quality Recycled Manufactured Sand Crushed from Recycled Coarse Aggregate. Cem. Concr. Compos. 2022, 132, 104629. [Google Scholar] [CrossRef]
  20. Chen, C.; Yang, Y.; Zhou, Y.; Xue, C.; Chen, X.; Wu, H.; Sui, L.; Li, X. Comparative Analysis of Natural Fiber Reinforced Polymer and Carbon Fiber Reinforced Polymer in Strengthening of Reinforced Concrete Beams. J. Clean. Prod. 2020, 263, 121572. [Google Scholar] [CrossRef]
  21. Ni, S.; Liu, H.; Li, Q.; Quan, H.; Gheibi, M.; Fathollahi-Fard, A.M.; Tian, G. Assessment of the Engineering Properties, Carbon Dioxide Emission and Economic of Biomass Recycled Aggregate Concrete: A Novel Approach for Building Green Concretes. J. Clean. Prod. 2022, 365, 132780. [Google Scholar] [CrossRef]
  22. Guna, V.; Yadav, C.; Maithri, B.R.; Ilangovan, M.; Touchaleaume, F.; Saulnier, B.; Grohens, Y.; Reddy, N. Wool and Coir Fiber Reinforced Gypsum Ceiling Tiles with Enhanced Stability and Acoustic and Thermal Resistance. J. Build. Eng. 2021, 41, 102433. [Google Scholar] [CrossRef]
  23. Xiao, J.; Zhang, H.; Tang, Y.; Deng, Q.; Wang, D.; Poon, C. Fully Utilizing Carbonated Recycled Aggregates in Concrete: Strength, Drying Shrinkage and Carbon Emissions Analysis. J. Clean. Prod. 2022, 377, 134520. [Google Scholar] [CrossRef]
  24. Zhang, X.; Xu, J.; Zhang, X.; Li, Y. Life Cycle Carbon Emission Reduction Potential of a New Steel-Bamboo Composite Frame Structure for Residential Houses. J. Build. Eng. 2021, 39, 102295. [Google Scholar] [CrossRef]
  25. Gao, T.; Shen, L.; Shen, M.; Chen, F.; Liu, L.; Gao, L. Analysis on Differences of Carbon Dioxide Emission from Cement Production and Their Major Determinants. J. Clean. Prod. 2015, 103, 160–170. [Google Scholar] [CrossRef]
  26. Fang, Y.; Lu, X.; Li, H. A Random Forest-Based Model for the Prediction of Construction-Stage Carbon Emissions at the Early Design Stage. J. Clean. Prod. 2021, 328, 129657. [Google Scholar] [CrossRef]
  27. Zhang, X.; Wang, F. Stochastic Analysis of Embodied Emissions of Building Construction: A Comparative Case Study in China. Energy Build. 2017, 151, 574–584. [Google Scholar] [CrossRef]
  28. Chen, W.; Yang, S.; Zhang, X.; Jordan, N.D.; Huang, J. Embodied Energy and Carbon Emissions of Building Materials in China. Build. Environ. 2022, 207, 108434. [Google Scholar] [CrossRef]
  29. Onat, N.C.; Kucukvar, M.; Tatari, O. Scope-Based Carbon Footprint Analysis of U.S. Residential and Commercial Buildings: An Input–Output Hybrid Life Cycle Assessment Approach. Build. Environ. 2014, 72, 53–62. [Google Scholar] [CrossRef]
  30. Geng, Y.; Wang, Z.; Shen, L.; Zhao, J. Calculating of CO2 Emission Factors for Chinese Cement Production Based on Inorganic Carbon and Organic Carbon. J. Clean. Prod. 2019, 217, 503–509. [Google Scholar] [CrossRef]
  31. Huang, L.; Krigsvoll, G.; Johansen, F.; Liu, Y.; Zhang, X. Carbon Emission of Global Construction Sector. Renew. Sustain. Energy Rev. 2018, 81, 1906–1916. [Google Scholar] [CrossRef] [Green Version]
  32. Xu, J.; Teng, Y.; Pan, W.; Zhang, Y. BIM-Integrated LCA to Automate Embodied Carbon Assessment of Prefabricated Buildings. J. Clean. Prod. 2022, 374, 133894. [Google Scholar] [CrossRef]
  33. Shao, Y.; Li, J.; Zhou, Z.; Hu, Z.; Zhang, F.; Cui, Y.; Chen, H. The Effects of Vertical Farming on Indoor Carbon Dioxide Concentration and Fresh Air Energy Consumption in Office Buildings. Build. Environ. 2021, 195, 107766. [Google Scholar] [CrossRef]
  34. Hong, J.; Shen, G.Q.; Feng, Y.; Lau, W.S.; Mao, C. Greenhouse Gas Emissions during the Construction Phase of a Building: A Case Study in China. J. Clean. Prod. 2015, 103, 249–259. [Google Scholar] [CrossRef] [Green Version]
  35. Li, X.-J.; Lai, J.; Ma, C.; Wang, C. Using BIM to Research Carbon Footprint during the Materialization Phase of Prefabricated Concrete Buildings: A China Study. J. Clean. Prod. 2021, 279, 123454. [Google Scholar] [CrossRef]
  36. Xu, Q.; Yang, R.; Dong, Y.-X.; Liu, Y.-X.; Qiu, L.-R. The Influence of Rapid Urbanization and Land Use Changes on Terrestrial Carbon Sources/Sinks in Guangzhou, China. Ecol. Indic. 2016, 70, 304–316. [Google Scholar] [CrossRef]
  37. Dong, Y.H.; Jaillon, L.; Chu, P.; Poon, C.S. Comparing Carbon Emissions of Precast and Cast-in-Situ Construction Methods–A Case Study of High-Rise Private Building. Constr. Build. Mater. 2015, 99, 39–53. [Google Scholar] [CrossRef]
  38. Luo, Z.X. Study on Calculation Method of Building Life Cycle CO2 Emission and Emission Reduction Strategies. Ph.D. Thesis, Xi’an University of Architecture and Technology, Xi’an, China, 2016. [Google Scholar]
  39. Dong, F.; Li, J.; Zhang, S.; Wang, Y.; Sun, Z. Sensitivity Analysis and Spatial-Temporal Heterogeneity of CO2 Emission Intensity: Evidence from China. Resour. Conserv. Recycl. 2019, 150, 104398. [Google Scholar] [CrossRef]
  40. Tam, V.W.Y.; Soomro, M.; Evangelista, A.C.J. A Review of Recycled Aggregate in Concrete Applications (2000–2017). Constr. Build. Mater. 2018, 172, 272–292. [Google Scholar] [CrossRef]
  41. Li, J.L. Study on Carbon Emissions Calculation and Carbon education Strategy of Urban Residential Life Cycle in Cold Areas. Master’s Thesis, Xi’an University of Architecture and Technology, Xi’an, China, 2019. [Google Scholar]
  42. Shuai, X.G. Quantitative Research on Implicit Environmental Impact Assessment of Construction Projects. Ph.D. Thesis, Huazhong University of Science and Technology, Wuhan, China, 2009. [Google Scholar]
  43. Zhang, Y.; Kang, J.; Jin, H. A Review of Green Building Development in China from the Perspective of Energy Saving. Energies 2018, 11, 334. [Google Scholar] [CrossRef] [Green Version]
  44. Cao, X.; Miao, C.Q.; Pan, H.T. Comparative analysis and research on carbon emissions of prefabricated concrete and cast-in-place buildings based on carbon emission model. Build. Struct. 2021, 51, 1233–1237. [Google Scholar]
  45. Shen, Q.Y. Study on Green Construction Theory and Construction Environment Load Evaluation. Ph.D. Thesis, Huazhong University of Science and Technology, Wuhan, China, 2007. [Google Scholar]
  46. Wu, Z.; Jia, F. Toward a Theory of Supply Chain Fields–Understanding the Institutional Process of Supply Chain Localization. J. Oper. Manag. 2018, 58–59, 27–41. [Google Scholar] [CrossRef] [Green Version]
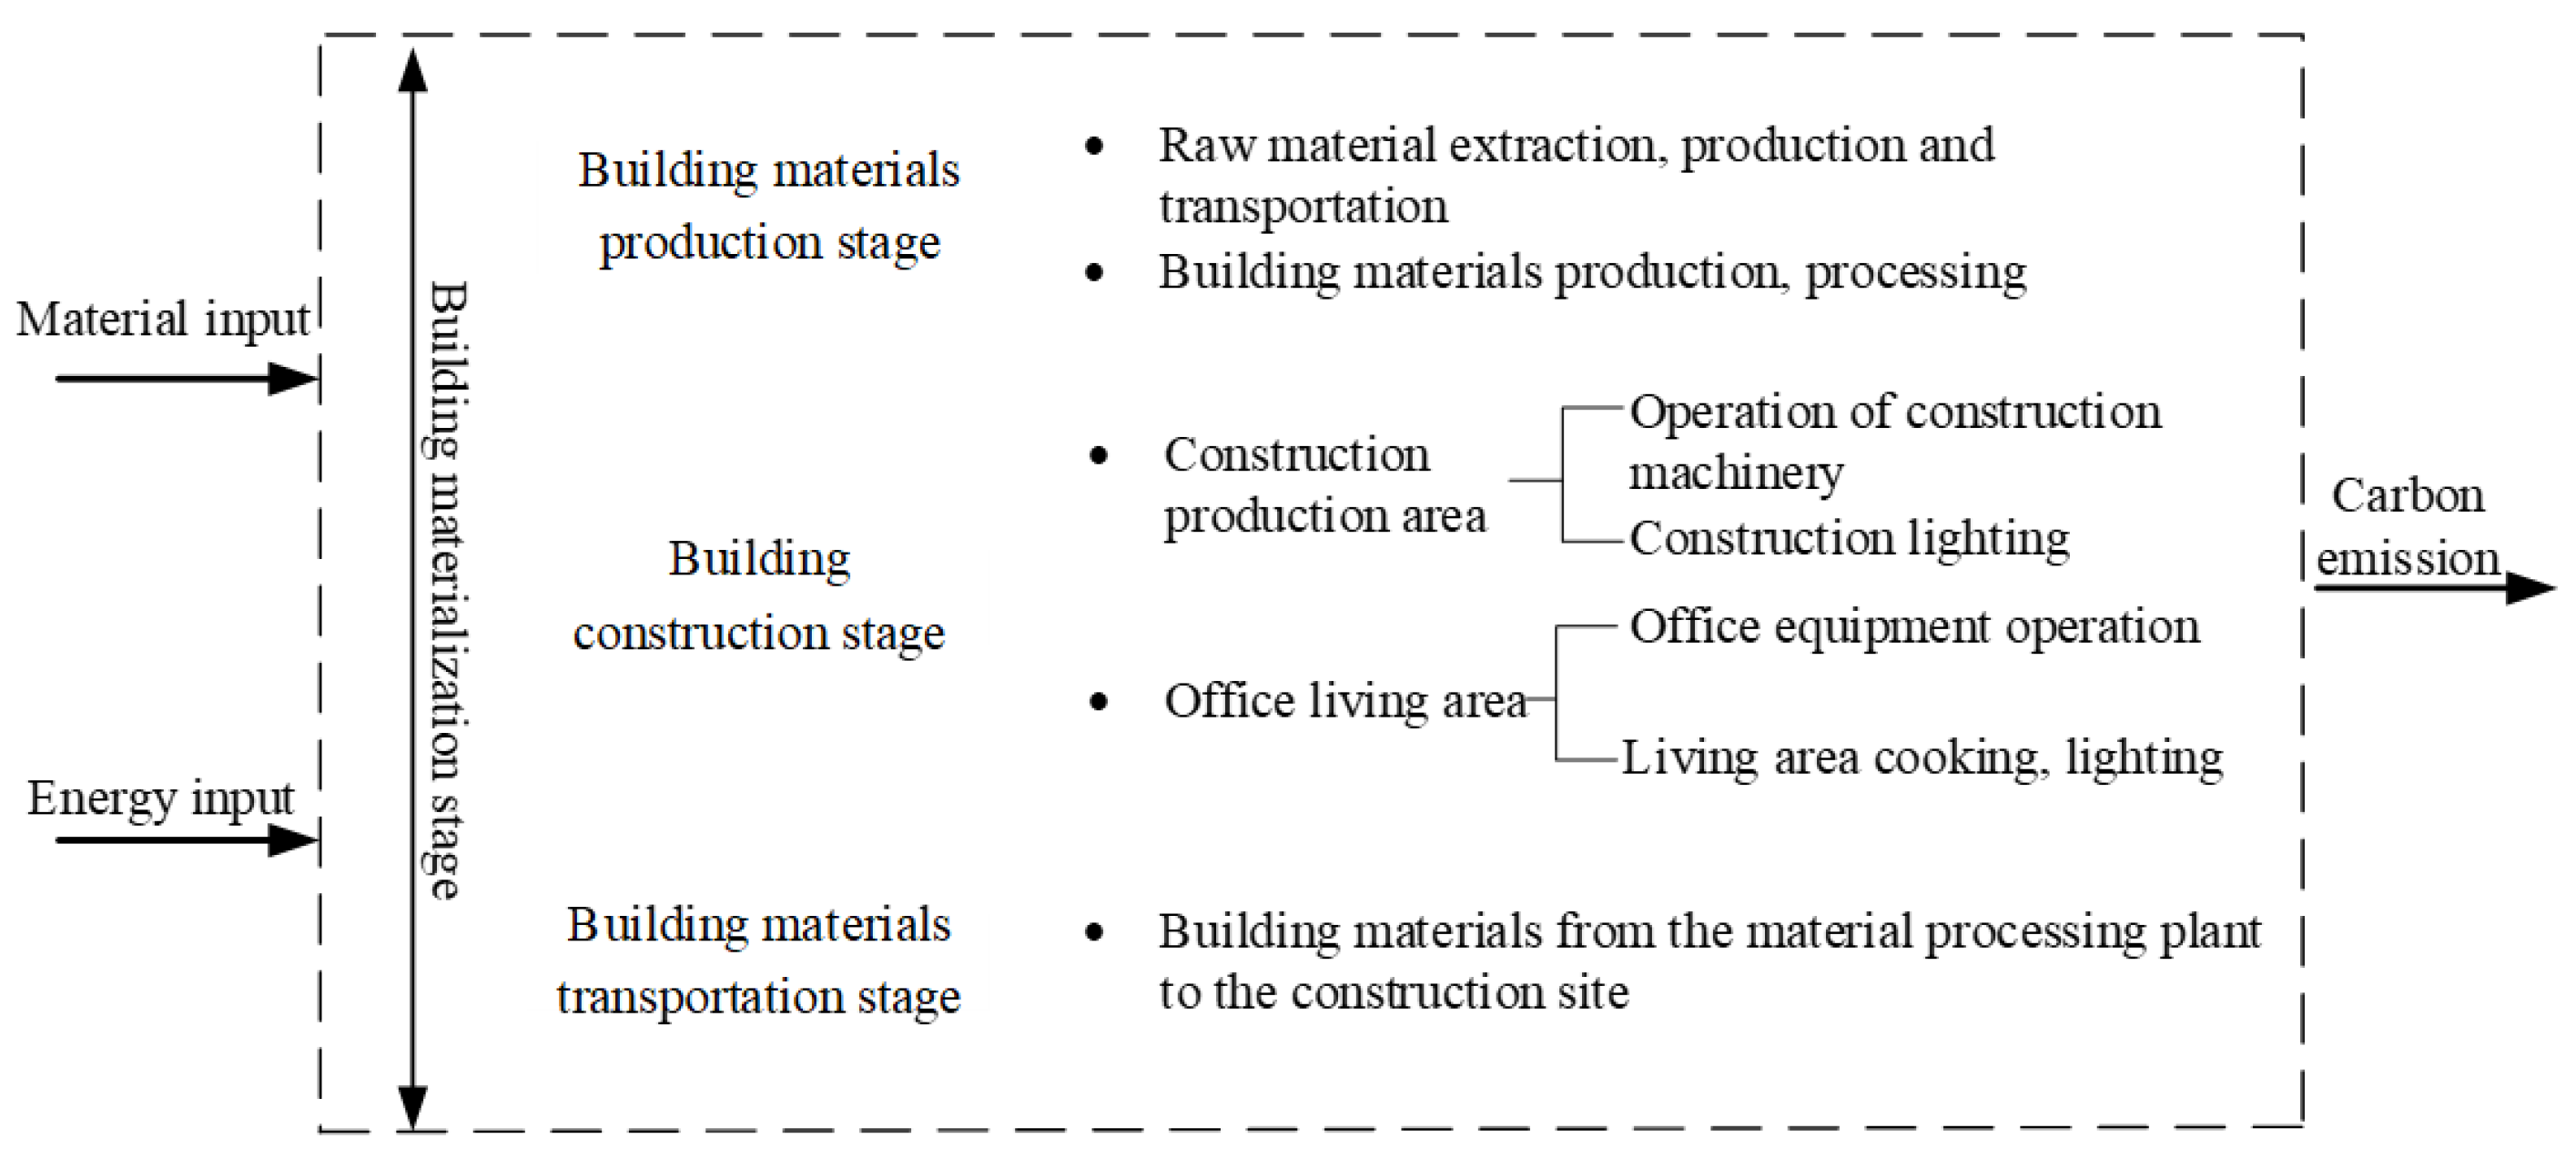
Figure 1. System boundary of building materialization stage.
Sustainability 15 05717 g001
Figure 2. Carbon concentration box diagram of building materialization stage.
Sustainability 15 05717 g002
Figure 3. Carbon concentration radar chart in materialization stage.
Sustainability 15 05717 g003
Figure 4. Trend fitting of building layers and carbon concentration.
Sustainability 15 05717 g004
Figure 5. Scatter diagram of building area and carbon emission.
Sustainability 15 05717 g005
Figure 6. Carbon concentration of each building material.
Sustainability 15 05717 g006
Table 1. Information on residential buildings.
No.StoriesArea (m2)No.StoriesArea (m2)
13249,157.0993215,879.81
23434,656.93103416,041.69
31410,489.48112925,568.47
43433,866.46123329,623.18
53416,737.94133013,663.83
62622,068.75143433,094.2
72740,448.81153324,433.97
82714,455.32
Table 2. Carbon concentration in different stages (kgCO2/m2).
No.Material Production ConstructionMaterial TransportationMaterialization
1449.5318.039.29476.86
2427.6017.158.84453.59
3351.0914.087.26372.43
4456.6818.329.44484.44
5462.0818.549.55490.17
6368.1714.777.61390.55
7447.9717.979.26475.21
8395.3715.868.17419.40
9418.7016.808.66444.15
10399.9916.048.27424.30
11375.8615.087.77398.71
12387.6315.558.01411.19
13413.9016.608.56439.06
14495.7519.8910.25525.88
15412.6116.558.53437.69
Table 3. Average carbon concentration in each stage.
StageMean ValueConfidence Interval (95%)
Material production417.53395.57–439.48
Construction16.7515.87–17.63
Material transportation8.638.18–9.09
Materialization442.91419.62–466.20
Table 4. Carbon concentration of building materials.
No.ConcreteSteel BarsBlocksThermal Insulation MaterialsWaterproof MaterialsCement MortarLimeGlass
1136.01182.402.991.420.3141.2685.110.016
2139.89186.191.921.180.3032.0366.080.010
3136.06146.930.671.710.4021.3343.990.004
4137.51187.393.050.590.3441.7286.060.016
5143.32191.242.880.850.3640.2983.110.015
6138.65173.650.420.680.3817.7636.630.002
7135.54181.772.981.420.3141.1284.820.016
8150.00162.581.191.850.7125.8053.220.006
9135.68184.031.811.330.5431.1164.180.010
10131.99178.611.461.270.4628.1458.050.008
11134.35171.160.780.950.4322.2645.920.004
12130.18168.721.441.320.4827.9157.570.008
13129.97167.272.461.410.4936.6675.630.013
14135.18188.604.840.290.3854.34112.090.026
15143.87190.061.230.970.2924.8751.310.007
Table 5. Sensitivity coefficient at different stages.
ScenariosC1 (kgCO2/m2)Sensitivity Coefficients
Scenario 1527.20 18.81%
Scenario 2447.24 0.79%
Scenario 3445.56 0.41%
Table 6. Reutilization rate of common building materials.
MaterialReutilization Rate (%)MaterialReutilization Rate (%)
Steel95Waste metal90
Aluminum75Glass80
Concrete60Wood65
Gravel60Plastics25
Doors and
windows
80PVC pipe35
Table 7. Carbon emissions from vegetation.
VegetationsAreaCarbon Emission FactorsCarbon Emission
Deciduous trees 18,364.08−13.40−738,236.02
Dense shrubs16,068.57−11.00−530,262.81
Tall grasslands11,477.55−11.50−395,975.48
Table 8. Carbon reduction strategy in residential building materialization stage.
StagesCarbon Reduction StrategiesCarbon Reduction AmountsSensitivity
Coefficient
Material
production stage
use green building materials93.9621.17
improve the recycling rate of building materials148.3933.44
use high-performance building materials50.2111.32
Construction
stage
adopt green construction technology7.671.73
increase the green area10.882.45
Material
transportation stage
utilize locally sourced building materials2.240.50
choose appropriate transportation machinery0.050.01
Disclaimer/Publisher’s Note: The statements, opinions and data contained in all publications are solely those of the individual author(s) and contributor(s) and not of MDPI and/or the editor(s). MDPI and/or the editor(s) disclaim responsibility for any injury to people or property resulting from any ideas, methods, instructions or products referred to in the content.