Abstract
One-dimensional modeling of the hydrodynamic river networks of plain urban rivers has been employed to optimize operating regulations in these river networks. However, pilot-scale experiments are still lacking for the validation of hydrodynamics obtained by modeling to improve water quality. In this study, a pilot-scale experiment combined with theoretical calculation was conducted to determine both the hydrodynamics and water quality in the Hutang area of Changzhou, China. The simulation results showed that using high-performance pumps on the border to drain the river beyond it could increase the frequency of water replenishment. The results of the pilot-scale experiment are consistent with the simulation. Moreover, only in condition (c) does the water of the Wuyi canal flow into the Wunan river. With the exception of turbidity, the highest number of rivers with improved water quality tables occurred in this condition. Based on the response mechanism between the flow rate and the water quality, a flow rate within the range of 0.12 m/s to 0.28 m/s can help reduce comprehensive pollution. This study successfully enhanced the hydrodynamic regulation and water quality of the rivers in the Hutang region using technologies combined with simulation and pilot-scale experiments.
1. Introduction
Urban rivers are strongly related to public health, and such rivers are suffering from environmental and ecological problems due to rapid urbanization [1,2]. Thus, a new framework [3] involving ecosystem integrity and non-ecological performance was proposed to solve the problem of the disconnection [4] and water quality [5,6] of the rivers in the plain urban river network. Considering the complexity of plain urban river networks, modeling the rivers is an easier method for developing better proposals to solve the problem of water system disconnection, compared to conducting full-scale experiments [7]. Due to its use in pre-treatment and post-treatment, Infoworks ICM was employed to simulate integrated catchments in 2021 and 2022 [8,9] as well as urban flood risk in 2018 and 2022 [10,11]. Ming et al. established a complete channel model to investigate the effect of rainfall on the flow process of rivers via hydrodynamic analysis [12]. Speight et al. simulated both water level and flow through a hydrodynamic model using a rain gauge as a boundary condition [13]. Although models of various cities have been successfully constructed [14,15,16], the optimized hydrodynamics of urban rivers obtained through these calculations have been not verified due to the simplified cross-sections used along each river. Such simplified cross-sections used in modeling are significantly affected by changes in complex artificial rivers in urban areas.
In contrast to the fast and large flow of the main rivers, such as the Changjiang river, urban rivers present weaker self-cleaning performances regarding pollution due to the slow flow caused by their disconnection from existing river networks as well as the existence of artificial point-source and non-point-source pollution. Physical, chemical, and biological indices have been the main parameters used in previous studies [17]. Ye et al. identified the sources and transformation mechanisms of nitrogen in urban rivers and found that urban nitrogen (N) was mainly affected by economic activities and industrial structures [18]. Furthermore, Xiao et al. conducted a multi-scale analysis of the effect of landscape patterns on the water quality of urban rivers, in which total nitrogen (TN) and total phosphorus (TP) were likely to be higher in low water periods [19]. To reduce these pollutants, chemical solutions such as flocculants [20] and algaecide [21], biological solutions such as aquatic bacterial communities and plants [22], and the technologies of wetland systems have been widely proposed [23]. Although these methods perform well, physical solutions, i.e., solutions improving water quality by improving hydrodynamics by dispatching engineering control facilities, are more environmentally friendly and economical [24]. Most studies in recent years have been conducted at the level of simulation rather than pilot-scale or in situ experiments. Li et al. used the software MIKE 21 to simulate the hydrodynamics and water quality of Donghu Lake based on remote sensing data [25]. Liu et al. illustrated that both hydrodynamics and water quality were more sensitive to rainfall changes than to temperature changes [26]. Zhou et al. established a coupling simulation river model of the Pearl River Delta and found that the pollutants from PRDR have a more serious impact on Hong Kong’s seawater, especially during the wet season [27]. Noha et al. pointed out that dredging could accelerate the circulation of Mariout Lake by improving its hydrodynamics and thus improve its water quality [28]. Although numerical models of hydrodynamics and water quality are now well developed, validation using large-scale experiments is needed.
Gaullier et al. [29] assessed the influence of design parameters (e.g., aspect ratio, water depth, flow rate) on hydraulic performance simultaneously with pesticide mitigation at the pilot scale. The study pointed out that hydraulic performance and pesticide mitigation were less effective in a pond than in the ditch, regardless of the flow. For river water quality, Xu et al. [30] determined the effect of microorganisms on river water quality at a low C/N ratio at the pilot scale. Zhao et al. [31] pointed out the dramatic influence of total phosphorus (TP), total nitrogen (TN), ammonia nitrogen (AN), and dissolved oxygen (DO) on aquatic biodiversity. To our best knowledge, pilot-scale or full-scale experiments of urban rivers in plain river networks are still lacking for the validation of hydrodynamics to improve water quality. Thus, the response mechanism between flow rate and water quality should be determined.
To improve the water quality of the plain river networks by enhancing hydrodynamics, this study combined the theoretical calculation of river modeling with a pilot-scale experiment to find the response mechanism between flow rate and water quality. The inflow of zones and the storage capacity of rivers were used as metrics to compare and determine the advantages of three proposed operating conditions. In addition, a pilot-scale experiment was conducted to measure the flow and flow rate and also to monitor water quality. The fitting curve was presented to find the optimized range of the flow rate based on the measured water quality. This study is expected to provide a basis for the improvement of water quality enhanced by hydrodynamics in plain urban river networks.
2. Modeling and Experimental Methods
2.1. Overview of This Study Area
The study area was the Hutang area, which includes a plain urban river network throughout South Changzhou city in the Yangtze River Delta (Figure 1). The urban river network contains 7 main rivers and 4 tributaries. This area extends to the Changzhou section of the Beijing–Hangzhou Canal in the north, the Wuyi Canal in the west, the Wunan river in the south, and the Cailing river in the east, covering an area of 88.963 km2. In detail, there are 5 hubs controlling the inner area for river regulation and one overflow weir out of this area to provide fresh water from Ge lake to the Hutang area.
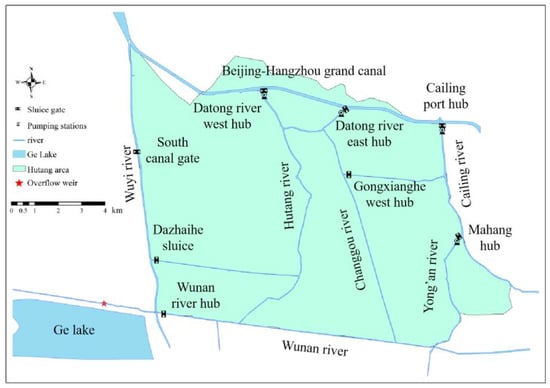
Figure 1.
The study area of urban river networks in Changzhou, China.
2.2. Modeling and Calculation
2.2.1. Modeling Method
River sections are the basic units of one-dimensional (1D) model calculation, and those created in the model of the Hutang area are the measured ones (Figure 2). All modeling of rivers and calculations of flow and flow rate were performed in the commercial software Infoworks ICM. In addition, the section data were compared with the embankment and river bottom elevation to ensure accuracy. The hydraulic facilities required in this model’s construction mainly included sluices, pump stations, and overflow weirs that are connected between the rivers in the form of a “connection”. Real-time control (RTC) was employed to conduct a regulation simulation.
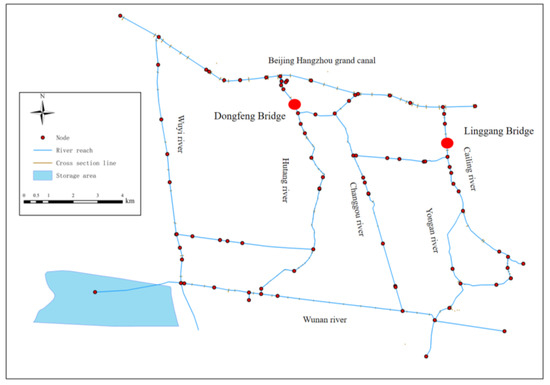
Figure 2.
The modeling of rivers in an urban river network in Changzhou, China.
2.2.2. Governing Equations and Solution Methods
The flood movement of a one-dimensional river channel is described by St. Vennant equations, and the control conditions of the upstream and downstream boundaries are generally in the form of water level process control, flow process control, and flow–water level relationship control. The definite solution problem of one-dimensional water flow is composed of the basic St. Vennant equation, boundary conditions, and initial conditions. The one-dimensional St. Vennant equations describing the hydrodynamic process of the channel consist of the continuity equation and the momentum equation:
where x and t are the longitudinal coordinates and time of the river channel, respectively; n is the roughness coefficient; Q and Z are the section flow and water level, respectively; q is the lateral inflow per unit length of the river; A is the cross-sectional area of the water; u and R are the average velocity and hydraulic radius of the water-passing section, respectively; is the rate of change along the section when the water level is the same; g is the acceleration of gravity.
In addition, considering that the water flow is affected by the solid side wall, the inner boundary conditions were supplemented to make the calculation more accurate.
For the solving method, the finite difference method and the Preissmann four-point implicit lattice method were used for one-dimensional river network hydrodynamics and St. Venant’s equations, respectively.
2.2.3. Initial Conditions and Calculation Boundaries
The water levels of Cailinggang, Ge Lake, Cailinggang, and Wunanzha were selected as the water level boundaries. Because the regulation simulation was performed in the non-flood season, the initial water level was set as the average water level of each station in the non-flood season from 2017 to 2020, which was 3.52 m, 3.59 m, 3.45 m, and 3.21 m for Cailinggang, Ge Lake, Cailinggang, and Wunanzha, respectively.
In terms of boundary conditions, the water levels of the Changjiang river, the Grand canal, and Tai lake were selected, which were 3.8~4.0 m, 3.4~3.6 m, and 3.2 m, respectively. In addition, the water level of the Yangtze river is always higher than that of the Beijing–Hangzhou grand canal.
2.2.4. Calibration and Verification
The Nash–Sutcliffe coefficient (NSE) and the deterministic coefficient R2 were used to evaluate the model’s validity. Specifically, the Nash–Sutcliffe coefficient ess used to indicate the approximate degree of order between the predicted value series and the measured series, and the deterministic relative errors were used to indicate the shape agreement between the predicted value series and the measured series.
where is the i-bit data of the measured sequence; is the i-bit data of the calculated sequence; i mean is the mean value of the measured sequence; and 𝑛 is the total number of measured data.
For calibration, the water level process of Dongfeng Bridge served as the upstream boundary, and the water level process served as the downstream boundary. The results of the calibration were as follows. As shown in Figure 3, the NSE was 0.846, the relative error was less than 10%, and the maximum water level error was 0.02 m, which was lower than 3 cm, thus illustrating that the calculation’s result matched with the measured one well. Thus, the roughness rate of the Beijing–Hangzhou grand canal and the Wuyi canal was set as 0.020, and that of other rivers was 0.030~0.035.
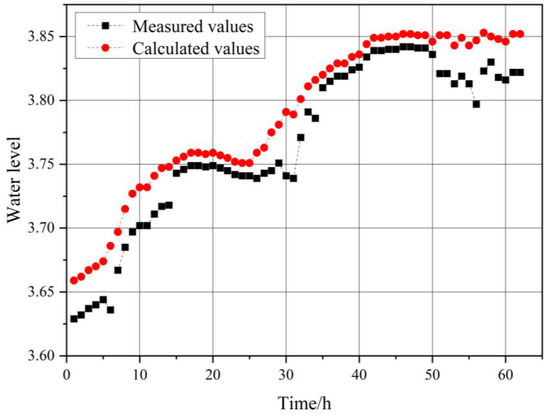
Figure 3.
Comparison of the calculated water level and measured water level results for calibration.
For verification, and based on the calibration, the comparison results of the water level upstream of the Linggang Bridge in the city are shown in Figure 4. The NSE was 0.915, and the relative error was less than 10%. The results showed that the change trends of the calculated and measured water levels were similar for each station, and the average error was also controlled by 3 cm.
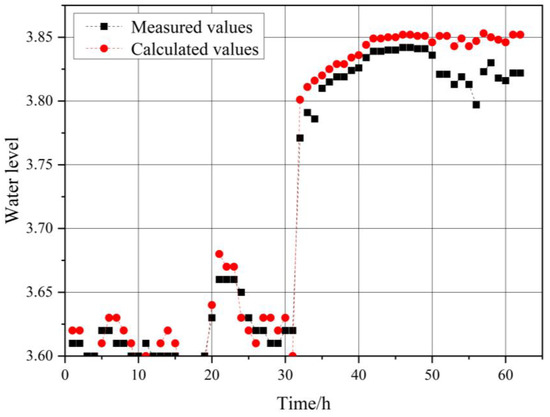
Figure 4.
Comparison of calculated water level and measured water level results for verification.
2.2.5. Calculation Settings
There are three conditions set in this study. The first two days are blank levels, with all facilities turned off. Condition (a) is such that the opening gates and pumps are closed. Condition (b) runs the daily regulation. Based on condition (b), condition (c) adds one pump station, called the Mahang hub, to direct the river water to the north out of the Hutang area. Detailed regulation information is shown in Table 1.

Table 1.
Three conditions for river regulation.
2.3. Settings and Monitoring of the Pilot-Scale Experiment
2.3.1. Experimental Settings
The experimental settings were the same as the simulation calculation settings. The only difference is the period time of the river regulations. The pilot-scale experiment was conducted over a total of 10 days. The first two days were used to test the blank level for concentrations of water quality. The last eight days were the experimental period.
2.3.2. Monitoring Methods
To monitor the hydrodynamics, 20 sites were selected to test flows at a frequency of once each day. To monitor water quality, the sites marked in brown in Figure 5 were established and measured water quality once a day. Specifically, the parameters of water quality were selected as NH3-N, TP, DO, and turbidity.
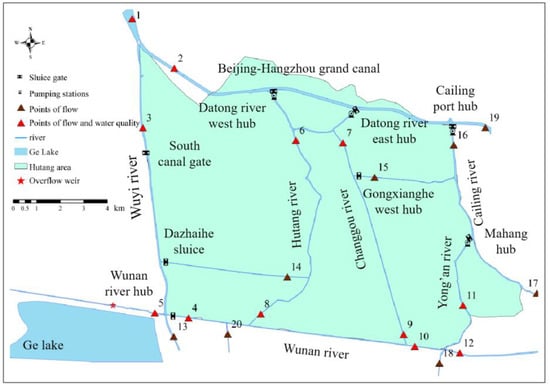
Figure 5.
The monitoring of hydrodynamic and water quality, all sites for hydrodynamic and brown marked ones for water quality only.
3. Results and Discussion
3.1. Inlet Flow and Flow Rate by Model Simulation
3.1.1. Inlet Flow
When the water level is 3.5 m, the water storage volume of the internal river network reaches 4,084,500 m3. The recharge frequency is calculated according to the “Guidelines for Ecological Water Demand Assessment of Rivers and Lakes” (SL/Z479-2020, for trial implementation), and the results are shown in Table 2. The frequency of water recharge for condition (c) is 4.23 days/time, which is faster than that for conditions (a) and (b). Furthermore, the water demand of the area under each working condition was calculated based on the ratio of water storage volume to time.
Table 2.
The amount of water storage and the frequency of water replenishment under different working conditions.
A temporary weir was set up at the confluence of the Wunan River and Ge lake to control the volume of water in the lake. When the pump station in condition (a) was not in operation, the water demand in the Hutang area was 9.08 m3/s. Compared with the water demand of 9.65 m3/s when the pumping station in the Hutang area was activated in condition (b), the difference was not significant. The reason for this is that the discharge capacity of the pumping stations in the river network was below 1 m3/s and the diversion capacity was weak, so the river water of the Beijing–Hangzhou Grand Canal could not be introduced in a significant amount. In condition (c), the operation of the Mahang hub pumping station changed the flow direction of the Wunan River. Specifically, the flow direction at Point 4 on the Wunan River changed from flowing from east to west to flowing from west to east. Compared to conditions (a) and (b), the flow direction at Point 4 on the Wunan River was reversed. Due to the water balance, the water from the Beijing–Hangzhou Grand Canal could enter the internal river network of the Hutang area. The calculation results show that the water demand in the Hutang sheet increases by 2.09 m3/s and 1.52 m3/s, respectively, compared to the first two conditions. Therefore, it can be concluded that the increase in the frequency of water replenishment is beneficial to the increase in water demand, which thereby increases the flow of the internal river network in the Hutang area.
3.1.2. Flow and Flow Rate in the Region
Figure 6a shows the flows at each point of the Hutang area under the three conditions. In general, the trend of the flow at each point was gradually increased from condition (a) to condition (c). Among them, the flow direction of the Wunan River in condition (c) changed from west to east, which showed the river flows from Ge Lake to the Wunan River, causing the flow value of point 4 on the Wunan River to first decrease and then increase from condition (a) to condition (c). In addition, this is the reason why the flow rate at point 10 on the Wunan River increased 10 times in condition (c) compared to conditions (a) and (b). It can be seen that only under condition (c) does the inflow from the Beijing–Hangzhou Grand Canal to the Hutang area flower more into the Wuyi Canal. This may have been caused by the increase of 10 m3/s in the northward drainage from the Mahang junction pumping station and the inflow from the Beijing–Hangzhou Grand Canal. This is also the reason why the flow rates of measuring points 4 and 12 on the Wunan River, the main tributary of the Wuyi Canal, were the largest under condition (c).
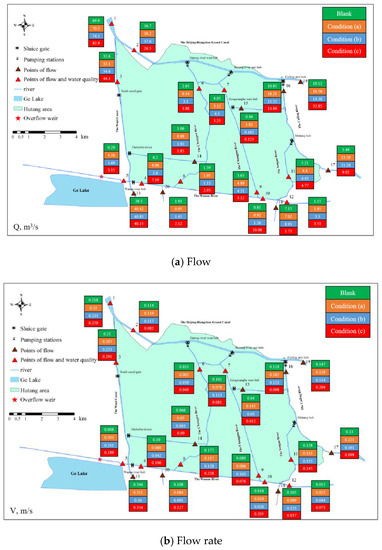
Figure 6.
Comparison of flow and flow rate under three conditions by simulation.
Points 7 and 9 had the highest flow rates under condition (b). The reason for this is that, relative to condition (a), the internal pumping stations are all turned on in condition (b), resulting in an increased flow in the internal channel. Moreover, condition (c) turns on the Mahang junction pumping station at the boundary pumping station of the Hutang area, resulting in the Beijing–Hangzhou Grand Canal being replenished by the Cailing River. Therefore, according to the relationship of water balance [32], the flow of the Beijing–Hangzhou Grand Canal’s diversion into the Hutang River decreases. Therefore, according to the comparison of the flow simulation results, condition (c) is the best operational regulation.
Figure 6b shows the flow rate at each point of the Hutang area under the three conditions. Among the 20 points, the flow rate increased relative to the blank values at 10, 14, and 12 points, accounting for 50%, 70%, and 60%, respectively. The number of measurement points for both flow and water quality where the flow rate increased and decreased in condition (c) compared with condition (b) was eight and four, respectively, indicating that the increase in flow rate in condition (c) was greater than that in condition (b). The maximum flow rate at points 10 and 12 on the Wunan River in condition (c) was because the operation of the Mahang Junction increased the flow rate at the confluence of the Wunan river with the Changgou River and the Yongan River in condition (c). Based on the analysis of flow, the flow of the Beijing–Hangzhou Grand Canal’s diversion into the Hutang river decreased in condition (c), but the flow of the other internal channels increased in condition (c). Therefore, according to the comparison of the flow simulation results, condition (c) is the best operating regulation.
3.2. Analysis of Hydrodynamic and Water Quality in the Pilot-Scale Experiment
3.2.1. Analysis of Hydrodynamics
As seen in the graph in Figure 7, comparing the simulation results with the measured results, it can be seen that the relative errors of flow and flow rate between the simulation and the measured results are within 20%, which indicates that the model has good accuracy. Among them, the value of point 5 has a large error, which is because the storage function of the lake under actual conditions is not considered. In general, among the 20 measurement points under these three conditions, the flows of points 13, 12, and 10 increased relative to the blank value, accounting for increases of 65%, 60%, and 50%, respectively.
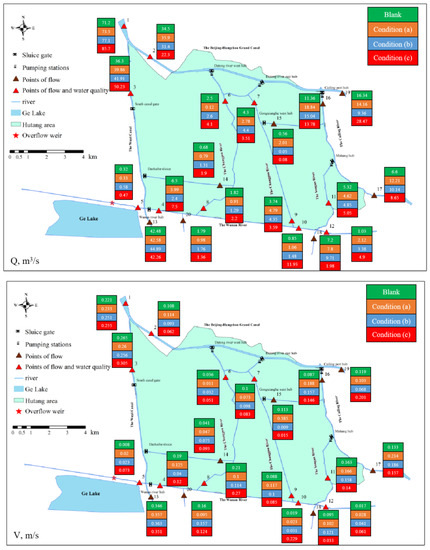
Figure 7.
The comparison of flow and flow rate under three conditions by experiment.
The measurement points of both flow and the water quality of points 5, 7, and 7 increased relative to the blank value, accounting for 50%, 58.3%, and 58.3% increases, respectively. In particular, the flows of points 4, 3, and 7 increased by more than 10% relative to the blank value, accounting for 33.3%, 25%, and 58.3% increases, respectively. Under the three conditions, the flows of Point 10 at the confluence of the Wunan river and the Yongan river were 1.064 m3/s, 1.48 m3/s, and 11.93 m3/s, respectively. Moreover, the flows of Point 12 at the Wunan River were 2.12 m3/s, 3.38 m3/s, and 4.9 m3/s, respectively. The maximum flow values of Points 10 and 12 both appeared in condition (c).
For the flow rates, the flow rate for the three working conditions ranged from 0.011 to 0.305 m/s. In general, among the 20 measurement points under these three conditions, the flows of Points 13, 10, and 12 increased relative to the blank value, accounting for increases of 65%, 60%, and 50%, respectively. Among the 12 measurement points of flow and water quality, Points 8, 7 and 11 had flow rates of 0.05 m/s or more, accounting for increases of 66.7%, 58.3%, and 91.7%, respectively. According to a study by Ding et al. [33] in the plain river network of the ancient city of Suzhou, the more suitable ecological flow rate range of the plain river network is 0.05–0.1 m/s. Considering the topic of improving water quality via hydrodynamic enhancement, the influence of river hydrodynamics on the ecosystem is ignored in this study. Therefore, the disturbance of the ecosystem by excessive river network flows is not considered. Condition (c) had the most points with a river flow rate of 0.05 m/s or more. Specific analyses of these three conditions are given below. Since this paper analyzes the influence of hydrodynamics on water quality, only the measurement points concerning water quality are considered in the later sections of this analysis.
For condition (a), the flow of the Beijing–Hangzhou Grand Canal was 73.5 m3/s, which included 35.9 m3/s into the eastern half of this network and 39.9 m3/s into the southern half. As shown in Figure 7, without the intervention of the internal pumping station, the water network of the Hutang area showed a flow pattern from north to south. Compared with the blank level, the flow of the Beijing–Hangzhou Grand Canal into the Hutang area increased by 2.3 m3/s, which was caused by the operation of the boundary gates in this area.
Specifically, the flow along the Wuyi Canal into the Changgou River was less than 1 m3/s, indicating that the hydrodynamics of the Changgou River was weak and had limited impact on the peripheral water system of the Hutang area. In addition, the flow of the Beijing–Hangzhou Grand Canal into the Wuyi Canal was 39.8 m3/s, while that of the Wunan River back to Ge Lake was 3.85 m3/s. This may be the reason for the loss of part of the hydrodynamics of this river network. The upstream of the Wunan River under this condition was in the state of backflow to Ge Lake, so the flow at Point 10 on the Wunan River mainly originated from Point 36 on the Hutang River, which led to the flow at Point 10 being smaller. In addition, the flow rate increased and decreased at the point by 50%, indicating that the hydrodynamic improvement effect was not obvious. Therefore, without the help of pumping stations, the river’s hydrodynamics would be poor [34]. The large amount of clean river water flowing through the patch is wasted and does not make good use of the hydrodynamics to improve the water quality of the river network [35].
For condition (b), the flow of the Beijing–Hangzhou Grand Canal was 77.1 m3/s, including 31.4 m3/s into the eastern part of this river network and 41.9 m3/s into the southern part. The flow distribution trend of the river was similar to condition (a). Compared with condition (a), the flow into the Wuyi Canal increased by about 2.1 m3/s due to the increase of 3.6 m3/s in the inflow of the Beijing–Hangzhou Grand Canal. It was noted that although the Wunan River stopped flowing back to Ge Lake, the Wuyi Canal lost more water compared to condition (a). This indicated that the river flow in the Hutang area could be controlled using the internal pumping station, but the water loss in the outer river could not be controlled [36]. The flow rate at Point 10 on the Wunan river increased by about 0.42 m3/s, and the flow rate at Point 12 on the Wunan river increased by 1.26 m3/s. The number of points with a river flow rate of 0.05 m/s or more changed from six to five, accounting for 41.7% of all measured points. This means that the pumping station inside the Hutang area had limited drainage capacity, and the effect of raising the flow rate in and around the Hutang area was not obvious.
For condition (c), the total inflow of the Beijing–Hangzhou Grand Canal was 85.7 m3/s, including 22.3 m3/s into the eastern part of this river network and 50.5 m3/s into the southern part, with a more serious loss of water flowing to the eastern part of the river network. The flow direction of the Wunan river in the Hutang area was different from the first two conditions. The Mahang hub pumping station drained to the north, resulting in the Yongan river flowing north to the Beijing–Hangzhou Grand Canal. The flow direction of Point 40 on the Wunan river changed from west to east, while the Wunan river no longer flowed backward to Ge Lake. The flow direction of Point 4 on the Wunan river changed from west to east, so the flow direction at all points on the Wunan River was west to east.
Under the condition of installing a temporary weir at the river channel of the Wunan river to the Wuyi canal, the flow rate from the Beijing–Hangzhou Grand Canal into the Wuyi Canal rose by 10.4 m3/s and 8.3 m3/s compared to the previous two conditions. As shown in Figure 6, the flow rate of the Wuyi canal into the Wunan river at the confluence with the Wunan river was 7.5 m3/s, which was much smaller than the flow rate of the Beijing–Hangzhou Grand Canal into the Wuyi Canal, which was 50.2 m3/s. Similar to the above results, it showed that the use of one northward drainage pump could only control the flow in the current boundary channel, but not the water loss in the other outer rivers.
The river water of the Wunan River was guided by the pump of the Mahang junction, which received the flow of the Hutang River along its route, flowing eastward into the Yongan River and then flowing out of the Hutang area through the Beijing–Hangzhou Grand Canal. As can be observed from the figure, the flow rate at Point 4 upstream of the Wunan river was 7.5 m3/s, and the direction was from west to east. When the Wunan river and the Hutang river flow converge, the flow rate at Point 38 was 11.93 m3/s, which was about 10 times that of condition (a) and condition (b). Meanwhile, the percentage of points with a river flow rate of 0.05 m/s or more was 91.7%, which was much higher than 50% in condition (a) and 41.7% in condition (b). It showed that condition (c) could better enhance the flow and the flow rate of the rivers in the Hutang area compared with the first conditions.
3.2.2. Analysis of Water Quality and Its Response Mechanism of Flow Rate
To explore the response mechanism of water quality to the flow rate, we selected the flow rate as the hydrodynamic indicator, which was a fitting analysis with actual-measurement water quality data. Among them, Point 1 of the Beijing–Hangzhou Grand Canal was selected as the representative point to represent the water quality of the freshwater. Point 5 represented the water quality of the lake body and was not used as the main object of the study in this research. Therefore, Points 4, 10, and 12 were selected to represent the Wunan River. Point 3 represents the main inlet flow of the Wunan River. The physical distance between Points 6 and 7 was too close to the Beijing–Hangzhou Grand Canal and had passed through the Datonghe east Hub and the Datonghe west hub, respectively. The water body of these two points was not stable. Therefore, Points 8 and 9 were chosen to better reflect the diffusion process of the Changgou river and the Hutang river. Finally, Points 1, 3, 4, 8, 9, 10, 11, and 12 were selected to analyze the relationship between the optimal results of the water quality and the flow rate of the river under the three types of working conditions.
- (a)
- NH3-N
As shown in Table S1, the numbers of decreased NH3-N concentrations in three conditions were 5, 3, and 7, respectively, and the proportions reached 41.7%, 25%, and 58.3%, respectively. Overall, the decline in nitrogen concentration in working conditions a, b, and c was between 25.15% and 68.51%, 14.07% and 49.71%, and 15.79% and 73.88%, respectively.
It can be observed that the NH3-N concentration of the Beijing–Hangzhou Grand Canal and the Wuyi Canal (Points 1, 2, and 3) showed an upward trend. This showed that the increase in traffic at Point 3 of the Beijing–Hangzhou Grand Canal had led to the acceleration of NH3-N diffusion in the Beijing–Hangzhou Grand Canal. As a result, the NH3-N concentration of Point 1 and Points 2 and 3 downstream increased. Comparing the flow rate of the same point with a flow rate of 0.05 m/s or more at different conditions, it can be found that, except for Points 4, 9, and 11, the remaining points showed a larger flow rate and a smaller NH3-N concentration value. The reason for this is the changes in the flow of the river channel. Specifically, the flow direction of Point 4 in conditions (a) and (b) was changed from west to east in condition (c), while that of Point 36 in conditions (a) and (c) was changed from south to north in condition (b). These findings are consistent with the results of Pan et al. [37]. Thus, the NH3-N concentration of condition (c) was selected as the research object and was fitted with the corresponding flow rate. As shown in Figure 8a, the relationship between NH3-N and the flow rate was obtained using the following fitting equation:
where y is the NH3-N concentration and x is the flow rate.
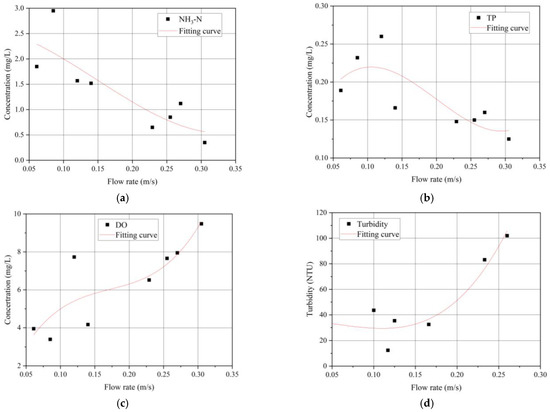
Figure 8.
The fitting curve of (a) NH3-N, (b) TP, (c) DO, and (d) turbidity.
The R2 of this fitting equation is 0.723, indicating the good response between NH3-N concentration and flow rate. It can be seen from the figure that when the flow rate of the river is 0.05 m/s–0.3 m/s, ammonia nitrogen is in a downward trend. Therefore, it is possible to summarize that, in condition (c), when the flow rate of the river remains at 0.05 m/s–0.3 m/s, the degradation rate of the ammonia nitrogen of the river is faster.
- (b)
- TP
As shown in Table S2, the numbers of TP concentrations in the three conditions that decreased were 11, 7, and 11, respectively, and the proportion reached 91.7%, 58.3%, and 91.7%, respectively. Overall, the decline in the TP concentration in working conditions (a), (b), and (c) was between 0.4% and 62.77%, 12.94% and 50.71%, and 7.2% and 56.74%, respectively.
It can be observed that the total phosphorus concentrations in the Beijing–Hangzhou Grand Canal and the Wuyi Canal (Points 1, 2, and 3) in condition (a) showed a decreasing trend, while that of condition (b) showed an increasing trend. In condition (c), the TP concentration at Point 1 increased, while it decreased at Points 2 and 3, and the decrease was not as large as that in condition (a). This indicates that the natural flow of the river in condition (a) accelerates the degradation of TP in the Beijing–Hangzhou Grand Canal more so than the engineering control of the internal or external pumping stations.
Comparing the TP concentrations at the same point with a flow rate of 0.05 m/s and above under different conditions in the internal Hutang area, it was found that the TP concentrations, including in the points where the flow direction changed, did not conform to the law that the larger the flow rate, the smaller the TP concentration. At the same time, Point 7, which had been flowing from north to south under the three conditions, also did not conform to the law. Therefore, the relationship between the TP response to the flow rate of the river needs to be further analyzed by the data fitting method.
At the confluence of the Wunan river with the Yongan river and the Hutang river (Points 9, 10, 11, 12), the number of points with the highest percentage of TP decreased in condition (c) was 100%, while that in condition (a) and condition (b) were only 75% and 50%. Moreover, the concentration of TP in the Beijing–Hangzhou Grand Canal in condition (c) was higher than that in condition (a), and the improvement in all four points was the largest in condition (c). Therefore, from the perspective of reducing the TP concentration, condition (c) was the most effective among the three conditions. As shown in Figure 8b, the relationship between TP and flow rate was calculated using the following fitting equation:
where y is the TP concentration and x is the flow rate.
The R2 of this fitting equation is 0.658, indicating a good response between TP concentration and flow rate. Therefore, it can be concluded that the increase in river flow rate can contribute to the reduction in TP in the river when the flow rate is kept within the range of 0.11 and 0.29 m/s.
- (c)
- DO
As shown in Table S3, the numbers of increased DO concentrations in the three conditions were 7, 5, and 10, respectively, and the proportion reached 58.3%, 41.7%, and 83.3%, respectively. Overall, the increases in DO concentration in working conditions (a), (b), and (c) were between 3.47% and 31.5%, 3.68% and 28.24%, and 1.36% and 84.03%, respectively.
It can be observed that the DO concentrations in the Beijing–Hangzhou Grand Canal and the Wuyi Canal (Points 1, 2, and 3) in condition (b) showed a decreasing trend, while that of condition (c) showed an increasing trend. In condition (a), the DO concentration at Points 1 and 2 increased, while it decreased at Point 3. This indicates that the operation of the pumping station at the Mahang junction in condition (c) accelerated the exchange of water between the internal river of the Hutang area and the Beijing–Hangzhou Grand Canal, which was more likely to accelerate the increase in DO in the Beijing–Hangzhou Grand Canal.
Comparing the DO concentration at the same point with the flow rate of 0.05 m/s or higher under different conditions, it can be found that the DO did not conform to the rule that the higher the flow rate, the higher the DO values, only in the points where the flow direction changed (4, 9, and 11), indicating that this rule is suitable for most rivers. To explore the upper flow rate threshold of DO, the relationship between the DO response to the flow rate of the river needs to be further analyzed via data fitting analysis.
At the entrance of the Changgou and Hutang rivers into the Wunan river (Points 8 and 9), the increase in DO under the various conditions was −12.08%, −10.4%, 3.36% and −14.35%, 25.23%, 84.03%, respectively. The greatest improvement was observed for condition (c), indicating that condition (c) was the most effective. As shown in Figure 8c, the relationship between DO and flow rate was as calculated using the following fitting equation:
where y is DO concentration and x is the flow rate.
The R2 of this fitting equation is 0.735, indicating a good response between the DO concentration and the flow rate. It can be concluded that the DO concentration could be improved by a higher flow rate that is faster than 0.05 m/s.
- (d)
- Turbidity
As shown in Table S4, the numbers of decreased turbidity in the three conditions were 6, 8, and 6, respectively, and the proportion reached 50%, 66.7%, and 50%, respectively. Overall, the reduction in turbidity in working conditions (a), (b), and (c) was between 1.42% and 43.28%, 2.6% and 66.52%, 1.73%, and 35.93%, respectively.
It can be observed that only the turbidity of the Beijing–Hangzhou Grand Canal and the Wuyi Canal (Point 1) in condition (a) showed a decreasing trend, while both conditions (b) and (c) showed an increasing trend. This indicates that the water bodies in the Beijing–Hangzhou Grand Canal are more effective in the migration of pollutants under natural flow conditions than with pumps. It can be found that the turbidity values not only do not conform to the rule that the higher the flow rate, the smaller the turbidity value in the points where the flow direction changes, but they also do not conform to Point 7, which had been flowing from north to south under the three conditions, and its numerical growth was difficult to express as a linear relationship.
For the points (6 and 7) that flow from the Beijing–Hangzhou Grand Canal into the internal river, the decrease in turbidity under each condition is 11.4%, −46.37%, −8.29% and 43.28%, −3.48%, and −948.09%, respectively. Therefore, from the point of view of turbidity reduction, condition (a) is the most effective of the three conditions. As shown in Figure 8d, the relationship between turbidity and flow rate was calculated using the following fitting equation:
where y is the turbidity value, and x is the flow rate.
The R2 of this fitting equation is 0.735, indicating a good response between turbidity and flow rate. It illustrates that the flow rate, which is lower than 0.12 m/s, can contribute to reducing turbidity.
- (e)
- Comprehensive water quality index
A single water quality index mainly represents one kind of water quality, while a comprehensive water quality index could represent the level of water quality of the whole river. The evaluation equation is as follows:
where Ci is the pollutant concentration, C0 is the highest standard value of each pollutant, Pi is the pollution index, and m is the total pollution index.
For condition (a), as shown in Figure 9a, the relationship between the comprehensive water quality index and the flow rate is calculated as follows:
where y is the comprehensive water quality index, and x is the flow rate.
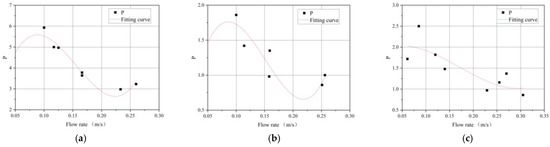
Figure 9.
The relationship between flow rate and comprehensive water quality index: condition (a), condition (b), and condition (c).
The R2 is 0.953, indicating a good response between the comprehensive water quality index and the flow rate. It can be seen that the comprehensive water quality index has a decreasing trend when the flow rate is less than 0.12 m/s. Under condition (a), when the flow rate is kept between 0.08 m/s and 0.22 m/s, the increase in the river flow rate can help to reduce the comprehensive pollution index of the river, and the lowest value occurred when the flow rate was 0.22 m/s.
For condition (b), as shown in Figure 9b, the relationship between the comprehensive water quality index and the flow rate is calculated as follows:
The R2 is 0.825, indicating a good response between the comprehensive water quality index and flow rate. It can be seen that the comprehensive water quality index has a decreasing trend when the flow rate is less than 0.18 m/s. Under condition (b), when the flow rate is kept between 0.08 m/s and 0.18 m/s, the increase in the river’s flow rate could help to reduce the comprehensive pollution index of the river, and the lowest value occurred when the flow rate was 0.18 m/s.
For condition (c), as shown in Figure 9c, the relationship between the comprehensive water quality index and the flow rate is calculated as follows:
The R2 is 0.688, indicating a good response between the comprehensive water quality index and the flow rate. It can be seen that the comprehensive water quality index has a decreasing trend when the flow rate is less than 0.28 m/s. Under condition (c), when the flow rate is kept between 0.12 m/s and 0.28 m/s, the increase in the river flow rate could help to reduce the comprehensive pollution index of the river, and the lowest value occurred when the flow rate was 0.28 m/s.
4. Conclusions
In this study, a pilot-scale experiment was conducted, combined with theoretical calculations of river modeling, to improve water quality using optimized flow rates in the Hutang area of Changzhou, China. The inflow of zones and the storage capacity of the rivers were employed to compare and determine the advantages of the selected conditions. In addition, the pilot-scale experiment not only verified the accuracy of the results calculated by the mathematical models, but also monitored the water quality under these conditions. The main conclusions are as follows:
- The simulation results showed that using pumps on the border to drain the river beyond it could increase the frequency of water replenishment. The internal pumping station has a discharge capacity of less than 1 m3/s, and its ability to influence the frequency of water recharge is less than that of the Mahang hub at the border.
- In condition (c), which uses pumps to discharge water to the north, the proportion of rivers with a 10% increase in flow rate reached 48.48%, which was over 10% higher than the proportion obtained in the other conditions. The reason for this is that the larger inflow of the Wuyi Canal and the operation of the Mahang pumping station resulted in the largest flow at the confluence of the Wunan River.
- Regardless of ammonia nitrogen (AN), total phosphorus (TP), and dissolved oxygen (DO), the highest proportion of rivers with improved water quality all occurred in condition (c). However, the percentages of rivers with improved turbidity are at the same level under these three conditions. This indicates a weak linear relationship between turbidity and flow rate.
- Based on the response mechanism between flow rate and water quality, 0.3 m/s is the highest flow rate for the AN, TP, DO, and comprehensive water quality index, while a 0.12 m/s flow rate is the best choice for controlling turbidity.
Supplementary Materials
The following supporting information can be downloaded at https://www.mdpi.com/article/10.3390/su15075700/s1, Table S1: The change rate of NH3-N on the pilot-scale experiment; Table S2: The change rate of TP on the pilot-scale experiment; Table S3: The change rate of DO on the pilot-scale experiment; Table S4: The change rate of turbidity on the pilot-scale experiment.
Author Contributions
Conceptualization, J.M. and Z.F.; methodology, J.M.; software, J.M., Y.L. and J.L.; validation, J.M.; formal analysis, J.M.; investigation, J.M. and Y.L.; resources, Z.F.; data curation, J.M. and Y.L.; writing—original draft preparation, J.M.; writing—review and editing, Y.L. and Z.F.; visualization, J.L.; supervision, Z.F.; project administration, Z.F. and G.F.; funding acquisition, Z.F. All authors have read and agreed to the published version of the manuscript.
Funding
This work was supported by the National Key Research and Development Program of China under grant number [2022YFC3202602] and [2018YFC0407205], the Major Science and Technology Projects of Ministry of Water Resources of China [SKS-2022080], and the Central public welfare research institutes basic research business special expenses project [Y121012].
Institutional Review Board Statement
Not applicable.
Informed Consent Statement
Not applicable.
Data Availability Statement
Not applicable.
Conflicts of Interest
The authors declare no conflict of interest.
References
- Xu, Z.; Xu, J.; Yin, H.; Jin, W.; Li, H.; He, Z. Urban river pollution control in developing countries. Nat. Sustain. 2019, 2, 158–160. [Google Scholar] [CrossRef]
- Proshad, R.; Islam, S.; Tusher, T.R.; Zhang, D.; Khadka, S.; Gao, J.; Kundu, S. Appraisal of heavy metal toxicity in surface water with human health risk by a novel approach: A study on an urban river in vicinity to industrial areas of Bangladesh. Toxin Rev. 2020, 40, 803–819. [Google Scholar] [CrossRef]
- Xie, C.; Yang, Y.; Liu, Y.; Liu, G.; Fan, Z.; Li, Y. A Nation-Wide Framework for Evaluating Freshwater Health in China: Background, Administration, and Indicators. Water 2020, 12, 2596. [Google Scholar] [CrossRef]
- Maillot, M.; Flipo, N.; Rivière, A.; Desassis, N.; Renard, D.; Goblet, P.; Vincent, M. Water table mapping accounting for river–aquifer connectivity and human pressure. Hydrol. Earth Syst. Sci. 2019, 23, 4835–4849. [Google Scholar] [CrossRef]
- Huang, J.; Zhang, Y.; Bing, H.; Peng, J.; Dong, F.; Gao, J.; Arhonditsis, G.B. Characterizing the river water quality in China: Recent progress and on-going challenges. Water Res. 2021, 201, 117309. [Google Scholar] [CrossRef]
- Khan, R.; Saxena, A.; Shukla, S.; Sekar, S.; Goel, P. Effect of COVID-19 lockdown on the water quality index of River Gomti, India, with potential hazard of faecal-oral transmission. Environ. Sci. Pollut. Res. 2021, 28, 33021–33029. [Google Scholar] [CrossRef]
- Sidek, L.M.; Jaafar, A.S.; Majid, W.H.A.W.A.; Basri, H.; Marufuzzaman, M.; Fared, M.M.; Moon, W.C. High-resolution hy-drological-hydraulic modeling of urban floods using InfoWorks ICM. Sustainability 2021, 13, 10259. [Google Scholar] [CrossRef]
- Chenlei, Y.; Zongxue, X.; Xiaohui, L.; Peng, L.; Chunguang, B.; Binbin, Z. InfoWorks ICM flood simulation and risk analysis: Case of Baima River district, Fuzhou. J. Beijing Norm. Univ. 2021, 57, 784–793. [Google Scholar]
- Yu, M.; Liu, X.; Wood, P.; Wei, L.; Wang, G.; Zhang, J.; Li, Q. Simulation of Poyang Lake water levels and outflow under his-torical extreme hydrological scenarios. J. Flood Risk Manag. 2022, 15, e12806. [Google Scholar] [CrossRef]
- Yang, F.; Wu, J.; Zhang, Y.; Zhu, S.; Liu, G.; Chen, G.; Wu, S.; Fan, Z. Improved method for identifying Manning’s roughness coefficients in plain looped river network area. Eng. Appl. Comput. Fluid Mech. 2021, 15, 94–110. [Google Scholar] [CrossRef]
- García-Feal, O.; González-Cao, J.; Gómez-Gesteira, M.; Cea, L.; Domínguez, J.M.; Formella, A. An Accelerated Tool for Flood Modelling Based on Iber. Water 2018, 10, 1459. [Google Scholar] [CrossRef]
- Ming, X.; Liang, Q.; Xia, X.; Li, D.; Fowler, H.J. Real-time flood forecasting based on a high-performance 2-D hydrodynamic model and numerical weather predictions. Water Resour. Res. 2020, 56, e2019WR025583. [Google Scholar] [CrossRef]
- Speight, L.J.; Cranston, M.D.; White, C.J.; Kelly, L. Operational and emerging capabilities for surface water flood forecasting. WIREs Water 2021, 8, e1517. [Google Scholar] [CrossRef]
- Nikora, V.I.; Sapozhnikov, V.B. River network fractal geometry and its computer simulation. Water Resour. Res. 1993, 29, 3569–3575. [Google Scholar] [CrossRef]
- Lian, J.J.; Xu, K.; Ma, C. Joint impact of rainfall and tidal level on flood risk in a coastal city with a complex river network: A case study of Fuzhou City, China. Hydrol. Earth Syst. Sci. 2013, 17, 679–689. [Google Scholar] [CrossRef]
- Xie, R.; Pang, Y.; Li, Z.; Zhang, N.; Hu, F. Eco-Compensation in Multi-District River Networks in North Jiangsu, China. Environ. Manag. 2013, 51, 874–881. [Google Scholar] [CrossRef] [PubMed]
- Akoteyon, I.; Omotayo, A.; Soladoye, O.; Olaoye, H. Determination of water quality index and suitability of urban river for municipal water supply in Lagos-Nigeria. Eur. J. Sci. Res. 2011, 54, 263–271. [Google Scholar]
- Ye, H.; Tang, C.; Cao, Y. Sources and transformation mechanisms of inorganic nitrogen: Evidence from multi-isotopes in a rural-urban river area. Sci. Total Environ. 2021, 794, 148615. [Google Scholar] [CrossRef]
- Xiao, R.; Wang, G.; Zhang, Q.; Zhang, Z. Multi-scale analysis of relationship between landscape pattern and urban river water quality in different seasons. Sci. Rep. 2016, 6, 25250. [Google Scholar] [CrossRef]
- Zeng, D.; Wu, J.; Kennedy, J.F. Application of a chitosan flocculant to water treatment. Carbohydr. Polym. 2008, 71, 135–139. [Google Scholar] [CrossRef]
- Wang, J.; Liu, X.D.; Lu, J. Urban River Pollution Control and Remediation. Procedia Environ. Sci. 2012, 13, 1856–1862. [Google Scholar] [CrossRef]
- Zhang, L.; Fang, W.; Li, X.; Lu, W.; Li, J. Strong linkages between dissolved organic matter and the aquatic bacterial community in an urban river. Water Res. 2020, 184, 116089. [Google Scholar] [CrossRef]
- Jia, H.; Sun, Z.; Li, G. A four-stage constructed wetland system for treating polluted water from an urban river. Ecol. Eng. 2014, 71, 48–55. [Google Scholar] [CrossRef]
- Djihouessi, M.B.; Aina, M.P. A review of hydrodynamics and water quality of Lake Nokoué: Current state of knowledge and prospects for further research. Reg. Stud. Mar. Sci. 2018, 18, 57–67. [Google Scholar] [CrossRef]
- Li, X.; Huang, M.; Wang, R. Numerical Simulation of Donghu Lake Hydrodynamics and Water Quality Based on Remote Sensing and MIKE 21. ISPRS Int. J. Geo-Inf. 2020, 9, 94. [Google Scholar] [CrossRef]
- Liu, B.; Xia, J.; Zhu, F.; Quan, J.; Wang, H. Response of Hydrodynamics and Water-quality Conditions to Climate Change in a Shallow Lake. Water Resour. Manag. 2021, 35, 4961–4976. [Google Scholar] [CrossRef]
- Zhou, N.; Westrich, B.; Jiang, S.; Wang, Y. A coupling simulation based on a hydrodynamics and water quality model of the Pearl River Delta, China. J. Hydrol. 2011, 396, 267–276. [Google Scholar] [CrossRef]
- Donia, N. Investigating the impacts of dredging on improving the water quality and circulation of Lake Mariout via hydro-dynamics. In Egyptian Coastal Lakes and Wetlands: Part II; Negm, A.M., Bek, M.A., Abdel-Fattah, S., Eds.; Springer: Berlin/Heidelberg, Germany, 2018; pp. 71–103. [Google Scholar]
- Gaullier, C.; Baran, N.; Dousset, S.; Devau, N.; Billet, D.; Kitzinger, G.; Coisy, E. Wetland hydrodynamics and mit-igation of pesticides and their metabolites at pilot-scale. Ecol. Eng. 2019, 136, 185–192. [Google Scholar] [CrossRef]
- Xu, P.; Xiao, E.; He, F.; Xu, D.; Zhang, Y.; Wang, Y.; Wu, Z. High performance of integrated vertical-flow constructed wetland for polishing low C/N ratio river based on a pilot-scale study in Hangzhou, China. Environ. Sci. Pollut. Res. 2019, 26, 22431–22449. [Google Scholar] [CrossRef]
- Zhao, C.S.; Pan, T.L.; Yang, S.T.; Sun, Y.; Zhang, Y.; Ge, Y.R.; Dong, B.E.; Zhang, Z.S.; Zhang, H.M. Quantifying the response of aquatic biodiversity to variations in river hydrology and water quality in a healthy water ecology pilot city, China. Mar. Freshw. Res. 2019, 70, 670–681. [Google Scholar] [CrossRef]
- Supriyasilp, T.; Suwanlertcharoen, T.; Pongput, N.; Pongput, K. Root Zone Soil Moisture Assessment at the Farm Scale Using Remote Sensing and Water Balance Models. Sustainability 2022, 14, 1123. [Google Scholar] [CrossRef]
- Ding, Y.; Jia, H.F.; Ding, Y.W.; Sun, Z.X. Hydrodynamic optimization of urban river network of water towns based on EFDC model. Acta Sci. Circumstantiae 2016, 4, 1440–1446. [Google Scholar]
- Wang, S.R.; Gu, Y.C.; Yang, D.W.; Sun, J.H.; Hu, Q.F.; Zhang, X. Study on hydrodynamic improvement of urban tidal river for a typical plain cities in the lower reaches of Yangtze River. Adv. Water Sci. 2022, 1, 91–101. [Google Scholar]
- Mesquita, J.B.D.F.; Neto, I.E.L. Coupling Hydrological and Hydrodynamic Models for Assessing the Impact of Water Pollution on Lake Evaporation. Sustainability 2022, 14, 13465. [Google Scholar] [CrossRef]
- Fleischmann, A.S.; Paiva, R.C.D.; Collischonn, W.; Siqueira, V.A.; Paris, A.; Moreira, D.M.; Garambois, P.A. Trade-offs between 1-D and 2-D regional river hydrodynamic models. Water Resour. Res. 2020, 56, e2019WR026812. [Google Scholar] [CrossRef]
- Pan, X.; Tang, L.; Feng, J.; Liang, R.; Pu, X.; Li, R.; Li, K. Experimental Research on the Degradation Coefficient of Ammonia Nitrogen Under Different Hydrodynamic Conditions. Bull. Environ. Contam. Toxicol. 2020, 104, 288–292. [Google Scholar] [CrossRef]
Disclaimer/Publisher’s Note: The statements, opinions and data contained in all publications are solely those of the individual author(s) and contributor(s) and not of MDPI and/or the editor(s). MDPI and/or the editor(s) disclaim responsibility for any injury to people or property resulting from any ideas, methods, instructions or products referred to in the content. |
© 2023 by the authors. Licensee MDPI, Basel, Switzerland. This article is an open access article distributed under the terms and conditions of the Creative Commons Attribution (CC BY) license (https://creativecommons.org/licenses/by/4.0/).