Article

Improving Electric Vehicle Range and Thermal Comfort through an Innovative Seat Heating System

by
Florin Bode
1,2,
Nicolae Vlad Burnete
3,*,
Lucian Fechete Tutunaru
3 and
Ilinca Nastase
2,*
1
Department of Mechanical Engineering, Technical University of Cluj-Napoca, 400641 Cluj-Napoca, Romania
2
Building Services Faculty, CAMBI Research Center, Technical University of Civil Engineering Bucharest, Pache Protopopescu No. 66, 021412 Bucharest, Romania
3
Department of Automotive Engineering and Transports, Technical University of Cluj-Napoca, 400641 Cluj-Napoca, Romania
*
Authors to whom correspondence should be addressed.
Sustainability 2023, 15(6), 5534; https://doi.org/10.3390/su15065534
Submission received: 21 November 2022 / Revised: 28 February 2023 / Accepted: 20 March 2023 / Published: 21 March 2023

Abstract

:
In the last decade, car manufactures invested a lot of effort to align their products to the latest energy directives which encourage the production and usage of electrified vehicles to reduce the greenhouse gases production. This resulted in several important developments, which enhanced the advantages of electric vehicles in terms of local emissions (zero tailpipe emissions), efficiency, convenience in urban areas and others and ultimately led to their ever-increasing adoption. However, there are still some challenges that need to be addressed. One example is the negative influence of low (winter) and high (summer) atmospheric temperatures on electric vehicle range due to the cabin temperature heating and cooling. This requires more efficient ways of using energy to avoid sacrificing the passenger thermal comfort for an increased vehicle range. The present study proposes a new strategy for heating the seats in electrically powered vehicles using an uneven distribution of the heating elements. The uneven positioning of the heating elements is based on the thermal sensitivity of the human skin measured data and scientific literature. For this, a thermal sensitivity test device was developed to map the human skin thermal sensitivity. To test the new solution, a vehicle seat was equipped with heating pads (arranged according to the position of the relevant human skin thermal sensitivity points). For the next step, comparative measurements (power consumption, temperature distribution—with an IR camera—and human subjectivity test) were carried out between a classical vehicle seat heating system and the newly proposed heating solution. The outcome of the study revealed that the proposed heating system will supply at least the same thermal comfort sensation as the standard vehicle seat but using only half of the energy consumption, which translates in an increase of the electrically powered vehicle range between 1.2% and 1.5%, depending on the climate and driving conditions (over the WLTC). For example, a vehicle with a 16 kWh battery driving over the WLTC in Frankfurt climate conditions can gain in 1 year between 139.6 and 164.5 km.

1. Introduction

In the last decade, large efforts were carried out by car manufactures to align to current energy directives which encourage the production and usage of the electrified vehicles in order to reduce the greenhouse gases production. According to a report from 2017 of the European Environment Agency [1], the transport sector was responsible for 27% of the total carbon dioxide (CO2) emissions, while the share of transport greenhouse gas emissions for the road transport was accountable for 71.7%. Even more, in the current complex global energy paradigm, new ways must be found to reduce the energy consumption. Stakeholders all over the world are making considerable efforts to find new sustainable transport solutions that ensure both an efficient use of energy and a low or, ideally, no direct environmental impact.
Even though the internal combustion engine (ICE) has seen significant technological advances since its conception, advances which recently led to very low pollutant emissions and efficiencies close to 50% [2], there is only so much that can be achieved in terms of the efficiency of a thermal engine, since even theoretically this cannot exceed 60–70% (due to unavoidable irreversibility encountered through the transformation of the energy from heat to work), a limit which is getting harder and harder to reach. Furthermore, the peak engine efficiency is limited to a very small area from the engine operating map [3]. Consequently, there is a need for a more efficient and environmentally friendly solution. This idea is in agreement with the European Commission’s plans for the development of smart, green and sustainable mobility [4].
Recent developments have led to an ever-increasing adoption of electrified vehicles (EVs) due to their advantages in terms of local emissions (zero tailpipe emissions), efficiency, convenience in urban areas and others [5,6,7]. However, they have still yet to overcome some barriers before they can become the go-to solution for most applications such as a low carbon footprint during the production process, purchase price, range (as well as range anxiety [8,9]), charging times, charging infrastructure [5], etc. Consequently, the upcoming challenge is to achieve EV affordability, user friendliness and systems optimization. Additionally, ongoing developments of vehicles powertrains, electronics and sub-systems as well as the lack of an engine compartment will enable new functionalities in EVs. Another significant challenge for EVs is the environmental temperature which, when dropping below or increasing above specific thresholds, significantly limits battery performance [10,11] while also increasing the energy consumption of the heating system, thus draining the battery. For example, as temperatures go below the freezing point, the range can drop by as much as 13% [8,9] or even more in extreme climate conditions.
A vehicle’s cabin is made up of a number of structural elements that separate the internal and external environments with the aim of ensuring temperature control for the former. As a result, the vehicle cabin is at the centre of the process for designing passenger comfort, with a number of key goals: providing an appropriate environment for a pleasant driving experience, ensuring optimal thermal conditions for alert driving habits and minimizing vehicle energy use without sacrificing passenger comfort [12]. A series of studies overviewed the passenger thermal comfort assessment as well as the possible improvement of the thermal comfort inside vehicles [13,14,15,16]. As previously mentioned, HVAC systems exert a large power demand on the vehicle’s energy source (engine and/or battery) [17,18]. Compared to EVs, ICE powered vehicles have an advantage since cabin heating can be performed by recovering the residual heat produced inevitably by the engine operation, which otherwise would go to waste. As a result, the HVAC energy consumption is very low (only the fan may consume power). However, the amount of heat generated by the electric motor is too low [19,20] to be used by the HVAC system. Consequently, this can increase the HVAC power consumption significantly [21] since more power is required by the heating coils for heat generation. An example of the differences in energy consumption for EVs and ICE powered vehicles is presented in Al Faruque et Vatanparvar [22]. In their effort, the authors analysed the power consumption of a Tesla Model S 60 (with a 60kWh battery [23]) and a Toyota Corolla (powered by an internal combustion engine [24]) when cruising at 100km/h with the HVAC switched on and a fixed cabin temperature under different outside ambient temperatures (−18, 0, 21, 32 and 43 °C). The authors have found that the energy consumption of both the electric motor and the ICE varies with the outside temperatures, but, in the case of their HVAC systems, the energy consumption increases significantly only in the extreme cases. In these cases, the HVAC of EVs can contribute with as much as 20% to the total power consumption of the vehicle, a value significantly higher than that of the ICE powered vehicle of approximately 9%. The immediate consequence of the additional power consumption is the reduction of up to 13% in the vehicle driving range. In the long term, this could also increase the battery stress and thereby affect the battery lifetime. The power consumption of other accessories (e.g., entertainment, steering, lighting) is almost independent of the ambient temperature. Similar results were obtained by Fiori et al. [25] which in their effort evaluated the energy demand of the HVAC system at environmental temperatures of −5, 25 and 35°C. Using simulation, the authors have shown that the EV energy consumption can increase by up to 32% depending on the ambient temperature. This causes a drop in EV range of up to 24% when operating in heating mode and up to 10% when operating in cooling mode. Other authors, such as Farrington and Rugh [26], have estimated an even higher increase (35–50%) in energy consumption for maintaining cabin comfort under cold weather conditions.
Reviewing the literature, it was discovered that there are several climate control options for vehicles, each offering a different level of energy efficiency and passenger comfort [27]. The standard solution for the automotive climate control, also known as single-zone, provides a uniform thermal environment for all the passengers in the cabin, i.e., it keeps the whole cabin temperature in the thermal comfort range around a target temperature defined by the user [28,29,30]. In this situation, the HVAC system can be adjusted by monitoring several variables, including the cabin temperature, the surrounding temperature and solar radiation (to cool/heat the cabin) [31]. However, this may not always provide the optimal thermal comfort in all cases. Using the Predicted Mean Vote (PMV) to model the thermal comfort of a human, Van Hoof [32] analysed the HVAC operation in different conditions. The authors have shown that not all passengers will experience a pleasant thermal sensation in a homogenous thermal environment.
To improve the thermal comfort of the passengers and reduce the energy consumption of the HVAC, the so-called multi-zone automotive climate controls have been introduced, which can provide non-uniform thermal environment for different passengers [27]. These systems employ a complex ventilation system with variable air volume (VAV) management, which provides good control of the air temperature and velocity for the separate passengers (zones). This can increase each user’s thermal comfort and greatly reduce energy usage. However, all these solutions have been designed around the architecture of an ICE powered vehicle. Therefore, adapting them to EVs does not always provide the best results in terms of energy consumption (see [22,26,33]). Consequently, several alternative methods have been proposed by researchers for EV cabin heating/climate control such as fuel heaters, radiating panels, zonal heating and others. Other authors suggested using fuel heaters due to the high energy density of the fuel [34], but since fuel combustion leads to pollutant emissions, their use would contradict the very purpose of EVs. Another low energy consumption solution would be the radiating panels [35], but due to the confined space in the vehicle cabin, it does not seem to be a very good approach. Vesely et al. [27] proposed another approach, namely extending and altering the vents in such a way that the driver thermal comfort is increased but without warming the entire cabin, i.e., zonal heating. However, considering that there is a constant push for increasing the efficiency of vehicle travel by car-sharing, this does not appear as a viable solution. In their effort, Oi et al. [36] analysed the use of a heated seat (with on/off operation) together with a foot heater. Working at room temperatures between 10 and 20 °C, they showed that the room temperature at which the occupants felt a ‘neutral’ overall thermal sensation can be lowered by approximately 3 °C when using either one of the two devices or by approximately 6 °C when using both devices. Using simulation, the authors have also shown that the use of such a solution could lower the energy consumption required for heating by more than 30%.
Regarding the summer season and the cooling process, there are various solutions that can be implemented such as A/C cooling, ventilated seats and/or seats using thermoelectric (TE) cooling. A/C is the widespread (convection) cooling solution for HVAC systems due to several advantages such as well-established technology, high cooling/heating capacity, etc. [19,20,37]. However, for EVs, this solution is not feasible due to its high energy consumption [19,20]. Convection cooling can also be applied to seats, i.e., ventilated seats. These can provide thermal comfort in hot weather, especially in the case of parked vehicles exposed to sun [38]. The use of thermoelectric modules has several advantages over other solutions such as the ability to operate both in heating and cooling mode (depending only on the current direction), the lack of moving parts, little to no maintenance, the lack of fluids, being non-flammable (compared to refrigerants) and others [39]. Furthermore, TE heating/cooling can be applied both in convective and conductive heat transfer solutions. Considering that convective heat transfer is largely inefficient due to the low heat transfer coefficient of air, conductive TE heating/cooling appears to be more appealing. In the latter case, the TE module surface is in direct contact with the human body and therefore can improve the effectiveness and rate of heat transfer. The immediate consequences of these advantages of convective cooling are a faster attainment of the hot or cold sensation and, ultimately, of thermal comfort. This is supported by the findings of Chen et al. [40], who in their efforts used seats with direct contact TE modules. The authors have found that the energy consumption of the HVAC system can be reduced by up to 38% in both cooling and heating modes.
In case of contact cooling and heating solutions, the typical placement of the heating/cooling elements seeks to provide a uniform temperature distribution on the cushion and backseat surfaces. However, recent studies in human body thermal sensitivity show that this is not always required. For example, in a series of experiments involving real vehicles, Burch et al. [41] investigated the possibility of increasing thermal comfort under severe cold conditions (−20 °C) by using electric heating pads with low power consumption installed on the seat cushion and back. They concluded that this solution significantly reduced the time needed to achieve thermal comfort but did not provide any details about regional characteristics.
In three different studies, Zhang et al. [42,43,44] investigated the relationships between local skin temperature, thermal sensation and thermal comfort. The authors found that the overall thermal sensation is strongly influenced by the skin temperature of the pelvis and of the back. To better address this issue, Luo et al. [45] and Arens and Zhang suggested a detail mapping of the skin temperature sensitivities. The main conclusions of these studies were that (a) cool and warm sensitivities widely vary across the body and (b) the warm and cool sensitivity of the skin determines the thermal sensations experienced at different ambient temperatures. These conclusions are of particular interest when designing personal comfort systems (PCS) since they can allow for an improved thermal comfort with a more efficient use of energy. Specifically, the knowledge of the temperature sensitivity of the different parts of body can allow for a design around those points. According to Parkinson et al. [46], the brain has a selective mechanism which allows it to “select” the thermal signal that allows it to achieve thermal alliesthesia. As a result, it is enough to stimulate specific receptors (heat or cool) of the body for the brain to perceive thermal comfort for the entire body. For automotive applications, this means that ensuring thermal comfort does not require to heat or cool the entire cabin and/or seat. Consequently, designing a car seat with direct contact heating/cooling elements that target the high thermal sensitivity regions can ensure a proper thermal sensation but at a fraction of the energy consumption compared to heating/cooling the entire cabin and/or seat. This conclusion is supported by the findings of Pasut et al. [47] and Kim et al. [48] who investigated the use of TE elements for local heating/cooling in office chairs. The authors found that for a room temperature range between 18 and 29 °C, the chairs equipped with TE elements and a small desk fan provided comfortable work conditions for more than 90% of the subjects, thus allowing for a 50% reduction in energy consumption. Additional benefits of this solution were that (a) the chairs provided comfortable conditions quickly (within two minutes in heating mode and instantaneously in cooling mode) and (b) the occupants were able to adapt the chair settings according to their personal thermal preferences.
Based on the information presented above, it can be concluded that targeting specific small body areas with high temperature sensitivity together with direct contact heating solutions (resistive heating) can have a high potential for improving thermal comfort and simultaneously reduce energy consumption. This is of particular importance for EVs, since it allows for an optimal design between appropriate thermal comfort for each passenger and low energy consumption.
In comparison to the available literature, this study proposes a new seat heating strategy for electrically powered vehicles, which is based on the thermal sensitivity of human skin and uses an uneven distribution of the heating sources compared with the usual approach used nowadays in the automotive industry. A thermal sensitivity test device was developed and used in order to measure the subjects’ skin sensitivity. This effort seeks to highlight the benefits of a novel heating solution for electric vehicle passenger seats that can both improve the thermal comfort of the passengers while also reducing the energy consumption, thus allowing for an increase in the vehicle range.

2. Methodology

To demonstrate the benefits of targeted heating based on the human skin thermal sensitivity map, three major steps were involved: (1) design and build of a thermal sensitivity test device and experimental determination of the human skin thermal sensitivity map; (2) fitting of a car seat with a mesh of heating elements, displaced according to results from step (1); (3) human subjectivity test to evaluate the performance of the novel personal comfort system. These steps are covered in more detail in the next paragraphs.

2.1. Thermal Sensitivity Test Device and Map

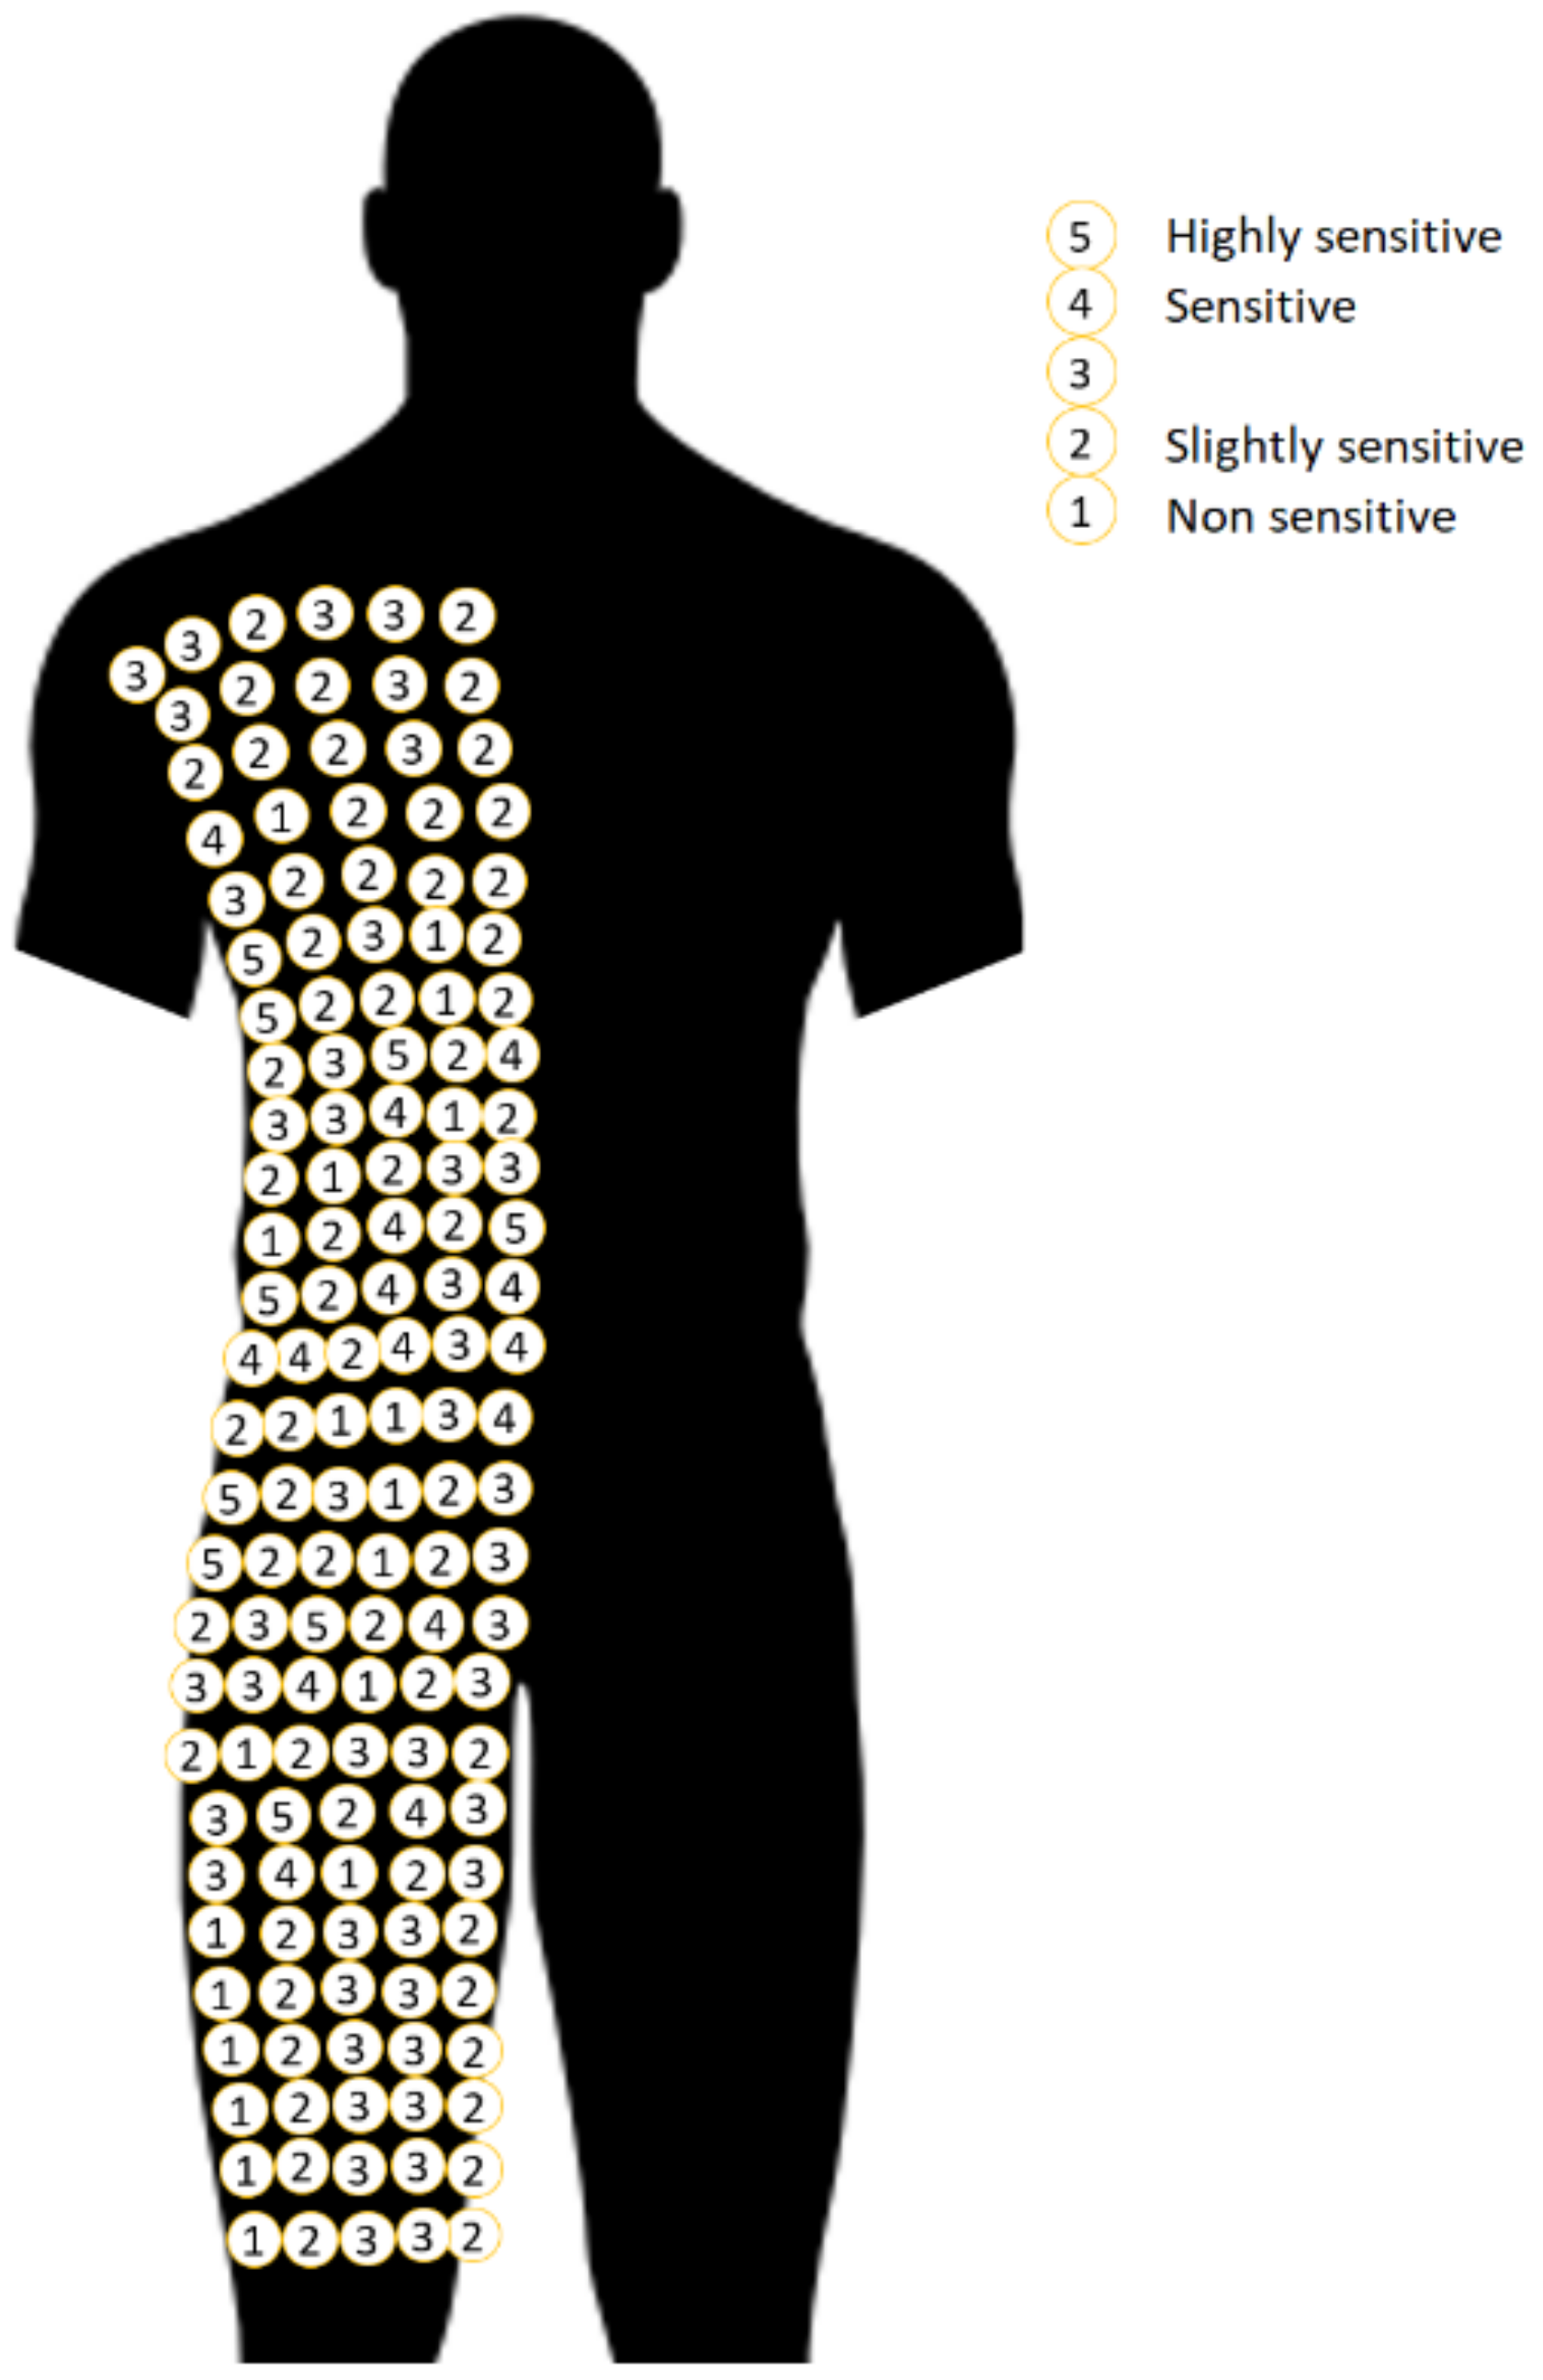
The first objective of the current research was to determine the thermal sensitivity map of the human body. To this end, a special thermo probe was developed with a circular contact surface and a diameter of 5 mm. The design and testing of the probe have been thoroughly presented in [49]. To ensure a controlled environment (24 ± 1 °C and 50 ± 5.5% RH), the tests were performed in a climatic chamber, where each of the subjects was placed for 15 min before the thermal sensitivity test. For a better analysis of the data, the thermal vote sensation, the activities performed by the subjects in the hours preceding the test, as well as other information have been recorded in a questionnaire. The next step was an accommodation phase with the probe-skin contact (Figure 1). For the tests, the authors used a starting neutral base temperature of 32 ± 0.5 °C and a spot stimulus of +8 °C. After holding the thermal probe in place for 10 s, the thermal sensation scores of the volunteers were recorded to form a thermal sensitivity map such as the one presented in Figure 2.

2.2. Seat with Integrated Heating Elements

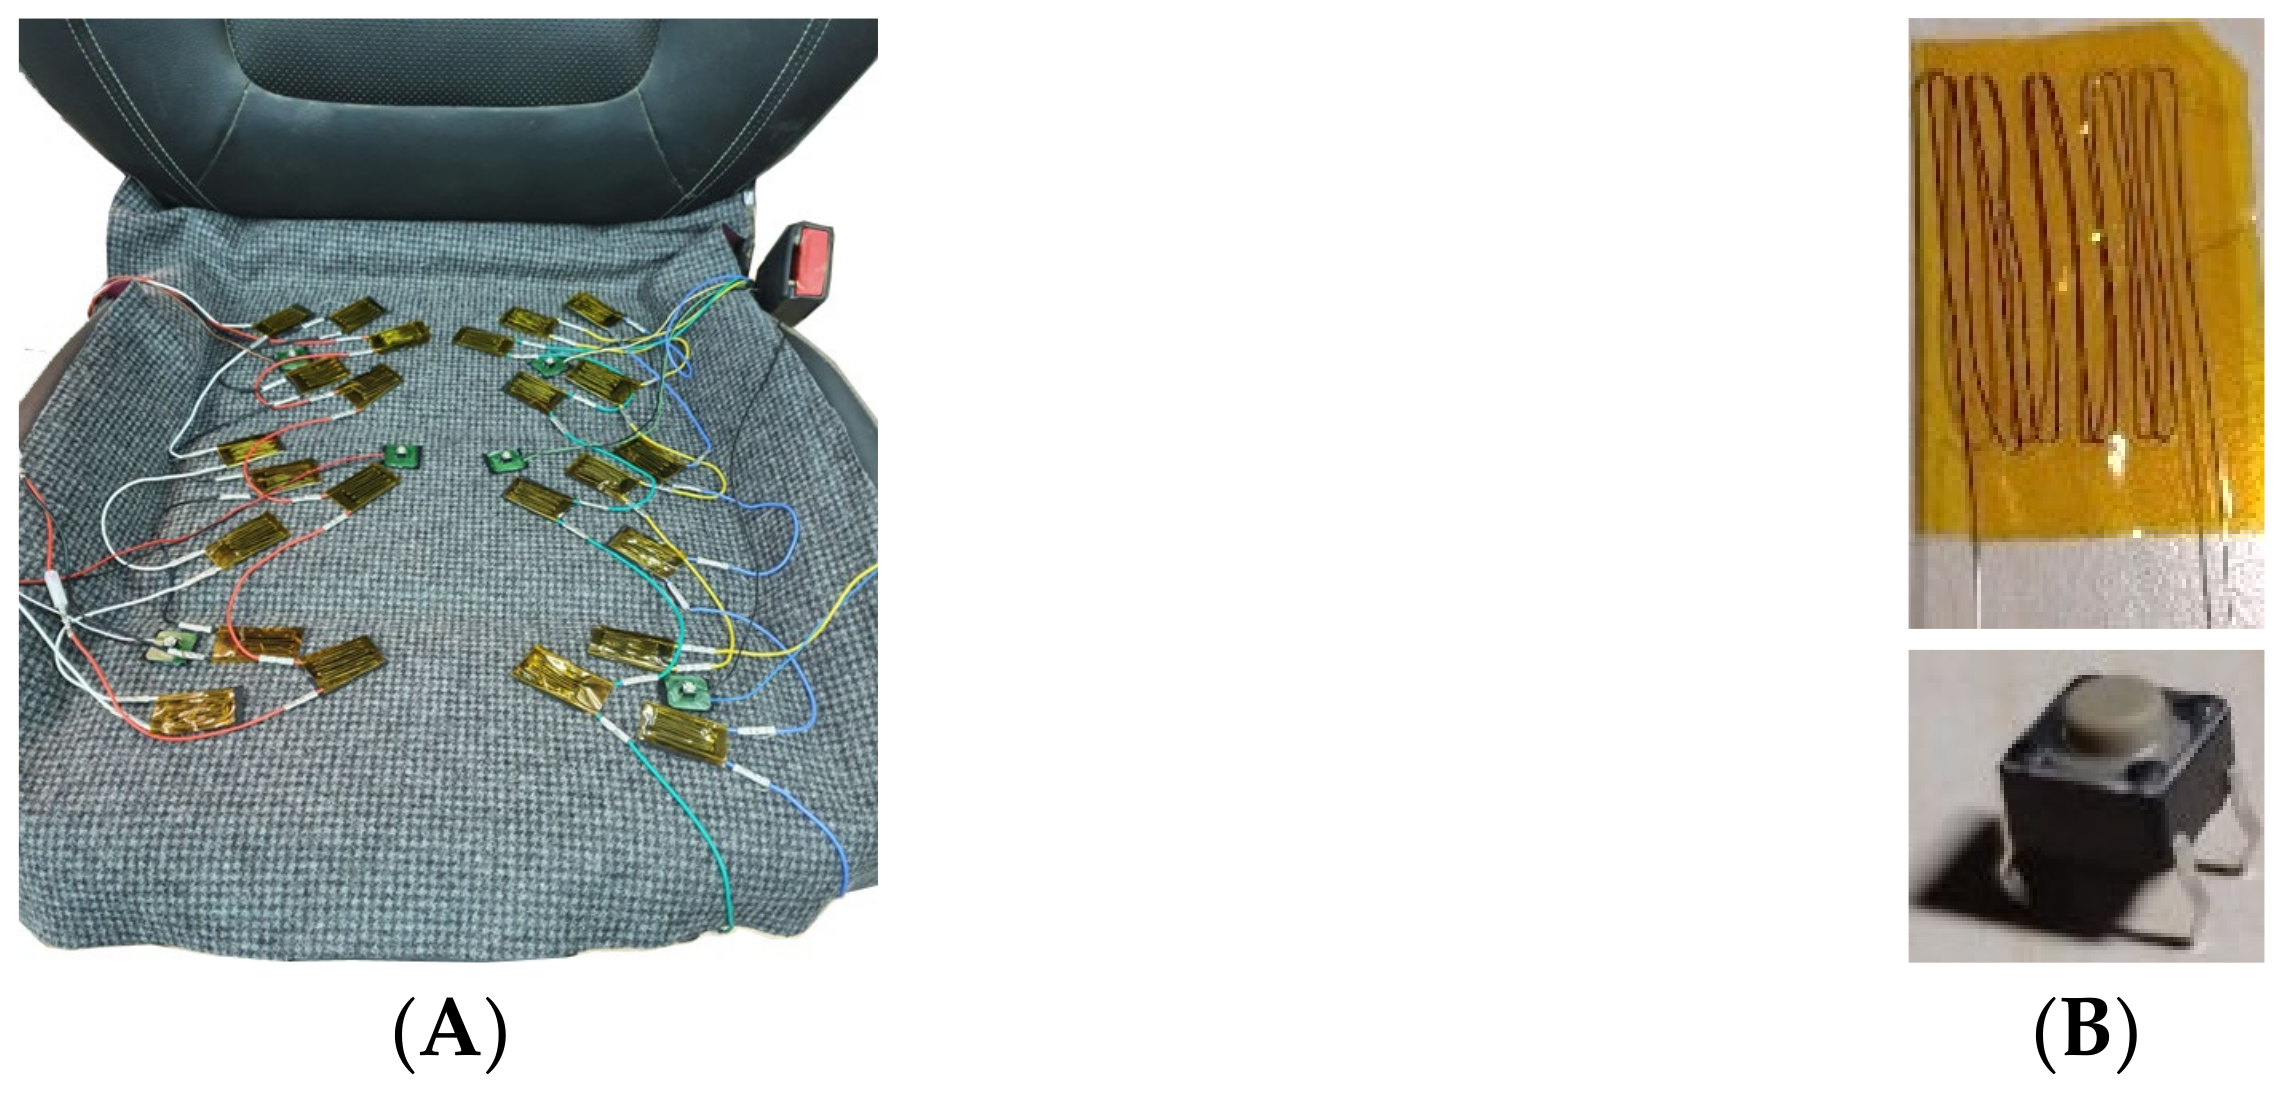
The second objective was to design and test a novel car seat solution that can maintain or even improve the thermal state of occupants inside the vehicle while reducing the energy consumption. The alliesthesia hypothesis suggests that nonuniform stimuli that manifest as localised differences in skin temperature can create a conscious experience of thermal pleasure, and this is the idea behind our solution. A mesh of heating resistances was installed on a car seat according to the body sensitivity map results (Figure 3). The novel solution for the personal comfort system of the seat comprises the following components (Figure 4): variable power supply, heating resistance (6 Ω each), microcontroller (Arduino based), relay board and pressure switches. The pressure switches are used for a personalized experience of the seat occupant. More specifically, they are used to determine the occupied surface of the seat (by the human) to provide optimal heating with minimum power consumption. Consequently, the heating resistances arrays (four heating resistances connected in series) are turned on based on the input from the pressure switches and ultimately in accordance with the posterior pressure profile of the seat occupant (Figure 5). As a result, if a smaller person occupies the seat, the number of pressure switches that are turned on is lower in comparison to a larger person. This way, the position of the heating resistances and its correlation with the temperature sensitivity map becomes of particular importance.
To determine the performance of the proposed solution, a factory seat heating system (or classical heating system) was used as a reference. Using the low, medium and high temperature settings of the classical heating system, the energy consumption was measured (and subsequently the power) using the equipment presented in Table 1. Furthermore, to understand and to rapidly acknowledge the changes in temperature, a thermal vision camera (Table 1) was used.
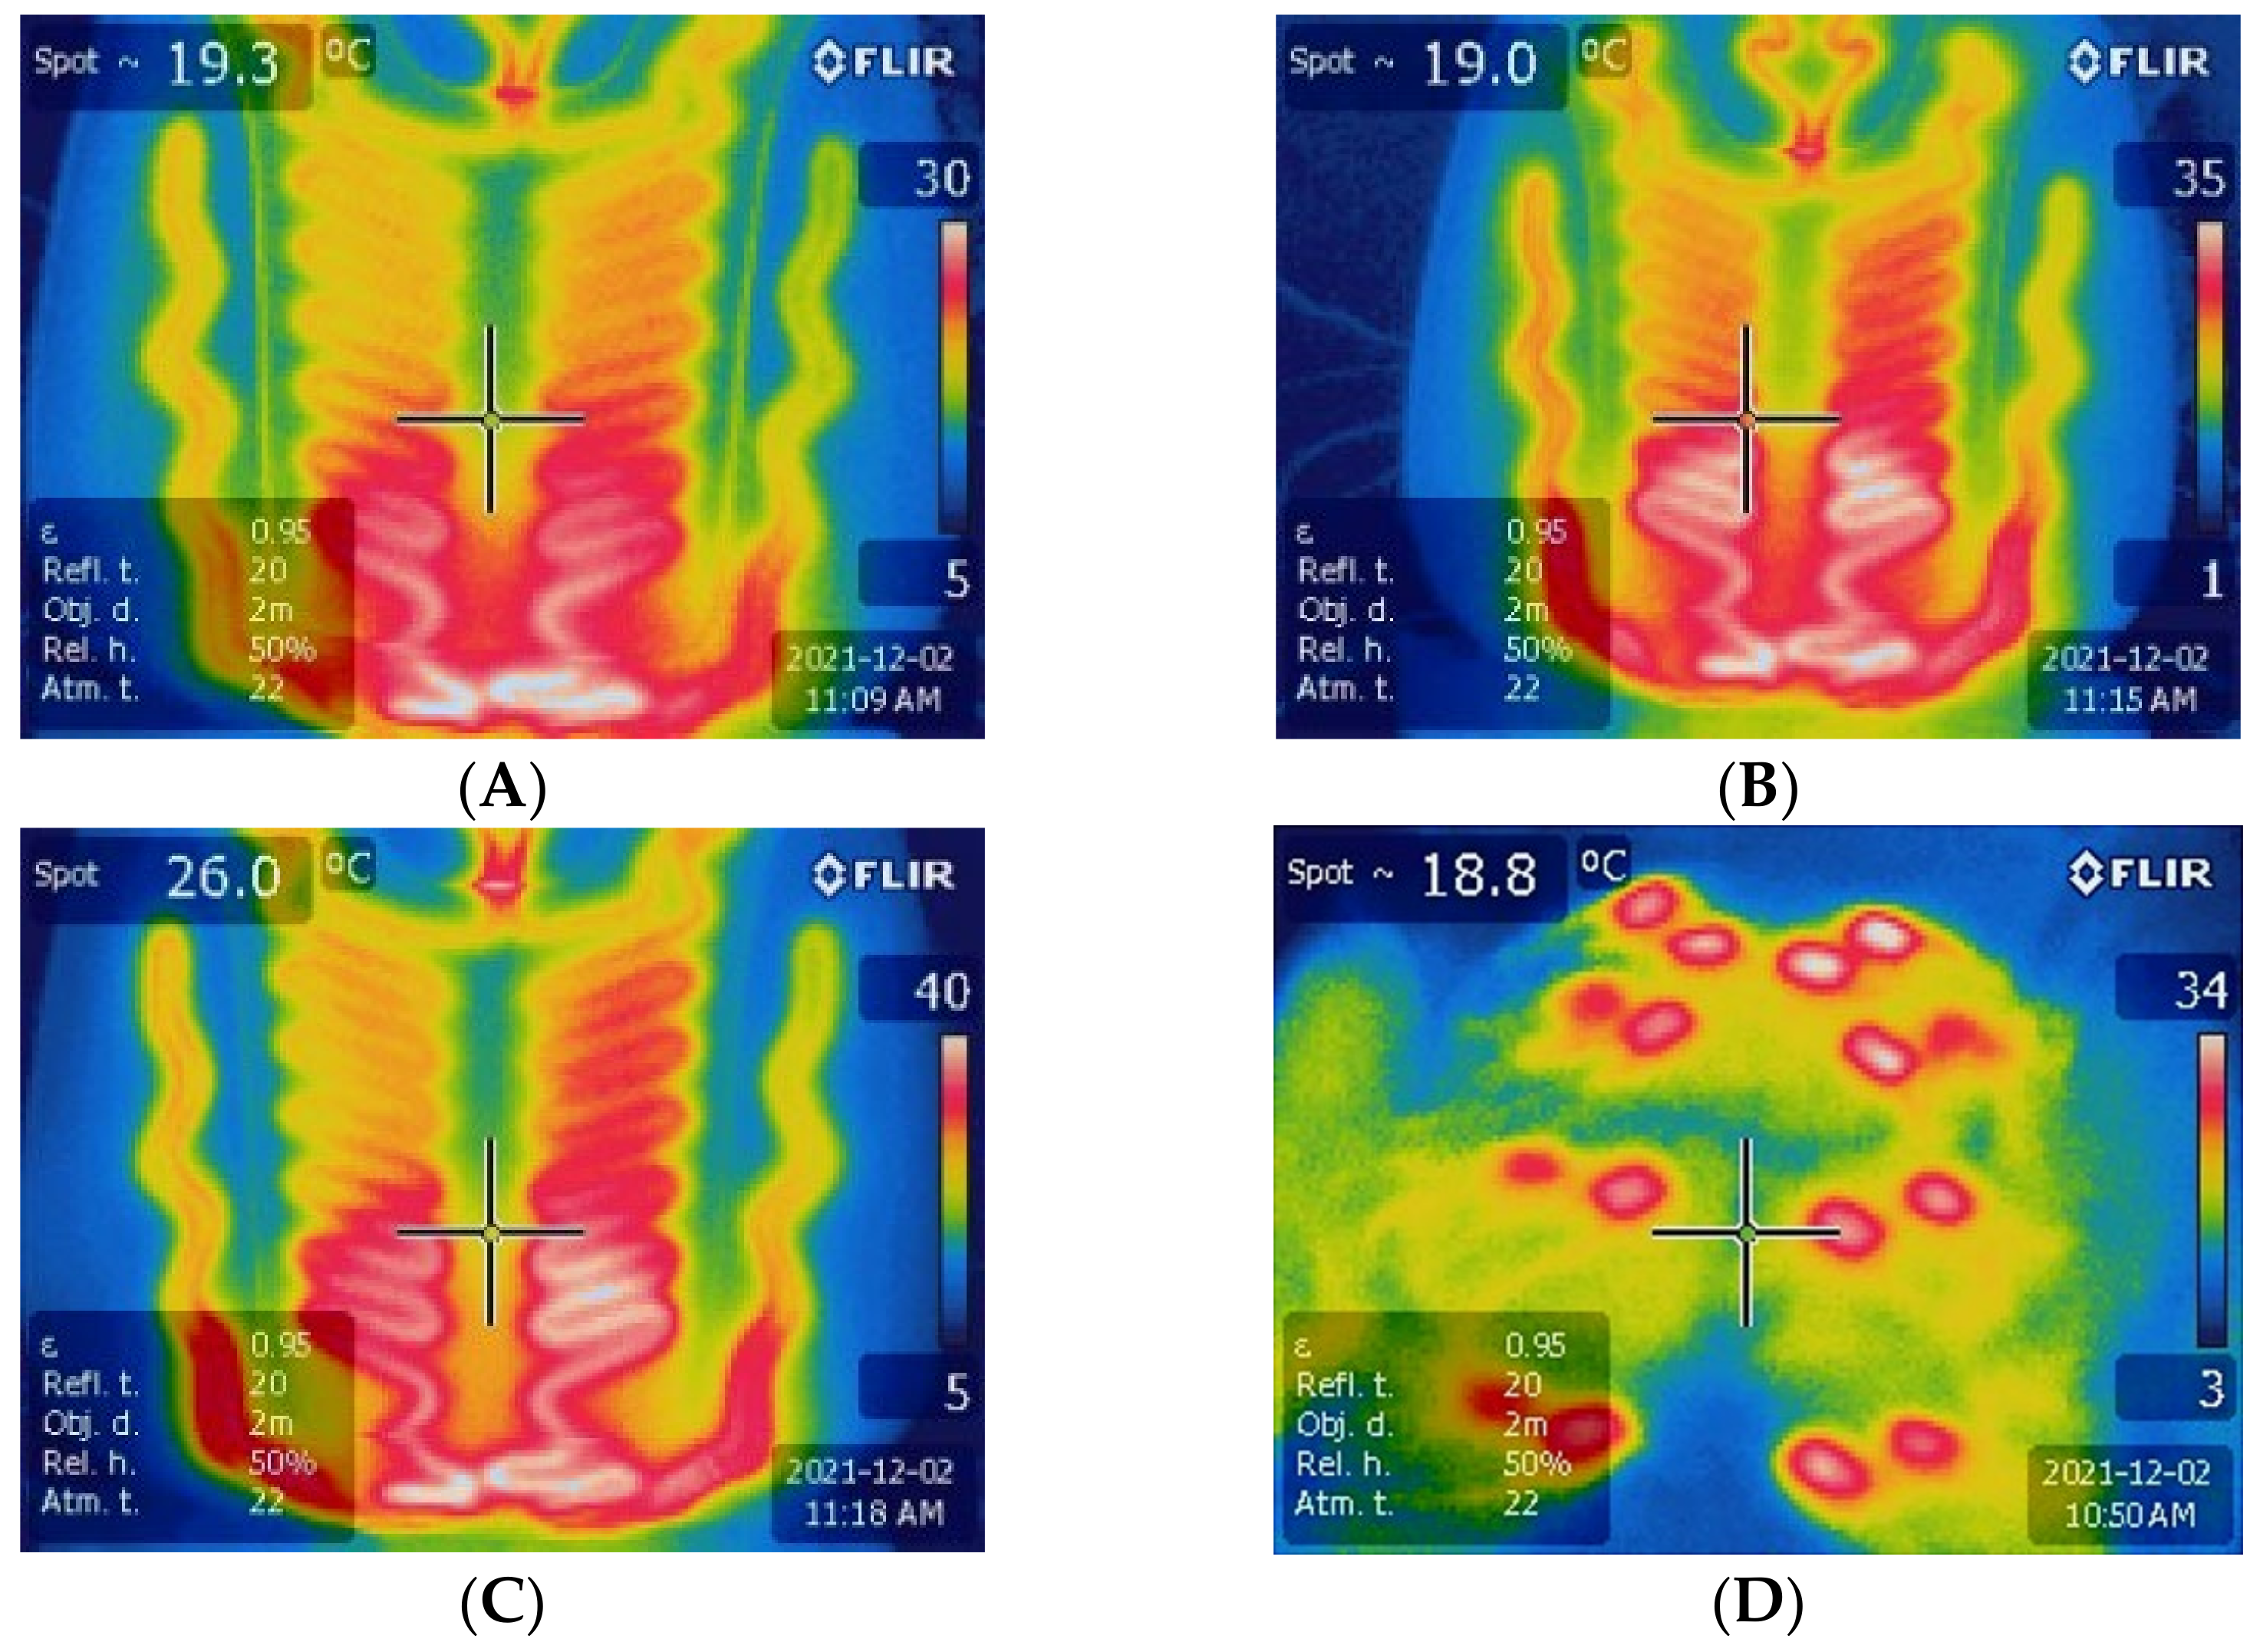
The monitoring duration varied between 10 and 15 min, which was the time required to reach a constant temperature (no significant changes over a period of 1 min) of the seat (thermal equilibrium). Figure 6A–E were captured after reaching thermal equilibrium. After installing the heating elements on the seat and checking the proper operation of the circuit, the seat was allowed to cool to room temperature (15 ± 1 °C) before being tested. As for the reference heating system, the monitored parameters were the power consumption and the temperature distribution map.

3. Results and Discussions

3.1. Thermal Comfort and Energy Consumption

Figure 6A–C show the results in terms of temperature distribution and power consumption for the reference cases. The low temperature setting led to a power consumption of 48.6 W and a peak temperature of approximately 30 °C. For the medium temperature setting, the power consumption and peak temperature increased to 66 W and 35 °C, respectively. In the case of the high temperature setting, the values increased even more to 85 W and 40 °C. Analysing the figures, it can be noticed that for the original heating system, the peak temperatures are reached at the front of the seat (corresponding to rows 23–27 of the temperature sensitivity map), while a large part of the heating resistance remains at a temperature value ranging from approximately 16 to 20 °C, which does not significantly contribute to the thermal comfort of the passenger but nonetheless increases the energy consumption.
The results for the proposed personal comfort system are presented in Figure 6D,E. Compared to the original seat heating solutions, only two settings were chosen. In this case, for the low temperature setting, the measurement of the power consumption was 29.4 W, and a peak temperature of approximately 34 °C was attained. For the high temperature setting, the power consumption and peak temperature increased to 43.4 W and 43 °C, respectively. Analysing the values, it can be noticed that this system allows for temperature ranges similar to the medium and high temperature settings of the original seat heating system but at a lower energy consumption. One can see that the novel seat strategy setup does not have such a uniform temperature as the classical seat setup, but this is something that our strategy is following. The surface area covered by the heating elements is smaller for the new strategy.
Another reason for achieving similar or even higher temperatures but with lower energy is the smaller installation depth of the heating elements, thus reducing the heating losses. On the other hand, the heat transfer rate increases, thus reducing the time required to achieve thermal comfort. However, this works both ways, and, consequently, the cooling rate also increases. For a better view of the information regarding the measurements (for all the setups), they are presented in Table 2.
The ISO 14505-3 gives guidelines and specifies a standard test method for the assessment of thermal comfort of a cabin using human subjects. The questionnaire used in our study was developed in compliance with the ISO 14505-3 [50] and ISO 10551/2001 [51] standards. The latter covers the development and use of thermal sensation scales and proposes a set of specifications on direct assessment of thermal comfort/discomfort expressed by persons subjected to various degrees of thermal stress.
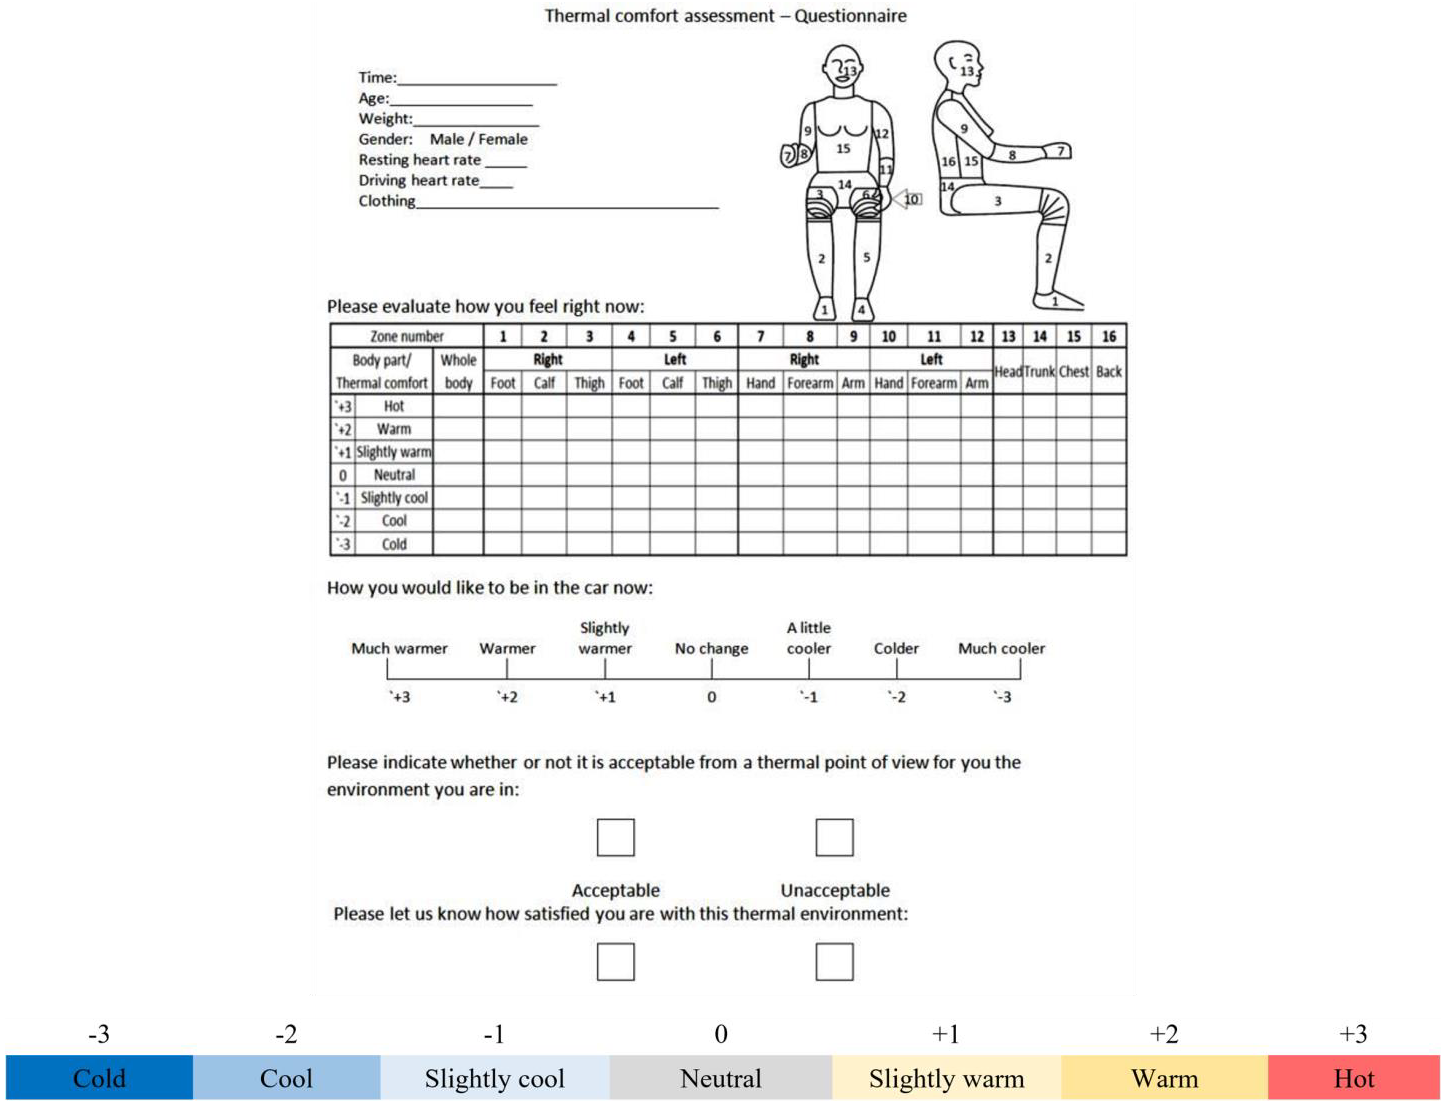
To verify the study hypothesis, a human subjectivity measurement campaign was performed. For this, eight human subjects of different ages and genders were asked to be seated (while the heating systems were turned on) and to appreciate the thermal sensation based on the scale and on the questionnaire presented in Figure 7. The number of subjects respects the minimum prescriptions indicated by the ISO 14505-2 standard which specifies that the minimum sample of subjects for in-cabin environment evaluation is 8.
During the tests, we recorded the ambient temperature, the relative humidity and the air speed. Ambient temperature was on average 10.4 °C, the relative humidity was 60%, and the mean air speed was 0.5 m/s. All tested subjects were instructed to use the same clothing type, which was estimated to produce a thermal insulation of 1.5 Clo.
The Mean Radiant Temperature (MRT) is an important factor in determining thermal comfort as it affects the heat exchange between the human body and its surroundings. A lower MRT value corresponds to a cooler environment, while a higher MRT value corresponds to a warmer environment. The human body has its own heat emission as well as a heat exchange with its surroundings through radiation, conduction and convection. A balance of these heat exchanges is necessary for thermal comfort, and MRT plays a critical role in achieving this balance. It is often used in the calculation of PMV (Predicted Mean Vote) or PPD (Predicted Percentage of Dissatisfied) indices, which are commonly used to evaluate thermal comfort in buildings and vehicles.
If a heated seat is used, it can influence the Mean Radiant Temperature (MRT) in the surrounding area. The heated seat will emit radiant heat, which can increase the MRT in the immediate vicinity of the seat. This increased MRT can make the area around the seat feel warmer and more comfortable, as the heat from the seat is directly warming the body. However, depending on the temperature settings of the seat, it can also make the overall environment feel too warm. Consequently, the heat from the seat can make the surrounding area feel uncomfortably warm. In order to achieve thermal comfort, the MRT from the heated seat should be balanced with the MRT from other sources such as the walls, floor and ceiling. The balance of MRT and air temperature, air speed and humidity are important to evaluate the thermal comfort in a space.
With the ambient conditions from the present study, if the Predicted Mean Vote is calculated without considering the heated seat itself, a value of PMV = −0.94 is obtained, thus indicating a cool environment for the activity level and the clothing insulation that was considered in the study.
If we look to the subjective thermal sensation votes that are presented in Table 3, where A, B, C, D and E represent the cases presented in Figure 6A–E, it can be noticed that for both the standard and proposed heating systems, the low temperature setting comfort conditions were appreciated by the majority of subjects as neutral (0) or slightly warm (+1). It must be noted that, in this case, the majority of neutral appreciations were attributed to the newly proposed system. For the medium temperature setting solution of the original heating system, all subjects appreciated the comfort state as being warm (+2). For the high temperature setting, the appreciations varied from warm to hot. Here it is important to note that the novel thermal comfort solution was appreciated by 7 out of 8 subjects as being hot (+3). This shows that a medium setting is also required to ensure the desired thermal comfort. Considering that the power consumption corresponding to the medium temperature setting will lie between the low and high temperature settings, the energy consumption can be further improved.
However, further testing is required (with a larger pool of human subjects) to ensure a better quantification of the effects. Based on the performed analysis, new working directions that improve thermal comfort and reduce energy consumption can be proposed. Specifically, it is possible to increase the number of heating elements while reducing their size to better optimize their distribution and, therefore, energy consumption. By also improving the distribution of the contact pressure points, it is possible to turn on only those elements where the heating effect is best used for ensuring the desired thermal comfort of the passenger. Finally, the proposed system allows for a freely chosen position of the heating elements and pressure triggers.

3.2. Energy Consumption of the Heating Elements and Vehicle Range Increase

Given the fact that with the novel heating system the energy consumption can be reduced considerably, we tried to estimate the gain in vehicle range for an electric vehicle in the new conditions.
For this, we considered the WLTC (Worldwide Harmonised Light Vehicle Test Cycle) testing cycle which is measuring the vehicle fuel/energy consumption, emissions and electric driving range. WLTC is an emissions testing cycle based on real-driving data and is used to replicate, as much as possible, how a vehicle performs in regular conditions. WLTC has replaced the previous emission testing cycle, the NEDC (New European Driving Cycle), which is based on theoretical driving. The differences between the NEDC and WLTC testing cycles are presented in [53]. For the energy economy evaluation, we started from the work of Chen et al. [40], Papasavva et al. [54], Bellocchi et al. [55] and Wu et al. [56].
Bellocchi et al. [55] reported that a typical light-duty passenger vehicle running over the WLTC with the HVAC turned off requires approximately 17 kWh for 100 km and has an average power demand of 7.9 kW. Considering a battery with 16 kWh capacity [57], the driving range (DR) over the WLTC (distance: 23.26 km, duration: 0.5 h) can be estimated using the following equation [56]:
D R = 16 7.9 + P H V A C 23.26 0.5   km ,
where PHVAC is the power consumption of the HVAC system.
The power consumption of the HVAC system under different ambient temperatures was evaluated by Chen et al. [40]. Since the focus of this study is the heating operation, only the lower temperature have been considered (Table 4).
Other factors considered for the evaluation were
  • climate and driving data over 1 year for 2 European cities (Frankfurt—colder climate and Athens—warmer climate)—presented in Figure 8 and Table 5;
  • vehicle occupancy weighting [40]—presented in Table 6.
Based on the energy consumption results presented in Section 3.1, we calculated the additional travelled distance over 1 year in Frankfurt and Athens, considering the occupancy weighting factors, climate and driving data. It must be mentioned that, since the climate data was provided for temperature intervals, the amount of energy used by the HVAC system was calculated as follows:
  • ≤2 °C: average between the values for −10 and 0 °C in Table 4.
  • 3–11 °C: average between the values for 0 and 10 °C in Table 4.
  • 12–20 °C: 1/4 of the value for 10 °C in Table 4.
The results of the analysis are presented Table 7 and Table 8.
It can be observed that the increase in the vehicle range can vary depending on the climate and driving conditions. More specifically, for a vehicle driving in Frankfurt climate conditions over the WLTC and considering the occupancy weighting, the range can increase with a value between 0.73 km (low temperature setting) and 0.86 km (high temperature setting), which gives an average of 1.2%. For Athens, the lower and upper limit values increase to 0.83 km (low temperature setting) and 0.96 km (high temperature setting), respectively, and therefore give an average of 1.5%.

4. Conclusions

A novel solution for heating the seats in an electrified vehicle that can improve thermal comfort while also reducing the energy consumption by targeting specific small areas of the human body and not the entire body area (a commonly used heating strategy) was proposed in this study.
As a first step, a thermal sensitivity test device was designed and built to allow the team to determine the thermal sensitivity map of the human body. Using this device, several tests were performed on human subjects which confirmed the hypothesis that thermal comfort can be achieved by only targeting some small specific body areas with higher thermal sensitivity. However, more tests are required to determine differences in the body thermal sensitivity map based on gender, age and regional characteristics.
As a second step, a car seat was fitted with a mesh of heating elements, displaced according to the thermal sensitivity map. Several tests were performed with both the new seat heating solution and a common heating solution used in vehicles. These tests showed that the novel solution can achieve locally similar temperature with the classic seat heating solution but with a significantly lower energy consumption. This was supported by a human subjectivity test, which showed that the novel heating system can provide the same thermal comfort sensation as the standard solution but with less energy.
Ultimately, an analysis of the increase in the electric vehicle range was performed using the WLTC testing cycle, and the results showed an increase of the vehicle range with a value between 1.2% and 1.5%, depending on the climate and driving conditions, which is rather remarkable because it was obtained without sacrificing the thermal comfort of the occupants and without using a very complex solution. For example, a vehicle with a 16 kWh battery driving over the WLTC in Frankfurt climate conditions can gain in 1 year between 139.6 and 164.5 km.
The transition from the internal combustion engine technology to the electric motor was rather abrupt, gaining great attention only in the last years. The electric vehicle range can be further increased by optimising the systems that were transferred from the internal combustion engine vehicle to electric vehicles without much regard for the efficiency of this systems.

Author Contributions

Conceptualization, F.B., N.V.B. and I.N.; Investigation, F.B. and L.F.T.; Resources, N.V.B. and L.F.T.; Writing—review & editing, Florin Bode, N.V.B. and I.N.; Project administration, F.B. and I.N. All authors have read and agreed to the published version of the manuscript.

Funding

This research was funded by grants of the Ministry of Research, Innovation and Digitization, CCCDI – UEFISCDI: project number PN-III-P2-2.1-PED-2021-2265 and project number PN-III-P2-2.1-PED-2021-0559, within PNCDI III.

Institutional Review Board Statement

Not applicable.

Informed Consent Statement

Not applicable.

Data Availability Statement

Not applicable.

Conflicts of Interest

The authors declare no conflict of interest.

References

  1. European Environment Agency. Greenhouse Gas Emissions from Transport in Europe. Available online: https://www.eea.europa.eu/ims/greenhouse-gas-emissions-from-transport (accessed on 28 October 2022).
  2. Dreisbach, R.H.; Corsini, D.; Egarter, P.; Hadl, K.; Schäffer, J.; Seitz, H.F.; Theißl, H.; Wieser, M.; Raser, B. 50% Efficiency on a Combustion Engine-Status and Measurement Results. In Internationaler Motorenkongress 2021; Liebl, J., Beidl, C., Maus, W., Eds.; Springer Fachmedien Wiesbaden: Wiesbaden, Germany, 2021; pp. 503–519. [Google Scholar]
  3. Heywood, J.B. Internal Combustion Engine Fundamentals; Mcgraw-Hill: New York, NY, USA, 2018. [Google Scholar]
  4. European Commission. Mobility Strategy. Available online: https://transport.ec.europa.eu/transport-themes/mobility-strategy_en (accessed on 9 June 2022).
  5. Xiao, B.; Ruan, J.; Yang, W.; Walker, P.; Zhang, N. A review of pivotal energy management strategies for extended range electric vehicles. Renew. Sustain. Energy Rev. 2021, 149, 111194. [Google Scholar] [CrossRef]
  6. Hertzke, P.; Müller, N.; Schenk, S. The Global Electric-Vehicle Market Is Amped Up and on the Rise. Available online: https://www.mckinsey.com/industries/automotive-and-assembly/our-insights/the-global-electric-vehicle-market-is-amped-up-and-on-the-rise (accessed on 5 October 2022).
  7. IEA. Global EV Outlook 2019; IEA: Paris, France, 2019; Available online: https://www.iea.org/reports/global-ev-outlook-2019 (accessed on 5 October 2022).
  8. Zhang, B.; Niu, N.; Li, H.; Wang, Z.; He, W. Could fast battery charging effectively mitigate range anxiety in electric vehicle usage?Evidence from large-scale data on travel and charging in Beijing. Transp. Res. Part D Transp. Environ. 2021, 95, 102840. [Google Scholar] [CrossRef]
  9. Xu, M.; Yang, H.; Wang, S. Mitigate the range anxiety: Siting battery charging stations for electric vehicle drivers. Transp. Res. Part C Emerg. Technol. 2020, 114, 164–188. [Google Scholar] [CrossRef]
  10. Varga, B.O.; Sagoian, A.; Mariasiu, F. Prediction of Electric Vehicle Range: A Comprehensive Review of Current Issues and Challenges. Energies 2019, 12, 946. [Google Scholar] [CrossRef] [Green Version]
  11. Lajunen, A.; Yang, Y.; Emadi, A. Recent Developments in Thermal Management of Electrified Powertrains. IEEE Trans. Veh. Technol. 2018, 67, 11486–11499. [Google Scholar] [CrossRef]
  12. Lajunen, A.; Yang, Y.; Emadi, A. Review of Cabin Thermal Management for Electrified Passenger Vehicles. IEEE Trans. Veh. Technol. 2020, 69, 6025–6040. [Google Scholar] [CrossRef]
  13. Croitoru, C.; Nastase, I.; Bode, F.; Meslem, A.; Dogeanu, A. Thermal comfort models for indoor spaces and vehicles—Current capabilities and future perspectives. Renew. Sustain. Energy Rev. 2015, 44, 304–318. [Google Scholar] [CrossRef]
  14. Danca, P.; Bode, F.; Meslem, A.; Croitoru, C.; Sandu, M.; Nastase, I.; Lungu, C.; Batali, L. Experimental investigation of thermal vehicular environment during the summer season. Sci. Technol. Built Environ. 2021, 28, 42–54. [Google Scholar] [CrossRef]
  15. Bode, F.; Nastase, I.; Danca, P.; Meslem, A.; Danca, P. The influence of the Inlet angle of vehicle air diffuser on the thermal comfort of passengers. In Proceedings of the 8th International Conference on Energy and Environment: Energy Saved Today Is Asset for Future, CIEM 2017, Bucharest, Romania, 19–20 October 2017; pp. 442–446. [Google Scholar] [CrossRef]
  16. Danca, P.; Nastase, I.; Bode, F.; Croitoru, C.; Dogeanu, A.; Meslem, A. Evaluation of the thermal comfort for its occupants inside a vehicle during summer. IOP Conf. Ser. Mater. Sci. Eng. 2019, 595, 012027. [Google Scholar] [CrossRef]
  17. Marshall, G.J.; Mahony, C.P.; Rhodes, M.J.; Daniewicz, S.R.; Tsolas, N.; Thompson, S.M. Thermal Management of Vehicle Cabins, External Surfaces, and Onboard Electronics: An Overview. Engineering 2019, 5, 954–969. [Google Scholar] [CrossRef]
  18. Yan, X.; Fleming, J.; Lot, R. A/C Energy Management and Vehicle Cabin Thermal Comfort Control. IEEE Trans. Veh. Technol. 2018, 67, 11238–11242. [Google Scholar] [CrossRef] [Green Version]
  19. Yang, D.; Huo, Y.; Zhang, Q.; Xie, J.; Yang, Z. Recent advances on air heating system of cabin for pure electric vehicles: A review. Heliyon 2022, 8, e11032. [Google Scholar] [CrossRef]
  20. Zhang, Z.; Wang, J.; Feng, X.; Chang, L.; Chen, Y.; Wang, X. The solutions to electric vehicle air conditioning systems: A review. Renew. Sustain. Energy Rev. 2018, 91, 443–463. [Google Scholar] [CrossRef]
  21. Horrein, L.; Bouscayrol, A.; Lhomme, W.; Depature, C. Impact of Heating System on the Range of an Electric Vehicle. IEEE Trans. Veh. Technol. 2016, 66, 4668–4677. [Google Scholar] [CrossRef]
  22. Al Faruque, M.A.; Vatanparvar, K. Modeling, analysis, and optimization of Electric Vehicle HVAC systems. In Proceedings of the Asia and South Pacific Design Automation Conference, ASP-DAC 2016, Macao, China, 25–28 January 2016; pp. 423–428. [Google Scholar]
  23. Voelcker, J. Tesla Model S 60-kWh Version: EPA Range Rated At 208 Miles. Available online: https://www.greencarreports.com/news/1080960_tesla-model-s-60-kwh-version-epa-range-rated-at-208-miles (accessed on 5 September 2022).
  24. Knibbs, L.D.; de Dear, R.J.; Atkinson, S.E. Field study of air change and flow rate in six automobiles. Indoor Air 2009, 19, 303–313. [Google Scholar] [CrossRef] [PubMed] [Green Version]
  25. Fiori, C.; Ahn, K.; Rakha, H.A. Power-based electric vehicle energy consumption model: Model development and validation. Appl. Energy 2016, 168, 257–268. [Google Scholar] [CrossRef]
  26. Farrington, R.; Rugh, J. Impact of Vehicle Air-Conditioning on Fuel Economy, Tailpipe Emissions, and Electric Vehicle Range. Available online: https://www.osti.gov/biblio/764573 (accessed on 5 September 2022).
  27. Veselý, M.; Zeiler, W. Personalized conditioning and its impact on thermal comfort and energy performance—A review. Renew. Sustain. Energy Rev. 2014, 34, 401–408. [Google Scholar] [CrossRef] [Green Version]
  28. Ibrahim, B.S.K.I.; Aziah, M.A.N.; Ahmad, S.; Akmeliawati, R.; Nizam, H.M.I.; Muthalif, A.G.A.; Toha, S.F.; Hassan, I.D.M.K. Fuzzy-based Temperature and Humidity Control for HV AC of Electric Vehicle. Procedia Eng. 2012, 41, 904–910. [Google Scholar] [CrossRef] [Green Version]
  29. Gołofit-Szymczak, M.; Stobnicka-Kupiec, A.; Górny, R.L. Impact of air-conditioning system disinfection on microbial contamination of passenger cars. Air Qual. Atmos. Health 2019, 12, 1127–1135. [Google Scholar] [CrossRef] [Green Version]
  30. Alizadeh, M.; Dhale, S.; Emadi, A. Model Predictive Control of HVAC System in a Battery Electric Vehicle with Fan Power Adaptation for Improved Efficiency and Online Estimation of Ambient Temperature. In Proceedings of the IECON Proceedings (Industrial Electronics Conference) 2021, Toronto, ON, Canada, 13–16 October 2021. [Google Scholar] [CrossRef]
  31. Reuscher, T.; Poovendran, K.; Abel, D. Model Predictive Zonal Temperature Control of a Vehicle Cabin. In Proceedings of the IEEE/ASME International Conference on Advanced Intelligent Mechatronics, AIM 2021, Delft, The Netherlands, 12–16 July 2021; pp. 37–43. [Google Scholar] [CrossRef]
  32. Van Hoof, J. Forty years of Fanger’s model of thermal comfort: Comfort for all? Indoor Air 2008, 18, 182–201. [Google Scholar] [CrossRef]
  33. Qi, Z. Advances on Air Conditioning and Heat Pump System in Electric Vehicles—A Review. Renew. Sustain. Energy Rev. 2014, 38, 754–764. [Google Scholar] [CrossRef]
  34. Peng, Q.; Du, Q. Progress in Heat Pump Air Conditioning Systems for Electric Vehicles—A Review. Energies 2016, 9, 240. [Google Scholar] [CrossRef] [Green Version]
  35. Warthmann, A.; Wölki, D.; Metzmacher, H.; van Treeck, C. Personal Climatization Systems—A Review on Existing and Upcoming Concepts. Appl. Sci. 2018, 9, 35. [Google Scholar] [CrossRef] [Green Version]
  36. Oi, H.; Yanagi, K.; Tabata, K.; Tochihara, Y. Effects of heated seat and foot heater on thermal comfort and heater energy consumption in vehicle. Ergonomics 2011, 54, 690–699. [Google Scholar] [CrossRef] [PubMed]
  37. Lee, M.-Y.; Lee, D.-Y. Review on Conventional Air Conditioning, Alternative Refrigerants, and CO2 Heat Pumps for Vehicles. Adv. Mech. Eng. 2013, 5, 713924. [Google Scholar] [CrossRef]
  38. Walgama, C.; Fackrell, S.; Karimi, M.; Fartaj, A.; Rankin, G.W. Passenger Thermal Comfort in Vehicles—A Review. Proc. Inst. Mech. Eng. Part D J. Automob. Eng. 2006, 220, 543–562. [Google Scholar] [CrossRef]
  39. Burnete, N.V.; Mariasiu, F.; Depcik, C.; Barabas, I.; Moldovanu, D. Review of thermoelectric generation for internal combustion engine waste heat recovery. Prog. Energy Combust. Sci. 2022, 91, 101009. [Google Scholar] [CrossRef]
  40. Chen, K.-H.; Bozeman, J.; Wang, M.; Ghosh, D.; Wolfe, E.; Chowdhury, S. Energy Efficiency Impact of Localized Cooling/Heating for Electric Vehicle; SAE Technical Papers; SAE International: Warrendale, PA, USA, 2015. [Google Scholar] [CrossRef] [Green Version]
  41. Burch, S.D.; Ramadhyani, S.; Pearson, J.T. Analysis of passenger thermal comfort in an automobile under severe winter condi-tions. ASHRAE Trans. 1991, 97, 247–257. [Google Scholar]
  42. Zhang, H.; Arens, E.; Huizenga, C.; Han, T. Thermal sensation and comfort models for non-uniform and transient environments: Part I: Local sensation of individual body parts. Build. Environ. 2010, 45, 380–388. [Google Scholar] [CrossRef] [Green Version]
  43. Zhang, H.; Arens, E.; Huizenga, C.; Han, T. Thermal sensation and comfort models for non-uniform and transient environments, part II: Local comfort of individual body parts. Build. Environ. 2010, 45, 389–398. [Google Scholar] [CrossRef] [Green Version]
  44. Zhang, H.; Arens, E.; Huizenga, C.; Han, T. Thermal sensation and comfort models for non-uniform and transient environments, part III: Whole-body sensation and comfort. Build. Environ. 2010, 45, 399–410. [Google Scholar] [CrossRef] [Green Version]
  45. Luo, M.; Wang, Z.; Zhang, H.; Arens, E.; Filingeri, D.; Jin, L.; Ghahramani, A.; Chen, W.; He, Y.; Si, B. High-density thermal sensitivity maps of the human body. Build. Environ. 2019, 167, 106435. [Google Scholar] [CrossRef]
  46. Parkinson, T.; De Dear, R.; Candido, C. Thermal pleasure in built environments: Alliesthesia in different thermoregulatory zones. Build. Res. Inf. 2015, 44, 20–33. [Google Scholar] [CrossRef]
  47. Pasut, W.; Zhang, H.; Arens, E.; Zhai, Y. Energy-efficient comfort with a heated/cooled chair: Results from human subject tests. Build. Environ. 2015, 84, 10–21. [Google Scholar] [CrossRef] [Green Version]
  48. Kim, J.; Bauman, F.; Raftery, P.; Arens, E.; Zhang, H.; Fierro, G.; Andersen, M.; Culler, D. Occupant comfort and behavior: High-resolution data from a 6-month field study of personal comfort systems with 37 real office workers. Build. Environ. 2018, 148, 348–360. [Google Scholar] [CrossRef]
  49. Fechete, L.; Bode, F.; Nastase, I.; Danca, P.; Croitoru, C.; Sandu, M. Thermal sensitivity maps of the human body for vehicle per-sonal comfort system design–preliminary results. In Proceedings of the 5th International Conference on Building Energy And Environment Cobee 2022, Montreal, QC, Canada, 25–29 July 2022. [Google Scholar]
  50. ISO 14505-3:2006; Ergonomics of the Thermal Environment—Evaluation of Thermal Environments in Vehicles—Part 3: Evaluation of Thermal Comfort Using Human Subjects. International Organization for Standardization: Geneva, Switzerland, 2006.
  51. ISO 10551:2019; Ergonomics of the Physical Environment—Subjective Judgement Scales for Assessing Physical Environments. International Organization for Standardization: Geneva, Switzerland, 2019.
  52. Danca, P. Ventilation Strategies for Improving the Indoor Environment Quality in Vehicles. Ph.D. Thesis, Universitatea Tehnică de Construcții București, București, Romania, 2018. Available online: https://theses.hal.science/tel-02131572 (accessed on 5 September 2022).
  53. From NEDC to WLTP: What Will Change? n.d. Available online: https://www.wltpfacts.eu/from-nedc-to-wltp-change/ (accessed on 5 September 2022).
  54. Papasavva, S.; Hill, W.R.; Brown, R.O. GREEN-MAC-LCCP®: A Tool for Assessing Life Cycle Greenhouse Emissions of Alternative Refrigerants. SAE Int. J. Passeng. Cars-Mech. Syst. 2008, 1, 746–756. [Google Scholar] [CrossRef]
  55. Bellocchi, S.; Guizzi, G.L.; Manno, M.; Salvatori, M.; Zaccagnini, A. Reversible heat pump HVAC system with regenerative heat exchanger for electric vehicles: Analysis of its impact on driving range. Appl. Therm. Eng. 2018, 129, 290–305. [Google Scholar] [CrossRef] [Green Version]
  56. Wu, J.; Zhou, G.; Wang, M. A comprehensive assessment of refrigerants for cabin heating and cooling on electric vehicles. Appl. Therm. Eng. 2020, 174, 115258. [Google Scholar] [CrossRef]
  57. Wikipedia Mitsubishi I-MiEV. Available online: https://en.wikipedia.org/wiki/Mitsubishi_i-MiEV#Battery (accessed on 25 February 2023).
Figure 1. Probe used to determine the thermal sensitivity map.
Sustainability 15 05534 g001
Figure 2. Temperature sensitivity map.
Sustainability 15 05534 g002
Figure 3. Seat with classical heating (left) and seat with targeted heating elements for persons with low body mass—red dots (grey inactive)—and persons with high body mass—red + grey dots (right).
Sustainability 15 05534 g003
Figure 4. Car seat used in experiments (A) Positioning of the heating resistances (B) An example of a heating resistance and a pressure switch used for the experimental setup.
Sustainability 15 05534 g004
Figure 5. Electrical diagram of the proposed innovative solution for seat heating (OL/OR—output left/right, L/R—left/right pressure switches).
Sustainability 15 05534 g005
Figure 6. (A) Reference solution for seat heating, P = 48.6 W, (B) Reference solution for seat heating, P = 66.0 W, (C) Reference solution for seat heating, P = 85.0 W, (D) Innovative solution for seat heating—adjustment for passenger with low body mass P = 29.4 W, (E) Innovative solution for seat heating—adjustment for passenger with high body mass P = 43.4 W.
Sustainability 15 05534 g006aSustainability 15 05534 g006b
Figure 7. Questionnaires and associated temperature scale (Adapted and reprinted with permissions from [52]. Copyright 2018, Paul Danca).
Sustainability 15 05534 g007
Figure 8. Driving time between 6:00 and 0:00 for Frankfurt and Athens [54].
Sustainability 15 05534 g008
Table 1. Equipment specifications.
Equipment NameSpecifications
Pico DC current probe TA018Input ranges (DC)
  • Low (1 mV/10 mA):10 mA to 20 A;
  • High (1 mV/100 mA): 100 mA to 60 A
PicoScope 2204A Series oscilloscopeDC accuracy
  • ±3% of full scale ± 200 μV
Lutron TM-946 thermometerWith type K sensor
  • 1 °C resolution: 1000 to 1370 °C, accuracy: ±(0.5% + 1 °C);
  • 0.1 °C resolution: −199.9 to 999.9 °C, accuracy: ±(0.5% + 1 °C)
Lutron type K TP04 temperature probeMeasuring Range
  • −50 to 400 °C, accuracy: ±(0.75% + 0.5 °C)
Hantek PP80 oscilloscope probeInput resistance
  • 1 MΩ: 10 MΩ
Input capacitance
  • ×1: 85Pf–115pF;
×10: 18.5pF–22.5pF
Input voltage
  • ×1: <200V DC + Peak AC;
x10: <600V DC + Peak AC
Flir E30 thermal imaging cameraTemperature domain
  • −20 to 120 °C (buildings);
−20 to 350 °C (maintenance)
Accuracy
±2%
Thermal sensitivity
  • <0.1 °C
Table 2. Measurement data related with the seat setups.
CaseSolution SetupNominal Voltage [V]Current [A]Power [W]
AReference solution—low heat104.8648.6
BReference solution—medium heat125.566
CReference solution—high heat13.86.1785
DInnovative solution—low heat102.9429.4
EInnovative solution—high heat104.3443.4
Table 3. Preliminary results for human subjective thermal sensation tests (gender and age).
ABCDE
Power Consumption [W]48.666.085.029.443.4
Male, 4202323
Male, 4712323
Female, 2612223
Male, 5622303
Male, 6422302.5
Male, 36 12203
Male, 3712203
Male, 2922203
Table 4. HVAC power consumption [40].
Temperature [°C]PHVAC [kW]
−104.58
01.83
101.54
Table 5. Driving distance and time data for Frankfurt and Athens [54].
Driving Time/YearFrankfurtAthens
Driving distance [km]14,23114,231
Driving time [h]431431
Driving time [s]1,551,6001,551,600
Vehicle lifetime [yrs]1010
Table 6. Vehicle occupancy [40].
No. of SeatsWeight [%]
169
221
≥310
Table 7. Estimated range increase for Frankfurt weather and driving conditions.
Frankfurt
Temperature [°C]Time [s]Distance [km]HE * [kW]HE Low * [kW]HE High * [kW]Range
(no HVAC) [km]
Range (HVAC) [km]Range Variation
124124
≤2170,6761565.413.213.193.173.133.183.163.1194.2267.0329%
3–11605,1245550.091.691.671.651.611.661.641.5994.2277.6518%
12–20574,0925265.470.390.370.350.310.360.340.2994.2289.845%
Temperature [°C]Range gain low
[km/WLTC]
Range gain high [km/WLTC]Range gain low
[km/year]
Range gain high
[km/year]
124124124124
≤20.120.230.470.140.270.557.8115.6531.419.2018.4437.02
3–110.160.310.630.180.370.7437.1974.53149.6743.7987.79176.42
12–200.210.420.840.250.490.9947.2494.70190.2955.63111.56224.35
TOTAL0.730.86139.61 (1.13 %) **164.46 (1.33%) **
* HE—Heating energy; HE low—HE for the low temperature setting of the seat heating system; HE high—HE for the high temperature setting of the seat heating system. ** The values were evaluated with respect to the driving distance covered by the driver in cold conditions.
Table 8. Estimated range increase for Athens weather and driving conditions.
Athens
Temperature [°C]Time [s]Distance [km]HE * [kW]HE Low * [kW]HE High * [kW]Range
(no HVAC) [km]
Range (HVAC) [km]Range Variation
124124
≤2003.213.193.173.133.183.163.1194.1867.00−29%
3–11263,7722419.271.691.671.651.611.661.641.5994.1877.62−18%
12–20589,6085407.780.390.370.350.310.360.340.2994.1889.80−5%
Temperature [°C]Range gain low
[km/WLTC]
Range gain high [km/WLTC]Range gain low
[km/year]
Range gain high
[km/year]
124124124124
≤20.140.260.500.170.300.580.000.000.000.000.000.00
3–110.190.350.660.220.400.7719.6935.9868.7422.5741.7680.41
12–200.250.460.880.280.531.0357.52106.29204.5066.14123.61239.50
TOTAL0.830.96110.48 (1.41 %) **127.93 (1.63%) **
* HE—Heating energy; HE low—HE for the low temperature setting of the seat heating system; HE high—HE for the high temperature setting of the seat heating system. ** The values were evaluated with respect to the driving distance covered by the driver in cold conditions.
Disclaimer/Publisher’s Note: The statements, opinions and data contained in all publications are solely those of the individual author(s) and contributor(s) and not of MDPI and/or the editor(s). MDPI and/or the editor(s) disclaim responsibility for any injury to people or property resulting from any ideas, methods, instructions or products referred to in the content.