Article

An Agent-Based Model for Land-Use Change Adaptation Strategies in the Context of Climate Change and Land Subsidence in the Mekong Delta

by
Quang Chi Truong
1,2,*,
Alexis Drogoul
2,3,
Benoit Gaudou
3,4,
Patrick Taillandier
2,3,5,
Nghi Quang Huynh
2,6,
Thao Hong Nguyen
7,
Philip Minderhoud
8,9,10,
Ha Nguyen Thi Thu
11 and
Etienne Espagne
12
1
CENRES, Can Tho University, Can Tho 94100, Vietnam
2
UMI 209, UMMISCO, IRD, Sorbonne University, 93143 Bondy, France
3
ACROSS International Joint Laboratory, IRD/Thuyloi University/HAU/IRIT, Hanoi 11500, Vietnam
4
UMR 5055, IRIT, Université Toulouse Capitole, 31042 Toulouse, France
5
UR 875, MIAT, INRAE, 31320 Toulouse, France
6
CIT, Can Tho University, Can Tho 94100, Vietnam
7
Faculty of Agriculture, Can Tho Technical Economic College, Can Tho 94100, Vietnam
8
Soil Geography and Landscape Group, Department of Environmental Sciences, Wageningen University, 6708 PB Wageningen, The Netherlands
9
Department of Civil, Environmental and Architectural Engineering, University of Padova, 35131 Padova, Italy
10
Department of Subsurface and Groundwater Systems, Deltares Research Institute, 3584 BK Utrecht, The Netherlands
11
LASTA, University of Rouen, 76130 Rouen, France
12
Research Department, AFD, 75598 Paris, France
*
Author to whom correspondence should be addressed.
Sustainability 2023, 15(6), 5355; https://doi.org/10.3390/su15065355
Submission received: 20 December 2022 / Revised: 9 March 2023 / Accepted: 10 March 2023 / Published: 17 March 2023

Abstract

:
The Mekong Delta region has been seriously affected by climate change, with increasing temperatures, sea-level rise, and salinization strongly impacting agricultural activities of the region. Recent studies have shown that groundwater exploitation also contributes significantly to land subsidence throughout the delta. Thus, combating climate change now makes it necessary to design strategies and policies for adapting to and mitigating climate change and subsidence, not only at the individual level (mainly farmers), but also at the institutional level (province and region). This study aims to build an integrated model for the purpose of exploring the socio-economic impact of adaptation strategies provinces choose under various climate and economic scenarios. The LUCAS–GEMMES model (an agent-based model for strategies for adapting to land-use change in the context of climate change) was developed in order to evaluate socio-economic factors, climate, and water use by farmers, as well as the subsidence dynamics and macroeconomic trends in land-use selection strategies. The simulations are carried out according to four main scenarios: (i) lack of provincial adaptation strategies and absence of subsidence dynamics, (ii) lack of adaptation strategies though subsidence and the impact of land-use production benefits, (iii) purely individual adaptation strategies combined with the impact of subsidence, and (iv) provincial and individual-scale adaptation combined with the impact of subsidence. In all the scenarios that consider subsidence, our results show that early response decisions to even low-level subsidence lead to many positive outcomes in water resource management, such as a significant reduction in water-use in the dry season and a reduction in the area vulnerable to subsidence and climate change. However, the same results also indicate a possible decrease in farmers’ income due to reduced agricultural seasons and restricted land-use transformation, which demonstrates the importance of modeling the multi-sectoral aspects of adaptation. Finally, at a more general level, in the fourth scenario, the model clearly shows the benefits when provinces located in the same agro-ecological zone harmonize strategies, thus paving the way for defining integrated land-use policies at the regional level.

1. Introduction

The Mekong Delta is increasingly exposed to climate and environmental changes (rising temperatures, precipitation changes, increasing saline water intrusions, decreased availability of fresh water, etc.) triggered by both global climate change and anthropogenic activities in the delta or upstream in the Mekong River basin [1]. This is already severely affecting agriculture and aquaculture, which are the main activities in the delta.
Planners are being asked to develop plans at the regional level to adapt to or to mitigate the impacts of unavoidable changes and support the region’s sustainability by encouraging resilient adaptation of ecosystems, communities, and infrastructure. This involves a variety of interventions, including new infrastructure development, better land- and resource-use planning, financial incentives, and crop and land-use diversification. Alongside a region’s planned adaptation strategies, farmers of the region are implementing individual strategies mainly driven by their perception of environmental change (e.g., switching from rice to aquaculture in response to salinization) or economic opportunities (e.g., switching to intensive agriculture to benefit from good market conditions). However, individual strategies may be incompatible with those of planners, or even contradictory, and are rarely generalizable on a regional scale, but they are one of the major forces in the overall adaptation process and cannot be overlooked [2].
In addition, and although land-use change in the Mekong Delta is guided by 10-year plans, the literature has shown that land use can be explained by the dominance of these individual choices, interacting with local environmental and socio-economic factors [3,4].
Regarding the impact of climate change on land use, many studies have assessed the impact of mainly sea-level rise on agriculture in the Mekong Delta and made adaptation recommendations for both farmers (local level) and the government (national level) [5]. In some of these studies, adaptation policies were evaluated through the scenarios in the models [6], which were themselves derived from numerical simulation results of climate change impacts. Assuming that the main actors of change were farmers, many farmers were encouraged to take relatively drastic measures to modify agricultural practices or land use so as to reduce and minimize the impact of upcoming changes on their incomes [7,8].
Additionally, increasing saltwater intrusion due to subsidence and sea-level rise strongly affects the agriculture and aquaculture activities in the Mekong Delta [1]. Though groundwater extraction partially compensates for this vulnerability and allows the continued implementation of a policy of agricultural intensification, it actually worsens the situation by increasing the subsidence of the delta [9], exacerbating saline intrusion and threatening crop production. The Government of Vietnam has guidelines for the region to manage groundwater depending on the state of the aquifer zones, to facilitate the construction of retention basins [10,11], or to reduce the production of crops that require excessive amounts of fresh water in certain seasons. However, these initiatives face major obstacles because provinces may be located at the confluence of extremely different agro-ecological zones, and it is difficult to design a single policy for the whole region. Provinces located in the same agro-ecological zone would ideally require concerted policies related to groundwater exploitation.
Regarding climate change adaptation, several authors have considered how to better assist authorities in identifying acceptable adaptation methods in an increasingly uncertain world by providing dynamic land-use adaptation pathways [12,13] (which require steps such as assessing vulnerability, defining adaptation, and reviewing and updating investment plans every year by evaluating the current impact of climate change) for replacing conventional planning (a 10-year plan with a 5-year reassessment). These innovative planning methods give us the ability to adapt more swiftly to changes. Therefore, despite the fact that all experts concur that the Mekong Delta would need to drastically adjust its land use in order to adapt to the effects of climate change, so far, there are not enough resources available to actually support a scientific approach to this transformation.
Many models dynamically analyze land-use changes under the impact of climate and environmental changes. Some such models are those based on GIS, statistical approaches, cellular automata [14], ANN [15], and agents [2,16,17]. However, few of these models support the simultaneous inclusion of climate change, land subsidence, and policy factors. To simulate land-use change, Truong et al. [18] introduced the first version of a model called Land-Use Change for Adaptation Strategies (LUCAS), a spatially-explicit agent-based model [19] that covers the entire Mekong Delta. The farmers, represented by agents, who decide what kind of land use to choose for their agricultural plots, are the principal entities of the model. Their decision is primarily based on personal factors (such as profitability, land suitability, capacity for conversion to other land uses, and the influence of other farmers). They choose an adaptation approach taking into consideration each parcel’s risk exposure to changing temperature, precipitation, and salinity. The LUCAS model provides a proof-of-concept framework that should allow future researchers to investigate and evaluate various combinations of adaptation policies that balance bottom-up and top-down dynamics. However, it focuses only on environmental changes directly linked to climate change (temperature, precipitation, global sea-level rise, etc.), and omits many other important ones, particularly the strong future impact of land subsidence. Finally, indicators of the models are limited to land-use evolution and distribution, without investigating closely related economic indicators. These two main aspects are the core improvements provided by the LUCAS–GEMMES model.
The objective of this paper is to explore the combinations of province-level policies and individual adaptation strategies that may be sustainable under a number of climate change and subsidence scenarios. In particular, we are interested in understanding the impact of different forms of coordination (or lack thereof) between actors in the system on the system’s overall sustainability, as expressed in terms of average farmer income and losses.
The extension of LUCAS, namely LUCAS–GEMMES, presented and explored in this paper, reinforces the economic dimension of the model by allowing farmers to take out loans to invest in land-use changes beyond their initial financial capacity. More importantly, it strengthens the ability of provinces to influence individual adaptation strategies according to the agro-ecological zone for which they are responsible, and the level of subsidence measured; policies available to provinces can include prohibiting certain land uses in order to limit, or even prevent, water pumping. The subsidence thresholds at which these policies are triggered, and the coordination between provinces in choosing these thresholds, were among the elements we wanted to measure in terms of importance and relevance in order to provide concrete recommendations. Our model allows modelers to explore various combinations of joint or coordinated decisions on the provincial scale. Various experiments were carried out that detailed the interactions and feedback between provinces and farmers’ decision-making processes in a number of scenarios, which allowed us to identify the strategies that appear to be the most sustainable in financial terms and in terms of coordination between provinces, on the scale of the Mekong Delta.

2. Materials and Methods

2.1. Overview of the Model

An extension of the LUCAS model [18], the LUCAS–GEMMES model presented in this paper incorporates some of the results of the GEMMES (https://www.afd.fr/en/gemmes-vietnam-analysis-socio-economic-impacts-climate-change-vietnam-and-adaptation-strategies, accessed on 12 December 2022) project in terms of subsidence and macroeconomics trends. Adaptation strategies of each province are now spatially heterogeneous, depending on the agro-ecological zone (AEZ) and the subsidence of the area. The economic model of farmers as agents now integrates the interest rate dynamics of the GEMMES model [20]. Finally, key indicators are debt and benefits for farmers.

2.1.1. Purpose of the Model

The objective of the model is to investigate spatially heterogeneous adaptation strategies of provinces in the Mekong Delta (taking subsidence and AEZ into account) in terms of water pumping and interaction with farmers’ land-use change decisions in the context of climate change. For this purpose, coordinated/uncoordinated decisions among provinces will be explored.

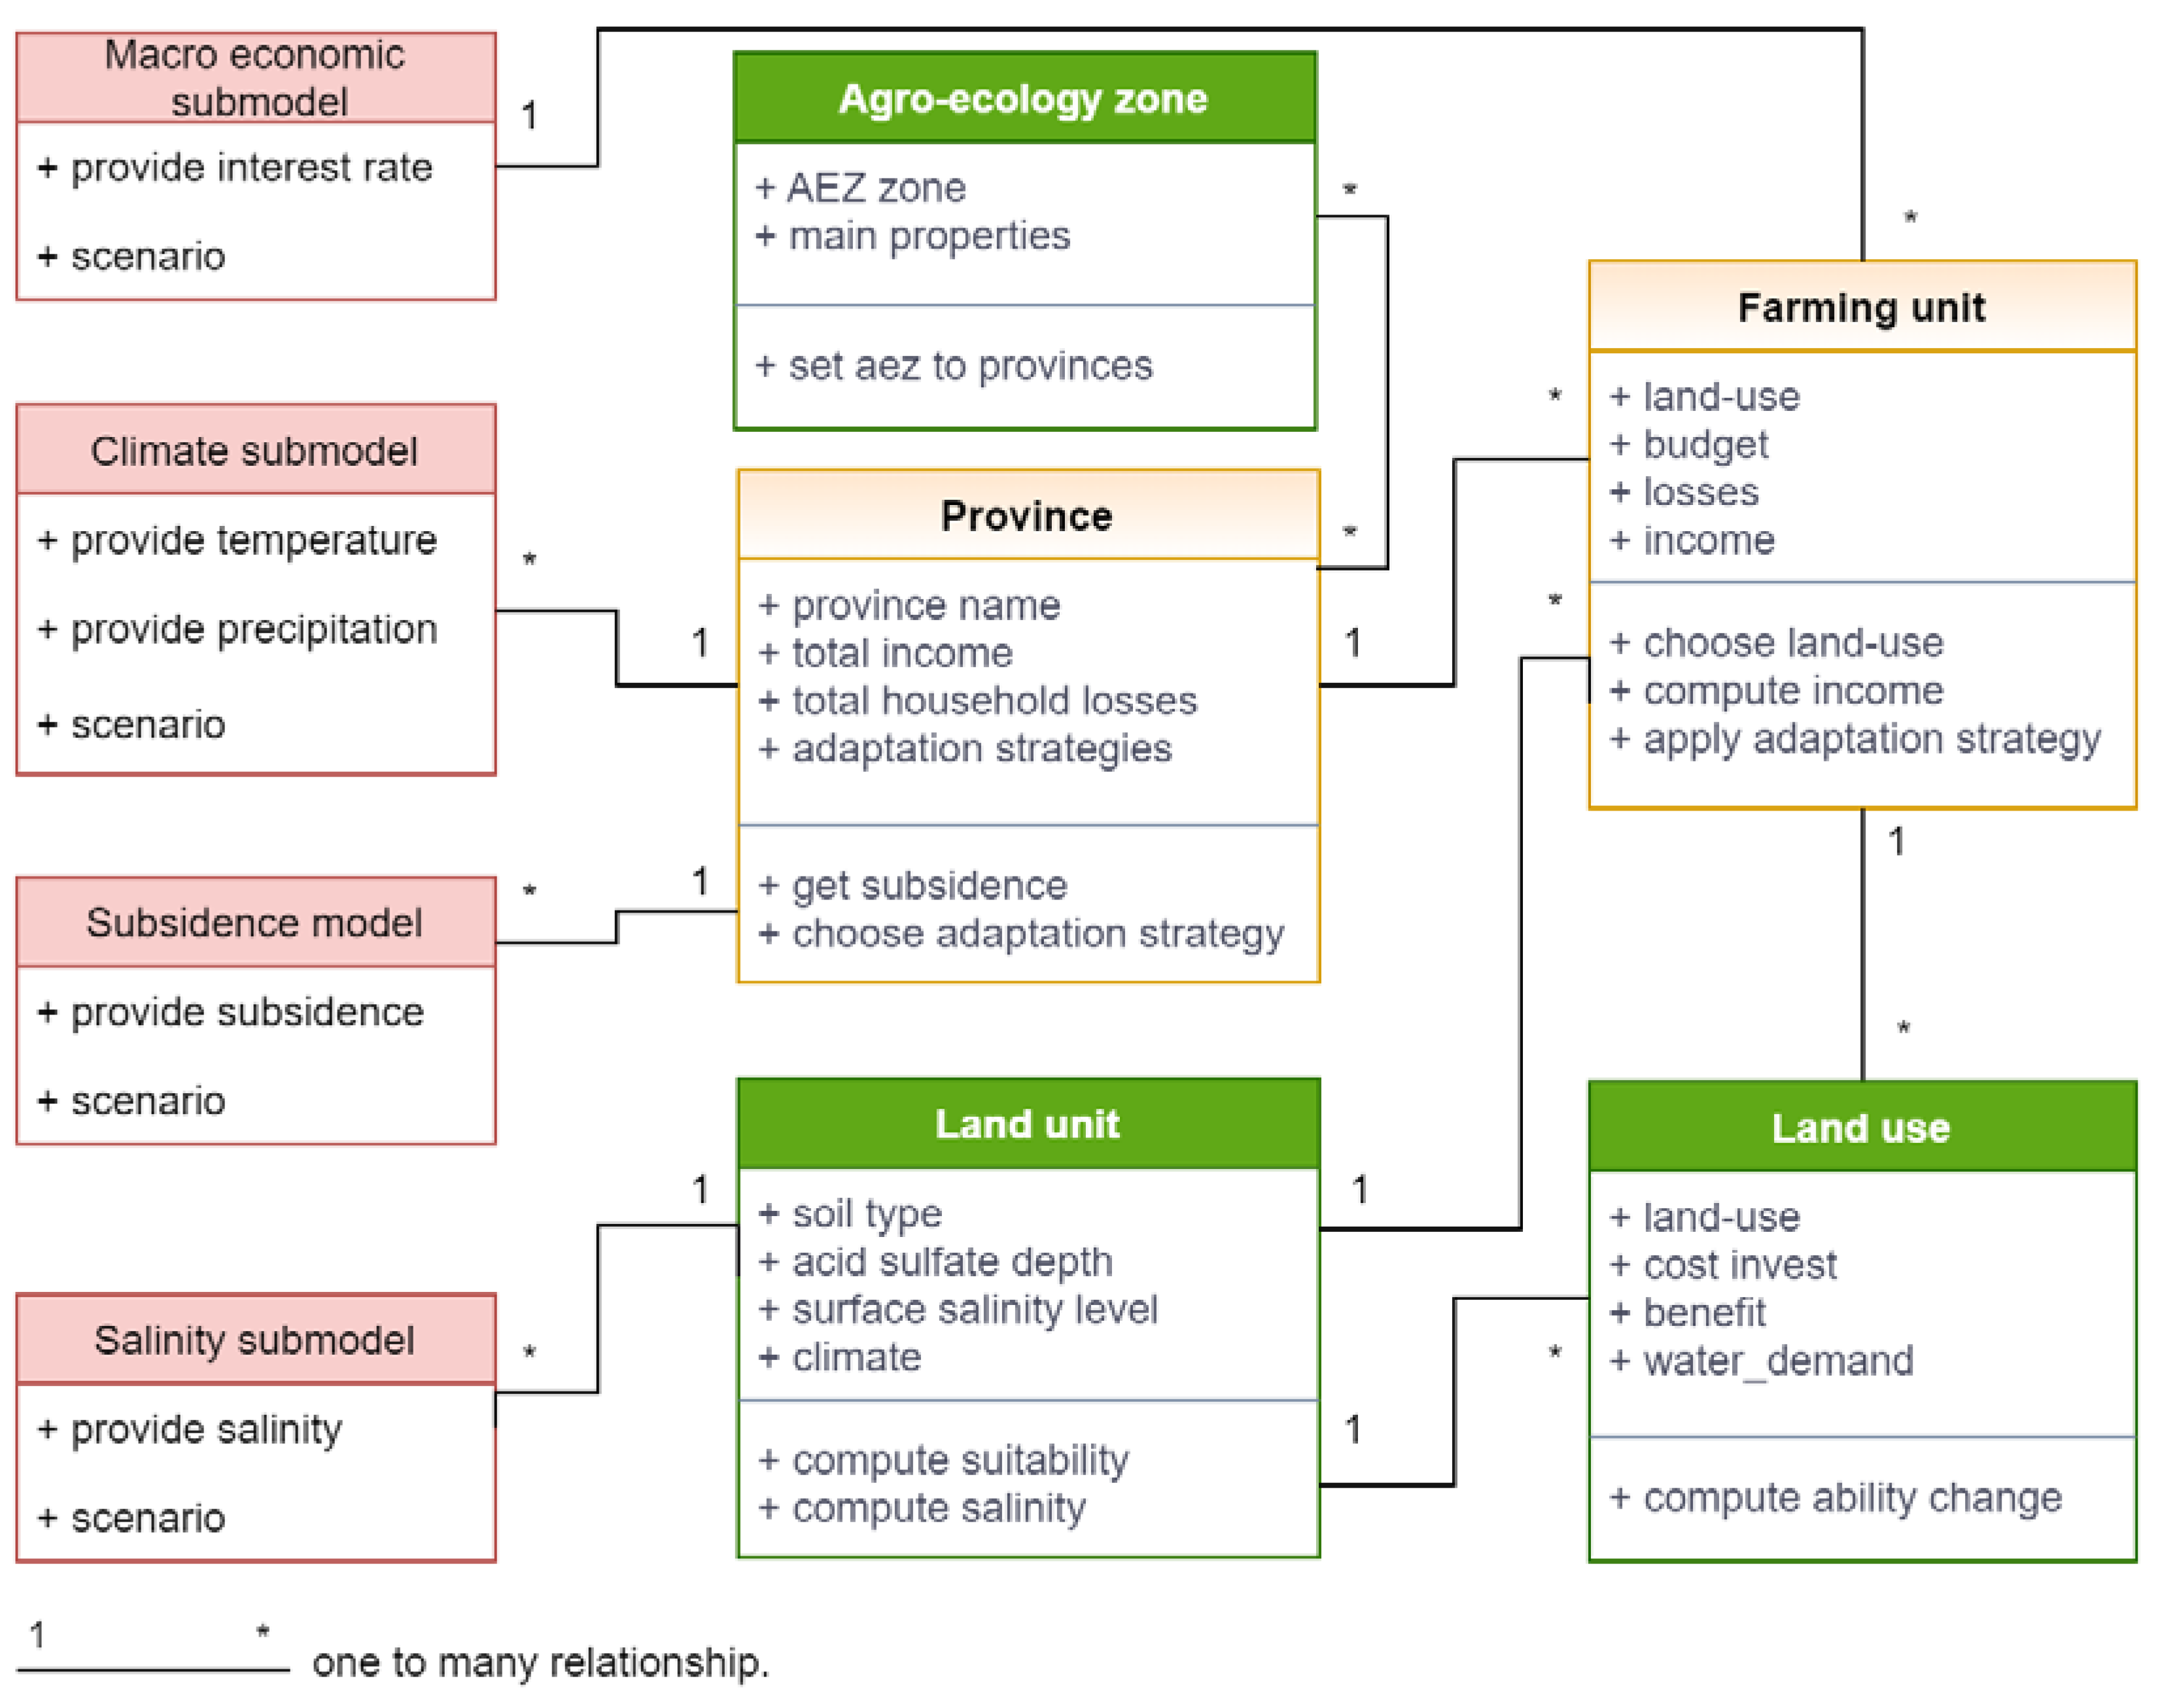
2.1.2. Entities, State Variables, and Scale

Figure 1 provides a static description of the agent types in the model. The model consists of two types of pro-active agents that can make decisions at each simulation step: the farming units and the provinces. In addition, it contains two types of passive entities that are spatially located: the agro-ecological zone (AEZ) that provides properties for different types of agriculture activities, and the land unit that provides detailed properties of soil texture, soil constraint water, and salinity. Finally, the model is completed with a non-spatial entity: the land use that provides information about the various land-use characteristics. In this model, we limit ourselves to the six dominant land uses of the Mekong Delta: 3 rice (or 3 rice crops per year), 2 rice (or 2 rice crops per year), vegetables, aquaculture (shrimp), fruit trees, and rice-shrimp.
The farming unit is the key entity of the model. It represents both the farmer (with decision-making capabilities) and his or her agricultural parcel, which contains a land-use type. The farming unit is represented as a 500 m × 500 m cell (the resolution depends on the input data). It is located in a province and a land unit and characterized by individual annual income linked to cultivation activities, as well as losses due to the impact of climate change.
A province entity is characterized by its name, location and spatial extent, and total budget for loan to farmers each year. The province is located in one or several agro-ecological zones. Thus, it will be able to choose an adaptation strategy for each of its farming units depending on the AEZ and the land subsidence threshold. Each strategy is defined as a list of permitted and prohibited land uses for the threshold in each AEZ.
All these agents are embedded in a global environment that defines global variables and, in particular, provides data obtained from exogenous submodels, such as interest rate (macroeconomic submodel), map of temperature and precipitation (climate submodel), map of cumulated land subsidence (subsidence submodel), and dry-season surface water salinity map (salinity submodel).
The spatial resolution for the farming unit is set to 500 m × 500 m. Each simulation step lasts one year. The simulation starts in 2015 and stops in 2050.

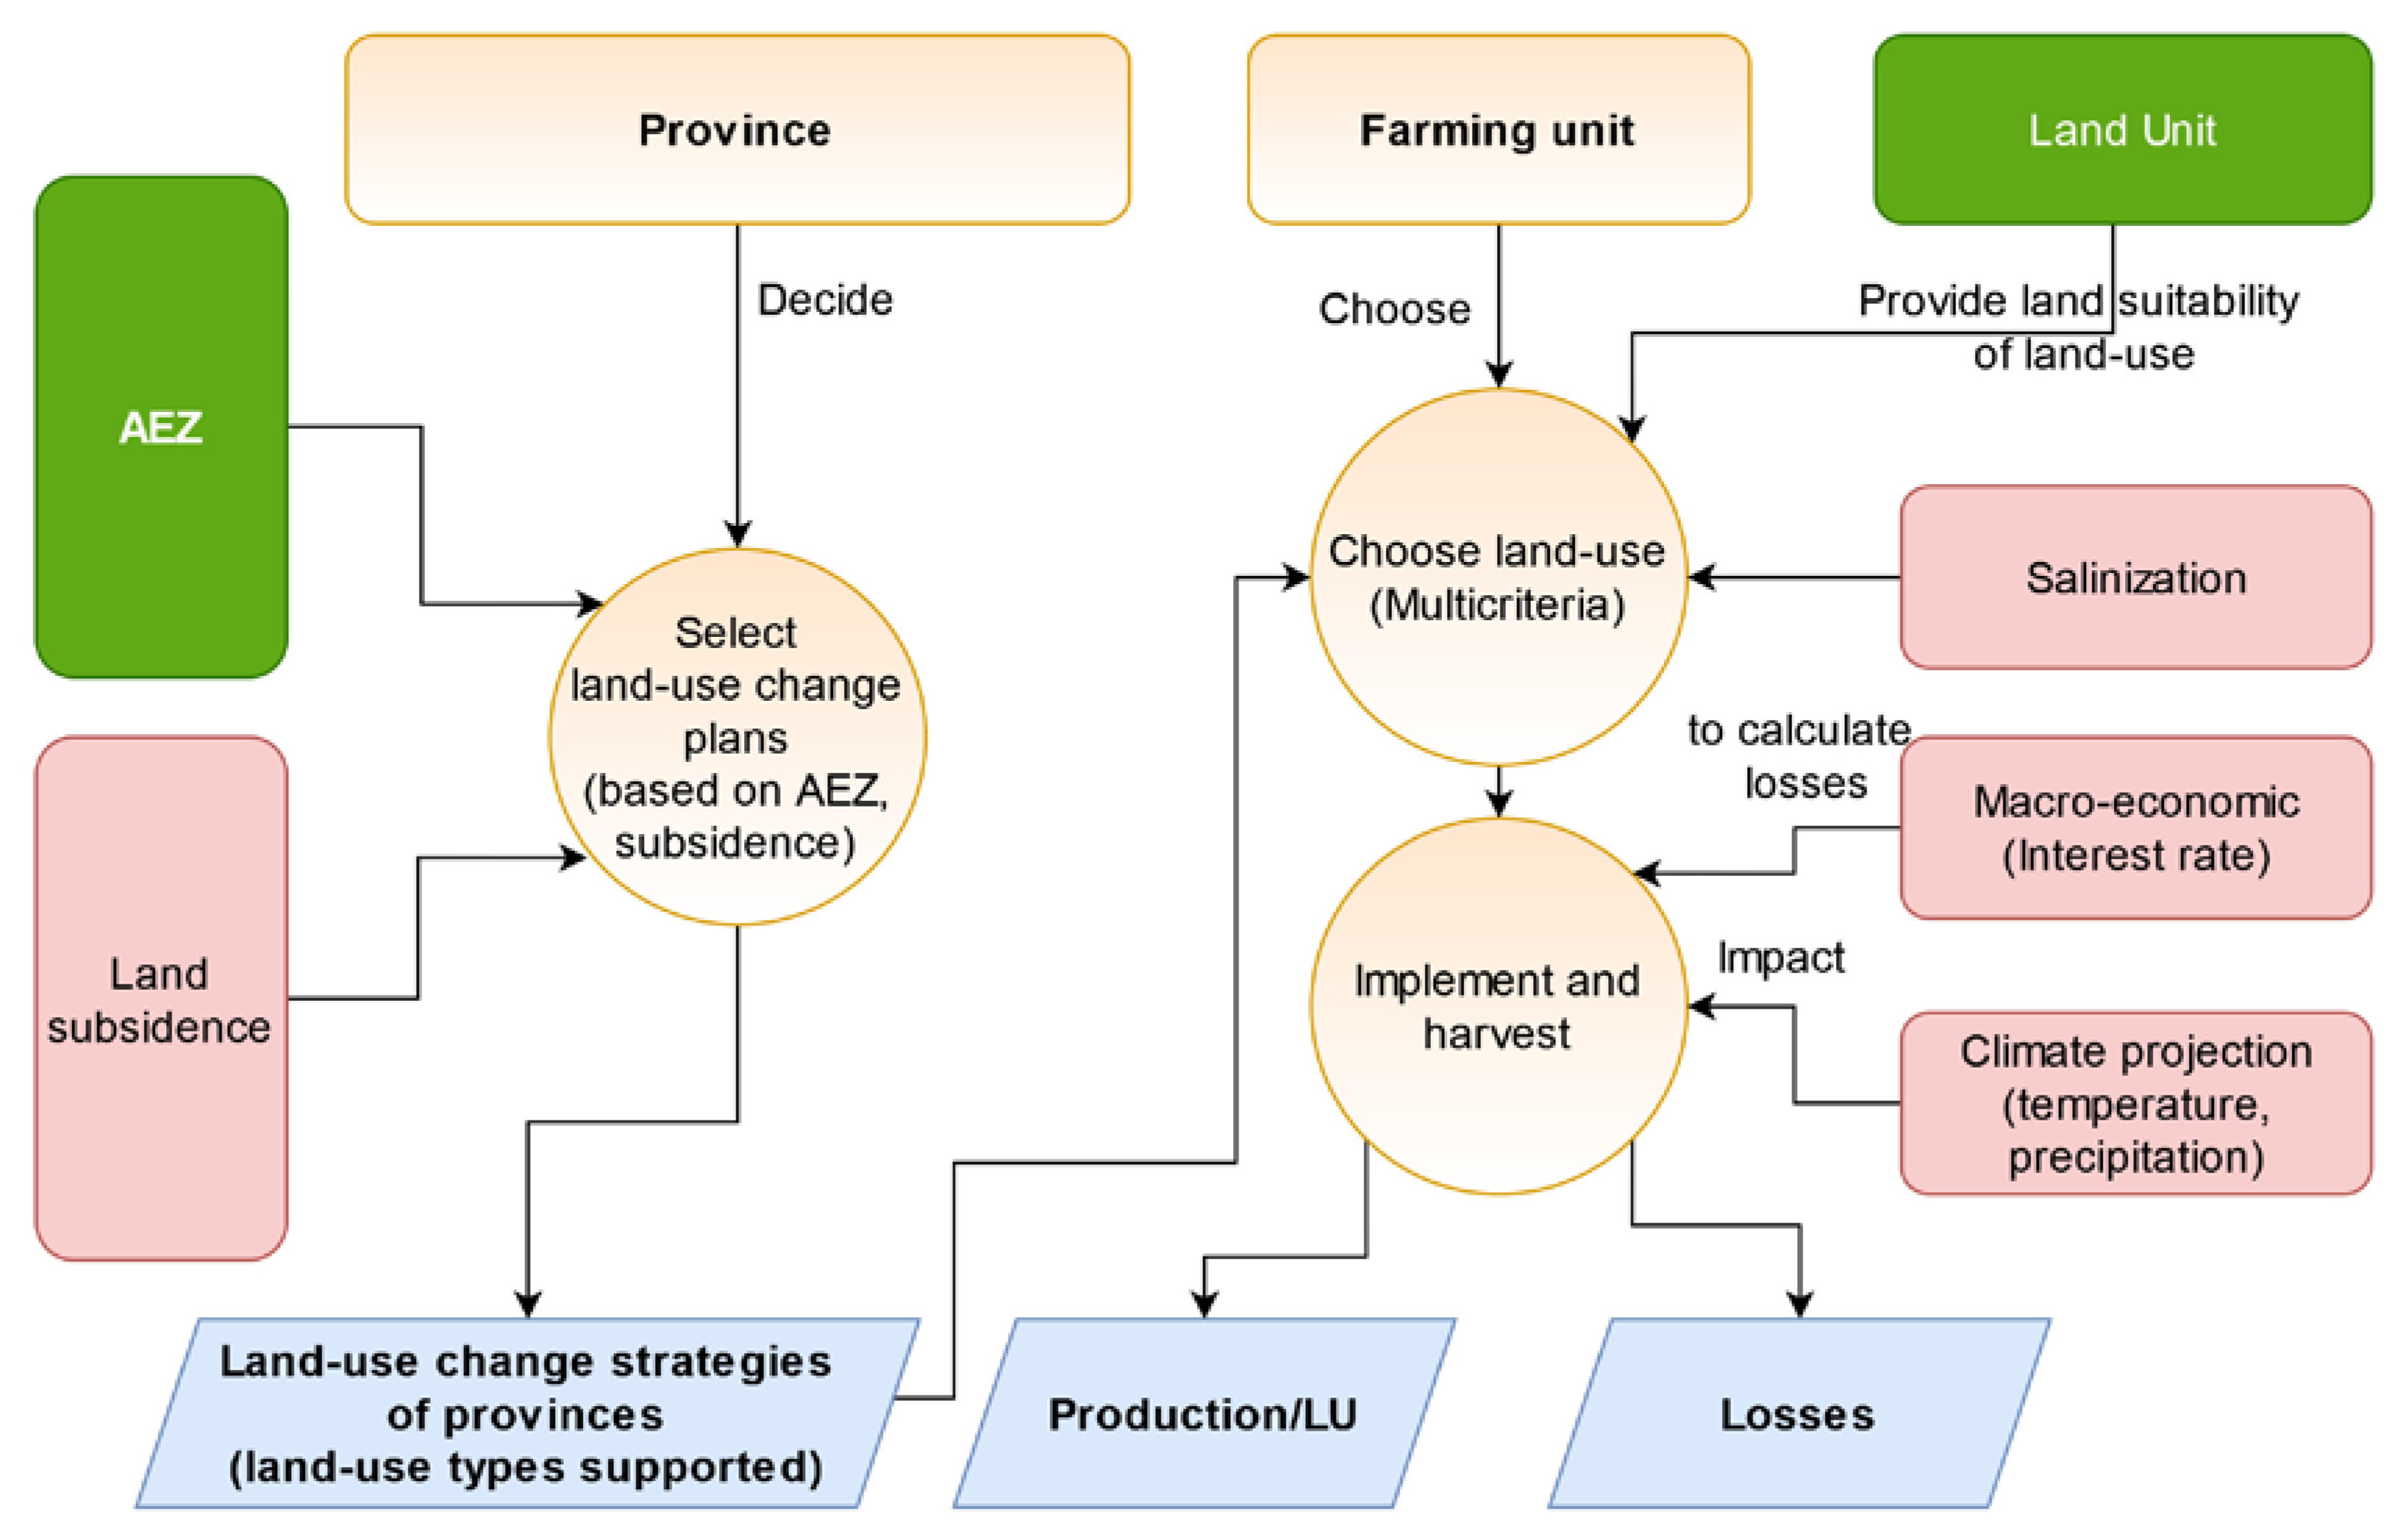
2.1.3. Process Overview

Figure 2 details the main processes of the LUCAS–GEMMES model. During a simulation, the global data from exogenous models are updated with a frequency depending on the submodel: subsidence maps are updated every 10 years, macroeconomic and climate data are updated yearly, and the salinity map is updated every 20 years. From these updated data, exposed areas (i.e., areas where climate and salinity conditions are beyond the tolerance levels of rice and shrimp [18]) are computed. Concerning the impact of subsidence, we assume that, beyond some thresholds, cumulated subsidence will impact agricultural production by decreasing farmer income.
Provinces choose adaptation strategies for land-use change, allowing or prohibiting the switch of land use to other land uses depending on the AEZ and the land subsidence situation. Each province can have one or more strategies as per the AEZ and the situation of land subsidence (living with floods, living with floods but saving groundwater, etc.). For each AEZ, the province chooses the land uses allowed depending on the land subsidence threshold of the area. This choice corresponds roughly to allowing or not allowing farmers to pump groundwater for agricultural activities. As the subsidence maps are updated every 10 years (depending on the input data source [9]), the strategies are reevaluated with the same frequency, which corresponds to the plan period in Vietnamese land-use planning.
Finally, farming units select land-use candidates from the ones allowed by the strategy of the province (policy) and then choose the land use according to multicriteria decisions based on land unit, income, ability to change (technically), and impact on neighbors (land use of neighbors). To change or maintain the current land use, farming units have a budget but may need an additional budget if they decide to change land-use type; if so, they ask for a new loan (depending on the interest rate). At the end of each year, farming units update their budget and income. A farming unit impacted by climate conditions will lose the income of the year, and individual losses increase in line with cost of implementation. The province updates total household losses at the end of each year.
At the end of each year, the model provides a land-use map, total area for each land-use type, total income from agriculture activities, water demand, and losses caused by climate change and subsidence by province (for each of its AEZ) and for the whole delta.

2.2. Implementation of the LUCAS–GEMMES Model

2.2.1. Input Data

Input data of the LUCAS–GEMMES model included the data from the LUCAS model presented in Truong et al. [18]: land-use map in 2015, land unit map, and dry-season salinity maps for 2030 and 2050 under the RCP 8.5 scenario (taking into account global sea-level rise and fluvial discharge changes) [21]. Temperature and precipitation data for Vietnam were down-scaled (by Tran Anh et al. [22]) to 25 km × 25 km using the bias-corrected spatial disaggregation (BCSD) statistical technique using 35 CMIP6 global climate models (scenario SSP5-8.5). As our goal was to analyze the worst impact of climate change, we used the data of 35 climate models to construct the monthly maximum and minimum temperature and the monthly maximum and minimum total precipitation from 2016 to 2050.
Additional data included the provinces and agro-ecological zones, land subsidence map, and economic data (price and interest rates).
We resampled all the raster data (land uses, subsidence, salinity map, etc.) with the nearest neighbor method for the same resolution, which is 500 m × 500 m for each pixel.

2.2.2. Provinces and Agro-Ecological Zones

To initialize the related entities, we used province and agro-ecological zone spatial data (Figure 3), which is generated based on Bong et al. [7]. The province is the key administrative level in Vietnam. Note that we focused only on the Mekong Delta (i.e., the continental part of the provinces), and the model did not consider islands such as Phu Quoc, Con Dao, and Nam Du, though they are a part of the provinces under consideration. Agro-ecological zones were defined to be homogeneous areas in terms of ecological and agricultural features.
The two types of entities are spatially related: a province contains 1 to 3 parts of the different AEZs.

2.2.3. Land Subsidence and Water Demand as per Land Use

Minderhoud et al. [9] showed the importance of land subsidence for the future evolution of the Mekong Delta and the fact that it can have stronger and faster effects than climate-change-induced global sea-level rise, at least for the first half of the century. Another important conclusion of that work was that the main driver of current high subsidence rates recorded in the delta is groundwater extraction. Minderhoud et al. [9] simulated land subsidence in the Mekong Delta up till the year 2100 using several scenarios of groundwater extraction pathways, where B2 stood for annual growth corresponding to 4% of the 2018 volume; B1 was for annual growth corresponding to 2% of the 2018 volume; M1 was for 0% growth after 2020; and M2, M3, and M4 stood for the gradual reduction in water extraction to, respectively, 50%, 25%, and 0% of the 2018 volume. In our model, we focused on the non-mitigation scenarios (B2), using a raster data file for every 10 years (2020, 2030, 2040, and 2050) containing the cumulated land subsidence of the whole delta.
Table 1 presents the freshwater demand of plants during the dry season under different land-use types based on previous studies. The timescale of water demand is not the same, because some land-use types, such as 3 rice crops and vegetables, need fresh water for 3 months in the dry season, while fruit trees need water continuously during the whole season. When 3 rice crops are sown one after the other, the winter–spring crop, during the 3 months, needs around 7500 m3 of fresh water based on Vietnam standard calculation [23] (the remaining 2 crops in the year are cultivated in the rainy season). For vegetables in the dry season, the water requirement for a typical 80-day crop (the period corresponding to most crops) is 4658 m3 [24]. For fruit trees, the water demand depends on the tree type and age. We have chosen several fruit varieties (such as grapefruit, mango, and longan) that require 13,200 m3 of water in 6 months of the dry season [25].

2.2.4. Economic Data

As presented by Truong et al. [18], when deciding on the land-use type to implement in their farming units, farmers focus on the cost and benefit of each land use in a multi-criteria decision-making process.
Previous studies [26,27] have surveyed the benefits and costs of main land-use types in the Mekong Delta, as shown in Figure 4. In most land-use types, costs are lower than profits, the exception being vegetables and aquaculture. Even though fruit trees and aquaculture provide the highest profit, aquaculture loses out in terms of profit because the cost of shrimp cultivation is 3 to 9 times higher than that of other land-use types. In terms of labor, vegetables require the highest number of labor days in a year, followed by aquaculture, while the remaining crops require fewer working days.
The cost of land-use implementation for farming units is based on the cost of each land-use type and the cost of the credit that could be necessary. The latter is highly dependent on the interest rate. The model thus uses a projection of interest rate evolution developed in the framework of the GEMMES project provided by Espagne et al. [20]. This variable enables losses to be calculated if climate change, saline water intrusions, or land subsidence impact the area.

2.2.5. Parameters and Indicators

The LUCAS model comes with a set of parameters (presented in Table 2) related to the farmer’s decision-making process (the weights related to each criterion) and the tolerance of crops to temperature and precipitation. These parameters have been calibrated by Truong et al. [18] on land-use data.
The LUCAS–GEMMES model introduces one additional parameter that will be explored by simulation: the subsidence threshold used in the province and individual decision-making processes.
The climate scenario and the subsidence scenario could also have been parameters. However, to limit the computation time, we have chosen a single climate scenario and a single land subsidence scenario (the worst case).
The LUCAS–GEMMES model aims to evaluate the effects of strategies adapted by farmers and/or guidance by provinces on land-use distribution. To this end, it suggests several indicators related to the distribution of each land use in the delta, the exposed and vulnerable areas, and the total amount of losses and benefits for farmers.
Land-use maps and land-use area
To observe the evolution of the spatial distribution of each land-use type, the first indicator the LUCAS–GEMMES model provides is a map of land use as a raster map: each pixel (corresponding to a farming unit) is displayed with a color representing its land-use type, selected from 3 rice crops, 2 rice crops, annual crops, fruit trees, aquaculture, forest, and rice-shrimp (i.e., aquaculture). This map also displays the province boundaries for ease of analysis on that scale.
From this spatial data, we provide an aggregated indicator that helps to quantify the evolution of each land-use area, that is, the surface of each land-use type on the scale of the whole delta. Even though it is not used here, more precise indicators could be computed if there were ever a need to analyze the evolution of land-use types on the scale of a province, a district, etc.
Exposure evaluation and vulnerability maps.
To identify the areas that environmental changes may particularly impact, the LUCAS–GEMMES model computes whether a farming unit is exposed (in which case, environmental conditions may damage the crop). Here, we consider only the effects of changes in temperature, precipitation, and salinity intrusions due to climate change. Two types of land use are distinguished: rice culture (3 rice crops) and aquaculture (shrimp).
For rice cultivation, if a relevant farm is located in an area protected by dyke systems but the maximum monthly dry season temperature (from December to May) exceeds the rice tolerance threshold and rainfall is below the precipitation tolerance threshold, the crop is considered to be at risk, or exposed. Aquaculture farms are assessed as being at risk when rainfall is above the cut-off threshold (reducing the salinity of the basins). From this information, a vulnerability map can be plotted. To simplify the visualization, we display only exposed pixels with aquaculture (in blue) and rice crops (in red).
Water demand under various land-use types.
As highlighted by Minderhoud et al. [9], groundwater pumping is a highly significant factor in predicting the evolution of land subsidence in the Mekong Delta. To estimate the evolution of groundwater pumping volumes under the influence of the adaptation strategies, we computed the evolution of the water demand index for agricultural purposes depending on the land-use type, with the goal being to provide an overview of water availability based on water volumes estimated from usage patterns. This indicator enables us to assess the overall water demand of the options, allowing us to consider the water-saving aspect of the experiments. The calculation of this indicator is not intended to be accurate in terms of either the amount of water used according to FAO Penman–Monteith [28] or the impact of climate change on the water demand of crops. Therefore, this indicator in LUCAS–GEMMES is defined as the annual dry-season water requirements as per land-use patterns in the study area based on reference sources (Table 1).
Income from agricultural activities and losses triggered by climate change and subsidence.
To assess the economic impact of land subsidence and the application of the various adaptation strategies, we have implemented two economic indicators: (1) The total income of the farmers, computed from all the crops in the Mekong Delta. Incomes are computed on the basis of the data provided in Figure 4. (2) The total loss of farmers due to environmental changes. Each crop in an exposed area is considered to be destroyed, the income from it is reduced to 0, and the invested money is added to the total loss indicators.

2.3. Submodels

In the following sections, we describe the various dynamics in detail.

2.3.1. Province Decisions

The province adaptation strategies that have been implemented are based on the recommendation presented in Resolution 120/2017 [29] and are chosen depending on the AEZ and land subsidence under consideration. Decision 324 [30] also provides the main guidance for the 3 AEZs.
A province adaptation strategy consists in prohibiting the installation of new land use for some given types; a strategy defines whether a farmer is allowed to switch from his or her current land use to another one. This strategy aims only to prevent the implementation of new land uses for some given types; the rules are thus independent of the current land use. Table 3 summarizes all the possible strategies. For example, if the province chooses the strategy of living with floods, any change of land use to shrimp, rice-shrimp, and fruit trees is forbidden.
A strategy is chosen depending on the AEZ as well as the land subsidence level and a subsidence threshold; the province will choose to protect groundwater if the subsidence level is greater than its threshold for the AEZ (which is defined in the experiments).

2.3.2. Decision of the Farming Unit under Constraints of Province Strategies

The land-use type of the farmer agents can be changed at every simulation step (or every year). To do this, each farmer agent first assesses the advantages of converting to each existing land-use category, choosing the land-use type that best maximizes the advantages from among those permitted by the province in its AEZ and land subsidence level using a weighted mean of four parameters: profit, land suitability, ability to convert, and influence of neighbors. To account for the inherent inertia of these product change processes, we anticipate that only some of the randomly chosen farmers will be able to alter their land use at each simulation step. A conversion rate parameter will be used to determine the number of farmers.
Here is an explanation of the four criteria taken into account in the land-use change decision in the Mekong Delta [4,14,31]:
Profit: One of the main factors driving land-use conversion is the annual profitability of each type of land use. This element is an economic adaptation that occurs when individuals seek a productive agricultural model to improve their lives.
Land suitability: This criterion shows that a particular type of land use has adapted to its environment. The suitability assessment is carried out in accordance with the FAO [32]. The four levels of fit are standardized, ranging from 0 (non-suitable) to 1 (most suitable)
Ability to convert: This factor assesses how easy it is to transition from one type of land use to another, determined by the conditions under which new farming types may be formed. Switching from shrimp to fruit trees, for example, will be extremely difficult in certain circumstances, while switching from deep shrimp ponds in intensive shrimp farming to rice cultivation will be impossible.
Influence of neighbors: According to some studies, land-use decisions of farmers are influenced by their neighbors. The value of this criterion reflects the percentage of farming unit agents in their neighborhood (the eight cells surrounding the farming unit cell) who have selected this land-use type.
The multicriteria evaluation of each farming unit agent is based on the convertibility values from the current land use to the chosen land use (Equation (1)):
c o n v e r t i b i l i t y i , l , l = C p r o f i t , s u i t a b i l i t y , a b i l i t y , o t h e r s W C V a l C i , l , l C p r o f i t , s u i t a b i l i t y , a b i l i t y , o t h e r s W C
where i is a farming unit agent, l is the current land-use type on the associated farming unit, and l′ is the new land-use type to evaluate. For the farmer agent i, the function ValC(i, l, l′) returns the value of the criteria C (profit, appropriateness, ability to convert, and neighbor influence) for a conversion from land-use type l to land-use type l′. Wc is the weight of the criteria C. Values have been obtained in calibration by using land-use map of the Mekong Delta in 2015 [18].

2.3.3. Economic Submodel: Computation of Income and Loss

As described in detail by Truong et al. [18], given the spatial distribution of land use, environmental data (soil type, salinity, etc.), and climate data, the model computes whether each farming unit is exposed to climate-change-related risks. If this is the case, the farming unit will lose its investment (its crop will be damaged), as calculated in Equation (2), not receiving any income from its crop and facing increased loss.
These income and investment costs are computed as follows:
I n v e s t m e n t = c o s t L a n d U s e a r e a S i z e 1 + i n t e r e s t R a t e y e a r 100
During harvesting, if the land unit is in the risk area, the income is reduced to 0 and the loss increases are added to the total losses.

3. Results

3.1. Experimental Design

To test the impacts of the various adaptation strategies in terms of subsidence threshold and cooperation among provinces, we conducted a set of experiments, which we have described in this section. In all these experiments, we chose the worst-case scenario for subsidence, that is, the B2 scenario from [9], corresponding to an annual growth in ground-water extraction of 4% of the 2018 volume.
The four experiments of the LUCAS–GEMMES model described above were launched on the 1.8.2 RC2 version of the GAMA platform [33] (https://gama-platform.org, accessed on 22 July 2022) on the scale of the whole delta.
The results of the four experiments were analyzed through five indicators:
-
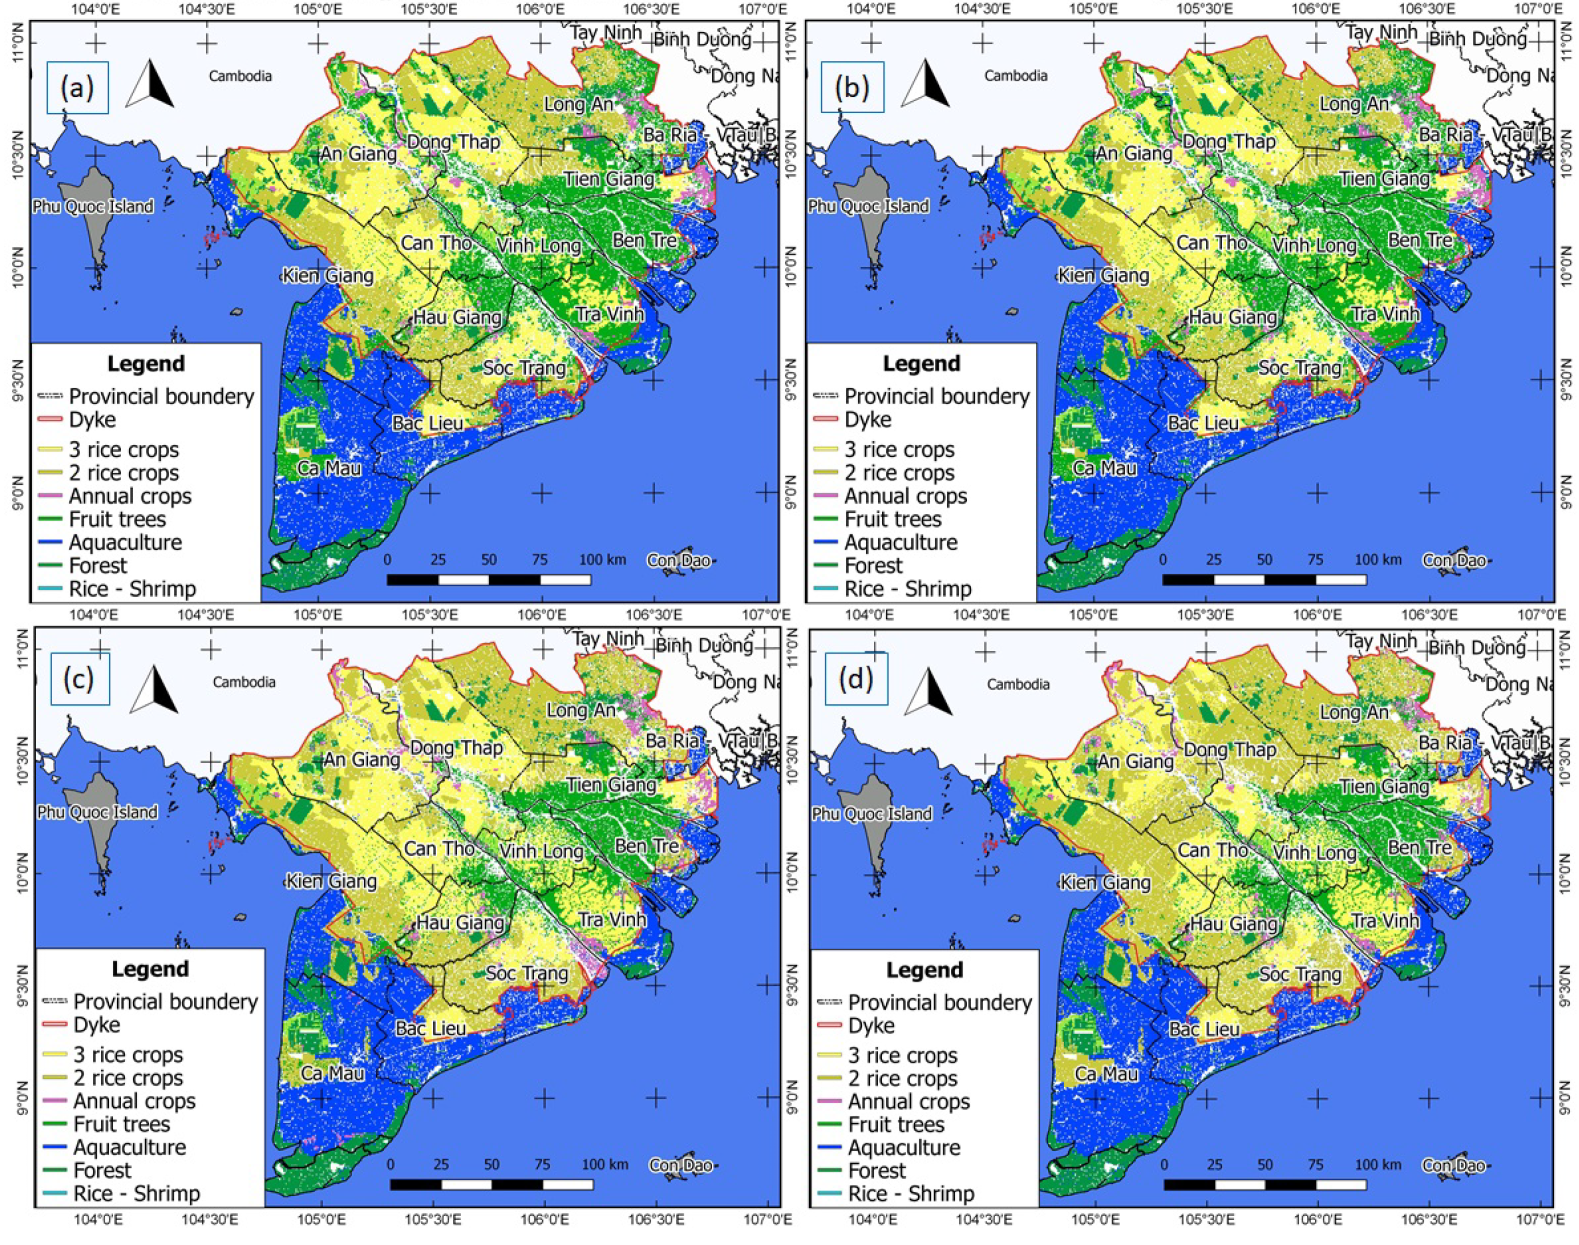
Map of land uses in 2050 and area of dominant use types;
-
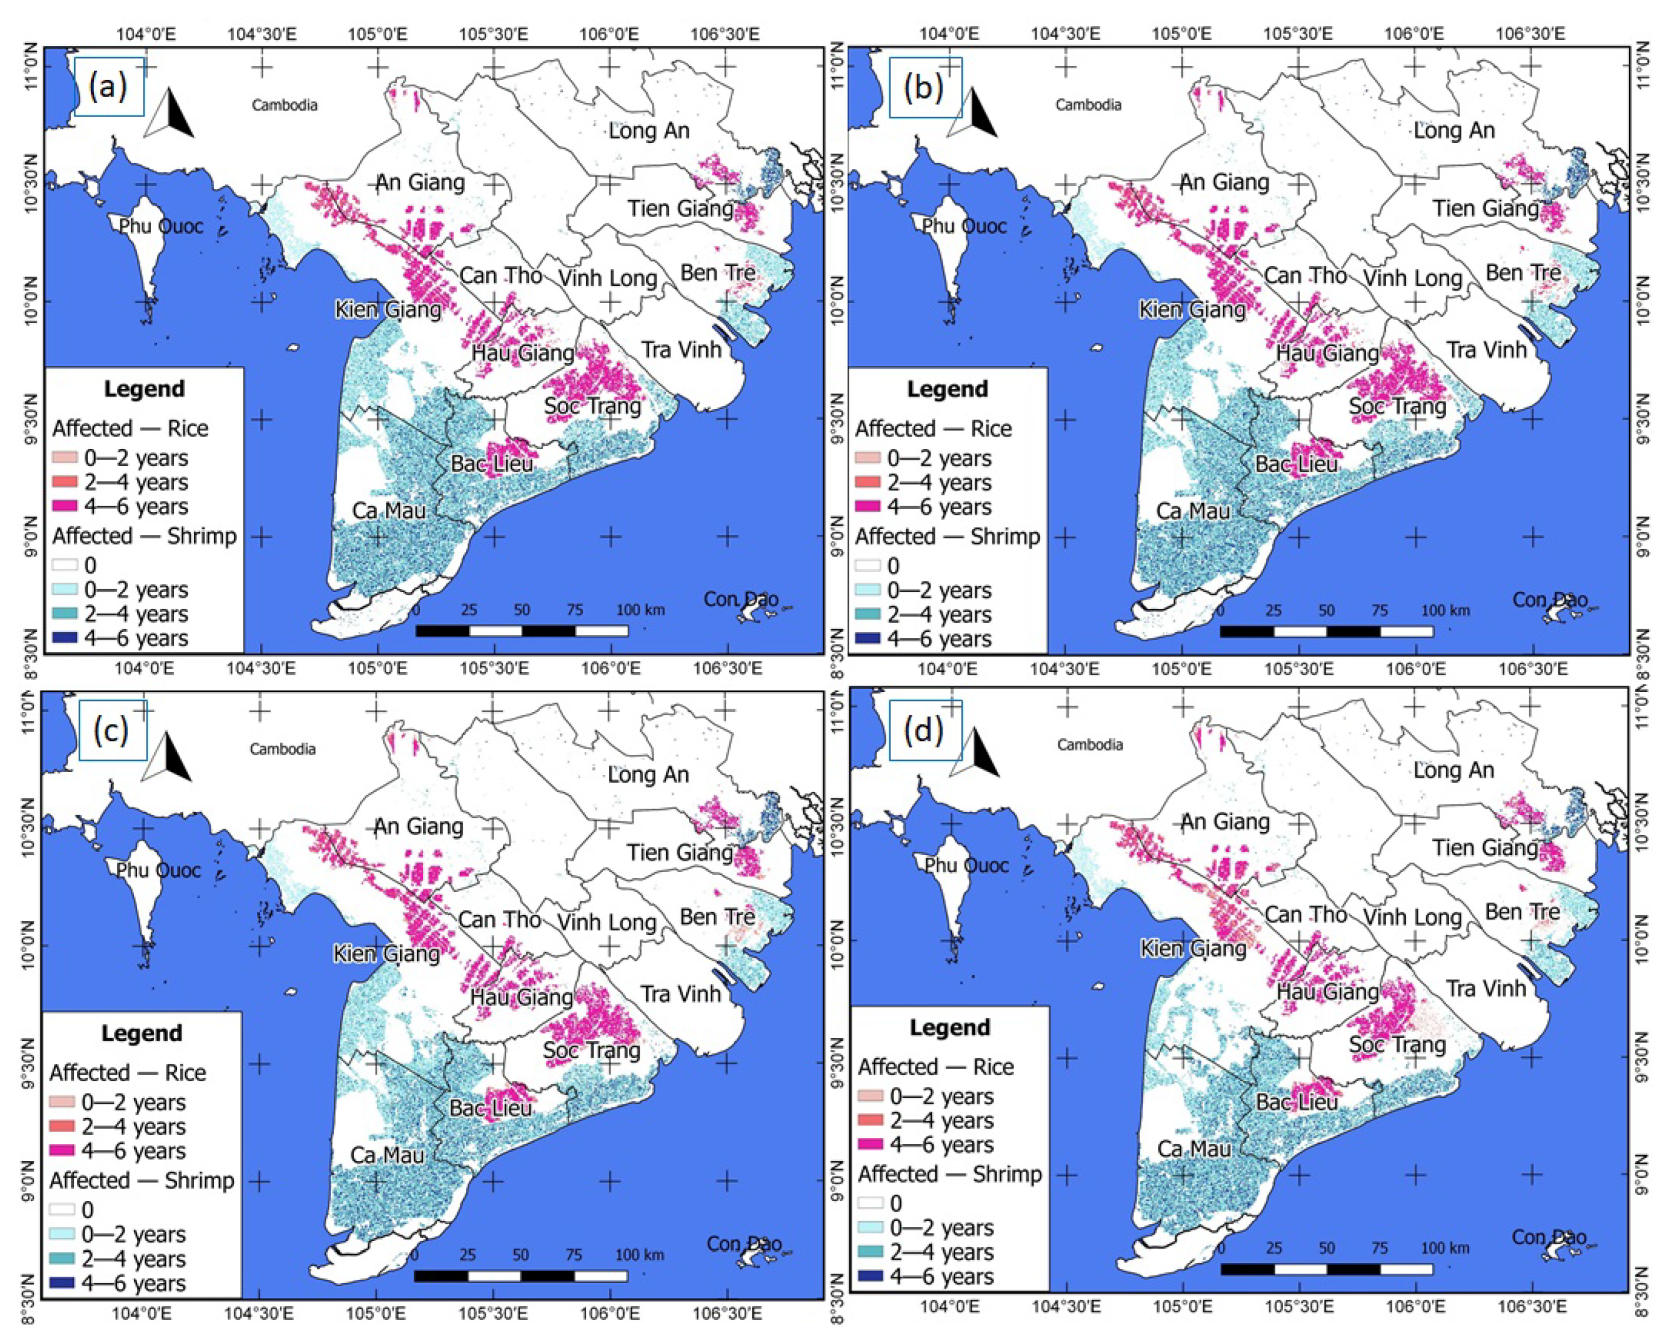
Areas vulnerable to climate change and land subsidence;
-
Water-use savings in the dry season to fight land subsidence;
-
Incomes from different response levels to the effects of subsidence;
-
Total economic losses in the agricultural sector due to environmental changes.
These indicators are presented and analyzed separately in the following sections. However, to have a clear overview of the situation, it is necessary to consider, analyze, and synthesize all of them together.

3.1.1. Experiment 1: Baseline 1—No Provincial Adaptation Strategies and No Subsidence Impact

This experiment considered an ideal situation, one in which there was no subsidence impact; the effects of subsidence were not considered in either land-use choice or land-use production. Land-use choice was thus only impacted by climate-change-related factors (temperature, precipitation, and salinization due to climate change). This situation is one that has been explored by Truong et al. [18] using the LUCAS model.
To implement this Baseline 1 experiment, we did not need to explore any parameters, as they did not have any impact on the results; all land-use changes were allowed except those constrained by changing climate conditions.

3.1.2. Experiment 2: Baseline 2—No Adaptation Strategies Though Subsidence Impacts the Benefits from Land-Use Production

In this baseline experiment, we considered a situation in which, though subsidence impacted land-use benefits, no individual- or province-level adaptation strategies were implemented. We assumed that the benefit of land use would decrease when subsidence occurred. This meant that the province would allow all land-use changes irrespective of the land subsidence level. In this baseline experiment, we wanted to show the land use and other indicators when people do not recognize the impact of subsidence or when they do not know how to adapt specifically to subsidence. This is the baseline to which the following experiments will be compared.

3.1.3. Experiment 3: Individual Adaptation Strategies against the Impact of Subsidence

In this experiment, we explored individual adaptation strategies that took the subsidence level into account, based on Baseline 2 (subsidence impacts the benefits from land-use production). In this experiment, provinces did not apply adaptation strategies depending on the subsidence level. This experiment thus explored a situation in which farmers reacted to land subsidence without any guidance from local governments.
Decreasing profits influence farmers’ land-use selection. The subsidence adaptation strategy is triggered only when cumulated subsidence reaches a given threshold, which is the parameter that will be explored in this experiment and may take a value of 0.1 m, 0.2 m, 0.5 m, or 1 m.

3.1.4. Experiment 4: Province and Individual Adaptation under the Impact of Subsidence

The fourth experiment was based on Resolution 120/2017 [29]. It promoted new strategies in the Mekong Delta to deal with the effects of climate change. A specificity was that the resolution introduced the notion of an agro-ecological zone, in which specific strategies should be applied. In the upstream zone, the strategy recommended was to live with floods; in the middle zone, optimizing farmer income was recommended; and in the coastal zone, living with salt water was recommended. Table 3 presents all these strategies, applied when the land subsidence level was higher than the given subsidence threshold.
This fourth experiment was based on Experiment 3, to which an implemented adaptation mechanism on the province scale had been added. Consequently, Experiment 4 considered the situation in which subsidence impacted land-use benefits and where both individuals and provinces applied subsidence-related adaptation strategies when the subsidence level reached a given threshold. Individuals thus chose their land use under the possible constraints of the province and the impact of the subsidence on their current land use.

3.2. Analyzing Land-Use Maps until 2050

Land-use maps are the leading criterion taken into account by environmental and agricultural policy makers for sectoral planning. Figure 5 displays the land-use spatial distributions resulting from the two baseline experiments and the two experiments where adaptation strategies were applied. For these two experiments, the subsidence threshold to trigger adaptation strategies was chosen at 0.1 m. For the sake of space, we have limited our results to a single subsidence threshold, the one that provided the most different results. To analyze the results, we clustered land uses into two main groups: tree crops (fruit trees, two and three rice crops, etc.) and aquatic land use (rice-shrimp, shrimp, etc.).
As depicted in Figure 5a,b, the land-use maps from Experiment 1 and Experiment 2 are similar: the aquaculture area has expanded between now and 2050, three-rice-crop land use still dominates in the upstream zone, and fruit trees occupy the middle and coastal zones. This is a normal trend as people have shown a tendency to choose land use mainly based on the existing tradition of production and profit and are under no pressure to convert land-use type without considering the risk factors due to climate, the impact of land subsidence, and lack of surface water and groundwater in extreme conditions.
For Experiment 3 (Figure 5c), as individual farmers took into account the impact of subsidence on incomes, attempting to reduce their water demand in the dry season in the coastal area, the level of conversion to fruit trees in Ben Tre and Tra Vinh appeared lower than in the two baseline experiments. Similarly, three-rice-crop land use almost disappeared in Soc Trang and Bac Lieu, mostly replaced by two rice crops.
Considering Experiment 4 (Figure 5d), where the adaptation policy of the provinces was applied based on the characteristics of the AEZ and the land subsidence, the spatial land-use distribution map was largely different in terms of rice crop land uses. Land with two rice crops prevailed across the delta, but different adaptation policies were applied. For An Giang and Dong Thap Muoi provinces, the policy of flood discharge and crop cutting following the spirit of Resolution 120 oriented the development toward two rice crops. Soc Trang and Ca Mau provinces showed a similar evolution, with two rice crops in areas affected by saline intrusion. In parallel with the flood discharge policy, the focus was on producing fruit trees only in stable dyke areas and the foothills, helping to avoid conflicts over surface water use.
In addition to the spatial distribution map (displayed in Figure 5), the total area of each land-use type is also important for land management. Table 4 presents the total area for each land-use type over the four experiments, displaying the results for Experiment 4 with the four values of the land subsidence threshold (0.1, 0.2, 0.5, and 1.0 m) used to trigger adaptation strategies.
The results show a trend to transform three-rice-crop land use into other land-use types. While in Experiments 1 and 2, the three rice crops were by and large converted into fruit trees (in coastal provinces), in Experiments 3 and 4, there was a clear shift toward two rice crops (particularly for low values of land subsidence threshold, i.e., in cases where either individuals or provinces apply adaptation strategies at an early stage of land subsidence). This is appropriate for limiting groundwater extraction in the case of extreme weather and policies. A second (smaller) impact of the application of province adaptation policies (when the subsidence threshold parameter takes low values) was a reduction in the area for fruit trees and vegetables and an increase in the aquaculture area. A special point that needs to be considered is that the rice-shrimp area was predicted to disappear in 2050. In the simulation results, all rice-shrimp areas were reduced gradually and converted to shrimp areas by 2040.
The chart in Table 4 basically presents different ways of converting three rice crops. In the baseline experiment, in the coastal provinces (Ben Tre and Tra Vinh), the three rice crops were mainly converted into fruit trees, while in Experiments 3 and 4, they were converted into two rice crops. In 2050, the total area of fruit trees in Experiments 1 and 2 was 800 to 806 million hectares, that is, between 70% and 90% higher than in the adapted ones. This highlights the value of adaptation strategies that protect groundwater and reduce the risk of water shortage for fruit trees in the dry season compared to the baselines. Inversely, when applying the policy to protect groundwater, as soon as projected land subsidence reaches 0.1 m (EXP4—0.1 m), the area of three rice crops was shown to be significantly reduced by conversion into two rice crops compared with the other adaptation experiments. If provinces applied the adaptation for a subsidence threshold of 0.1 m, the area of two rice crops would be nearly 70% higher than the baselines (reaching 1.17 million hectares). However, there was not much difference between the subsidence levels of 0.5 m and 1.0 m when applying these strategies. In terms of resource protection, applying early adaptation policies was shown to be crucial to resource protection. However, the economic point of view also needs to be considered and analyzed, which we have done in Section 3.5.

3.3. Vulnerability Assessment

Figure 6 presents the vulnerability maps of rice and shrimp land uses resulting from the four experiments (once again, for Experiments 3 and 4, we only display the results for a subsidence threshold of 0.1 m). The LUCAS–GEMMES model computes these maps based on the number of years a land unit is at risk over the simulations. The more heavily impacted the area, the darker the color. In the two baseline experiments, these maps were similar. In Experiments 3 and 4, areas such as Soc Trang had reduced vulnerable areas, in particular for rice crops in the coastal area (red color in Figure 6), thanks to the application of adaptation strategies.
The maps for Baseline Experiments 1 and 2 showed that the impacted areas were mainly located in Ca Mau, Bac Lieu (for shrimp), Soc Trang, Kien Giang (rice and shrimp), coastal regions of Ben Tre and parts of Tien Giang, An Giang, and Long An (rice). The provinces of An Giang, Dong Thap, Long An, and Tra Vinh contained large three-rice-crop areas but were not affected by climate conditions. Therefore, the transformation from three rice crops to two rice crops in these provinces did not contribute to reducing the vulnerable areas in these provinces.
To compare the vulnerable areas of the four experiments, we computed the total vulnerable area for rice and shrimp during simulation and plot it in Figure 7. First, it appeared that with adaptation, the areas for Baseline 1 and Baseline 2 were significantly greater than those for the two other experiments. In Experiment 3, although the vulnerable area was significantly narrowed compared to the two baselines, the total vulnerable area when people self-adapt to subsidence levels was significantly higher (more than 300,000 ha cumulatively) than that in Experiment 4 (when provinces react at a subsidence threshold from 0.1 m to 1.0 m). This was because the multi-criteria optimal selection mechanism of farmers was still driven by the highest income (land uses with the highest profits are still occupying the area) and newly converted land use is not at reduced risk. For Experiment 4, we can observe that the total vulnerable area was reduced even further; more specifically, when the province applied adaptation strategies early (i.e., with a low subsidence threshold), the affected area was reduced by 50,000–80,000 ha compared to the cases of slow responses (subsidence thresholds higher than 0.2 m).

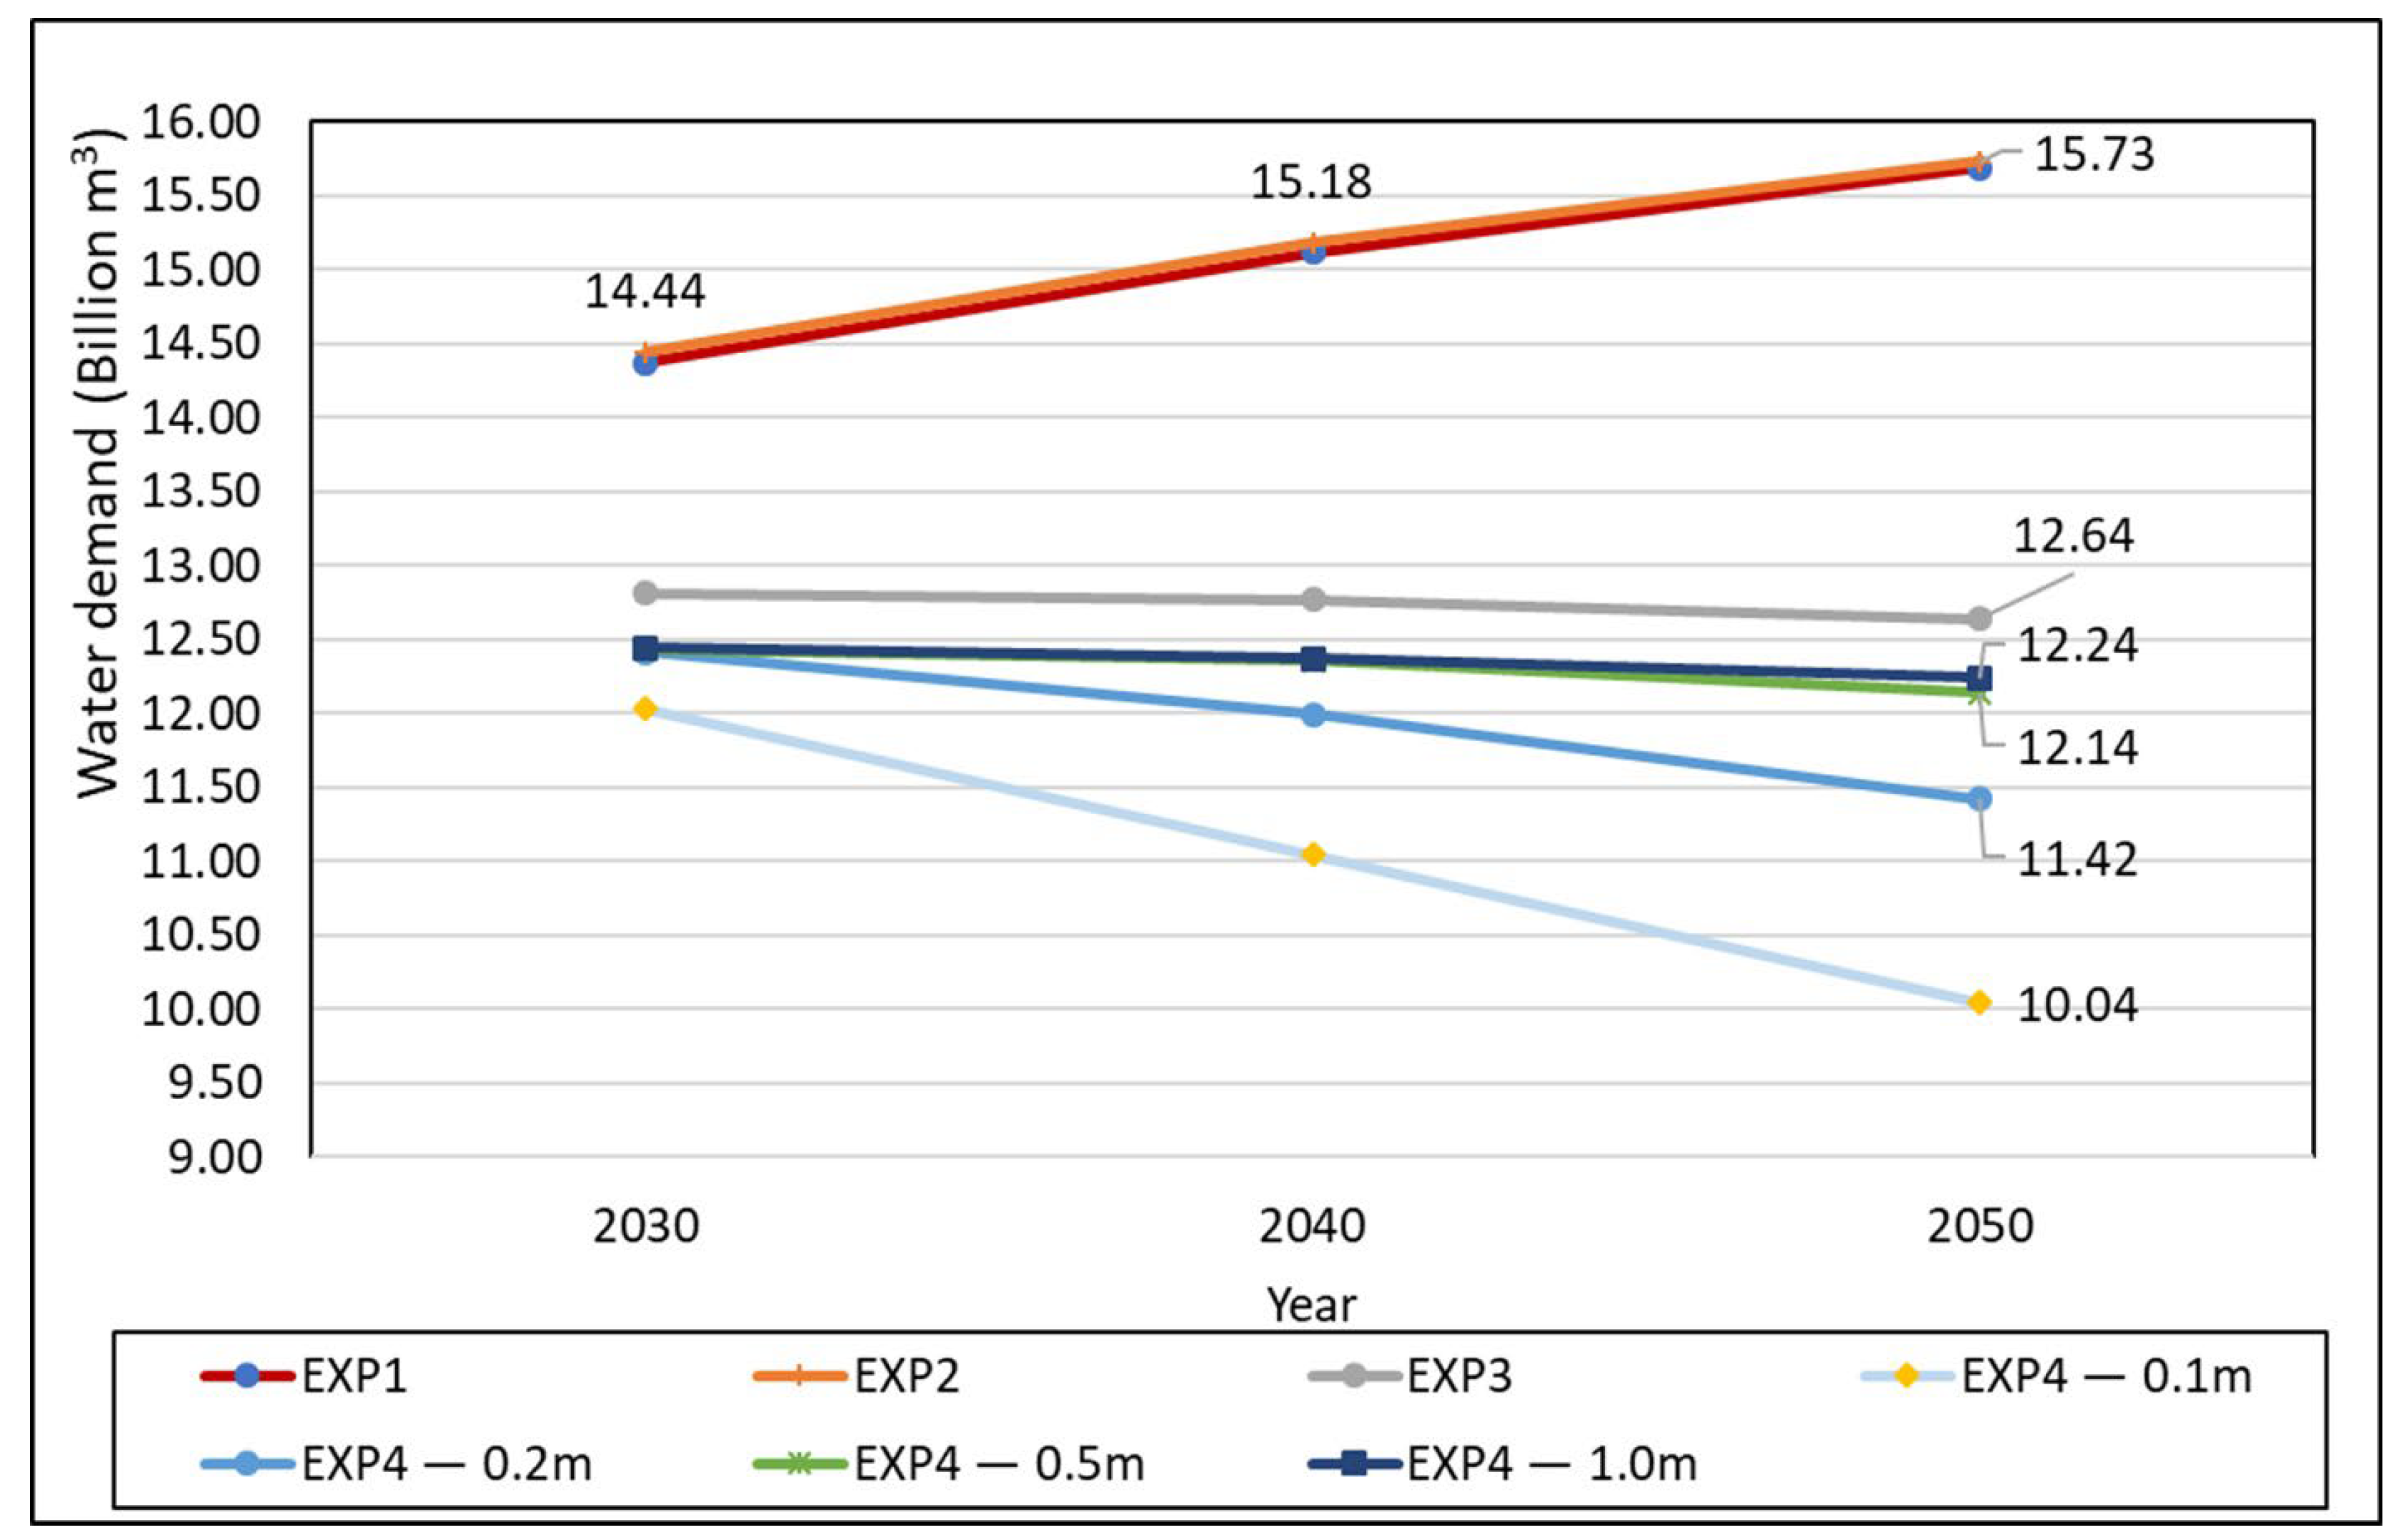
3.4. Water Saving to Mitigate Subsidence

Evolutions in water volume demand, aggregated on the scale of the studied area, are plotted in Figure 8 for years 2030, 2040, and 2050. The two baseline experiments (1 and 2) involved a regime of high annual water use because farmers converted to land use that consumed much more water. For the experiments that applied provincial adaptation strategies, the results showed that the amount of water used was reduced significantly compared to other cases when provincial strategies were early responses (more than 5 billion m3 of water saved in EXP4—0.1 m compared with the baselines). In the case of people’s self-awareness and early adaptation (EXP3—0.1 m), the results showed that the amount of water used was also significantly lower, even if this was not as efficient as the application of provincial adaptation strategies.
Considering the relationship between water demand and land use, water demand reduction seems to be mainly due to the conversion from three rice crops into two rice crops. This does not directly reduce subsidence (because these cultivation types use surface water) but indirectly enhances surface water resources. In An Giang and Dong Thap, when crops were cut and flooding occurred, it served to store surface water for cultivation. This saved water could be transferred/flow into canals and ponds for irrigating fruit trees and vegetables and farmers could cultivate dry crops in the dry season.

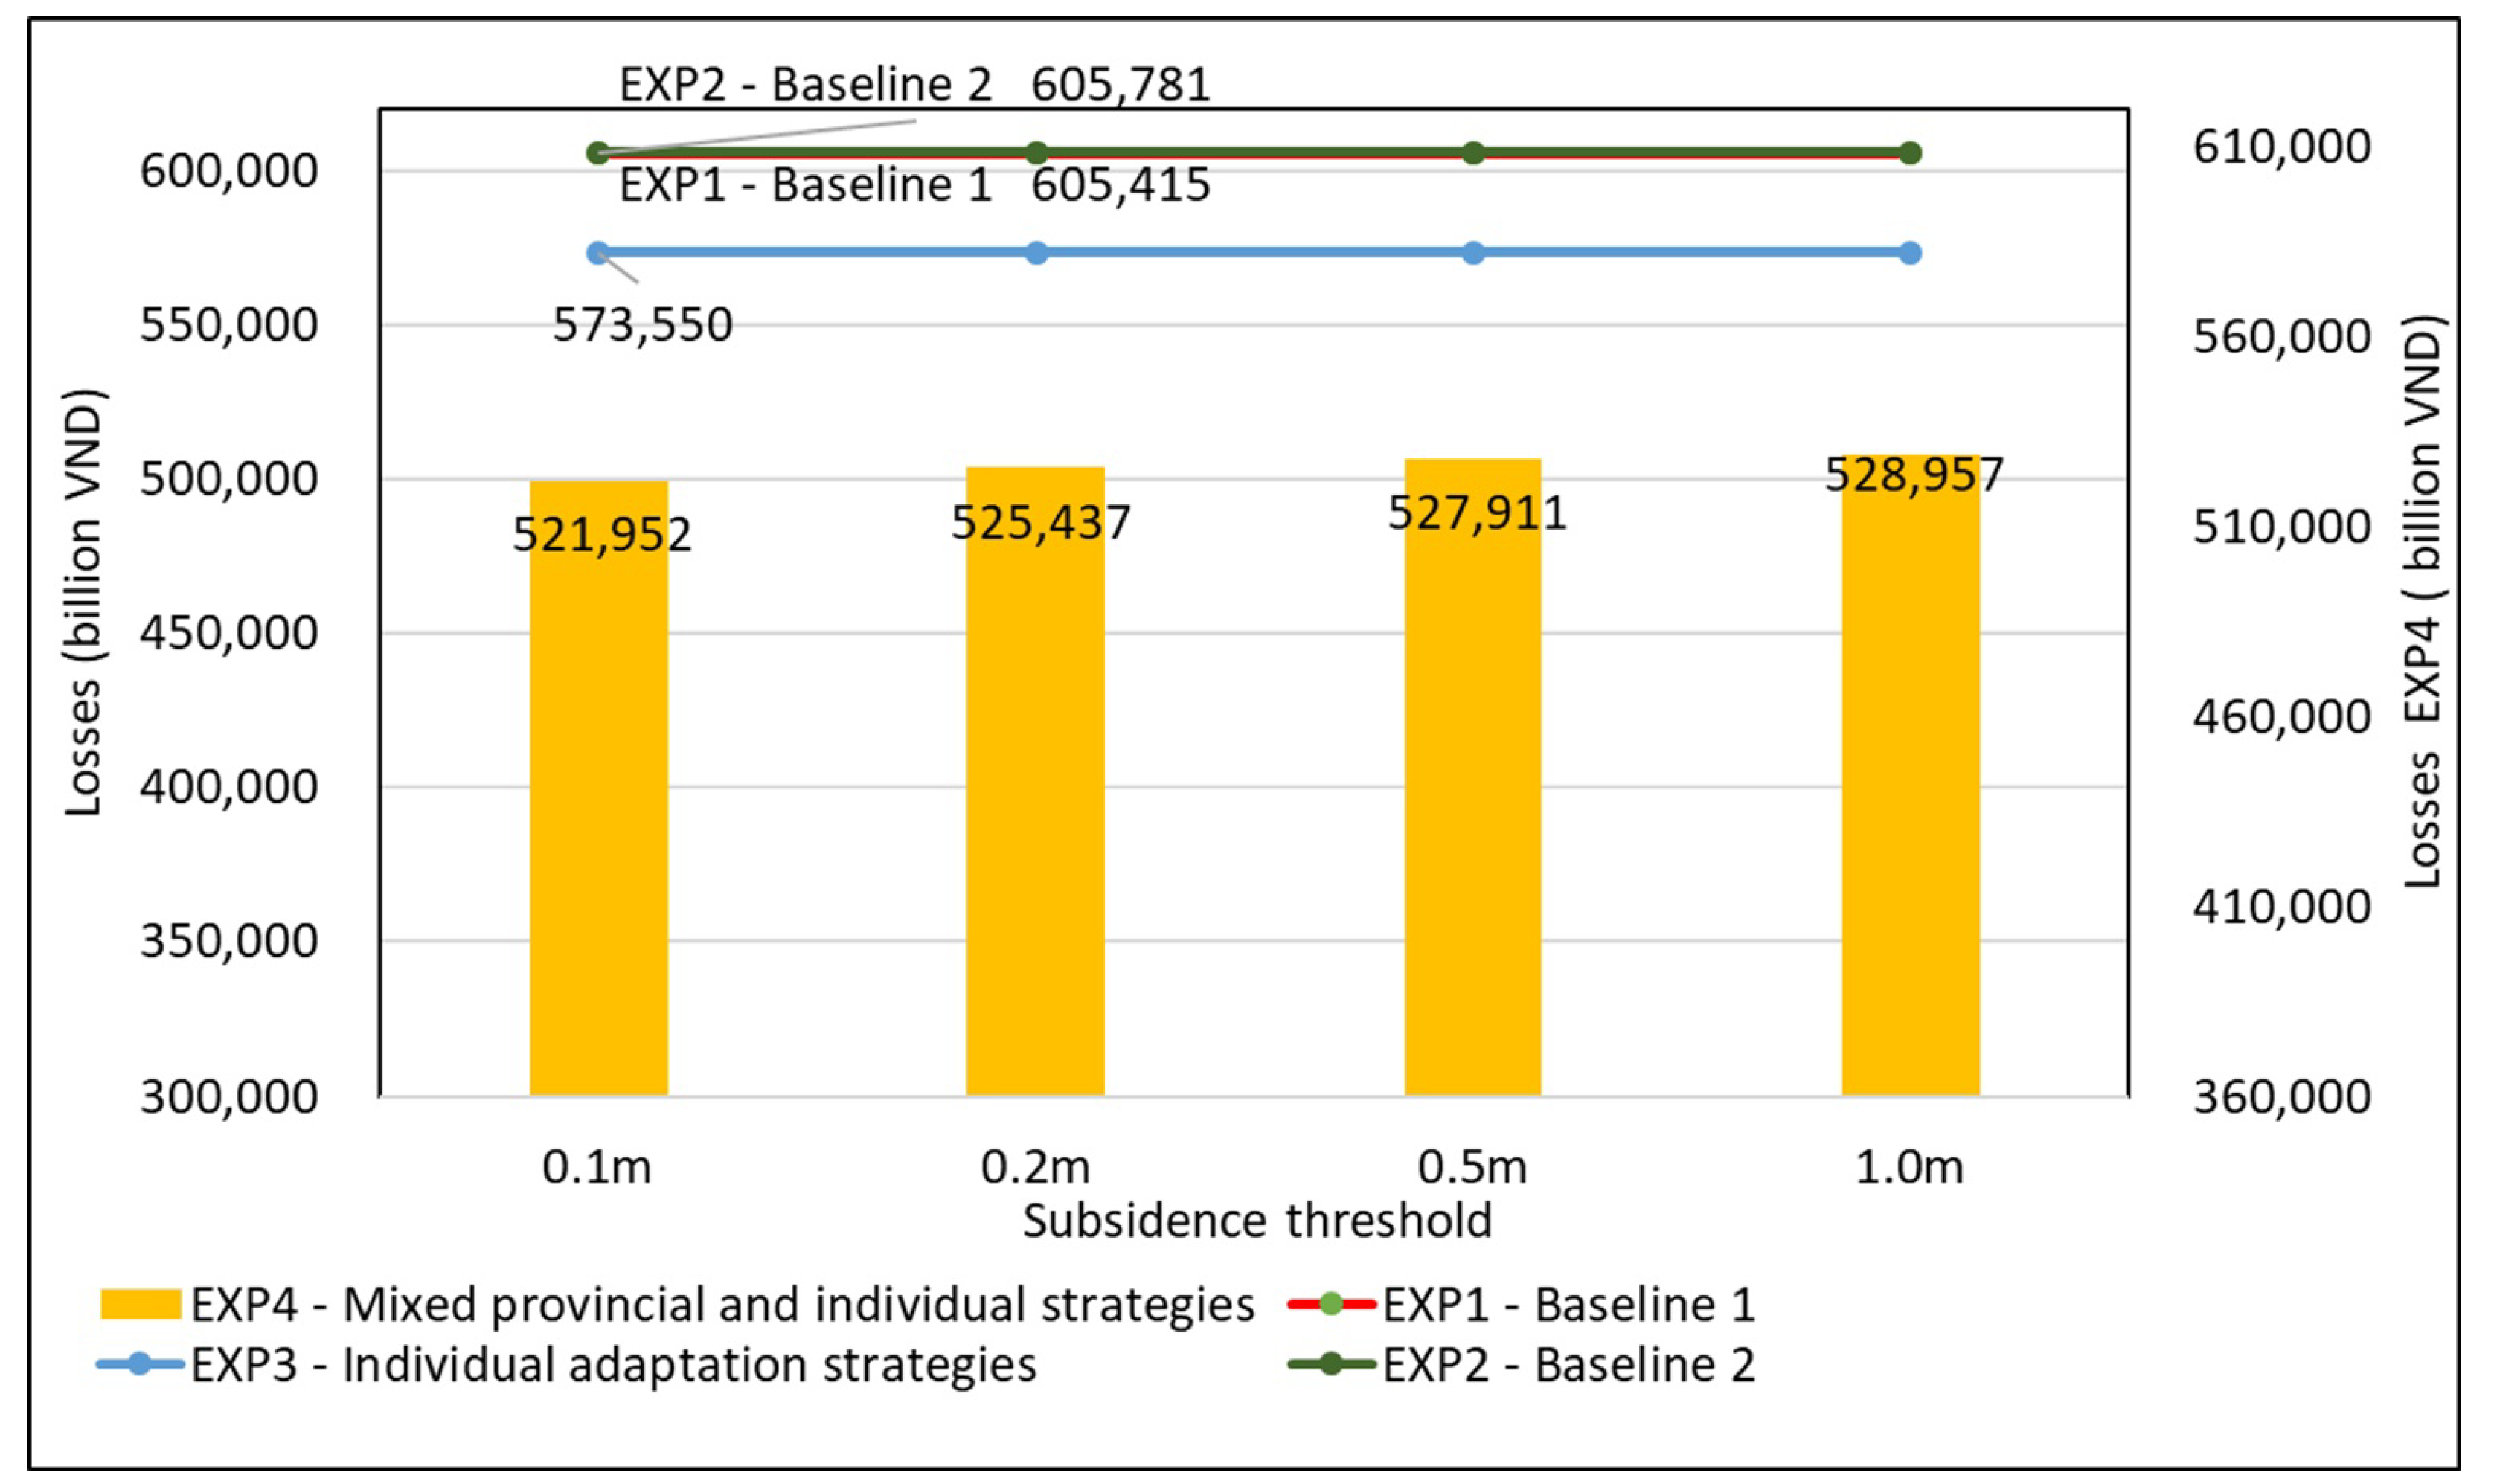
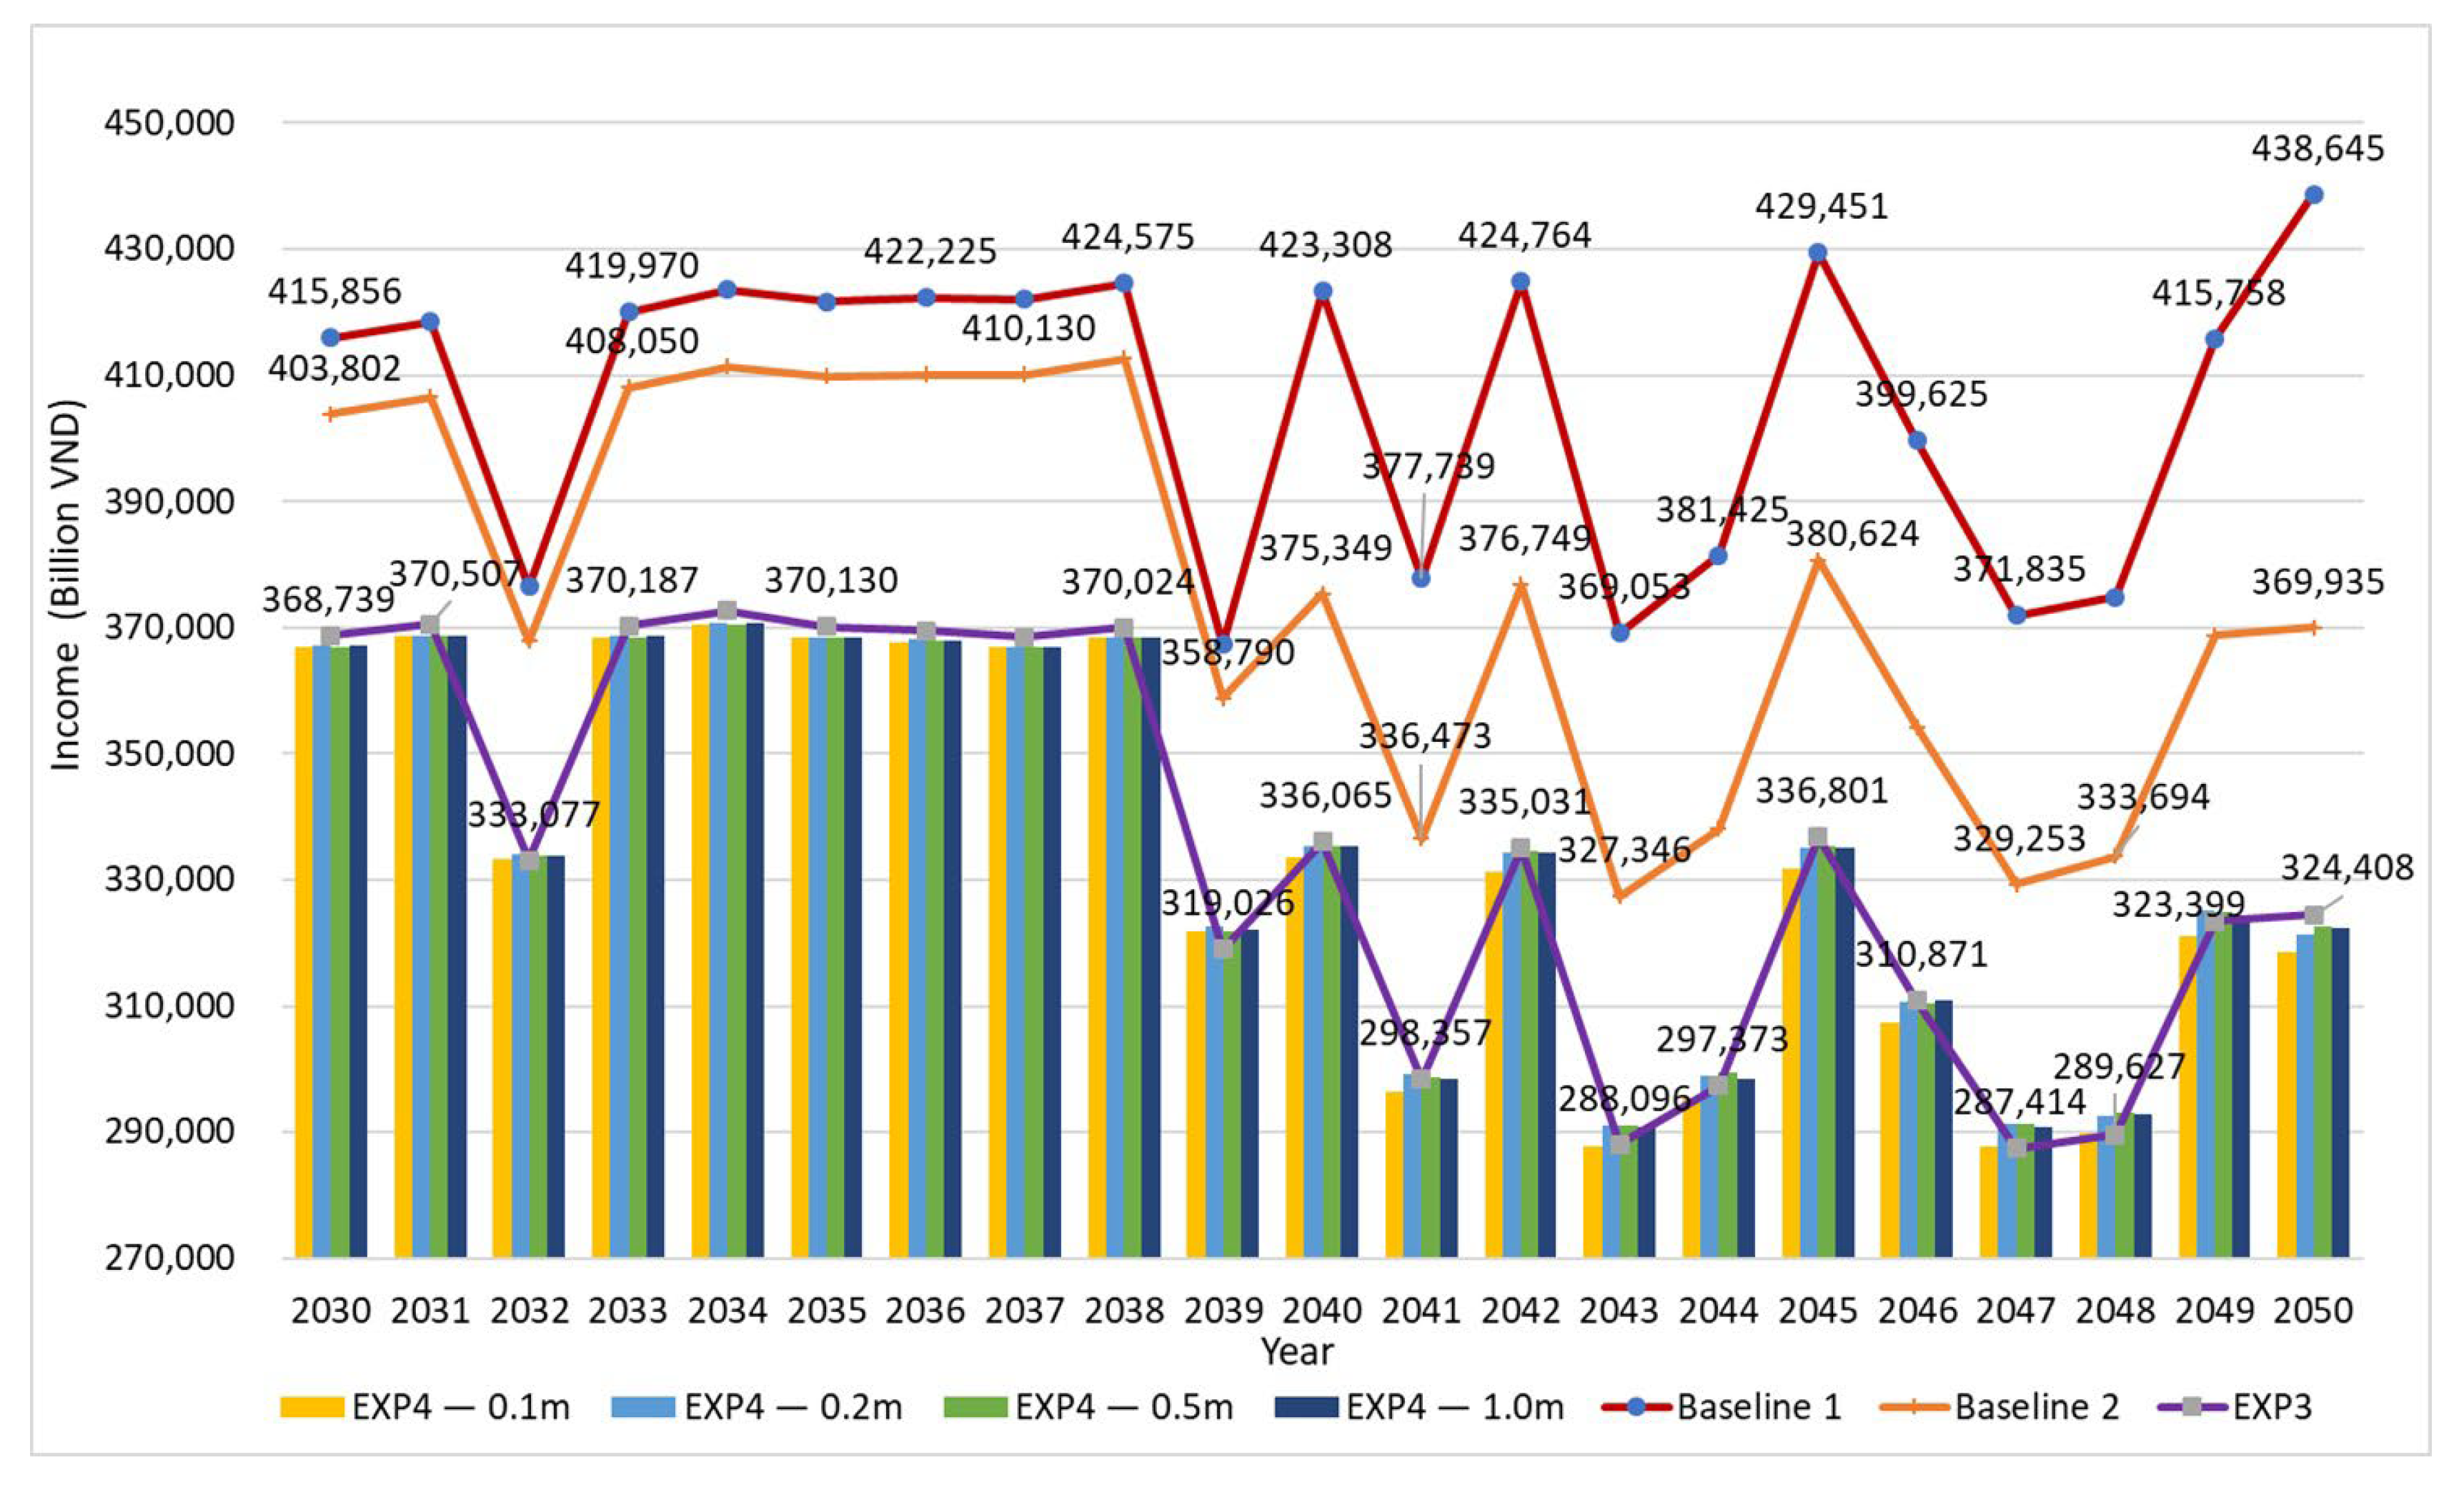
3.5. Analyzing Incomes and Losses with Adaptation Strategies

Figure 9 plots the cumulative loss due to climate and salinity conditions in 2050. It shows that Baselines 1 and 2 represent significantly larger amounts of financial loss than the two other experiments, which is coherent with the larger exposed area (as depicted in Figure 6). The results of Baseline 1 and Baseline 2 experiments were similar in terms of the risk in aquaculture (which is high). The affected areas were mainly farming units with 3-rice crops and shrimp farming land uses. We can nevertheless note that the loss values did not differ between Baseline 2 and Baseline 1 because they share the same land-use selection behavior.
As far as Experiment 3 is concerned, the amount of money lost was lower than baseline losses because farmers applied adaptation strategies (selecting land-use-based multicriteria evaluation among the land-use candidates, supported by the strategies of the province) that reduced vulnerability to climate, salinity, and subsidence.
The loss was significantly lower in Experiment 4 than in Experiment 3, with a lower value showing an improved situation when provinces applied adaptation strategies at a low subsidence threshold (0.1 m) compared to a late, serious threshold (1 m). Even if the total losses in EXP4—0.1 m were the lowest, large shrimp areas with investment levels around six times higher than for rice were shown to be subject to potential risk from climate factors. From a qualitative point of view, the provincial adaptation strategies (prohibiting some land-use types from being implemented) seem to have had a positive effect from an economic point of view as they reduced losses, but when people selected a new land-use type, it could have been impacted by climate change. This shows the need to invest in climate-change-adaptive shrimp farming techniques to minimize the damage caused by climate change.
Figure 10 summarizes the results in terms of farmers’ incomes. It compares the total incomes in the ideal case, when incomes are not affected by the subsidence (Baseline 1), with situations in which they are affected and no adaptation strategies are implemented (Baseline 2), as well as with situations in which adaptation strategies are applied (Experiments 3 and 4). The results show a large inter-annual variability in income caused by strong impacts of weather conditions over some years (as simulated in the climate projection data used in this study).
Under ideal conditions, the transition to suitable farming systems with high returns would positively contribute to the economy of the delta despite the risks of climate change. However, when a climate impact occurred, profits dropped significantly (Baseline 2). In the adaptation experiments, when the farmers applied strategies at low subsidence levels, there was a severe decline in their incomes. In this situation, the conversion from three rice crops to two rice crops strongly impacted the income of farmers and the price to pay for protecting natural resources would be high. However, when considering the impact of climate change and calculating the balance with income lost due to impact, it shows that choosing to apply a flexible adaptation strategy will bring great benefits to the people and better resource protection. In addition, farmers can choose highland crops in the dry season to improve their income.

4. Discussion

This research illustrates the role that integrated models such as LUCAS–GEMMES can play in combining the results of several other models on different scales. This is the case for those produced within the GEMMES project: downscaled climate projections from CMIP6 global climate models, inputs from the macroeconomic model [20], and projections from a land subsidence model [9], are all used to parameterize the scenarios used as contexts for the simulations.
Numerous studies have addressed land-management policy [34] and individual adaptability [4,14] in order to mitigate the consequences of land subsidence. This study explained how specific policies can be applied as actions or decisions made by artificial agents. This is the case, for instance, with Resolution 120/2017 [29] or Prime Minister’s Decision 324/QD-TTg [30], both of which set the framework for policies relating to subsidence mitigation and adaptation in the Mekong Delta. The orientations in Resolution 120/2017 of the Government of Vietnam are concretized through the general policies of the Mekong Delta region based on the characteristics of ecological regions. Policies (although simple) play an important role in the orientation of land use, as shown in the model. This is the first step toward being able to apply the ABM model more effectively to support policy development. Experimental results from four cases compared and evaluated the area of land-use types, the area of climate vulnerability and subsidence, economic efficiency of adaptation policy, and damage estimate. It was clear that the policies of the state and the support of the people significantly contributed to minimizing risks and damages. We found that economic degradation due to reducing agriculture season or capital required for improving farming techniques [35] are a side effect of adaptation to nature, but are less serious than the danger and risk from the environment, a result that is consistent with those of many studies [36]. This is also reported for the provinces in the region that combine many measures, including favorable solutions and infrastructure and technical investment solutions, to help people improve their incomes and optimize profits while minimizing risk.
Climate and subsidence models are uncertain, especially when the data are forecast over long periods of time. In addition, there are many different projected models that lead to uncertain results of the adaptive model. In this model, we analyzed the worst cases of climate by aggregating the data from 35 climate models of CMIP6, which could not improve the uncertainty but did provide an alarming picture for managers.
At the macro-regional level, the model can provide an overall estimate of irrigation capacity and risk. However, the water demand in the study was only based on theoretical data according to the existing studies and Vietnamese standards, and the water from natural sources such as rainfall was not used for calculating the water supply. Additionally, the inability to distinguish between the surface water supply capacity and the amount of groundwater required made it difficult to recommend how to manage groundwater for agricultural production. These limitations should be explored in further studies.
The lack of policy support from the provinces for farmers is one of the limitations of the current model. Another limitation is that LUCAS–GEMMES takes only the results (subsidence, salinity, and macroeconomic) of other models as input, without for the moment relying on a more important coupling. The choice of agricultural production thus has no influence on land subsidence, salinity intrusion, or macroeconomic dynamics, which are considered as exogenous. This essential point, which greatly complicates the model, but which appears necessary to increase its realism, will be further investigated in subsequent studies.

5. Conclusions

In this study, we used agent-based modeling to build adaptive models of people in land-use decision-making under the impact of climate change and land subsidence. The model is one step in illuminating the potential of the agent-based method for simulating socio-environmental systems. It specifically added a new level of decision-making, the provinces, with its own methods for influencing or limiting the choices made by individual farmers.
By adding the local adaptation behaviors of farmers, which were already presented in the first version of the model, LUCAS–GEMMES thus enables the exploration of a wide range of adaptation and mitigation strategies. In particular, it allows decision makers to analyze the results both qualitatively, in the form of combinations of local and global land-use strategies, and quantitatively, in the form of these indicators: farmers’ income and losses, area at risk of salinization due to climate change, estimated water used by crops, etc.
The experiments have shown that policies restricting certain land uses at low subsidence levels (0.1 m) are more effective than those that do so at higher subsidence levels in mitigating climate change risks. Such restrictions help to reduce water use during the dry season and minimize the damage caused by climate change.
One of the interesting aspects of agent-based modeling is that it can explore not only the decisions but also the interactions between actors at different levels. From this perspective, LUCAS–GEMMES could be a promising tool for evaluating policies for the Mekong Delta, leading to awareness of the value of increased cooperation between provinces and national decision-makers when several actors with sometimes divergent views exploit a common property, such as aquifer zones.
Despite these limitations, simulations using the current model were able to provide some interesting insights, particularly regarding the impact of cooperation between provinces, represented here as a coordinated choice of provinces sharing the same agro-ecological zone. These virtual experiments allow us to confirm numerically that coordination between provinces will make it possible for farmers to maintain their overall incomes at reasonable levels whereas the absence of coordination will penalize them.

Author Contributions

Q.C.T. conceptualized the study, defined the model, performed the modeling and data analysis, and finalized the paper; A.D. structured the manuscript, designed the experiments, and revised the manuscript; B.G. defined the model and finalized the paper; P.T. reviewed the manuscript; N.Q.H. performed the modeling; H.N.T.T. generated macrodata and reviewed the manuscript; P.M. generated the subsidence data and reviewed the manuscript; T.H.N. collected data; and E.E. edited the manuscript. All authors have read and agreed to the published version of the manuscript.

Funding

This study was funded by Agence Française de Développement (AFD), through Facility 2050, within the framework of the research project GEMMES-Vietnam.

Institutional Review Board Statement

Not applicable.

Informed Consent Statement

Not applicable.

Data Availability Statement

The source code of the model is available online at https://github.com/GEMMES-Project/LUCAS.git (accessed on 19 December 2022).

Acknowledgments

We would like to thank the GEMMES Vietnam project team members, especially Thanh Ngo-Duc and Sepehr Eslami Arab for climate and salinity data provided and Marie-Noelle Woillez for coordinating the project.

Conflicts of Interest

The authors declare no conflict of interest.

References

  1. Espagne, E.; Ngo-Duc, T.; Nguyen, M.-H.; Pannier, E.; Woillez, M.-N.; Drogoul, A.; Huynh, T.P.L.; Le, T.T.; Nguyen, T.T.H.; Nguyen, T.T.; et al. Climate Change in Viet Nam, Impacts and Adaptation: A COP26 Assessment Report of the GEMMES Viet Nam Project; Agence Française de Développement: Paris, France, 2021. [Google Scholar]
  2. Drogoul, A.; Huynh, N.Q.; Truong, Q.C. Coupling Environmental, Social and Economic Models to Understand Land-Use Change Dynamics in the Mekong Delta. Environ. Inform. 2016, 4, 19. [Google Scholar] [CrossRef] [Green Version]
  3. Lambin, E.F. Modelling and Monitoring Land-Cover Change Processes in Tropical Regions. Prog. Phys. Geogr. 1997, 21, 375–393. [Google Scholar] [CrossRef]
  4. Truong, Q.C.; Gaudou, B.; Van Danh, M.; Quang Huynh, N.; Drogoul, A.; Taillandier, P. A Land-Use Change Model to Study Climate Change Adaptation Strategies in the Mekong Delta. In Proceedings of the 2021 RIVF International Conference on Computing and Communication Technologies (RIVF), Hanoi, Vietnam, 19–21 August 2021; IEEE: Piscataway, NJ, USA, 2021; pp. 1–6. [Google Scholar]
  5. Vu, T.L. Application of GIS to Assess Climate Change Impact and Propose Adaptation Solutions for Agriculture in Ho Chi Minh City. PhD Thesis, Vietnam National University, Ho Chi Minh City, Vietnam, 2021. [Google Scholar]
  6. Holman, I.P.; Brown, C.; Carter, T.R.; Harrison, P.A.; Rounsevell, M. Improving the Representation of Adaptation in Climate Change Impact Models. Reg. Environ. Change 2019, 19, 711–721. [Google Scholar] [CrossRef] [PubMed] [Green Version]
  7. Bong, B.B.; Bo, N.V.; Son, N.H.; Tung, L.T.; Tu, T.Q.; Toan, T.Q.; Yen, B.T.; Trung, N.D.; Labios, R.V.; Sebastian, L.S. Adaptation Options for Rice-Based Cropping Systems in Climate Risk-Prone Provinces in the Mekong River Delta: An Assessment Report; CGIAR Research Program on Climate Change, Agriculture and Food Security (CCAFS): Wageningen, The Netherlands, 2018. [Google Scholar]
  8. Vetharaniam, I.; Timar, L.; Stanley, C.J.; Müller, K.; van den Dijssel, C.; Clothier, B. Modelling Climate Change Impacts on Location Suitability and Spatial Footprint of Apple and Kiwifruit. Land 2022, 11, 1639. [Google Scholar] [CrossRef]
  9. Minderhoud, P.S.J.; Middelkoop, H.; Erkens, G.; Stouthamer, E. Groundwater Extraction May Drown Mega-Delta: Projections of Extraction-Induced Subsidence and Elevation of the Mekong Delta for the 21st Century. Environ. Res. Commun. 2020, 2, 011005. [Google Scholar] [CrossRef]
  10. The Government of Vietnam. Decree No. 167/2018/ND-CP on Restriction on Groundwater Extraction; No. 167/2018/ND-CP; The Government of Vietnam: Hanoi, Vietnam, 2018.
  11. MONRE. Circular No. 47/2017/TT-BTNMT on Supervision of Extraction and Use of Water Resources; Circular no. 47/2017/TT-BTNMT; Ministry of Natural Resources and Environment of Vietnam: Hanoi, Vietnam, 2017.
  12. Bosomworth, K.; Harwood, A.; Leith, P.; Wallis, P. Adaptation Pathways: A Playbook for Developing Options for Climate Change Adaptation in Natural Resource Management; Southern Slopes Climate Change Adaptation Research Partnership (SCARP): Melbourne, Australia, 2015. [Google Scholar]
  13. Haasnoot, M.; Brown, S.; Scussolini, P.; Jimenez, J.A.; Vafeidis, A.T.; Nicholls, R.J. Generic Adaptation Pathways for Coastal Archetypes under Uncertain Sea-Level Rise. Environ. Res. Commun. 2019, 1, 071006. [Google Scholar] [CrossRef]
  14. Truong, Q.C.; Nguyen, T.H.; Tatsumi, K.; Pham, V.T.; Tri, V.P.D. A Land-Use Change Model to Support Land-Use Planning in the Mekong Delta (MEKOLUC). Land 2022, 11, 297. [Google Scholar] [CrossRef]
  15. Çağlıyan, A.; Dağlı, D. Monitoring Land Use Land Cover Changes and Modelling of Urban Growth Using a Future Land Use Simulation Model (FLUS) in Diyarbakır, Turkey. Sustainability 2022, 14, 9180. [Google Scholar] [CrossRef]
  16. Taillandier, P.; Banos, A.; Drogoul, A.; Gaudou, B.; Marilleau, N.; Truong, Q.C. Simulating Urban Growth with Raster and Vector Models: A Case Study for the City of Can Tho, Vietnam. In Autonomous Agents and Multiagent Systems; Osman, N., Sierra, C., Eds.; Lecture Notes in Computer Science; Springer International Publishing: Cham, Switzerland, 2016; Volume 10003, pp. 154–171. ISBN 978-3-319-46839-6. [Google Scholar]
  17. Truong, Q.C.; Taillandier, P.; Gaudou, B.; Vo, M.Q.; Nguyen, T.H.; Drogoul, A. Exploring Agent Architectures for Farmer Behavior in Land-Use Change. A Case Study in Coastal Area of the Vietnamese Mekong Delta. In Multi-Agent Based Simulation XVI; Gaudou, B., Sichman, J.S., Eds.; Lecture Notes in Computer Science; Springer International Publishing: Cham, Switzerland, 2015; pp. 146–158. ISBN 978-3-319-31446-4. [Google Scholar]
  18. Truong, Q.C.; Gaudou, B.; Taillandier, P.; Drogoul, A.; Espagne, E.; Huynh, N.Q.; Nguyen, T.H.; Pham, T.T.N.; Nguyen, T.H. Adaptation Strategies in the Mekong Delta. In Climate Change in Viet Nam Impacts and Adaptation; Espagne, E., Ed.; A COP26 assessment report of the GEMMES Viet Nam project; Agence Française de Développement: Paris, France, 2021. [Google Scholar]
  19. Bonabeau, E. Agent-Based Modeling: Methods and Techniques for Simulating Human Systems. Proc. Natl. Acad. Sci. USA 2002, 99, 7280–7287. [Google Scholar] [CrossRef] [PubMed] [Green Version]
  20. Espagne, E.; Nguyen, T.T.H.; Tran, T.A.D.; Rieber, A.; Hoai, D.T.T.; Mania, E.; Simioni, M.; Sempé, G.; Yen Ha, B. The Macroeconomics of Climate Change and Adaptation in Viet Nam. In Climate Change in Viet Nam Impacts and Adaptation; Espagne, E., Ed.; A COP26 assessment report of the GEMMES Viet Nam project; Agence Française de Développement: Paris, France, 2021. [Google Scholar]
  21. Eslami, S.; Hoekstra, P.; Minderhoud, P.S.J.; Trung, N.N.; Hoch, J.M.; Sutanudjaja, E.H.; Dung, D.D.; Tho, T.Q.; Voepel, H.E.; Woillez, M.-N.; et al. Projections of Salt Intrusion in a Mega-Delta under Climatic and Anthropogenic Stressors. Commun. Earth Environ. 2021, 2, 142. [Google Scholar] [CrossRef]
  22. Tran Anh, Q.; Ngo-Duc, T.; Espagne, E. Statistical Downscaling and Probabilistic Projections for Climate Risk Analysis in Viet Nam. In National Climate Change Impacts and Adaptation, Final Report GEMMES Viet Nam Project; Espagne, E., Magacho, G., Eds.; Final Report; Agence Française de Développement: Paris, France, 2022. [Google Scholar]
  23. TCVN 8641-2011; Vietnam Standard TCVN 8641-2011 on Hydraulic Structures—Irrigation and Drainage Techniques for Provisions Crops. Ministry of Science and Technology: Hanoi, Vietnam, 2011.
  24. Vượng, N.Đ.; Thạch, Q.Đ. Assessment of saving watering model and recommendations suitable irrigation methods for green asparagus in Ninh Thuan province. J. Sci. Technol. Irrig. 2019, 59, 71–80. [Google Scholar]
  25. ATESO. Table of Water Requirements of Fruit Trees. 2018. Available online: https://ateso.vn/bang-nhu-cau-ve-luong-nuoc-cua-cac-loai-cay-an-trai/ (accessed on 21 July 2022).
  26. Nguyen, H.T.; Nguyen, H.T.; Truong, C.Q.; Pham, T.V.; Phan, H.V.; Vuong, T.H.; Dang, K. Son Application of Optimization Algorithm and Allocation of Agricultural Land Use in the Mekong Delta. Vietnam Soil Sci. 2019, 57, 97–102. [Google Scholar]
  27. Nguyen, T.H. Analyzing the Relationship between Socio-Economic-Environmental Factors for Building an Integrated System Supporting Agricultural Land Use Planning—A Case Study in Soc Trang Province. Ph.D. Thesis, Can Tho University, Can Tho, Vietnam, 2021. [Google Scholar]
  28. Food and Agriculture Organization of the United Nations. Crop Evapotranspiration: Guidelines for Computing Crop Water Requirements; Allen, R.G., Ed.; FAO Irrigation and Drainage Paper; Food and Agriculture Organization of the United Nations: Rome, Italy, 2000; ISBN 978-92-5-104219-9. [Google Scholar]
  29. The Government of Vietnam. Resolution 120/NQ-CP on Sustainable and Climate-Resilient Development of the Mekong River Delta; No. 120/NQ-CP; The Government of Vietnam: Hanoi, Vietnam, 2017.
  30. The Prime Minister of Vietnam Approving the Master Program for Sustainable Agricultural Development with Climate Change in the Mekong Delta until 2030, with a Vision to 2045; The Prime Minister’s Decision No. 324/QDD-TTg; The Government of Vietnam: Hanoi, Vietnam, 2020.
  31. Thanh Vu, P.; Trang Hoang Nhu, N.; Tuan Huy, V.; Quang Tri, L. Determination of Socio-Economic and Environment Factors Affected to the Selection of Farming Models in the Bac Lieu Province. J. Sci. Can. Tho Univ. 2013, 27, 68–75. [Google Scholar]
  32. FAO. A Framework for Land Evaluation, 2nd ed.; Soil Resources, Management and Conservation Service Edition; FAO Soils Bulletin; FAO: Rome, Italy, 1981; ISBN 92-5-100111-1. [Google Scholar]
  33. Taillandier, P.; Gaudou, B.; Grignard, A.; Huynh, Q.-N.; Marilleau, N.; Caillou, P.; Philippon, D.; Drogoul, A. Building, Composing and Experimenting Complex Spatial Models with the GAMA Platform. GeoInformatica 2019, 23, 299–322. [Google Scholar] [CrossRef] [Green Version]
  34. Maire, J.; Alexander, P.; Anthoni, P.; Huntingford, C.; Pugh, T.A.M.; Rabin, S.; Rounsevell, M.; Arneth, A. A New Modelling Approach to Adaptation-Mitigation in the Land System. In Climate Adaptation Modelling; Kondrup, C., Mercogliano, P., Bosello, F., Mysiak, J., Scoccimarro, E., Rizzo, A., Ebrey, R., de Ruiter, M., Jeuken, A., Watkiss, P., Eds.; Springer: Cham, Switzerland, 2022; pp. 133–140. [Google Scholar]
  35. Williams, P.A.; Ng’ang’a, S.K.; Crespo, O.; Abu, M. Cost and Benefit Analysis of Adopting Climate Adaptation Practices among Smallholders: The Case of Five Selected Practices in Ghana. Clim. Serv. 2020, 20, 100198. [Google Scholar] [CrossRef]
  36. Abadie, L.M.; Sainz de Murieta, E.; Galarraga, I. The Costs of Sea-Level Rise: Coastal Adaptation Investments vs. Inaction in Iberian Coastal Cities. Water 2020, 12, 1220. [Google Scholar] [CrossRef]
Figure 1. Main entities of the LUCAS–GEMMES model.
Sustainability 15 05355 g001
Figure 2. Conceptual model of LUCAS–GEMMES.
Sustainability 15 05355 g002
Figure 3. The provinces in the Mekong Delta with agro-ecological zones (Generated in reference to Bong et al. [7]).
Sustainability 15 05355 g003
Figure 4. Economic data of land-use types in the Mekong Delta. Note: 1 USD~23,450 VND.
Sustainability 15 05355 g004
Figure 5. Projected land use in 2050 as per the four experiments. (a) Experiment 1: Baseline 1; (b) Experiment 2: Baseline 2, subsidence impact; (c) Experiment 3: Reaction to subsidence of 0.1 m; (d) Experiment 4: Reaction to subsidence of 0.1 m along with an adaptation mechanism.
Sustainability 15 05355 g005
Figure 6. Vulnerability maps for rice and shrimp until 2050. (a) Experiment 1: Baseline 1; (b) Experiment 2: Baseline 2, subsidence impact; (c) Experiment 3: Reaction to subsidence of 0.1 m; (d) Experiment 4: Reaction to subsidence of 0.1 m along with an adaptation mechanism.
Sustainability 15 05355 g006
Figure 7. Vulnerable area for rice and shrimp until 2050.
Sustainability 15 05355 g007
Figure 8. Water demand evolution for the four experiments, with various values of the subsidence threshold.
Sustainability 15 05355 g008
Figure 9. Accumulated losses for rice and shrimp until 2050.
Sustainability 15 05355 g009
Figure 10. Evolution of annual incomes for the four experiments until 2050.
Sustainability 15 05355 g010
Table 1. Water demand under various land uses in the dry season.
Land UseVolume (m3/ha/Season)Reference
3 rice crops7500Water needed for winter–spring (3 months in the dry season) according to Vietnam Standard 8641-2011 [23]
Vegetables4658The water volume of green asparagus 4658 m3/ha/season (80 days) [24]
Fruit trees (pomelo, mango, longan, etc.)13,200100 L/6-year-old tree × 10 times/month × 6 months × 2000 trees/ha (losses compensation 10%) [25]
Table 2. List of parameters explored in the LUCAS model.
ParameterExplanation
WProfitThe weight of profitability criteria
WSuitabilityThe weight of suitability criteria
WLU_abilityThe weight of agriculture technical convertibility criteria
Winfluence_neigborsThe weight of the influence index of neighbors
Tolerance temperature for riceThe maximum temperature rice tolerates
Tolerance precipitation for riceThe minimum precipitation rice tolerates
Tolerance temperature for shrimpThe maximum temperature shrimp tolerates
Tolerance precipitation for shrimpThe maximum rainfall sensitivity for shrimp
Subsidence thresholdThe subsidence level at which provinces and individual farmers decide to apply adaptation or mitigation strategies
Table 3. List of the province adaptation strategies based on the AEZ and subsidence.
Adaptation StrategyAEZ NameSubsidence Level AppliedLand-Use Strategy
3 Rice Crops2 Rice Crops VegetablesShrimpFruit TreesRice-Shrimp
Living with floodsUpstream zoneNot affected (subsidence level < thresholdAEZ)SSSNNN
Optimizing farmer incomeMiddle zoneSSSNSN
Living with salt water Coastal zoneNSSSSS
Living with floods; protecting groundwater Upstream zoneSubsidence level > thresholdAEZNSNNNN
Optimizing income; protecting groundwaterMiddle zoneNSNNNN
Living with salt water; protecting groundwater Coastal zoneNSNSNS
Note: S = a land-use type is suitable; N = a land-use type is not suitable.
Table 4. Area of land use for the four experiments in 2050.
ExperimentThree Rice Crops
(ha)
Two Rice Crops
(ha)
Rice-Shrimp
(ha)
Aquaculture
(ha)
Vegetable
(ha)
Fruit Trees
(ha)
EXP1640,425687,875-799,47570,050800,425
EXP2635,500686,750-799,47569,775806,750
EXP3778,050872,425-755,175118,550474,050
EXP4—0.1 m544,1251,166,150-781,95083,200422,825
EXP4—0.2 m705,000984,900-775,875103,850428,625
EXP4—0.5 m745,525912,700-760,775127,900451,350
EXP4—1.0 m745,725907,575-755,625131,350457,975
Disclaimer/Publisher’s Note: The statements, opinions and data contained in all publications are solely those of the individual author(s) and contributor(s) and not of MDPI and/or the editor(s). MDPI and/or the editor(s) disclaim responsibility for any injury to people or property resulting from any ideas, methods, instructions or products referred to in the content.

