Article

Environmental Sustainability of Bricks in an Emerging Economy: Current Environmental Hotspots and Mitigation Potentials for the Future

by
Kamrul Islam
1,2,*,
Masaharu Motoshita
1 and
Shinsuke Murakami
2,3
1
Research Institute of Science for Safety and Sustainability, National Institute of Advanced Industrial Science and Technology, 16-1 Onogawa, Tsukuba 305-8569, Ibaraki, Japan
2
Department of Systems Innovation, Graduate School of Engineering, The University of Tokyo, 7-3-1 Hongo, Bunkyo-ku, Tokyo 113-8656, Japan
3
Department of Technology Management for Innovation, Graduate School of Engineering, The University of Tokyo, 7-3-1 Hongo, Bunkyo-ku, Tokyo 113-8656, Japan
*
Author to whom correspondence should be addressed.
Sustainability 2023, 15(6), 5228; https://doi.org/10.3390/su15065228
Submission received: 6 February 2023 / Revised: 9 March 2023 / Accepted: 13 March 2023 / Published: 15 March 2023

Abstract

:
Clay-fired bricks are widely used in emerging economies mainly because of the unavailability of higher-grade construction and building materials; however, they are associated with significant social and environmental damage. The environmental burdens associated with the fuels and materials required for brick production are huge, as they have both direct and indirect effects along supply chains. This study aimed to assess the environmental footprints of brick production along supply chains, focusing on relevant environmental issues in brick production: carbon dioxide emissions, water consumption, and land use. We demonstrate that fuelwood consumption constitutes a major share of the carbon and water footprints, whereas built-up land for brick drying dominates the major effect of land use. Our expansion of the ecological footprint method enables a comparison of the effects of three different environmental issues with the same land area dimension, which reveals the relative severity of carbon dioxide emissions that account for up to 20% of the national CO2 inventory. For the potential reduction in the environmental footprint of brick production, scenario analysis showed a substantial reduction by replacing clay-fired bricks with concrete bricks. The shift to alternative materials, together with mitigation measures for brick production, can effectively alleviate the environmental pressures of construction materials in future emerging economies.

1. Introduction

Bricks are an important construction material that is widely used in Bangladesh. Owing to the current economic growth of the country, the use of brick is expected to accelerate in the foreseeable future [1], even though it has major socio-environmental consequences [2,3]. Owing to the rising demand for bricks, the number of brickfields has increased in Bangladesh, with a heavy concentration at the outskirts of major cities, especially near the capital city and other districts, which could be better understood by observing the country’s standing in terms of brick production worldwide—the fourth largest [4]. However, there is much debate about the actual representative figure regarding the number of brick kilns, let alone the annual brick production. According to a government report, approximately 7881 brick kilns in the country produced approximately 34 billion bricks in 2018 [5]. However, other reports suggest that the number of kilns is much higher, reaching ~45,000, many of which are unregistered [6].
The universally recognized red clay brick is a 6000-year-old construction material produced from naturally occurring clay and shaped through simple processes [7]. Asia is the largest producer of clay-fired bricks, with a staggering 87% of the 1.5 trillion bricks produced annually being produced in this populous continent, and specifically with South Asian countries such as Bangladesh, India, Nepal, and Pakistan contributing ~20% of this figure [7,8]. Owing to the limited availability of higher-grade construction materials (e.g., gravel and stone) and its higher expenses, Bangladesh heavily relies on clay-fired bricks. In addition, road construction uses brick chips from recycled bricks as well as production losses, which are not widely practiced elsewhere. The clay requirement for brick production is simple, and most often clay comes from agricultural land and, in some cases, from cutting down hills [9]. However, Bangladesh’s environmental law does not permit any of these activities (striping topsoil from agricultural land and extracting soil through cutting down hills), but rampant brickfields can be found everywhere in the country. Shaped clay is burned using coal or fuelwood in South Asian countries, and a significant amount of exhaust gases is released to the environment every year. Fuelwood, coal, and fossil fuels are energy materials that are frequently used to burn soft clay bricks; exhaust gases and other emissions, for example, CO2, are being released into the environment. In Dhaka, the capital city of Bangladesh, the total emissions from brick kilns from the outskirts of the city are estimated at 1.8 million tons of CO2 emissions from producing ~3.5 billion bricks per year, using energy-inefficient technologies such as fixed-chimney bull-trench kilns that use coal, fuelwood, and agricultural waste as energy materials [10]. Water is another input for producing bricks, used for mixing materials and cleaning facilities [11]. In addition to direct water input, indirect water input for the production of materials and fuels can affect the water demand for brick production, particularly the use of fuel and firewood [12,13]. It is important to note that brickfields are typically established by acquiring land from other land uses, such as agriculture and forest. Land use issues in brick production are also crucial. The relevant environmental impacts of brick production in Bangladesh can be summarized by the following three environmental burdens: CO2 emissions, water usage, and land use change. However, in addition to this single environmental issue, the relationships between the relevant environmental issues are also crucial to explore, as they would provide a simple yet effective understanding of the different environmental dimensions of brick production in a comparative manner.
These environmental burdens associated with brick production occur not only on-site of the brick production but also along the supply chains of input materials and energy. In this context, the environmental footprint is a relevant tool for assessing the environmental performance of brick production along the entire supply chain. The ‘environmental footprint’ is a commonly used approach to quantify the anthropogenic pressure on the environment, in which resource appropriation and waste generation are estimated [14]. Several footprint methodologies have already been developed, such as carbon footprint (CF), water footprint (WF), material footprint (MF), and ecological footprint (EF). CF measures the potential impacts on climate change owing to greenhouse gases (GHGs) released into the environment by anthropogenic activities, which is related to the concept of EF, which accounts for humanity’s demand on the ecosystem [15]. WF is an indicator of water resource appropriation and the dilution of pollutants in water bodies caused by anthropogenic activities [16,17]. On the other hand, MF is related to the global allocation of used raw material extraction in the final demand of an economy [18]. Many footprint methodologies can assess environmental performance for a single environmental issue through the supply chains of the target product system. When we focus on different environmental issues simultaneously, it is usually difficult to directly compare different footprints with the same metrics. EF captures different environmental aspects using the common unit of land, which enables us to assess the footprints of different issues in parallel. EF is defined as the biologically productive land and water bodies required to produce goods and assimilate the pollution generated by anthropogenic activities [19]. Currently, EF focuses on measuring the potential effects of carbon emissions and various land uses, although there is the potential to expand the target environmental issues, for instance, including water use by using the area of water catchment for collecting the consumed volume of water. The central idea of any environmental footprint is to assess the environmental impacts along the supply chains, and their application can cover the relevant environmental issues in parallel.
The government of Bangladesh is attempting to phase out the dirty brick-making process by 2025–2030, but the current trend of brick production and growth in the sector does not reflect any such scenario in the foreseeable future. The brick sector has been constantly growing in Bangladesh over the past 15–20 years, and it is predicted that it will grow by approximately 9% over the next 10 years [5]. Meanwhile, it significantly contributes to the economy while engaging approximately one million employees. Therefore, reducing the environmental impacts from the brick sector and phasing out age-old technology could produce better results. The objective of this study was to assess the environmental performance of an important construction and building material, bricks, with the aim of reducing its environmental footprint in the future. We focused on the relevant environmental issues of brick production: carbon dioxide emissions, water consumption, and land use. We also reveal the significance of environmental issues associated with brick production in an emerging economy. Moreover, this study shows how the environmental footprint of the brick sector in Bangladesh could be reduced by developing an alternative scenario.

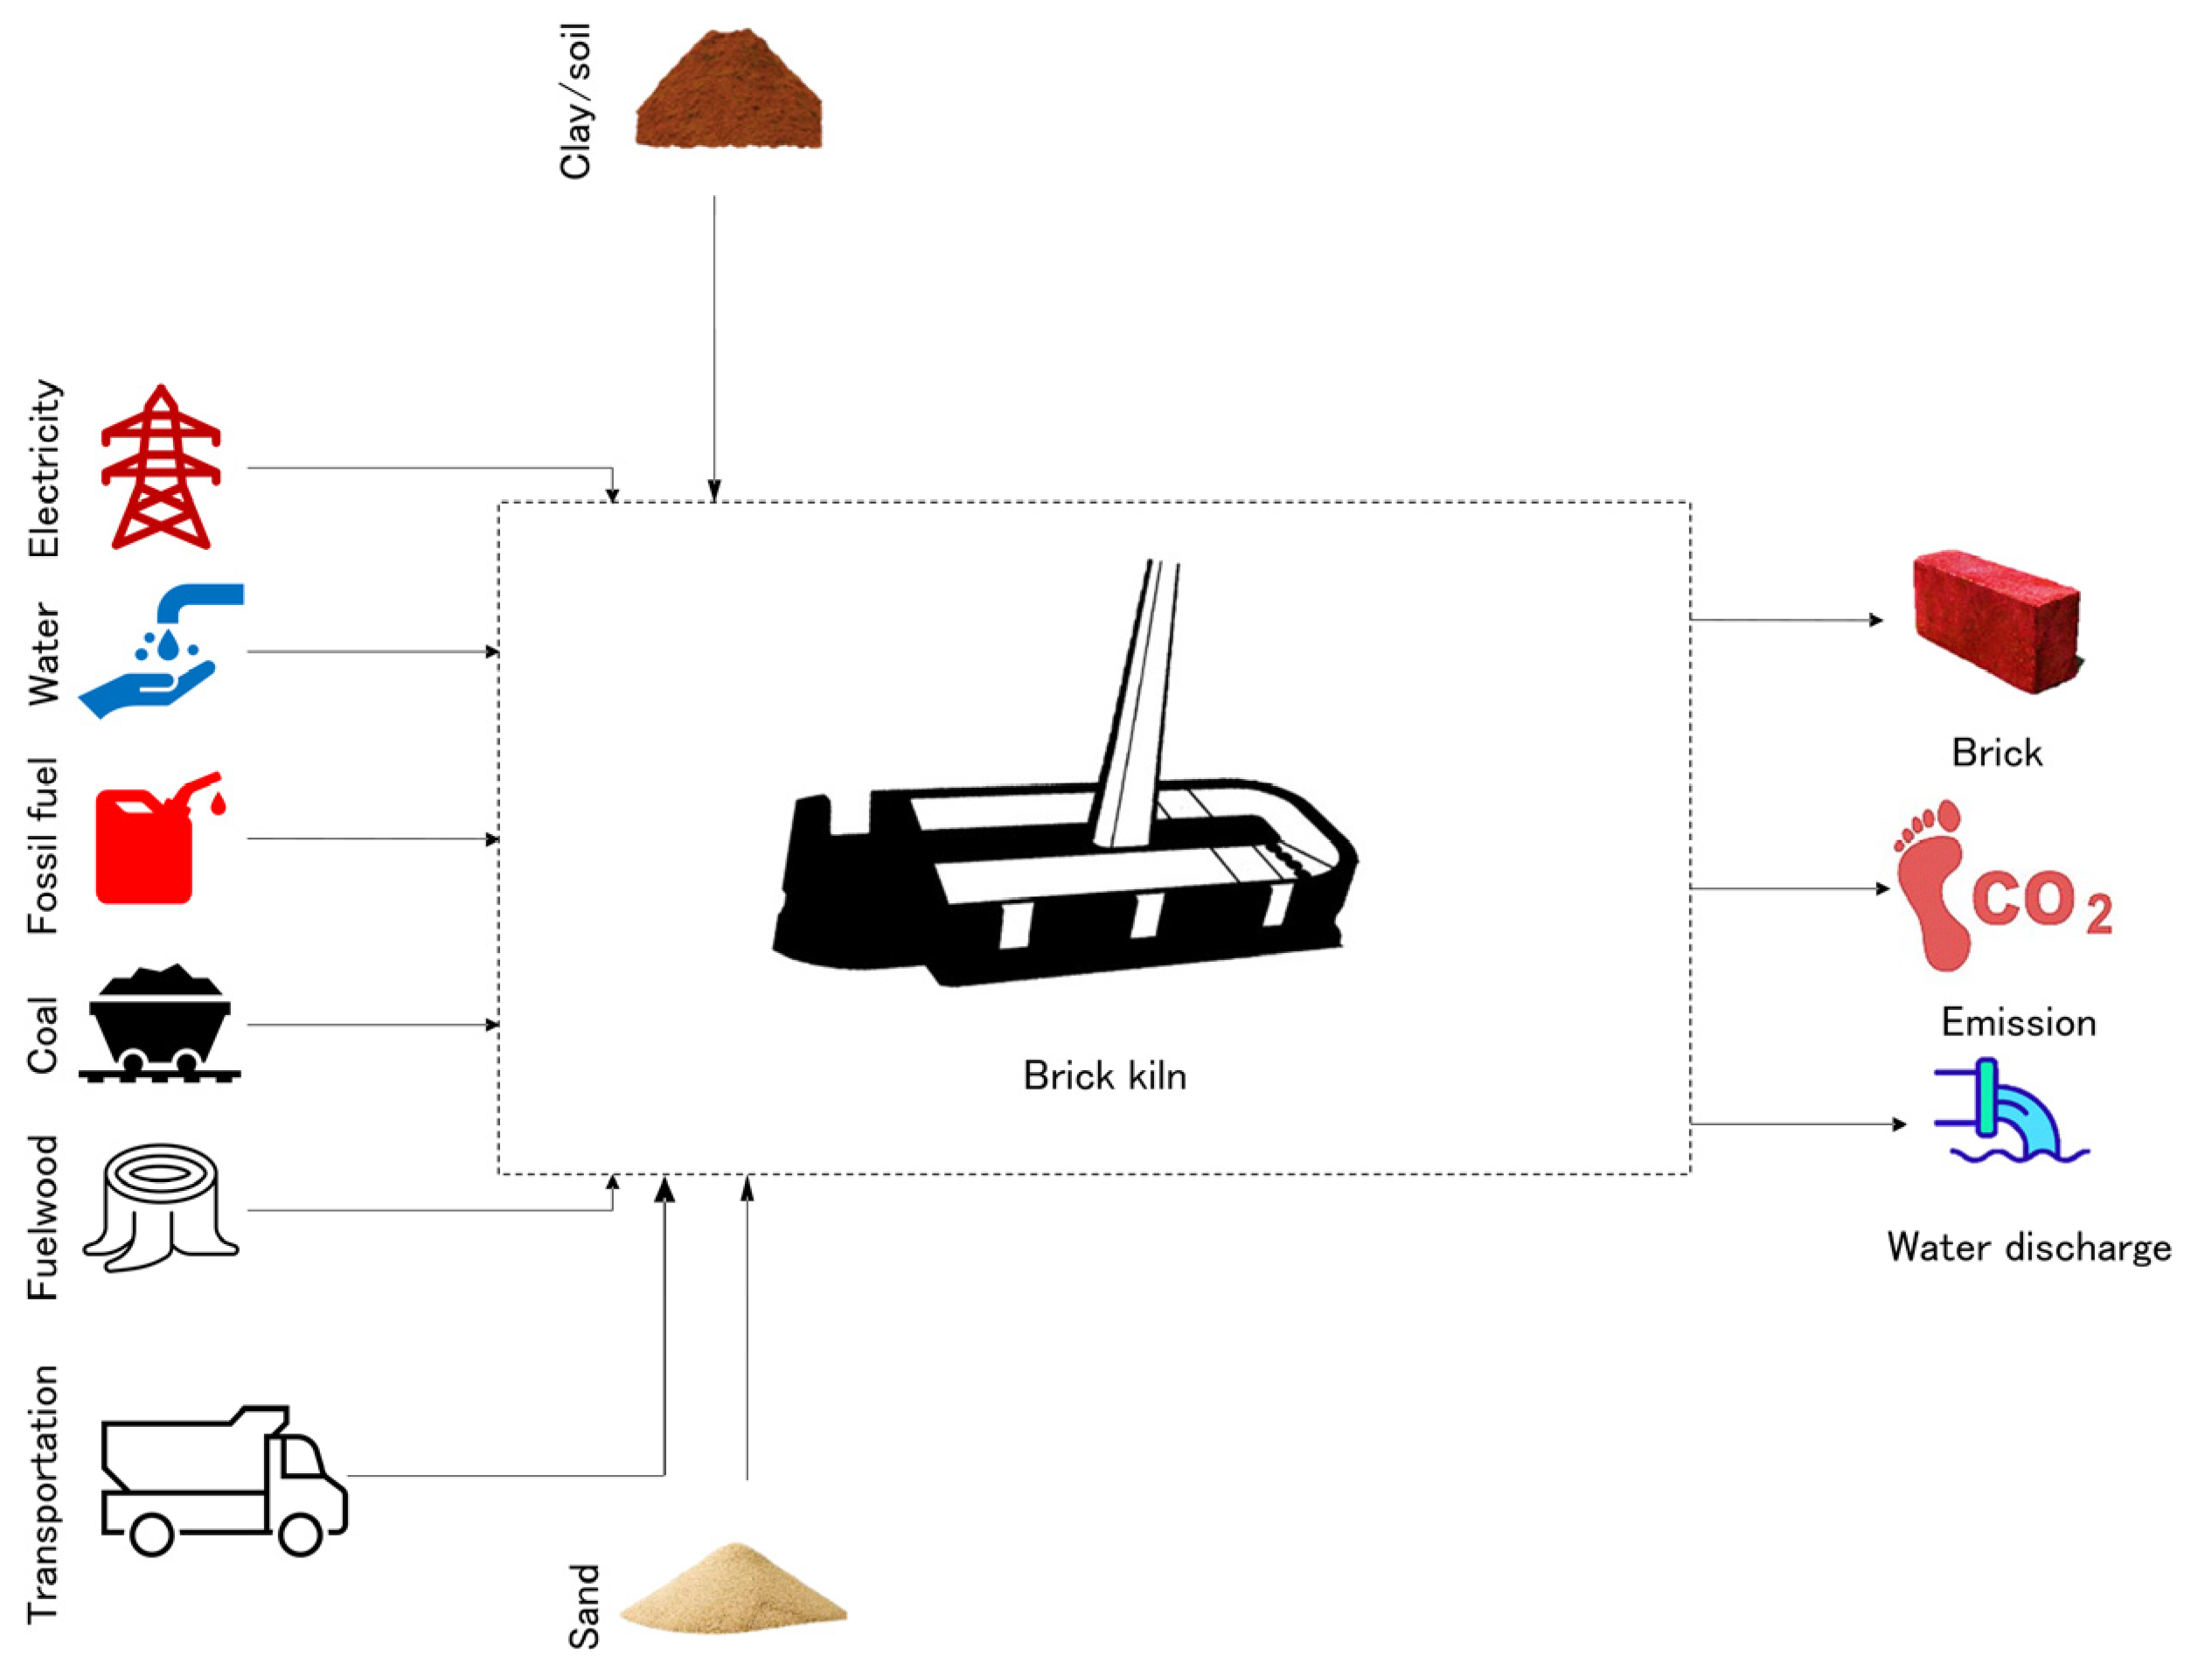
2. Materials and Methods

2.1. Effects of Carbon Emissions, Water Consumption, and Land Use

The main data source for brick production in Bangladesh is the Department of Environment. Figure A1 in the Appendix A shows the per capita brick production (estimated by the number of bricks consumed) of the country projected until 2030. Brick production per capita in 2006 was approximately 112 bricks, which rose to 223 bricks per capita in 2020. From this perspective, the estimated total number of bricks used in Bangladesh in 2020 was ~36.78 billion. It is projected that brick production per capita will reach 331 by 2030. This study used per capita brick production to estimate the environmental footprint of the brick sector in the country.
The CF of brick production was calculated using a previously described methodology [20]. Figure A2 in the Appendix A shows the system boundary of brick production, where the functional unit (FU) was considered as the production of a single brick (weighing 2.8 kg) from the brick kiln. Fuel required for transporting the materials as well as carrying the fuel itself from the depo is included in the system as ‘Transportation’, which is shown in Figure A2 in the Appendix A. This FU remains the same for other footprints accounting for brick production, that is, WF and EF. Clay, water, fossil fuel (for powering brick molding and transportation), coal (for firing the brick), fuelwood (for firing the brick), and sand were the raw materials used to produce the clay-fired bricks. A lifecycle inventory (LCI) was calculated based on the process data collected in a brickfield survey [21]. The brickfield owners provided information related to the material and land requirements for brick production. Table 1 shows the process data collected for brick production in Bangladesh via a survey. Eight brickfields were surveyed by enumerators taking assistance from local guides. In Bangladesh, the characteristics of brickfields are the same as those of the brick kiln technologies involved in the production process. Although increasing the number of surveys could provide a better representation of the brickfields, because of time and budget constraints, we were not able to consider it in this study. The combustion of fossil fuels and fuelwood produces CO2 that is then emitted back into the environment. On the other hand, some amount of water, especially from human metabolic activities (from brick production workers), is being discharged back to the environment, which could be considered grey WF for brick production. We followed the approach in [20] to calculate the WF of brick production. We used the following formula to calculate the WF for a single brick ‘p’ produced by the kiln. W F p r o d p is calculated as shown in Equation (1), where W F p r o c s is the WF of process step ‘s’ (volume/time), and P p is the quantity production of product ‘p’ (mass/time). While calculating the WF of a single brick, we considered the blue- and grey-water footprints. The green WF was not included in the accounting framework because rainwater is not used by the brick production sector in Bangladesh.
W F p r o d p = s = 1 k W F p r o c s P p   m 3 / brick
Based on the process data provided in Table 1, both the CF and WF were calculated. To calculate the CF of brick production, the first CF intensities of the different materials used in the production system were calculated. This was undertaken using local data, which reduces the uncertainty in the estimation. Table 2 shows the CF intensities of coal, fuelwood, electricity, diesel (for transportation), machinery oil (motor oil/Mobil), hydraulic oil, and kerosene. These data were used to calculate the CF in terms of the GWP of the bricks, as shown in Figure 1. Similar to CF accounting, the WF intensity of different materials used in brick production is first calculated using local data. Table 3 shows the water footprint intensity of the materials, whereas Figure 2 shows the WF of the brick together with the share of different materials in the total WF. In addition to carbon emissions and water consumption, brickfield land use is of concern in terms of the environmental loads relevant to brick production. In particular, built-up land that is required directly for brick production and indirectly for the production of input materials/energy reduces the capacity of primary production by natural vegetation, which can be quantified as a part of the EF. Different land features of the brickfield were measured during the brickfield survey, for example, kiln area, labor shed, and brick sundry field. However, the indirect land required for acquiring clay materials was not included in the EF accounting, mainly because data were unavailable, and this should be considered as a limitation of the present study. The measured values were used to calculate the EF as previously described [22]. Equations (2)–(4) were used to calculate the EF of the built-up land.
E F L ,   N = A L × E Q F L × Y F L ,   N
E Q F L = N P P L / N P P w
Y F L , N = N P P L , N / N P P L , w
Equation (2) shows the EF of country ‘N’ for land use type ‘L’ where A L represents area of land use type ‘L’ caused by or needed for establishment of a brick kiln, E Q F L is the equivalence factor of land use type ‘L’ in which the brick kiln is located, and Y F L ,   N denotes the yield factor of land use type ‘L’ for country ‘N’. The EF unit is global hectare (gha). YF shows the relative productivity of the world and national average hectares of a given land use type, whereas EQF represents the relative productivity of the world average hectares of different land use types. We used an updated EQF and YF following the methodology of [23], where these factors were updated by utilizing net primary productivity (NPP) to determine the impact of the relevant activity on the original environment. In Equations (3) and (4), NPP shows the average value of NPP, ‘L’ is the land use type, ‘N’ denotes country, and ‘W’ represents world average.

2.2. Comparative Assessment of the Effects of Carbon Emissions, Water Consumption, and Land Use

The environmental loads of carbon emissions, water consumption, and land use associated with brick production have different dimensions, which makes it difficult to understand the relative significance of each load in terms of environmental capacity. The EF can quantify the effects of direct land use, such as built-up land, and convert the effects of carbon emissions into land area for absorption. In addition to the integration of different environmental dimensions adopted in the traditional EF approach, there is potential for the expansion of this concept to water consumption. Several previous studies have introduced the interaction between land area and water consumption [24,25,26], which can be adopted for the conversion of water consumption into land area that is required for the acquisition of the amount of water. Here, we assessed the effects of carbon emissions and water consumption by adopting and expanding EF for the comparison of the effects of land use.
The carbon-absorption land needed to accommodate the CF of any concerned activity, in our case, brick production, is the only land use type in the EF that is used to track the waste product, CO2 emission. Brick production requires a large amount of energy to burn clay. Therefore, the carbon-absorption land for brick production is huge in terms of the EF. Equation (5) was used to calculate the carbon-absorption land based on the brickfield inventory data on the energy consumption to produce the brick.
E F C = P C   × 1 S O c e a n Y C   × E Q F L
where E F C   is the EF-carbon-absorption land, P C   denotes the annual CO2 emission from a brickfield, S O c e a n represents the fraction of anthropogenic CO2 emissions sequestered by the ocean in a year, and Y C   is the annual rate of CO2 emission absorption per hectare of forestland at the world average yield.
The land for the acquisition of available water was calculated based on the results of the global hydrological model WaterGAP 2.2d [27]. The model computes the natural water flow at the watershed level by calibrating with the actual flow at the river mouth of a watershed. We assumed the calculated natural water flows of the watersheds as the available water and determined the area required for the acquisition of the unit volume of available water by dividing the total available water amount by the total area of the watershed. We used the average value of water availability during 2006–2016 from the WaterGAP 2.2d model to obtain the coefficient of the required area for a unit volume of available water. To convert the water catchment area into a metric of global hectares, we used the equivalence factor of water provided by [23].

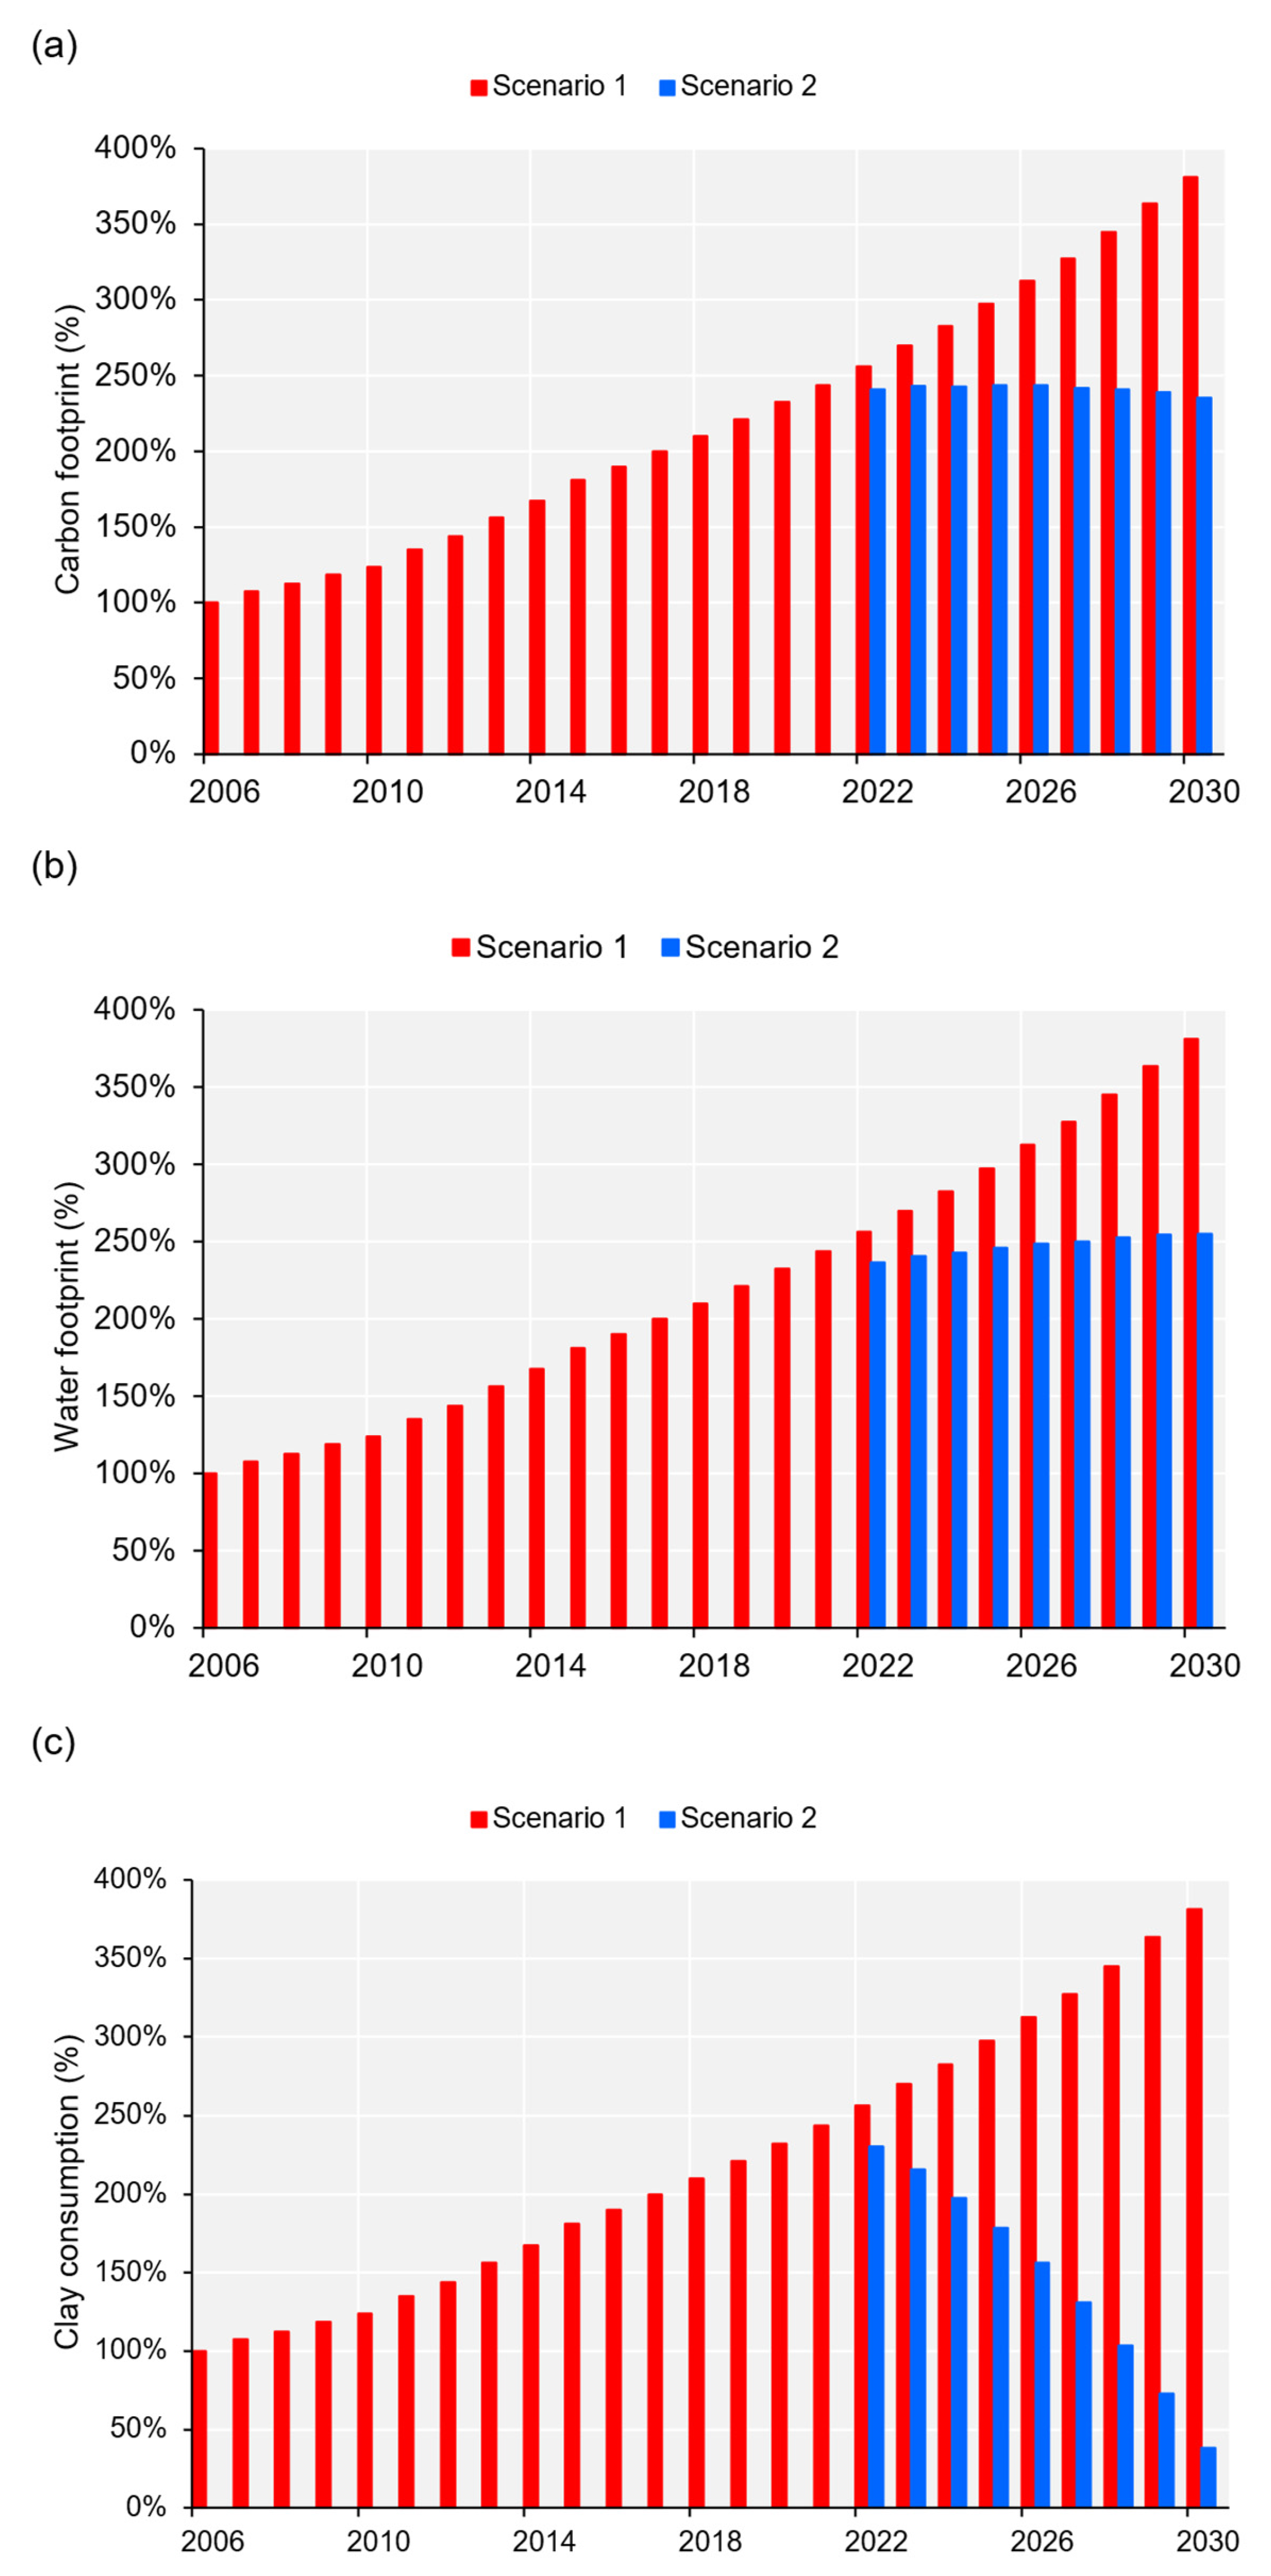
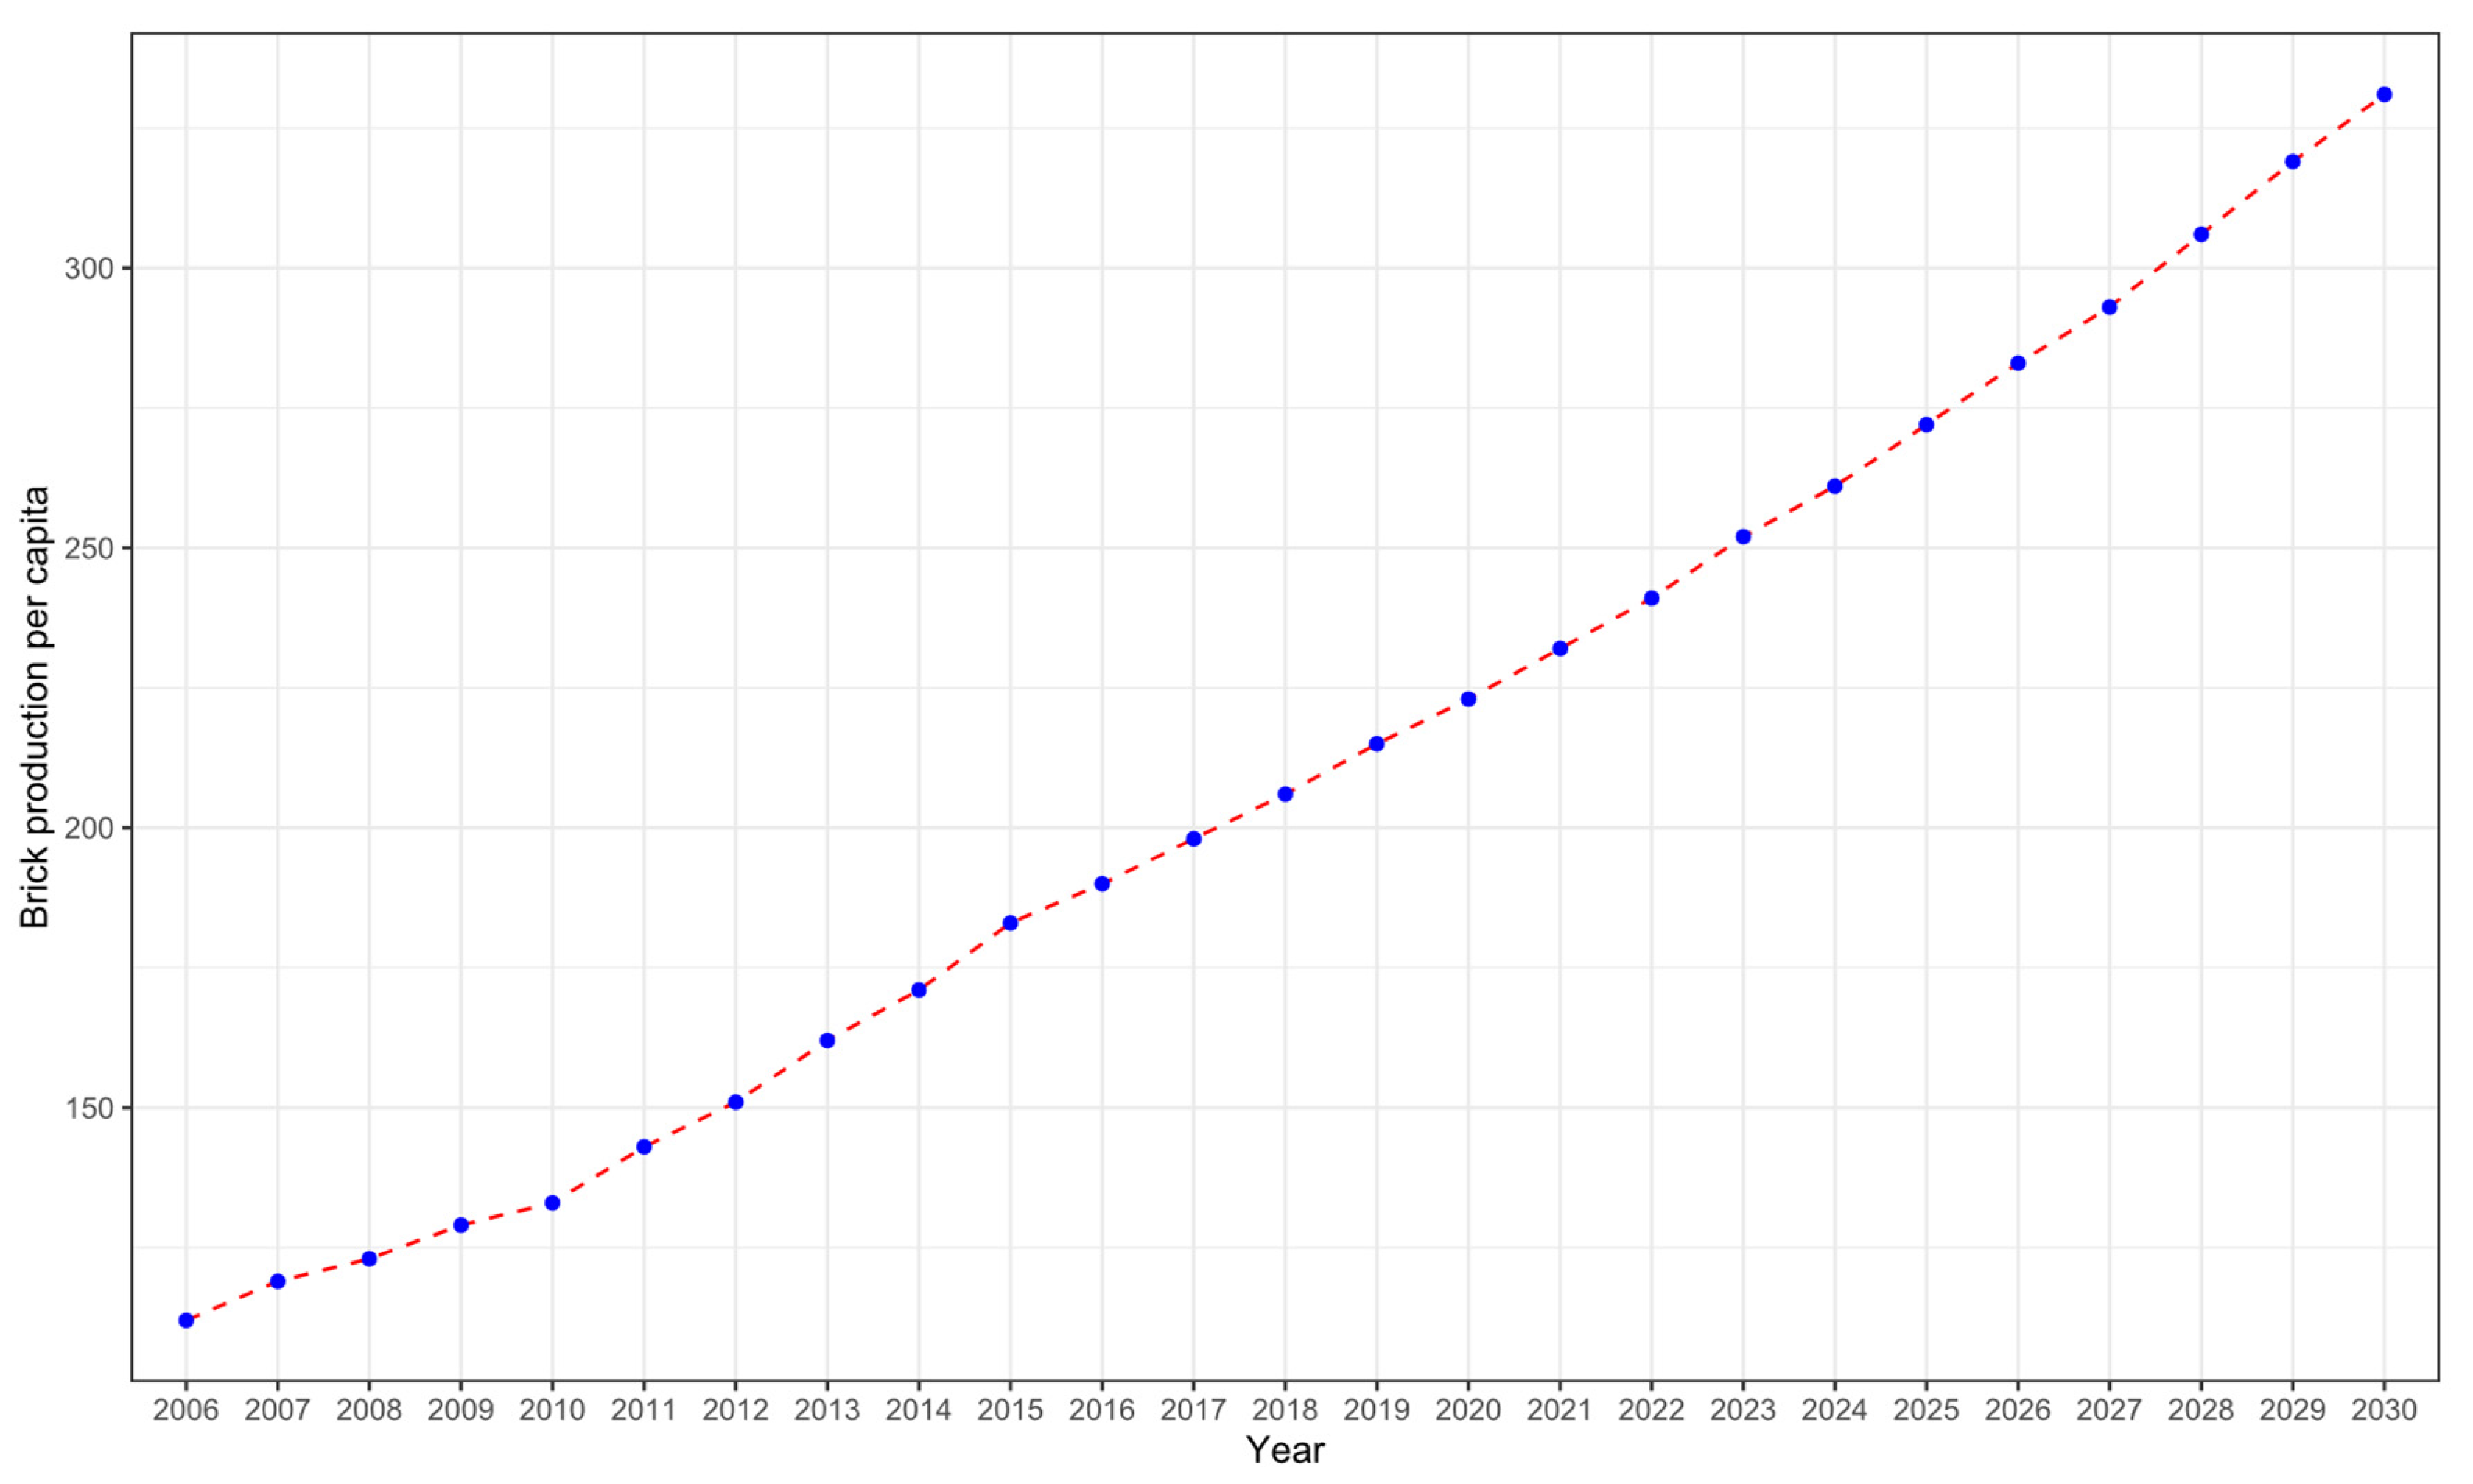
2.3. Future Scenario Analysis

We also provided an alternative scenario for future brick production by assuming a progressive reduction in brick consumption by replacing clay brick with concrete brick. We considered a 10% replacement of clay brick production with concrete brick production every year starting from 2022 and progressed until 2030, which results in the share of clay brick production being 10% and that of concrete brick production being 90% in 2030. The environmental footprints of both clay and concrete brick production were included in the future scenario analysis. By comparing the environmental footprints of the business-as-usual (BAU) scenario (Scenario 1) with the alternative scenario (Scenario 2), we demonstrated the effects of this moderate measure on three relevant environmental issues (climate change, water consumption, and land use) associated with brick production in the future. However, we did not consider the reduction in the EF of built-up land in alternative scenarios owing to data limitations.
Table 2. Carbon footprint intensity of different materials used in brick production.
InputCF IntensityUnitReference
Coal1.94 Notekg CO2 eq./kg[28,29]
Fuelwood0.22 Notekg CO2 eq./kg[30,31]
Electricity0.65kg CO2 eq./kWh[32]
Diesel0.55kg CO2 eq./L[20]
Machinery oil1.07kg CO2 eq./kg[33]
Hydraulic oil1.07kg CO2 eq./kg[33]
Kerosene0.55kg CO2 eq./L[20]
Note: The carbon footprint intensity of coal is considered for both production (0.05 kg CO2 eq./kg coal), and combustion of coal (1.89 kg CO2 eq./kg coal). For coal production carbon emission intensity, coal produced in the Barapukuria coal mine in Bangladesh was considered. However, for coal combustion carbon emission intensity, related data from the U.S. Energy Information Administration was considered, as the quality of the coal was similar. In the case of fuelwood, biogenic carbon was disregarded and a full impulse response function was considered to determine the global warming potential index of fuelwood derived from a tropical forest with an average species rotation of 26–50 years and a 100-year time horizon. We multiplied the global warming potential index value by that of direct CO2 emissions from biomass combustion [30,31,34].
Table 3. Blue water footprint intensity of different materials used in brick production.
InputWF IntensityUnitReference
Coal0.36m3/ton[35,36]
Fuelwood0.01 Notem3/kg[13]
Water0.0001m3/nos.Survey
Electricity0.0164m3/kWh[36]
Diesel0.0003m3/L[37]
Machinery oil0.0014m3/L[20]
Hydraulic oil0.0014m3/L[20]
Kerosene0.0003m3/L[37]
Note: A factor of 0.00138 to convert m3 of fuelwood into kg. Furthermore, the brickfield owner provided fuelwood use data in “maund” units, which is equivalent to 40 kg.

3. Results

3.1. Carbon Emissions, Water Consumption, and Land Use of the Brick Sector in Bangladesh

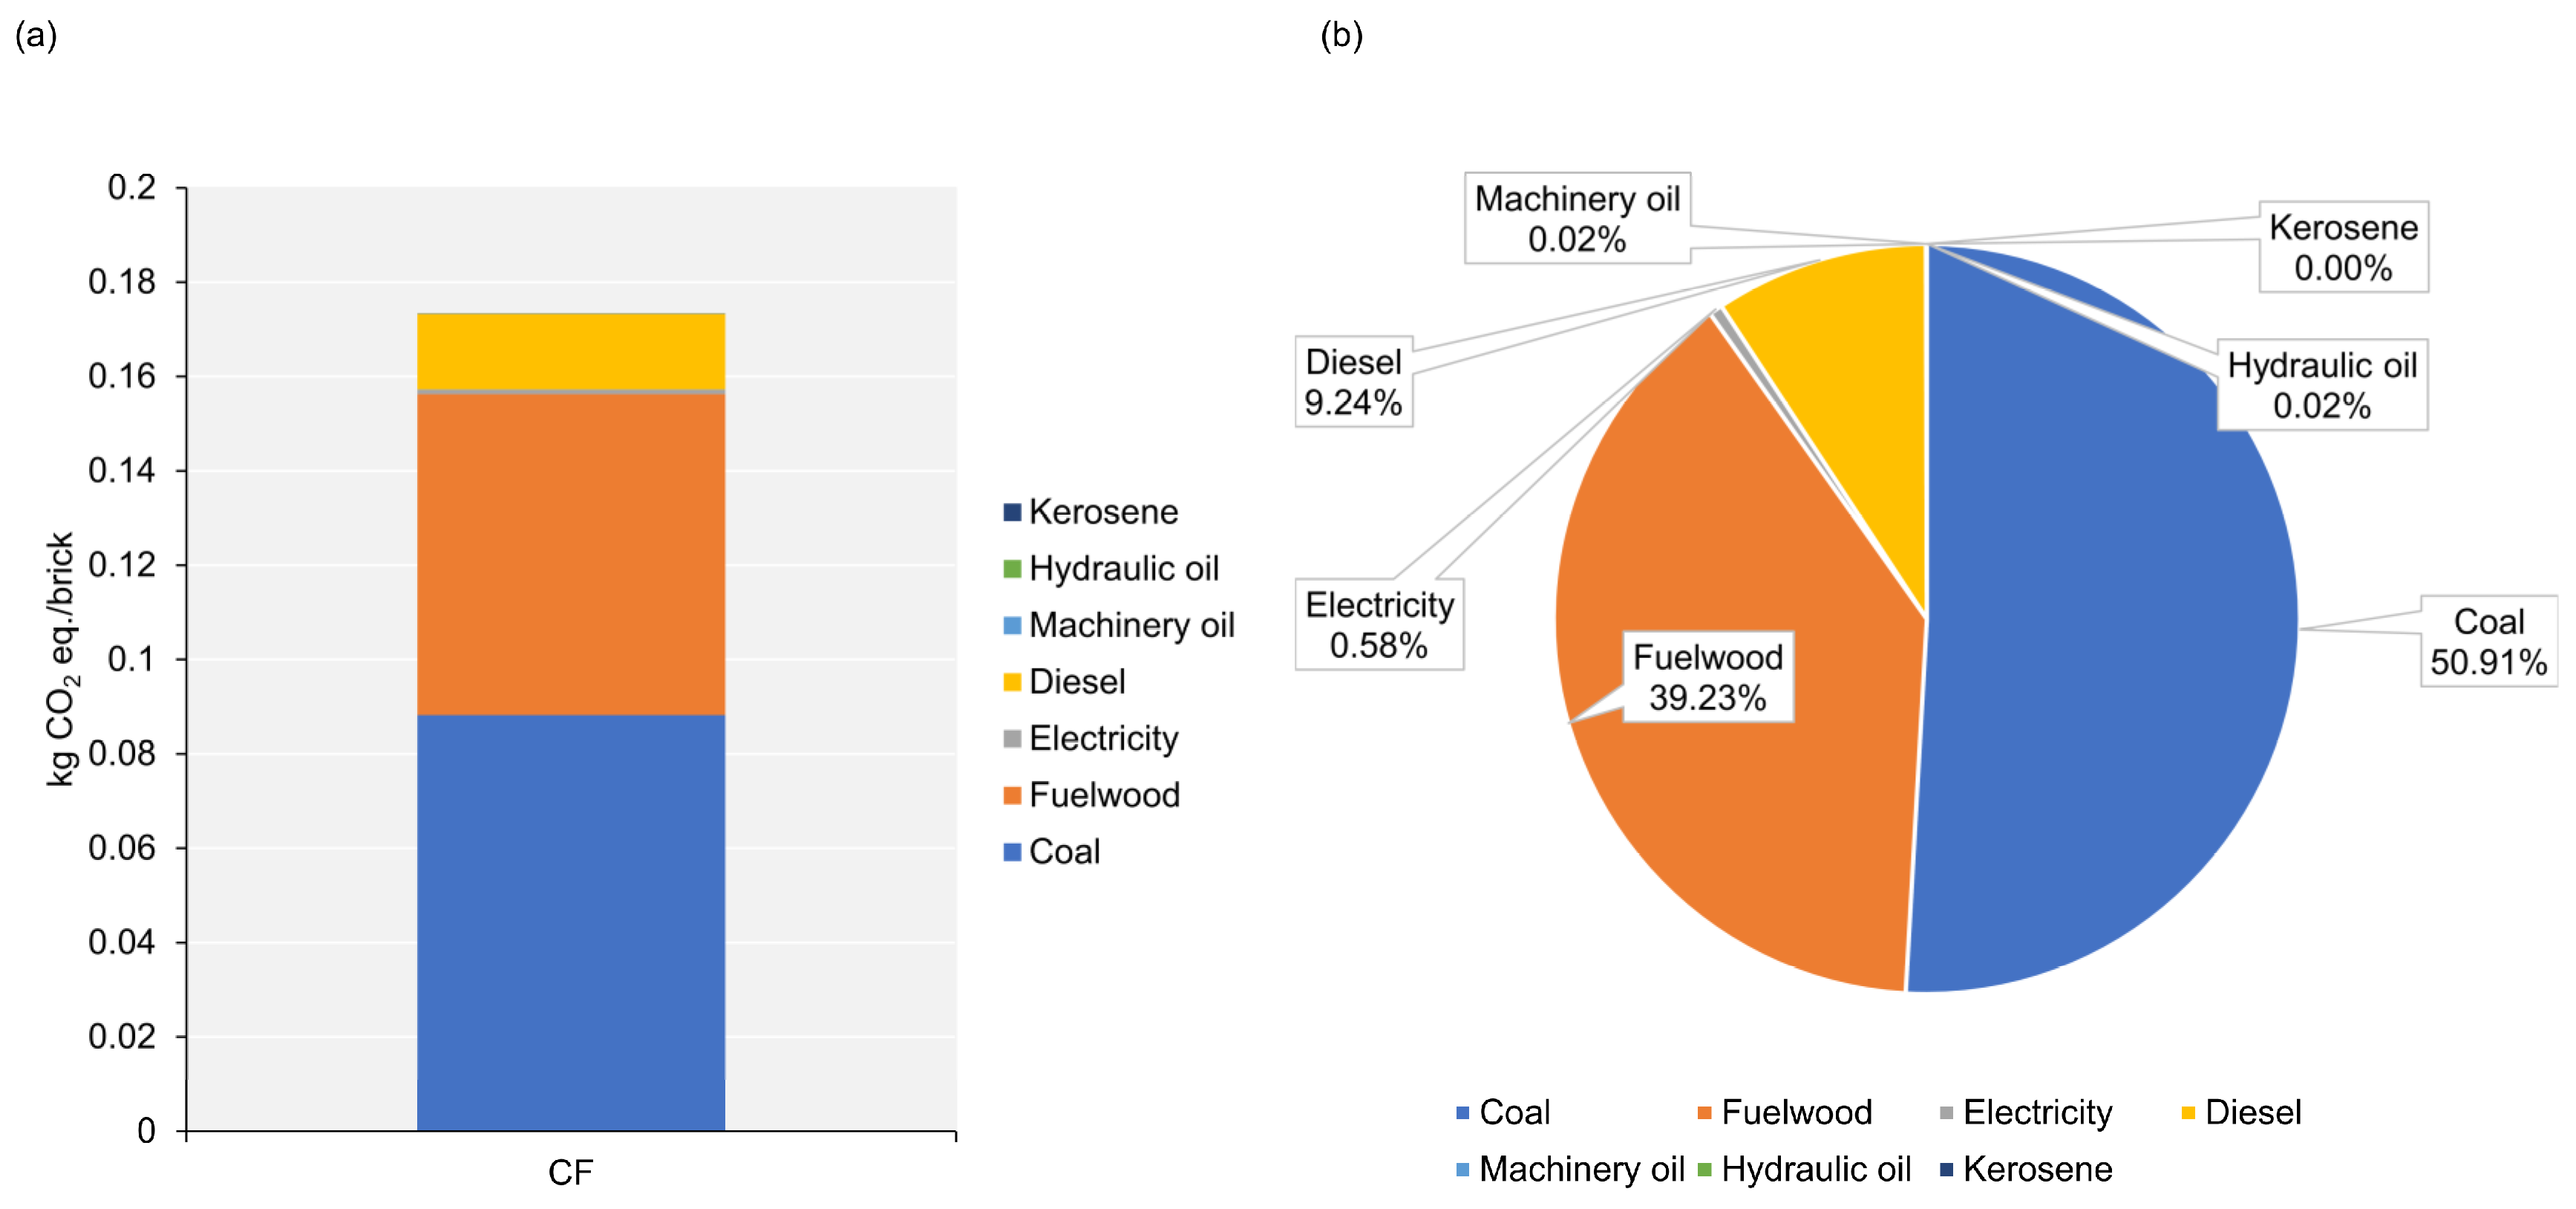
3.1.1. CF Accounting

Our results show that the CF of a single brick was approximately 0.17 kg CO2 eq., in which the combustion of coal to burn bricks contributed the most (approximately 50.91%) to the total CF, whereas fuelwood had the second largest contribution (~39.23%). Compared to clay-fired brick, concrete blocks have significantly less CF; for example, the CF of concrete blocks in the USA was ~0.1 kg CO2 eq./concrete block (considering the weight of a concrete block, ~2.8 kg, which is equivalent to the weight of a single brick) [38]. Although the analysis of the CF of concrete blocks had some uncertainty, it showed the potential to reduce the footprint. This finding requires further validation using local data, but this could not be performed owing to data limitations. The CF of single brick production was then used to estimate the total CO2 emissions from this sector for each year from 2006 to 2030, as shown in Figure A3 in the Appendix A. The total CF from brick production increased each year. During 2006, the CF from the brick sector was approximately 2742 kt CO2 eq., which rose to approximately 6375 kt CO2 eq. in 2020. According to the CF estimate, it may reach 10,454 kt CO2 eq. by 2030. Evidently, the total CO2 emissions from all concerned activities in Bangladesh during 2006 were ~35,900 kt CO2 eq. This means that the CF of brick production accounted for nearly 8% of all CO2 emissions in the country. In general, the CF of brick production accounted for 7–8% of all CO2 emissions in Bangladesh during 2006–2018. This implies that brick production remains a relevant source of CO2 emissions within the Bangladeshi economy.

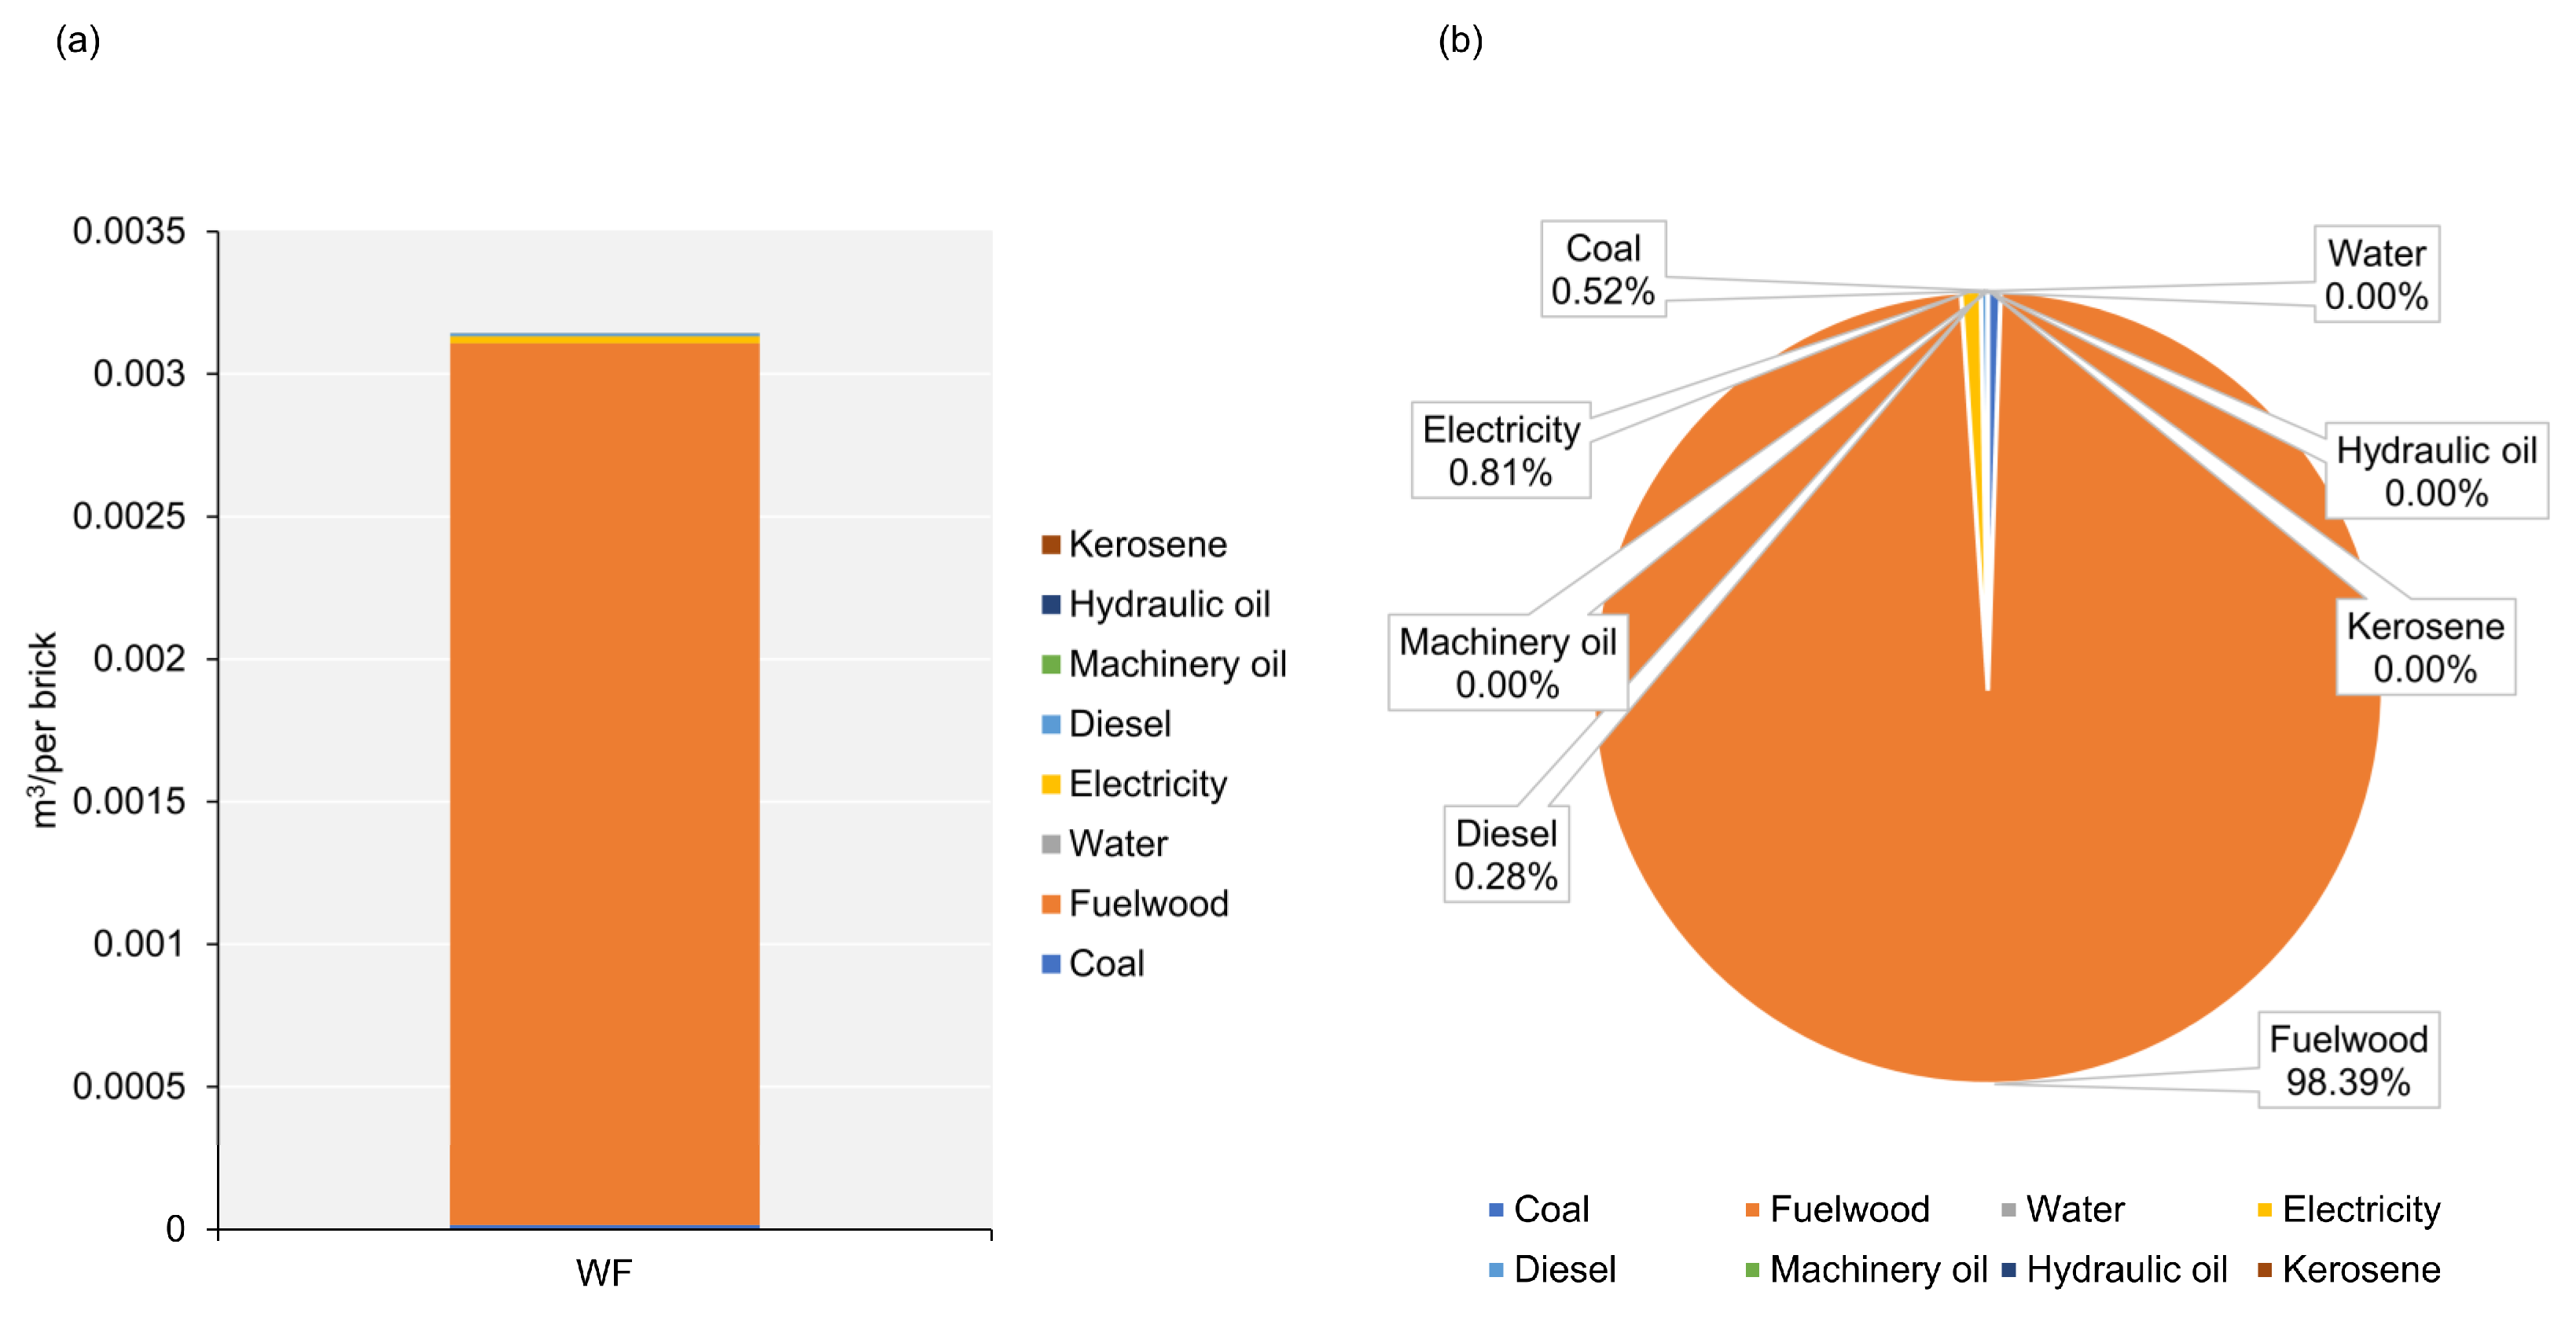
3.1.2. WF Accounting

Our results show that fuelwood consumption in brick production constituted the largest share, nearly 98.39% of the total WF. This resulted from the higher WF intensity of fuelwood. Much of this blue WF was related to the supply chain, as evident from the findings, whereas other materials did not contribute much to the WF of brick production. The total WF of single brick production was approximately 0.003 m3. We omitted the direct water consumption for brick production, which is estimated to be 0.0017 m3 per brick (average 3.0 kg) [11]. This demonstrates that indirect water consumption was approximately twice that of direct water consumption and was of high significance in terms of water consumption for brick production. The estimated WF of brick production was then used to estimate the total WF of brick production for a year, as shown in Figure 3. The volume of degraded water discharged back to the environment was obtained from a brickfield survey, and the estimated volume of water for diluting degraded water to an acceptable level concentration is denoted as grey WF according to the Water Footprint Network guidelines. As expected, it was negligible compared with the blue WF generated from brick production. During 2006, the total WF from brick production in Bangladesh was ~49.70 Mm3, which rose to ~115.54 Mm3 in 2020. The industrial water withdrawal of Bangladesh during 2003–2007 was ~746 Mm3 according to the AQUASTAT database of the Food and Agriculture Organizations. According to [27], the average consumption of industrial water was approximately 20% of the withdrawal. Thus, approximately 150 Mm3 of water was estimated to be consumed by all industrial sectors of Bangladesh during 2003–2007, whereas the brick sector of the country consumed one-third of that. The brick sector in Bangladesh accounted for approximately 1% of the total GDP in 2016 [39]. Considering these data, the WF of brick production in Bangladesh is significant, reaching ~189.47 Mm3 by 2030, much of which would come from fuelwood consumption if the current trend continues.

3.1.3. Land Use

Based on a brickfield survey, the brickfield areas with different features were measured and then used to calculate the EF of built-up land. Table 4 shows the results. A single brickfield has six major distinctive features: kiln, brick drying area, soil/clay storage area, fuel storage area, water storage area, and labor accommodation area. The area for brick drying constitutes most of the brickfield, which is reflected in the EF value. Our results show that the EF of built-up land for brick drying area was roughly 2.29 gha (occupied built-up land ~1.93 ha), which shared nearly 60.50% of the total EF for a single brickfield. In contrast, the EF of built-up land for kilns, labor accommodation, and water storage was 0.62, 0.38, and 0.36 gha, respectively. It is noteworthy that the total area occupied by the brick sector of the country was ~23,643 ha, with an equivalent EF of built-up land of ~29,790 gha. To put this in perspective, the total area occupied by the industries of Bangladesh was roughly 452,515 ha (assumption about industrial areal coverage: small, 0.5 ha; medium, 1 ha; and large, 3 ha; total number of industries, 871,674 according to the Bangladesh economic census) with an EF of built-up land of ~584,649 gha. In other words, the brick sector occupied nearly 0.16% of the total industrial area, but its share in the EF of built-up land within industries was approximately 5%. As mentioned in the previous section, the brick sector of Bangladesh accounts for 1% of the total GDP. Therefore, compared to the magnitude of the economic activity, brick sector of the country has more responsibility in terms of land productivity effects than that of other sectors. The effects of land occupation on the brick sector were more significant than those of other industries in the country. Evidently, the EF of built-up land for a single brickfield was ~3.78 gha (occupied built-up land ~3.00 ha), which was not that large, but its total count is significant. However, if the conversion of agricultural land to clay mining induced by the brick sector is considered, the figure becomes huge, which is a major environmental and social issue for the country.

3.2. Comparative Assessment of Different Environmental Dimensions

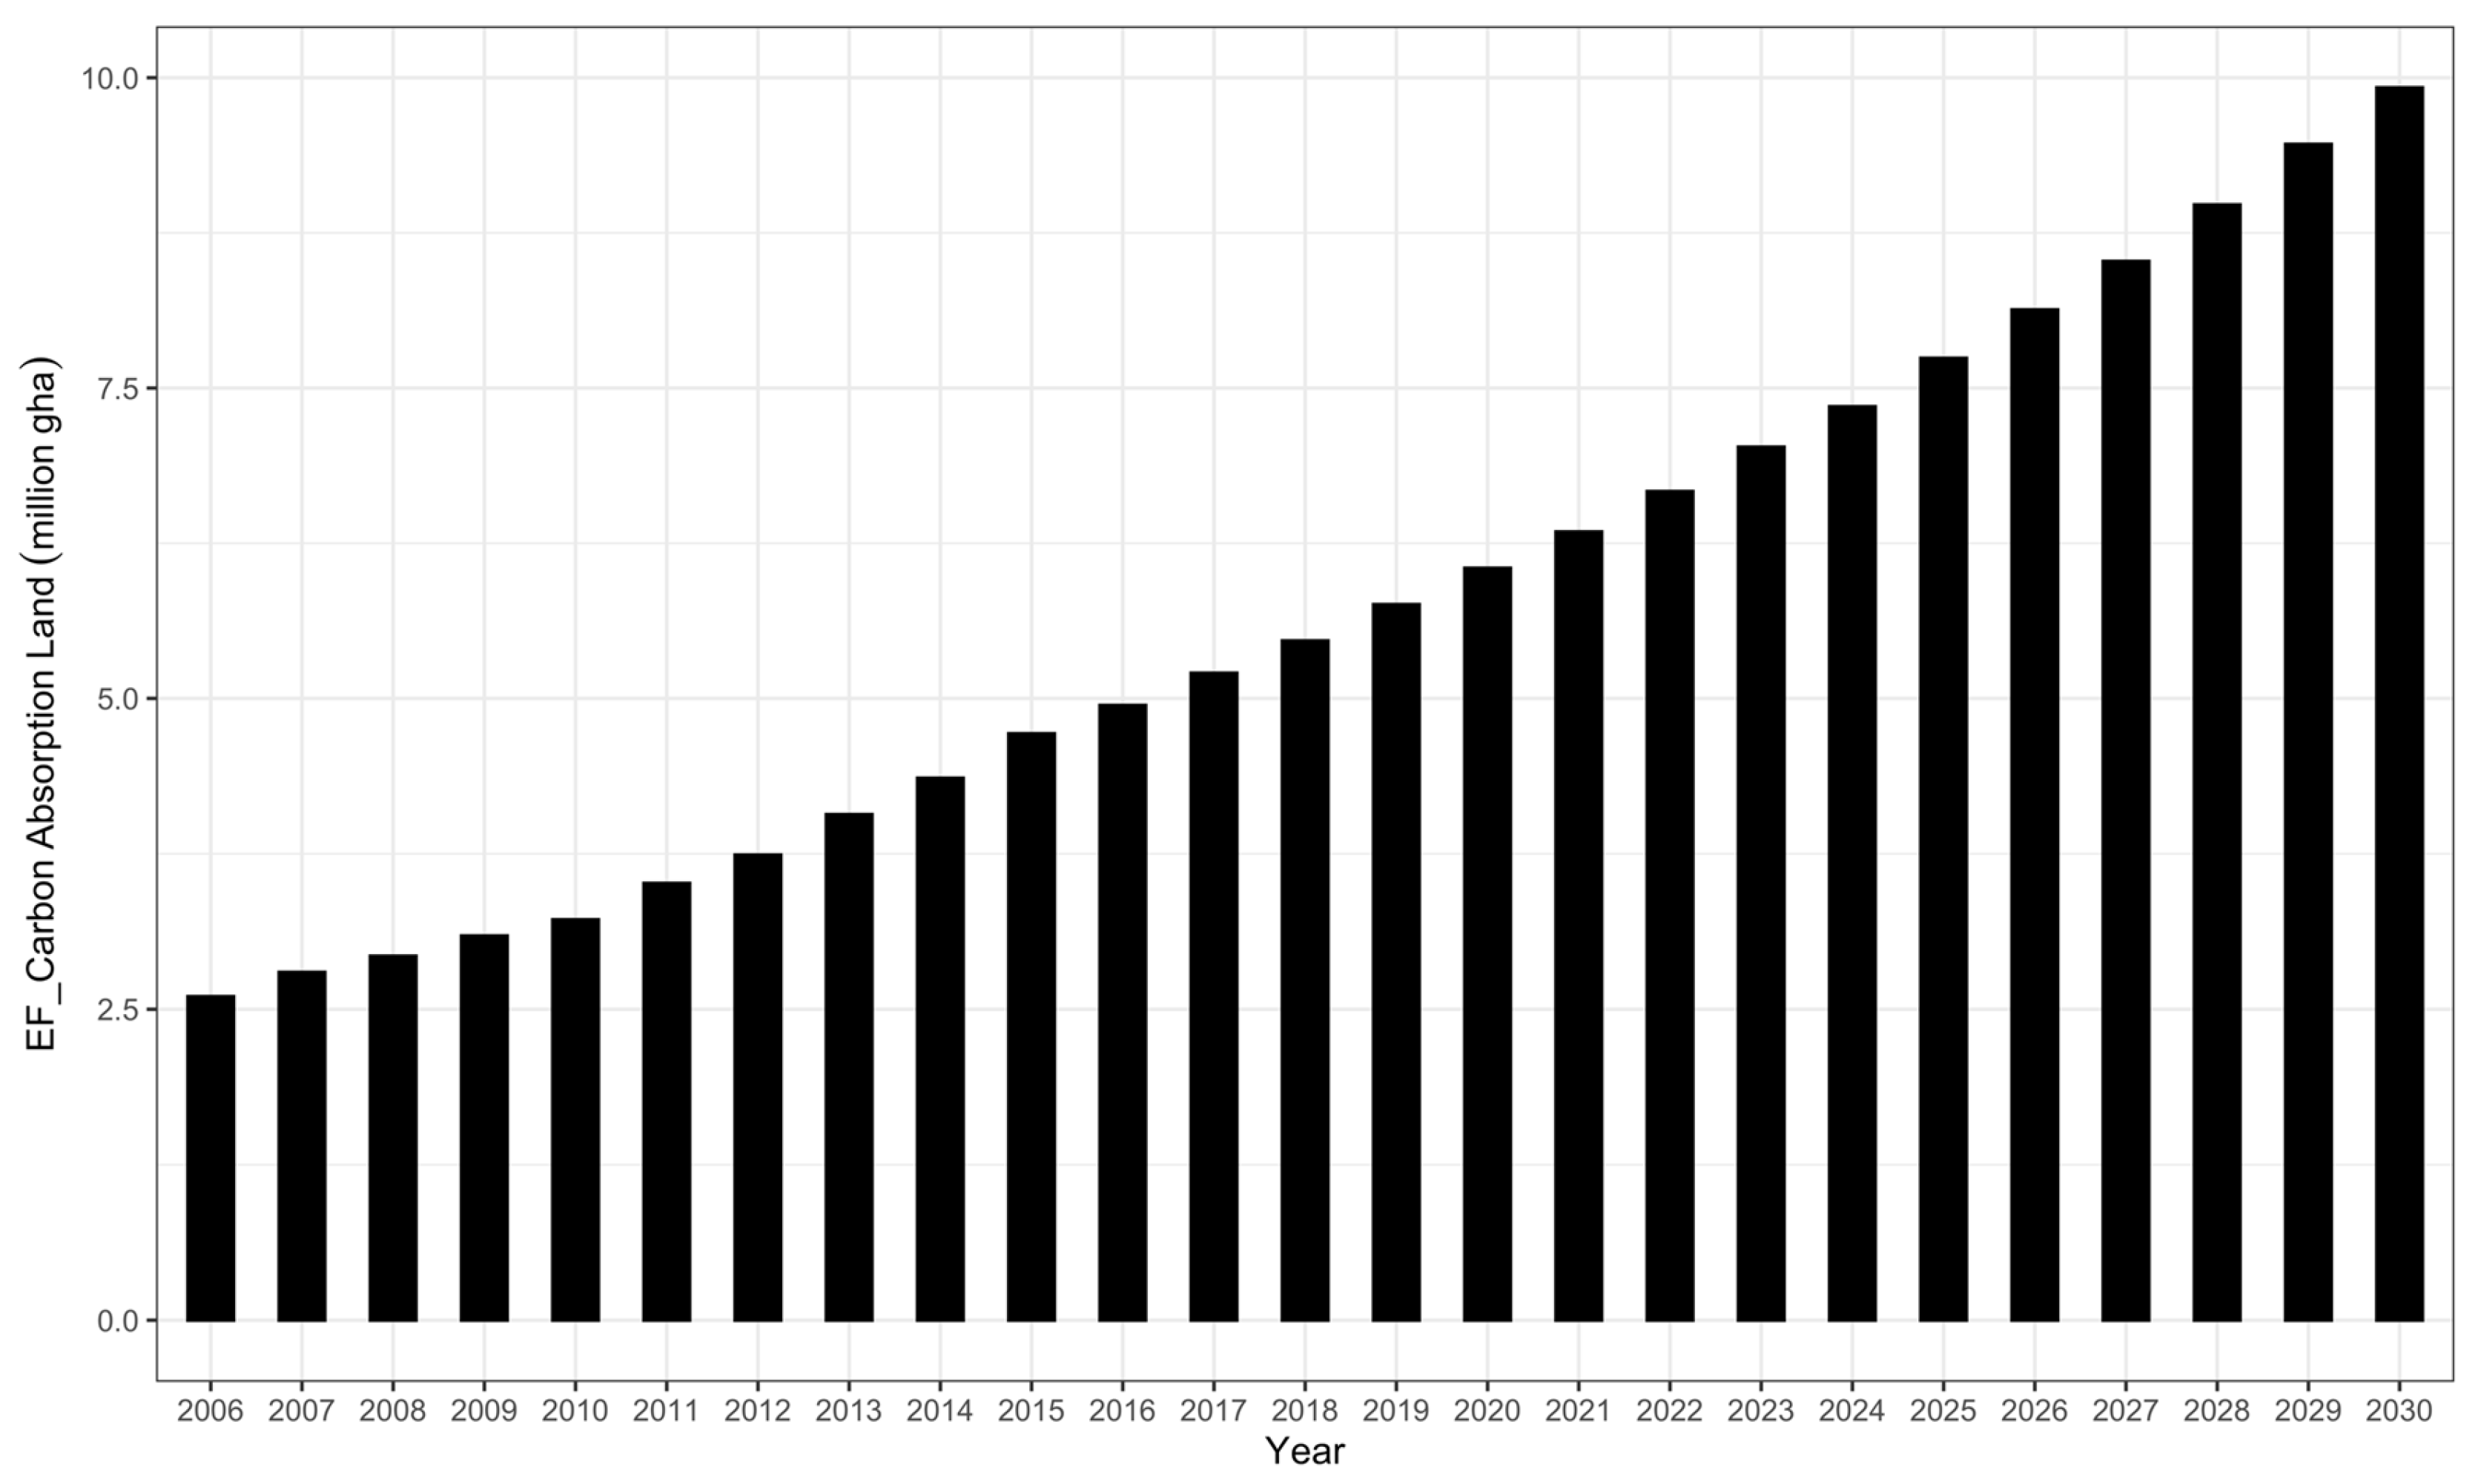
3.2.1. Carbon Emissions: Land Required for Carbon Absorption

The annual CO2 emissions generated from brick production in Bangladesh were used to estimate the EF of the carbon-absorption land. This has been undertaken for the first time, which also has potential implications for CO2 reduction plans in the polluting sector. Figure 4 shows the EF of the carbon-absorption land in the brick sector of the country. The EF of carbon-absorption land in 2006 was ~2.60 million gha, which means that ~2.60 million gha of vegetated land was required to absorb the CO2 that came from the brick sector during 2006. For a small country such as Bangladesh, which has a national territorial area of ~14.76 million hectares, this figure is quite large, although the per capita emissions from the country were not much compared to other developed nations. Interestingly, the total vegetated area of the country according to government-provided data is ~2.6 million hectares, although this figure is thought to be inaccurate by experts. The brick sector drives the CF of the country, which is evident from the EF of the carbon-absorption land. Based on the estimates, the EF of carbon-absorption land in 2020 was ~6.05 million gha, and it was predicted to reach ~9.92 million gha by 2030.

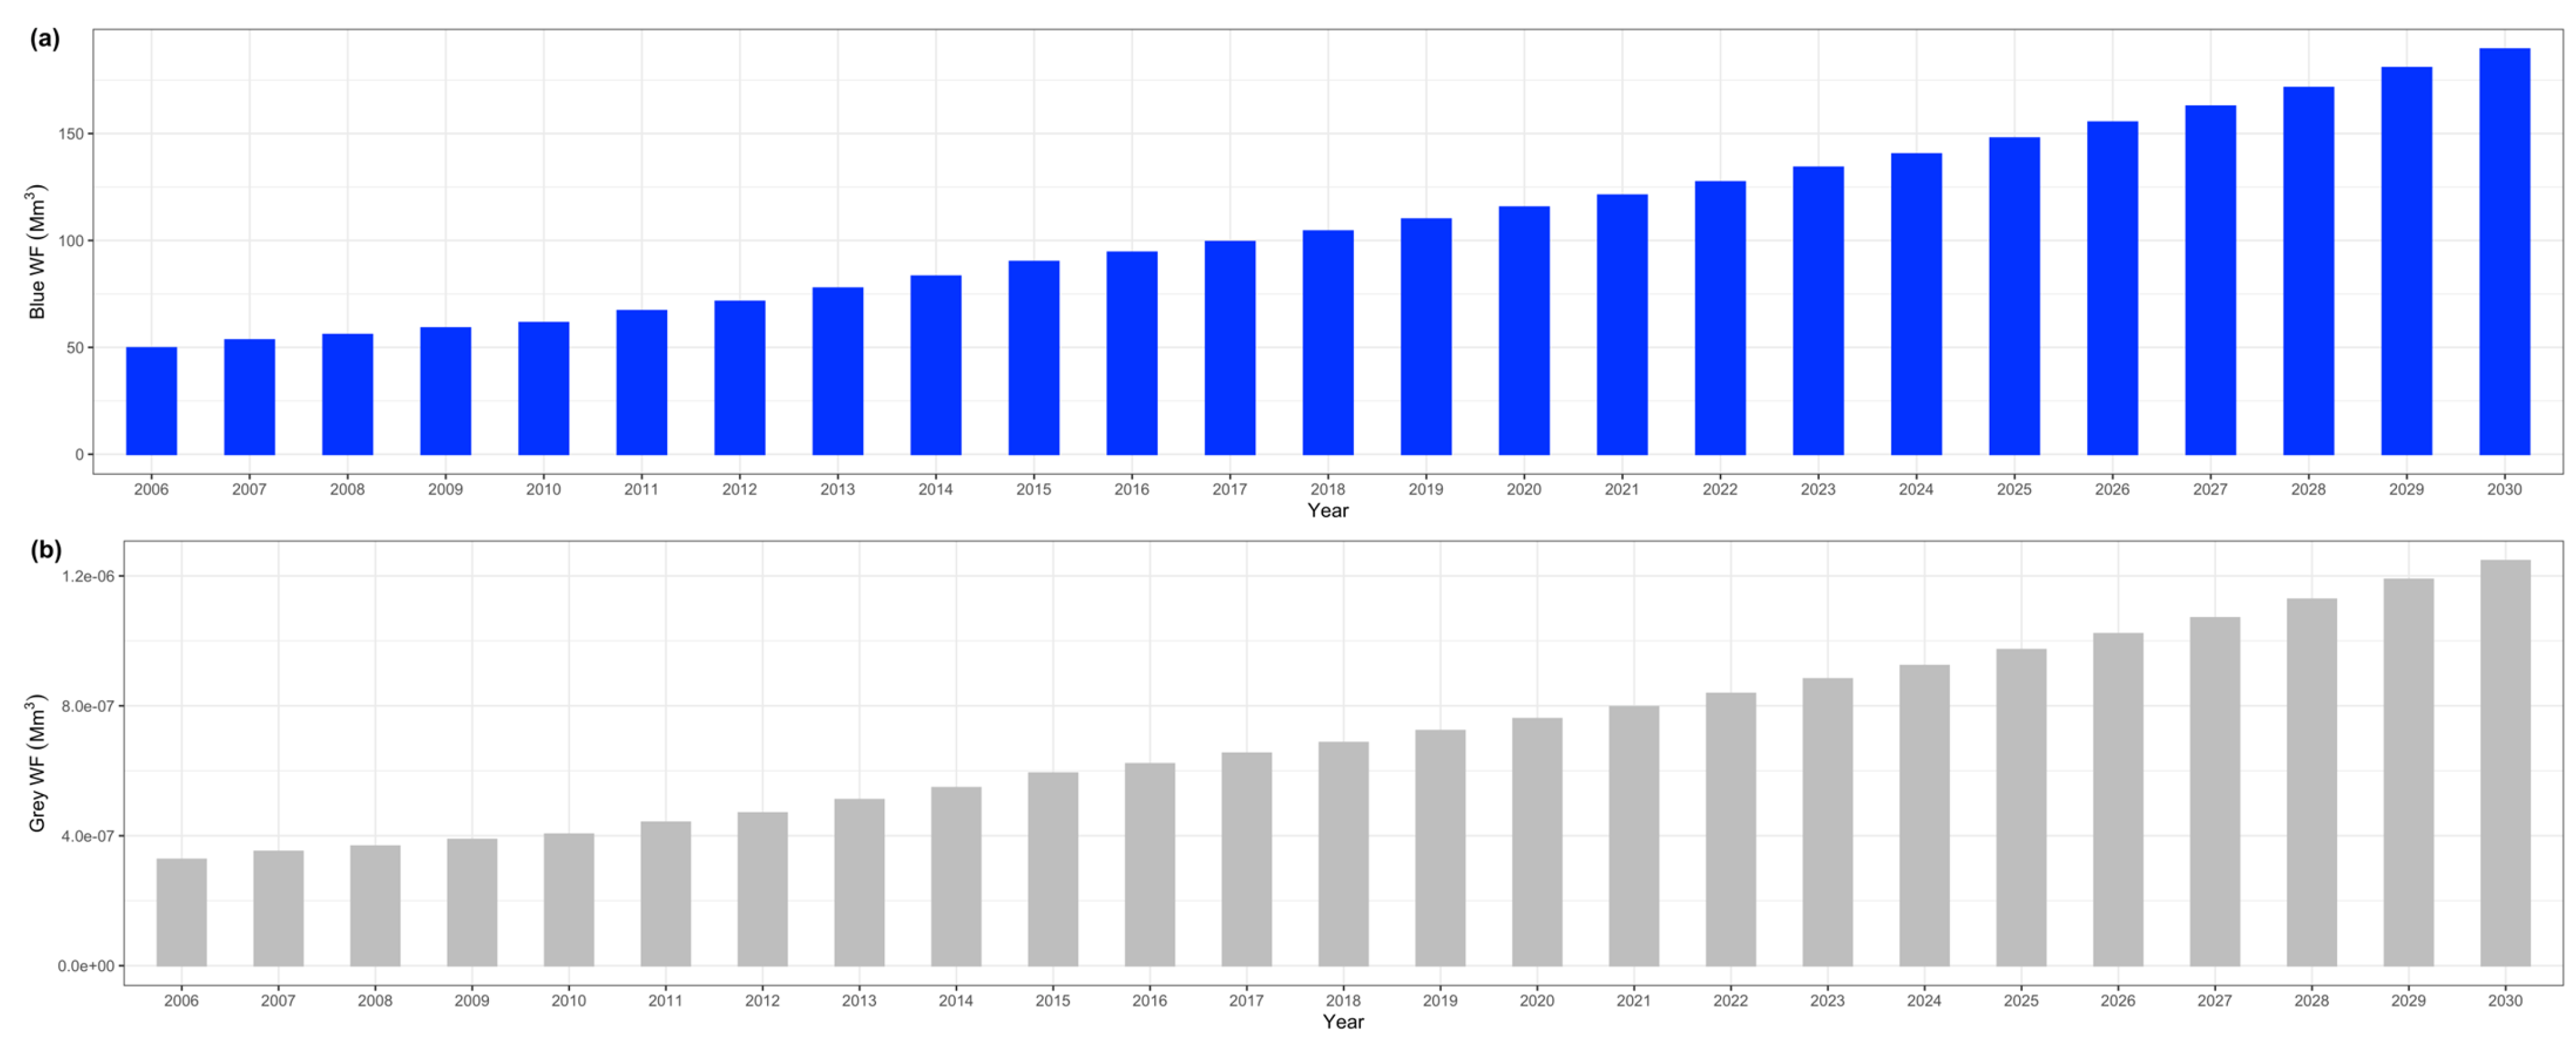
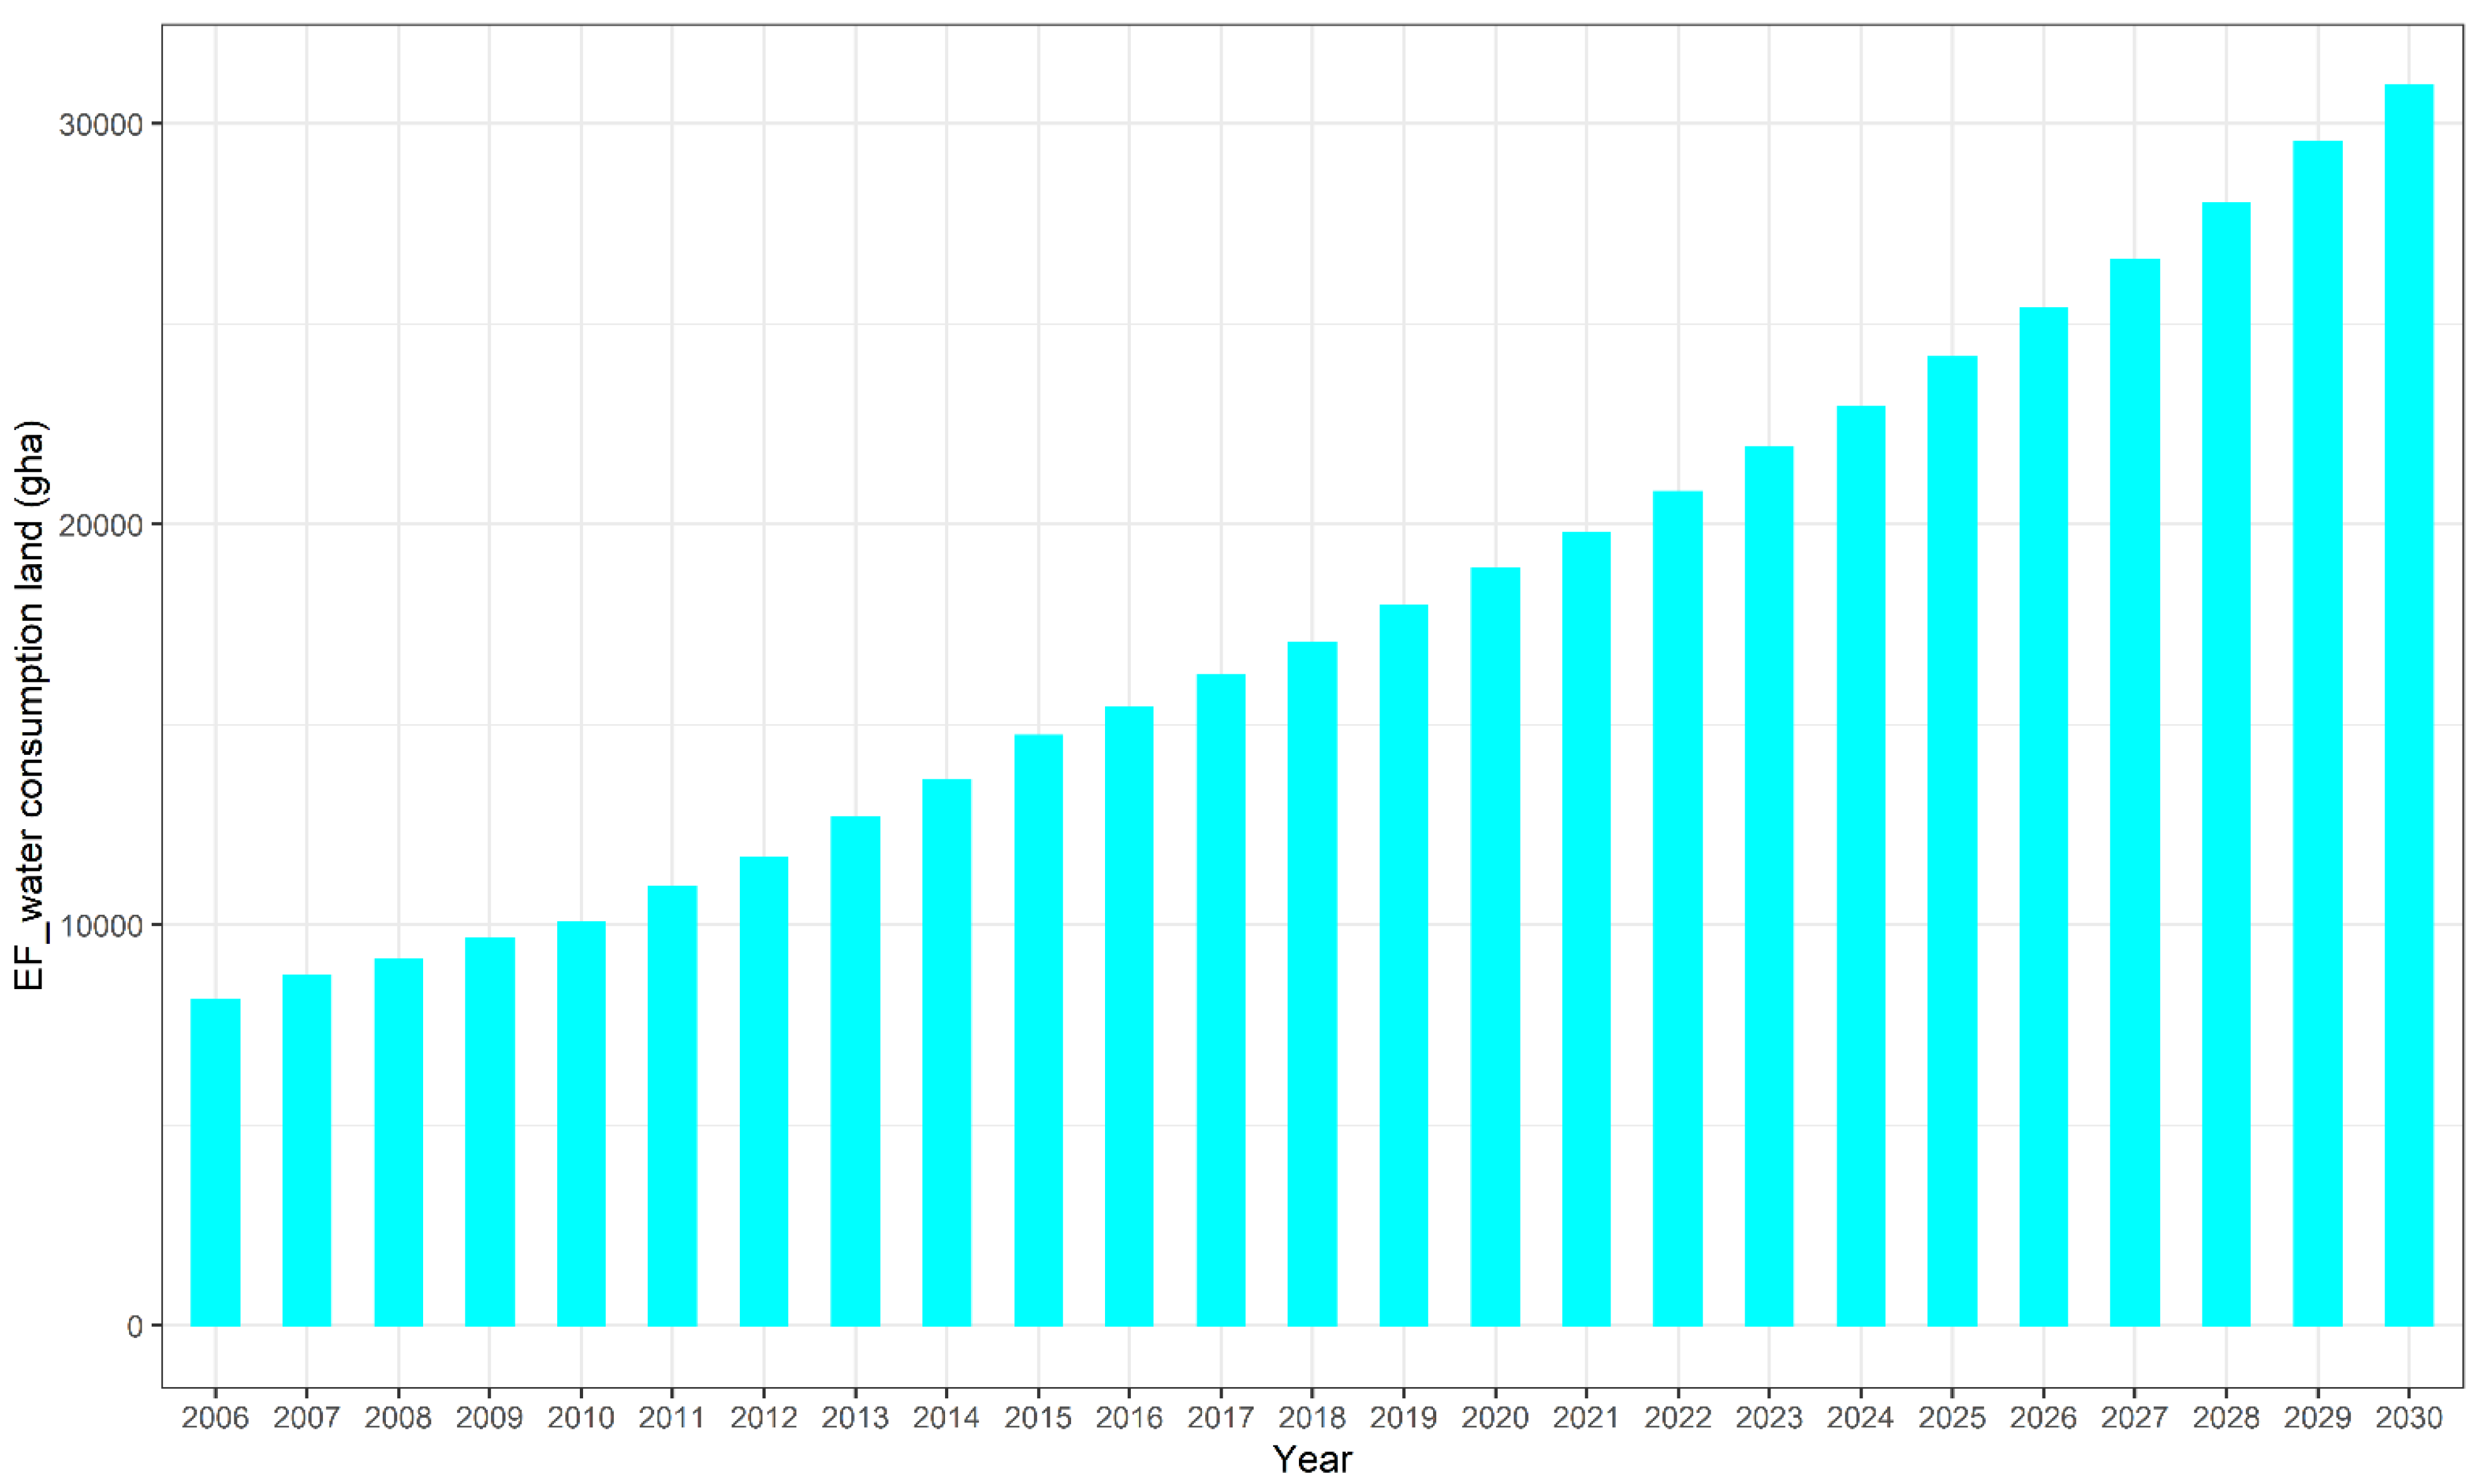
3.2.2. Water Consumption: Land Required for Water Catchment

Figure 5 shows the EF of water consumption (land required for water catchment) induced by brick production in Bangladesh. The EF of water consumption was smaller than that of carbon-emission land. The estimated EF of water consumption during 2006 was ~8117.27 gha, which is expected to rise to ~30,947.10 gha by 2030. In other words, roughly 30,947.10 gha land will be needed to supply water used by the brick sector of the country by 2030. The total area of the country is ~14.76 million ha. Thus, the water catchment area of ~0.06 million ha will be required by the brick sector during 2030, i.e., the portion of land needed for water catchment by the brick sector will be nearly 0.43% during 2030.

3.2.3. Comparison of Different Environmental Dimensions

Although it was a challenge to assess the relevant environmental impacts of brick production based on a single metric, we overcame this limitation by adopting the EF approach not only for carbon-absorption and built-up lands but also for water-consumption land required for the water catchment. The results of the comparison of the different environmental dimensions of brick production are shown in Table 5. It is evident that carbon-absorption land was the deterministic environmental dimension among the three, and it was more than 320 times larger than that of the water catchment. Noticeably, the carbon absorption of land was approximately 166 times higher than that of built-up land. When we assessed the environmental effects of brick production from the perspective of a single environmental issue, both the water consumption and land use associated with brick production were significant in comparison with other industrial activities. On the other hand, a comparative analysis of these three relevant environmental issues by adopting the EF approach could objectively reveal the relative significance of these issues in terms of carrying capacity based on the metric of productive land area.

3.3. How to Reduce the Carbon, Water, and EF of Brick Production in Bangladesh

We also provided an alternative scenario through which the carbon, water, and ecological footprints of brick production could be reduced compared to the BAU scenario (Scenario 1), as shown in Figure 6. If no action is taken in the future (Scenario 1), the CF will reach approximately 7.03 Mt CO2 eq. in 2022, which is 256% of the CF in the base year 2006. If a 10% replacement of clay brick with concrete brick is possible, then the CF from the brick sector would be reduced to 6.61 Mt CO2 eq. by 2022 in the alternative scenario (Scenario 2). This means that the replacement of 10% clay brick with concrete brick would reduce the CF by 6%. This would continue until 2030 in the alternative scenario, while the demand for bricks would increase annually. According to the estimate, by 2030, the CF from Scenario 1 would reach roughly 10.45 Mt CO2 eq., which is 381% of the CF in the base year 2006, whereas it would be reduced to 6.45 Mt CO2 eq. in the alternative scenario, which is nearly 235% of the CF in 2006. The replacement of clay brick with concrete brick would potentially reduce the effects of the increasing demand for bricks on the CF by approximately two-thirds of that in the BAU scenario.
We noticed quite a different pattern (that is, the WF in Scenario 2 slightly increased with time) in the reduction potential of the WF from the progressive replacement of clay-fired brick with concrete brick, although the relative WF reduction in the long run was much higher compared to the base period. This results from the smaller difference in WF between the clay-fired brick (0.003 m3/brick) and concrete brick (0.002 m3/brick). Thus, the effects of a future increase in demand for bricks would be larger than the reduction in WF by this replacement, which would result in a slight increase in WF with time in the future, even in Scenario 2. The WF of clay brick was roughly 1.5 times bigger than that of concrete brick. According to the analysis, the WF from Scenario 1 during 2022 would be approximately 256% higher than the baseline period 2006 (~127.35 Mm3 in absolute figures); on the other hand, it would be 237% higher than the base period (~117.56 Mm3 in absolute figures)—an 8% absolute reduction in the WF compared with that of Scenario 1. If the progressive reduction continues, then by 2030, the WF would be ~126.65 Mm3, which would be a whopping 33% reduction compared to the no-action scenario.
Although we did not consider the reduction in EF of built-up land owing to some limitations, such as the unavailability of land use data for concrete brick production, it would also change if the replacement of clay bricks with concrete bricks continues. In addition, another potential alternative scenario would be the reduction in clay consumption, assuming that concrete brick production does not require any clay material. Clay consumption in brick production is often linked with other socio-environmental issues in the country. For example, the loss of agricultural productivity and illegal felling of trees from the forests could be reduced to a greater extent by opting for an alternative scenario of concrete brick production.

4. Discussion, Limitations, and Conclusions

This study successfully applied the methodology of the environmental footprint to the carbon, water, and land use of the brick sector in Bangladesh. The findings of this study are interesting and can be used to reduce environmental footprints. Interestingly, fuelwood consumption was the major dominant factor in the carbon and water footprints. Fuelwood consumption contributed approximately 40% of the CF and more than 90% of the WF for single brick production. However, this is also related to other social and environmental issues in the country. For example, fuelwood harvesting from natural forests is illegal, but there is evidence that a large share of the fuelwood being used in brickfields comes from the country’s forests [6]. Therefore, there is a good chance that brick burning has a positive association with deforestation, though more research is needed to confirm this hypothesis. Promoting green brick technologies could be considered an alternative to the present practice, although it may not reduce clay consumption substantially, which is of real concern. In this case, concrete bricks could be a better alternative, as they would not only reduce clay consumption but also reduce the associated environmental footprints.
The direct land requirement for making brickfields was not very large, because the EF of built-up land was also minimal. However, the key issue here is the location of the brickfield and clay consumption for brick-making. Typically, it can be found anywhere in the country, but according to the law, brickfields cannot be established on agricultural land, forest land, and within one kilometer from residential areas. However, this is rarely followed in practice. Because the clay-fired brick-making process uses a significant amount of clay, this drives agricultural land use change, because a major portion of the clay comes from the topsoil of the agricultural land. If indirect land requirements are considered, the EF of built-up land would be huge; however, this study did not include it because of data limitations. In contrast, the EF of carbon-absorption land was significantly large, which obviously results from the nature of the carbon emissions generated from brick production.
An alternative to fuelwood is to use natural gas to burn bricks on a larger scale. In addition to this, coal is the dominant factor of the CF associated with brick production (Figure 1). Therefore, the shift of fuel sources for brick production from fuelwood and coal to natural gas would be a mutual solution for the reduction in carbon emissions and water consumption. However, the country’s present infrastructure is not prepared for this option, which is understandable based on the share of brick kilns that use natural gas. For example, less than 2% of brick kilns use natural gas as fuel source. Some kiln technologies, such as the Hoffman kiln, are less polluting than traditional kilns, for example, bull’s trench and fixed chimney kilns, owing to the use of natural gas [40]. The gas connection network is limited to some major cities in the country. Utilizing biodiesel could be another alternative energy source that could reduce CF. Although there are variations among the findings from different studies regarding the CF of biodiesel production, first-generation biofuels from sugarcane, molasses, or palm oil would be as low as 0.32 kg CO2 eq./L biodiesel, without considering land use change [41]. However, if land use change is considered, this value would increase. Again, it would increase the WF, for example; the blue WF of biodiesel production based on the European Union’s data is ~0.06 m3/L of biodiesel [41].
In addition to fuelwood consumption, the brick sector is a major social issue because of the significant amount of clay consumed. Clay consumption in the brick sector is often linked to loss of agricultural productivity. Topsoil, which is the most fertile soil, is used in the brick sector; however, according to law, this is banned. If one farmer willingly or unwillingly sells the topsoil to brick manufacturers to maintain the level of land similar to the adjacent agricultural land, the other farmers also need to sell their topsoil to brick manufacturers. This is undertaken to maintain irrigation efficiency. This situation prevails in major parts of the country. The amount of agricultural land lost owing to brick production is also huge, as reported in government documents and other third-party reports. One possible solution to reduce clay consumption is to promote concrete bricks, which might cause fewer environmental effects in the long term. However, for short-term planning, reducing the brick mass could be an option by making the brick hollow, although further study is required to validate this alternative. We have provided the reduction potential of concrete bricks using a progressive reduction scenario by which we are able to show that a significant footprint reduction is possible as well as reducing clay consumption, which has major socio-environmental consequences.
To the best of our knowledge, this is the first comprehensive study regarding the environmental footprint of brick production in Bangladesh, a typical emerging country with a huge demand for bricks. There are several issues that should be kept in mind. First, the number of brick kilns and brick production (or consumption) data are estimated, and there are often discrepancies in government reports regarding the absolute number of brick kilns in the country. This could create some uncertainty in footprint accounting, although it is believed that the number of brick kilns and production is higher than the estimated value provided by the government reports, which was our main source of data. A centralized brickfield database could be useful to reduce uncertainty. The Department of Environment, through its regional branches, could update the information not only by locating the brickfields but also by collecting the inventory data directly from the brick manufacturers about their resource use.
Our inventory data come from only a few brickfield surveys covering only one type of technology, although it is the major one. A better understanding of the environmental burdens would require including inventory data from all existing brick-making technologies, which would provide better insights. However, this is beyond the scope of the present study, and we lack sufficient resources to do so. Thus, future research could refine these findings based on our estimates of the environmental footprints of brick-making in Bangladesh.

Author Contributions

Conceptualization, K.I. and S.M.; methodology, K.I. and S.M.; software, K.I.; validation, K.I., M.M. and S.M.; formal analysis, K.I.; investigation, K.I.; resources, K.I.; data curation, K.I.; writing—original draft preparation, K.I.; writing—review and editing, M.M. and S.M.; visualization, K.I.; supervision, M.M. and S.M.; project administration, S.M.; funding acquisition, M.M. and S.M. All authors have read and agreed to the published version of the manuscript.

Funding

This work was supported by JSPS KAKENHI (Grant Numbers 18KT0010, 18KK0303, 19H04325, 19H04345, and 21H04944).

Data Availability Statement

All data used in this study will be made available upon reasonable request to the corresponding author.

Acknowledgments

We thank Mohammad Mosharraf Hossain, Institute of Forestry and Environmental Sciences, University of Chittagong, Bangladesh, for sharing the inventory data.

Conflicts of Interest

The authors declare no conflict of interest.

Appendix A

Figure A1. Per capita brick production in Bangladesh from 2006–2030.
Sustainability 15 05228 g0a1
Figure A2. System boundary for brick production where the upstream flows of raw materials (clay/soil, water, coal, fuelwood, and sand) and energy (electricity) are included in the assessment. Dotted line represents the boundary of the brick kiln.
Sustainability 15 05228 g0a2
Figure A3. Carbon footprint of brick production in Bangladesh from 2006–2030 and total CO2 emission from the country during 2006–2018. Total CO2 emission of the country is sourced from the World Bank data portal (https://data.worldbank.org/indicator/EN.ATM.CO2E.KT?locations=BD (accessed on 22 November 2022)).
Sustainability 15 05228 g0a3

References

  1. Rahman, A.M. CO2 Emission from Brickfields in Bangladesh: Can Ethical Responsibility by Doing Reduce Level of Emission? Athens J. Soc. Sci. 2022, 9, 255–272. [Google Scholar] [CrossRef]
  2. Darain, K.M.; Jumaat, M.Z.; Islam, A.B.M.S.; Obaydullah, M.; Iqbal, A.; Adham, M.I.; Rahman, M.M. Energy Efficient Brick Kilns for Sustainable Environment. Desalination Water Treat. 2016, 57, 105–114. [Google Scholar] [CrossRef]
  3. Saha, C.K.; Hosain, J. Impact of Brick Kilning Industry in Peri-Urban Bangladesh. Int. J. Environ. Stud. 2016, 73, 491–501. [Google Scholar] [CrossRef]
  4. Department of Environment. National Strategy for Sustainable Brick Production in Bangladesh; Department of Environment: Dhaka, Bangladesh, 2017.
  5. Alam, M.N.; Barman, S. Climate and Clean Air Coalition to Reduce Short-Lived Climate Pollutants Bangladesh Brick Sector Roadmap 2019–2030; Climate and Clean Air Coalition: Dhaka, Bangladesh, 2019. [Google Scholar]
  6. Van Hemelrijck, A. Resilience in Bangladesh: Impact Evaluation of the Promoting Sustainable Building in Bangladesh (PSBiB) Project; Oxfam GB: Nairobi, Kenya, 2020. [Google Scholar]
  7. Weyant, C.; Athalye, V.; Ragavan, S.; Rajarathnam, U.; Lalchandani, D.; Maithel, S.; Baum, E.; Bond, T.C. Emissions from South Asian Brick Production. Environ. Sci. Technol. 2014, 48, 6477–6483. [Google Scholar] [CrossRef]
  8. Haque, M.I.; Nahar, K.; Kabir, M.H.; Salam, A. Particulate Black Carbon and Gaseous Emission from Brick Kilns in Greater Dhaka Region, Bangladesh. Air Qual. Atmos. Health 2018, 11, 925–935. [Google Scholar] [CrossRef]
  9. Biswas, D.; Gurley, E.S.; Rutherford, S.; Luby, S.P. The Drivers and Impacts of Selling Soil for Brick Making in Bangladesh. Environ. Manag. 2018, 62, 792–802. [Google Scholar] [CrossRef] [Green Version]
  10. Guttikunda, S.K.; Begum, B.A.; Wadud, Z. Particulate Pollution from Brick Kiln Clusters in the Greater Dhaka Region, Bangladesh. Air Qual. Atmos. Health 2013, 6, 357–365. [Google Scholar] [CrossRef]
  11. Skouteris, G.; Ouki, S.; Foo, D.; Saroj, D.; Altini, M.; Melidis, P.; Cowley, B.; Ells, G.; Palmer, S.; O’Dell, S. Water Footprint and Water Pinch Analysis Techniques for Sustainable Water Management in the Brick-Manufacturing Industry. J. Clean. Prod. 2018, 172, 786–794. [Google Scholar] [CrossRef]
  12. Mekonnen, M.M.; Hoekstra, A.Y. Global Gray Water Footprint and Water Pollution Levels Related to Anthropogenic Nitrogen Loads to Fresh Water. Environ. Sci. Technol. 2015, 49, 12860–12868. [Google Scholar] [CrossRef]
  13. Schyns, J.F.; Booij, M.J.; Hoekstra, A.Y. The Water Footprint of Wood for Lumber, Pulp, Paper, Fuel and Firewood. Adv. Water Resour. 2017, 107, 490–501. [Google Scholar] [CrossRef]
  14. Hoekstra, A.Y.; Wiedmann, T.O. Humanity’s Unsustainable Environmental Footprint. Science 2014, 344, 1114–1118. [Google Scholar] [CrossRef]
  15. Wright, L.A.; Kemp, S.; Williams, I. “Carbon Footprinting”: Towards a Universally Accepted Definition. Carbon Manag. 2011, 2, 61–72. [Google Scholar] [CrossRef]
  16. Hoekstra, A.Y.; Chapagain, A.K.; Aldaya, M.M.; Mekonnen, M.M. The Water Footprint Assessment Manual: Setting the Global Standard; Water Footprint Network: Enschede, The Netherlands, 2011. [Google Scholar]
  17. ISO 14046:2014; Environmental Management—Water Footprint—Principles, Requirements and Guidelines. International Organization for Standardization: Geneva, Switzerland, 2014.
  18. Wiedmann, T.O.; Schandl, H.; Lenzen, M.; Moran, D.; Suh, S.; West, J.; Kanemoto, K. The Material Footprint of Nations. Proc. Natl. Acad. Sci. USA 2015, 112, 6271–6276. [Google Scholar] [CrossRef] [Green Version]
  19. Rees, W.E. Ecological Footprints and Appropriated Carrying Capacity: What Urban Economics Leaves Out. Environ. Urban. 1992, 4, 121–130. [Google Scholar] [CrossRef]
  20. Islam, K.; Murakami, S. Accounting for Water Footprint of an Open-Pit Copper Mine. Sustainability 2020, 12, 9660. [Google Scholar] [CrossRef]
  21. Hossain, M.S. Social Life Cycle Assessment (SLCA) of Clay Brick Manufacturing Process in Bangladesh. Master’s Thesis, Institute of Forestry and Environmental Science, University of Chittagong, Chittagong, Bangladesh, 2019. [Google Scholar]
  22. Murakami, S.; Takasu, T.; Islam, K.; Yamasue, E.; Adachi, T. Ecological Footprint and Total Material Requirement as Environmental Indicators of Mining Activities: Case Studies of Copper Mines. Environ. Sustain. Indic. 2020, 8, 100082. [Google Scholar] [CrossRef]
  23. Islam, K.; Yokoi, R.; Motoshita, M.; Murakami, S. Ecological Footprint Accounting of Mining Areas and Metal Production of the World. Resour. Conserv. Recycl. 2022, 183, 106384. [Google Scholar] [CrossRef]
  24. Boulay, A.-M.; Bare, J.; Benini, L.; Berger, M.; Lathuillière, M.J.; Manzardo, A.; Margni, M.; Motoshita, M.; Núñez, M.; Pastor, A.V.; et al. The WULCA Consensus Characterization Model for Water Scarcity Footprints: Assessing Impacts of Water Consumption Based on Available Water Remaining (AWARE). Int. J. Life Cycle Assess. 2018, 23, 368–378. [Google Scholar] [CrossRef] [Green Version]
  25. Motoshita, M.; Ono, Y.; Finkbeiner, M.; Inaba, A. The Effect of Land Use on Availability of Japanese Freshwater Resources and Its Significance for Water Footprinting. Sustainability 2016, 8, 86. [Google Scholar] [CrossRef] [Green Version]
  26. Yano, S.; Hanasaki, N.; Itsubo, N.; Oki, T. Water Scarcity Footprints by Considering the Differences in Water Sources. Sustainability 2015, 7, 9753–9772. [Google Scholar] [CrossRef] [Green Version]
  27. Müller Schmied, H.; Cáceres, D.; Eisner, S.; Flörke, M.; Herbert, C.; Niemann, C.; Peiris, T.A.; Popat, E.; Portmann, F.T.; Reinecke, R.; et al. The Global Water Resources and Use Model WaterGAP v2.2d: Model Description and Evaluation. Geosci. Model Dev. 2021, 14, 1037–1079. [Google Scholar] [CrossRef]
  28. Roy, P.; Hossain, M.N.; Hossain, M.M. Estimation of greenhouse gas emission from coal mining in bangladesh through life cycle assessment (lca). In Proceedings of the International Conference on Mechanical Engineering and Renewable Energy 2019, Chittagong, Bangladesh, 11–13 December 2019. [Google Scholar]
  29. U.S. EIA. Carbon Dioxide Emission Factors for Coal; U.S. Energy Information Administration: Washington, DC, USA, 2022.
  30. Cherubini, F.; Peters, G.P.; Berntsen, T.; Strømman, A.H.; Hertwich, E. CO2 Emissions from Biomass Combustion for Bioenergy: Atmospheric Decay and Contribution to Global Warming. GCB Bioenergy 2011, 3, 413–426. [Google Scholar] [CrossRef] [Green Version]
  31. Ullah, S.A.; Tani, M. Fuelwood Consumption and Its Impact on Forests in the Teknaf Peninsula on the Southern Coast of Bangladesh. Am. J. Environ. Sci. 2017, 13, 225–232. [Google Scholar] [CrossRef] [Green Version]
  32. Wernet, G.; Bauer, C.; Steubing, B.; Reinhard, J.; Moreno-Ruiz, E.; Weidema, B. The Ecoinvent Database Version 3 (Part I): Overview and Methodology. Int. J. Life Cycle Assess. 2016, 21, 1218–1230. [Google Scholar] [CrossRef]
  33. Cuevas, P. Comparative Life Cycle Assessment of Biolubricants and Mineral Based Lubricants. Master’s Thesis, University of Pittsburgh, Pittsburgh, PA, USA, 2010. [Google Scholar]
  34. Smith, K.R.; Uma, R.; Kishore, V.V.N.; Zhang, J.; Joshi, V.; Khalil, M.A.K. Greenhouse Implications of Household Stoves: An Analysis for India. Annu. Rev. Energy Environ. 2000, 25, 741–763. [Google Scholar] [CrossRef] [Green Version]
  35. Mekonnen, M.M.; Gerbens-Leenes, P.W.; Hoekstra, A.Y. The Consumptive Water Footprint of Electricity and Heat: A Global Assessment. Environ. Sci. Water Res. Technol. 2015, 1, 285–297. [Google Scholar] [CrossRef]
  36. Chini, C.M.; Peer, R.A.M. The Traded Water Footprint of Global Energy from 2010 to 2018. Sci. Data 2021, 8, 7. [Google Scholar] [CrossRef]
  37. Wu, M.; Mintz, M.; Wang, M.; Arora, S. Consumptive Water Use in the Production of Ethanol and Petroleum Gasoline; U.S. Department of Energy, Argonne: Lemont, IL, USA, 2009.
  38. PCA. Carbon Footprint; PCA: Washington, DC, USA, 2021. [Google Scholar]
  39. Eil, A.; Li, J.; Baral, P.; Saikawa, E. Dirty Stacks, High Stakes: An Overview of Brick Sector in South Asia; The World Bank: Washington, DC, USA, 2020. [Google Scholar]
  40. Gomes, E.; Hossain, I. Transition from Traditional Brick Manufacturing to More Sustainable Practices. Energy Sustain. Dev. 2003, 7, 66–76. [Google Scholar] [CrossRef]
  41. Jeswani, H.K.; Chilvers, A.; Azapagic, A. Environmental Sustainability of Biofuels: A Review. Proc. R. Soc. Math. Phys. Eng. Sci. 2020, 476, 20200351. [Google Scholar] [CrossRef]
Figure 1. Carbon footprint of brick production in Bangladesh. (a) Carbon footprint of different materials. (b) Share of different materials in carbon footprint.
Sustainability 15 05228 g001
Figure 2. Water footprint of brick production in Bangladesh. (a) Water footprint of different materials. (b) Share of different materials in water footprint.
Sustainability 15 05228 g002
Figure 3. Water footprint of brick production in Bangladesh from 2006–2030. (a) Blue water footprint of brick production. (b) Grey water footprint of brick production.
Sustainability 15 05228 g003
Figure 4. Ecological footprint of brick production in Bangladesh from 2006–2030.
Sustainability 15 05228 g004
Figure 5. Water consumption land required for available water catchment induced by brick production in Bangladesh from 2006–2030.
Sustainability 15 05228 g005
Figure 6. Progressive reduction in (a) carbon footprint, (b) water footprint, and (c) clay consumption from brick production in Bangladesh. Scenario 1 shows the business-as-usual case whereas Scenario 2 represents a progressive reduction in brick production with an increase in the share of concrete brick production. Footprint values are set to 100% for the base period 2006.
Sustainability 15 05228 g006
Table 1. Process data for brick production in Bangladesh.
InputPer FUUnit
Coal4.55 × 10−05ton
Fuelwood3.09 × 10−01kg
Water1.45 × 10−04m3
Discharge4.55 × 10−06m3
Electricity1.54 × 10−03kWh
Diesel2.91 × 10−02L
Machinery oil3.94 × 10−05L
Hydraulic oil3.52 × 10−05L
Kerosene1.61 × 10−06L
Soil/clay2.23 × 10−01cft
Sand4.78 × 10−03cft
Table 4. Ecological footprint of built-up land of a single brickfield in Bangladesh.
FeatureOccupied Land (ha)EF_Built-Up Land (gha)Share
Kiln0.440.6216.30%
Labor accommodation0.270.3810.00%
Soil storage0.100.133.50%
Fuel storage0.000.000.10%
Water storage0.260.369.50%
Brick drying1.932.2960.50%
Total3.003.78100.00%
Table 5. Comparison among carbon absorption, water consumption, and built-up lands required for brick production in Bangladesh during 2006–2030.
YearCarbon-Absorption Land (1000 gha)Water Catchment (1000 gha)Built-Up Land (1000 gha)
20062601.678.1215.68
20072796.798.7316.85
20082926.879.1317.64
20093089.489.6418.62
20103219.5610.0519.40
20113512.2510.9621.16
20123739.9011.6722.54
20134065.1012.6824.50
20144357.7913.6026.26
20154715.5214.7128.42
20164943.1715.4229.79
20175203.3316.2331.36
20185463.5017.0532.92
20195756.1917.9634.69
20206048.8718.8736.45
20216341.5619.7938.22
20226666.7720.8040.17
20237024.5021.9242.33
20247349.7122.9344.29
20257739.9624.1546.64
20268130.2125.3749.00
20278520.4626.5851.35
20288975.7528.0054.09
20299463.5629.5357.03
20309918.8530.9559.77
Disclaimer/Publisher’s Note: The statements, opinions and data contained in all publications are solely those of the individual author(s) and contributor(s) and not of MDPI and/or the editor(s). MDPI and/or the editor(s) disclaim responsibility for any injury to people or property resulting from any ideas, methods, instructions or products referred to in the content.

