Article

Field Test Study on the Bearing Capacity of Extra-Long PHC Pipe Piles under Dynamic and Static Loads

China Construction Sixth Engineering Bureau Corp., Ltd., Tianjin 300012, China
*
Author to whom correspondence should be addressed.
Sustainability 2023, 15(6), 5161; https://doi.org/10.3390/su15065161
Submission received: 13 February 2023 / Revised: 8 March 2023 / Accepted: 13 March 2023 / Published: 14 March 2023
(This article belongs to the Special Issue Sustainable Geotechnical Treatment Technology)

Abstract

:
Pretensioned prestressed high strength concrete (PHC) pipe piles are widely used in various engineering foundations, which have the advantages of high single pile bearing capacity, strong adaptability to geological conditions and high degree of construction mechanization. In order to study the vertical compressive bearing performance and settlement characteristics of ultra-long PHC pipe piles, high strain dynamic detections and static load tests were carried out on four PHC piles with a diameter of 0.9 m on site. It can be seen from the field test that the bearing capacity of the prefabricated pipe piles was time-dependent. By the end of the dynamic test, the bearing capacity of each test pile increased by 27% to 66%. The static load test also verified the rationality of the value of the restitution coefficient. Therefore, the final bearing capacity of the pile foundation can be predicted by using the high strain initial driving results and the restitution coefficient, which can reduce the repeated driving process, effectively save the cost and improve the engineering efficiency. Under 2.1 times the design load, the change range of the pile concrete modulus is from 37.5 GPa to 52 GPa, the change range of the pile side friction resistance is from 0 kPa to 97 kPa and the change range of the pile end to pile bottom load ratio is from 0% to 7.54%. During the test, the shaft friction and end bearing of the lower part of the piles were not fully mobilized. The shaft friction resistance, the end resistance and the movement behavior of the pile top and the end of the piles can provide parameter references for the subsequent design and construction of the piles.

1. Introduction

A pretensioned prestressed high strength concrete pipe is called a PHC pile for short [1,2,3,4]. Its bearing capacity includes vertical bearing capacity, horizontal bearing capacity and seismic bearing capacity [5,6,7,8,9,10,11,12]. A single pile static load test is currently the most reliable method for a quality inspection of pile foundation engineering, and it is also a method that can measure the relationship between pile-soil stress and strain, and the results can be used as the basis for pile foundation engineering design [13]. The high strain pile test method is a method of dynamically testing the bearing capacity of foundation piles by applying a high-energy shock pulse to the top of the pile to generate a certain permanent displacement between the pile and the soil [14,15]. The single pile bearing capacity obtained by the high strain test is generally lower than the ultimate load of the single pile in the static load test [16,17]. Zhou et al. conducted a field study on the pullout bearing capacity of PHC piles buried in cohesive soil, and the soil around the PHC piles treated with cement slurry [18]. Nguyen et al. used feedforward neural network (FFN) to study the ultimate axial bearing capacity of PHC node piles [2]. Kim et al. investigated the performance of Extended end (EXT) piles by field tests and confirmed that the bearing capacity of EXT piles is better than PHC piles [19]. Huynh et al. developed a new direct SPT method using a genetic algorithm with function optimization, which can accurately predict the ultimate axial bearing capacity of PHC ball piles [20]. Li et al. investigated the effect law of the pile-soil friction coefficient, inner and outer diameter ratio, pile length and temperature on the ultimate bearing capacity by a static load test [21]. Choi et al. evaluated the vertical bearing capacity by conducting static load tests on noiseless and vibration-free helical PHC piles installed by different methods [22].
In practice, the bearing capacity of prefabricated piles such as steel pipe piles and PHC piles is relatively small at the end of pile driving [23,24]. Then, with the increase of time, its bearing capacity is continuously recovered and finally stabilized, which is called the time-dependent of precast piles. Relevant theoretical and experimental studies have been studied by many scholars, and some important results have been achieved by carrying out capacity assessments and timeliness research [24,25,26]. In order to study the time-dependent characteristics of the vertical bearing capacity of PHC piles, the test piles were initially driven and re-driven with different resting times by using the high stress variation measurement method. The general rules and influencing factors of pile bearing capacity, lateral resistance and end resistance with time were obtained, and the results were verified by a static load test. Table 1 lists the research works from recent years that are related to the bearing capacity of PHC pipe piles.
After the hammering is over, under the combined action of many factors such as seawater pressure, wave vibration, silt accumulation, etc., the gap between the soil and the pile-soil system continues to be compacted, thereby increasing the ultimate bearing capacity of the pile [27]. With the wide application of pile foundation engineering, higher requirements are put forward for the research and engineering application of the bearing capacity and timeliness of driven piles. In the field test, the static load test takes a long time, the operation is inconvenient and the cost is high. At present, there are not many studies on the time-dependent characteristics of the bearing capacity of super-long prefabricated tubular piles [15]. Research on pile side friction resistance, pile end bearing capacity and settlement characteristics is not detailed enough [28].
Table 1. The research work on bearing capacity of PHC pipe piles in recent years.
YearResearch ContentResearcher
2018static capacity obtained from static and dynamic load testsNoor, S. T. et al. [14]
2018the stress performance of the mixed reinforced PHC pipe pilesZhang et al. [29]
2019time effect of large diameter steel pipe pilesHu et al. [30]
2019the uplift bearing capacity of a PHC pileZhou, J. J. et al. [18]
2020interpretation of dynamic pile load testing for open-ended tubular pilesMehdi et al. [16]
2020bearing characteristics of prestressed high strength concrete (PHC) pilesCao, X. L. et al. [10]
2020evaluation of ultimate bearing capacity (UBC) of PHC pipe pileWei, Y. J. et al. [31]
2020excess pore water pressure caused by PHC pipe pile penetrationWang et al. [32]
2021analysis of influencing factors of the bearing capacity of PHC pipe pilesLi, X. S. et al. [21]
2021penetration characteristics of open and closed PHC pipe pilesWang, Y. H. et al. [1]
2021pretensioned centrifugal spun concrete piles with steel strands aloneRen, J. W. et al. [33]
2022a method to estimate bearing capacity of bored PHC nodular pilesHuynh et al. [20]
2022the difference between the dynamic and static method for the PHC pileLiu, C. L. et al. [34]
2022shear performance evaluation of PHC pilesOktiovan, et al. [7]
2022the construction effect of PHC based on visual digital photographyZhang, G. J. et al. [3]
In this paper, relying on the Brunei Temburong Sea-Crossing Bridge Project, four prefabricated tubular piles were subjected to repeated high strain tests of initial driving and repeated driving at different rest times in the early stage of the project. The recovery coefficient of the bearing capacity after pile driving was studied. It is recommended to propose a reasonable value range of the restitution coefficient to predict the bearing capacity of the pile foundation. After that, the static load test was carried out on these four piles. A detailed study of the bearing capacity recovery and settlement characteristics of the extra-long PHC piles was conducted. Global strain gauges and vibrating wire extensometers were installed over the entire length of the test pile, enabling the monitoring of the frictional resistance of the pile, resistance of the pile end and displacement characteristics of the pile during the entire test. Based on the test results of the static load method, it provides a basis for predicting the actual bearing capacity of engineering piles by the high strain method. The pile test provides guidance and technical support for the design and construction of the super-long PHC pipe piles of Temburong Bridge. This research can provide new ideas and references for future research of piling timeliness, bearing capacity characteristics and engineering application.

2. Materials and Methods

The stress, strain and settlement of the piles were tested by a dynamic load test and static load test. Depending on the geology of the project, strain gauges were installed on specific parts of the PHC pipe piles before the dynamic load test was conducted. After the dynamic load test, the static load test was carried out to test the axial force transfer condition of the pile and observe the vertical displacement of the PHC pipe pile to evaluate the relationship between load and settlement.

2.1. Piling Dynamic Load Tests

The dynamic load test was used to provide field estimates of the mobilised static load carrying capacity of the piles. In addition, it can be used to check on pile structural integrity and obtain field data for later computer signal matching to determine capacity and soil resistance distribution.
The Pile Driving Analyzer (PDA) system is a computer-based signal conditioner system and custom programmed software specifically designed for dynamic load testing and driving monitoring.
Dynamic monitoring was accomplished by attaching two sets of transducers to the pile head; the strain and acceleration transducers (two of each type) were attached below the pile head. The transducers were mounted directly on opposite sides of the pile above the ground level. After the strain and acceleration transducers were attached to the pile head and PDA system, these transducers record the pile top force and velocity with respect to time data during a vertical hammer strike on the pile head. This data is digitized and stored in a random file on the computer hard disk. The data are also displayed on the computer screen which allows the data to be checked and assessed in the field. The random files are automatically generated according to the blow number detected by the PDA system, and the information is stored for later redisplay and further analysis.
The digitized force/velocity/time information recorded is operated on by the PDA program to compute a number of pile parameters. These parameters include the estimated driving resistance, estimated static resistance, energy transmitted past the transducers and many other parameters. One (01) number of spun piles with a dimension of 900 mm and a thickness of 140 mm was tested. The details of the pile are shown in Table 1. The hammer that was used to provide the impact for the dynamic load test was a 200 kN hydraulic hammer for the pile tested. The dynamic load test was conducted on One (01) number of piles selected to determine the static load capacity and integrity of the pile.
The instrumentation for this high strain test included hammering equipment, sensors, signal acquisition and analyzers, etc. The connection diagram of testing instruments and equipment was shown in Figure 1. The hammering equipment used was the piling hammer used for PHC pipe pile driving. The American PAX piling analyzer and accompanying sensors were used for signal sensing, acquisition and analysis. Two acceleration sensors and two strain sensors were installed symmetrically on both sides under the top of the pile. The vertical distance from the top of the pile was not less than 1.5D. For large diameter piles, the distance between the sensor and the top of the pile was reduced appropriately, but not less than one times the pile diameter. The horizontal distance between the two sensors was not more than 100 mm.
For extra-long PHC piles, the pile driving wave equation can be used to simulate and calculate the parameter information during the pile driving process, so as to obtain the dynamic stress change of the pile body, the bearing capacity and the number of blows. In this study, the wave equation analysis program CAPWAP is used to simulate the movement and stress of the pile during the piling process. The PDA tests can not only test the vertical compressive bearing capacity of a single pile, but also monitor the pile driving parameters (the pile tension, compressive stress, energy transfer rate of hammering system, pile integrity change, etc.).
A selected field record of force and velocity from a hammer blow delivered to the piles was used as the input for signal matching using the CAPWAP program. The analysis involved applying the measured pile top force/time and the measured pile top velocity/time to the top of a model pile. The pile model consists of lumped mass, spring, dampers and the surrounding soil. The CAPWAP program computes the resultant force/time and velocity/time for the model pile and this is then compared to the actual measured force/time and velocity/time recorded. The pile model and soil resistance models are then adjusted in an interactive manner until a good match is obtained. Once a match is achieved, a good dynamic model of the pile/soil system at the time of testing could be obtained. The pile and soil dynamic models will then be used to determine the skin distribution along the length of the pile. The static pile load settlement can also be predicted using the CAPWAP program.
In this test, four piles were re-driven after the initial dynamic test. According to the requirements of the technical conditions, the time interval between the initial and re-driven of dynamic testing should not be less than 24 h to ensure that the pile-soil system has enough time to return to stability. In the actual measurement, the time interval between the initial and re-driven was at least 3 d and up to 29 d. The test parameters of the test piles are shown in Table 2.

2.2. Static Load Tests

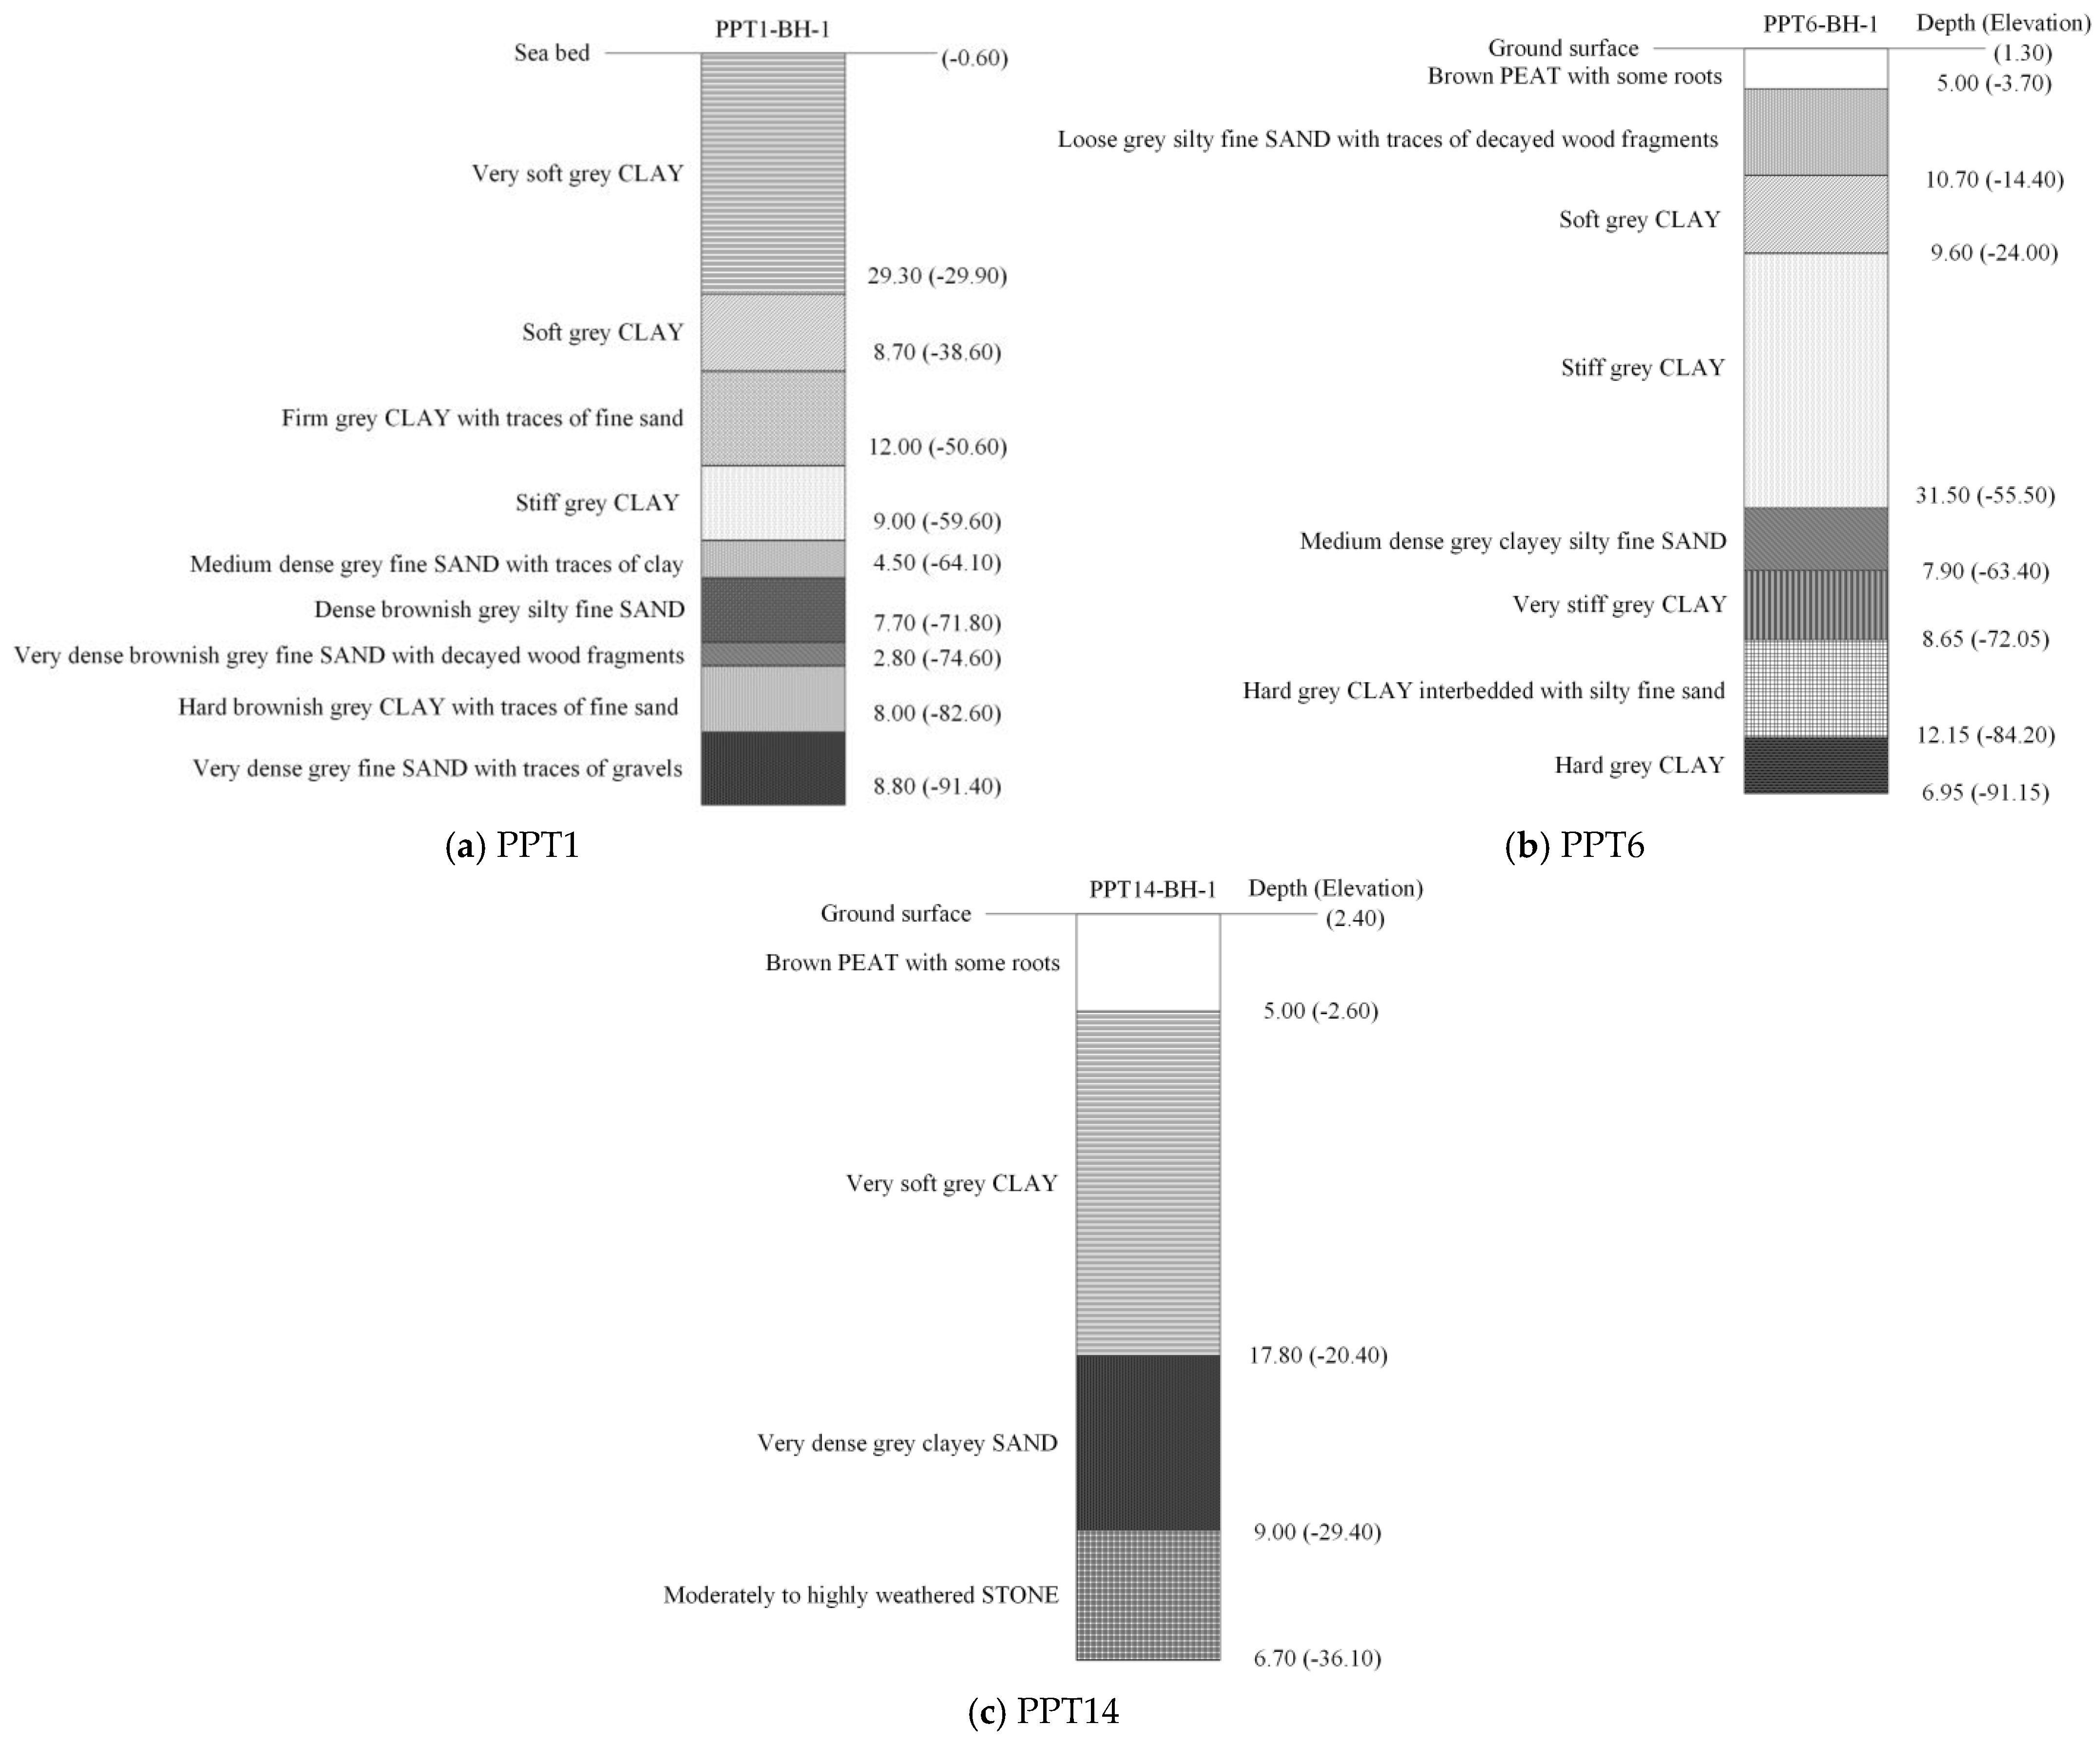
The method and procedure for the static axial compression load test is described below, using test pile PPT1-5 as an example. The pile has a nominal diameter of 900 mm and a penetration depth of 69.500 m below ground (seabed) level of RL −0.600 m. The pile was to be tested to a maximum load of 6300 kN (2.1xDVL) in the test program. The soil properties at the test pile are shown in Figure 2.
The main objective of the instrumented load test is to establish / verify the following for use in the design of working piles which are to be constructed in soil strata having similar geological structure, and by adopting similar construction practices:
(i)
To determine/confirm the bearing capacity of foundation piles and their apportionment into shaft friction for various soil/rock strata and end bearing;
(ii)
To evaluate the design parameters in relation to the ultimate shaft friction and end bearing;
(iii)
To study the behavior of pile settlement and structural shortening under the applied loads.
The results will be presented both in tabulated and graphical formats for easy discussion.

2.2.1. Pile Instrumentation

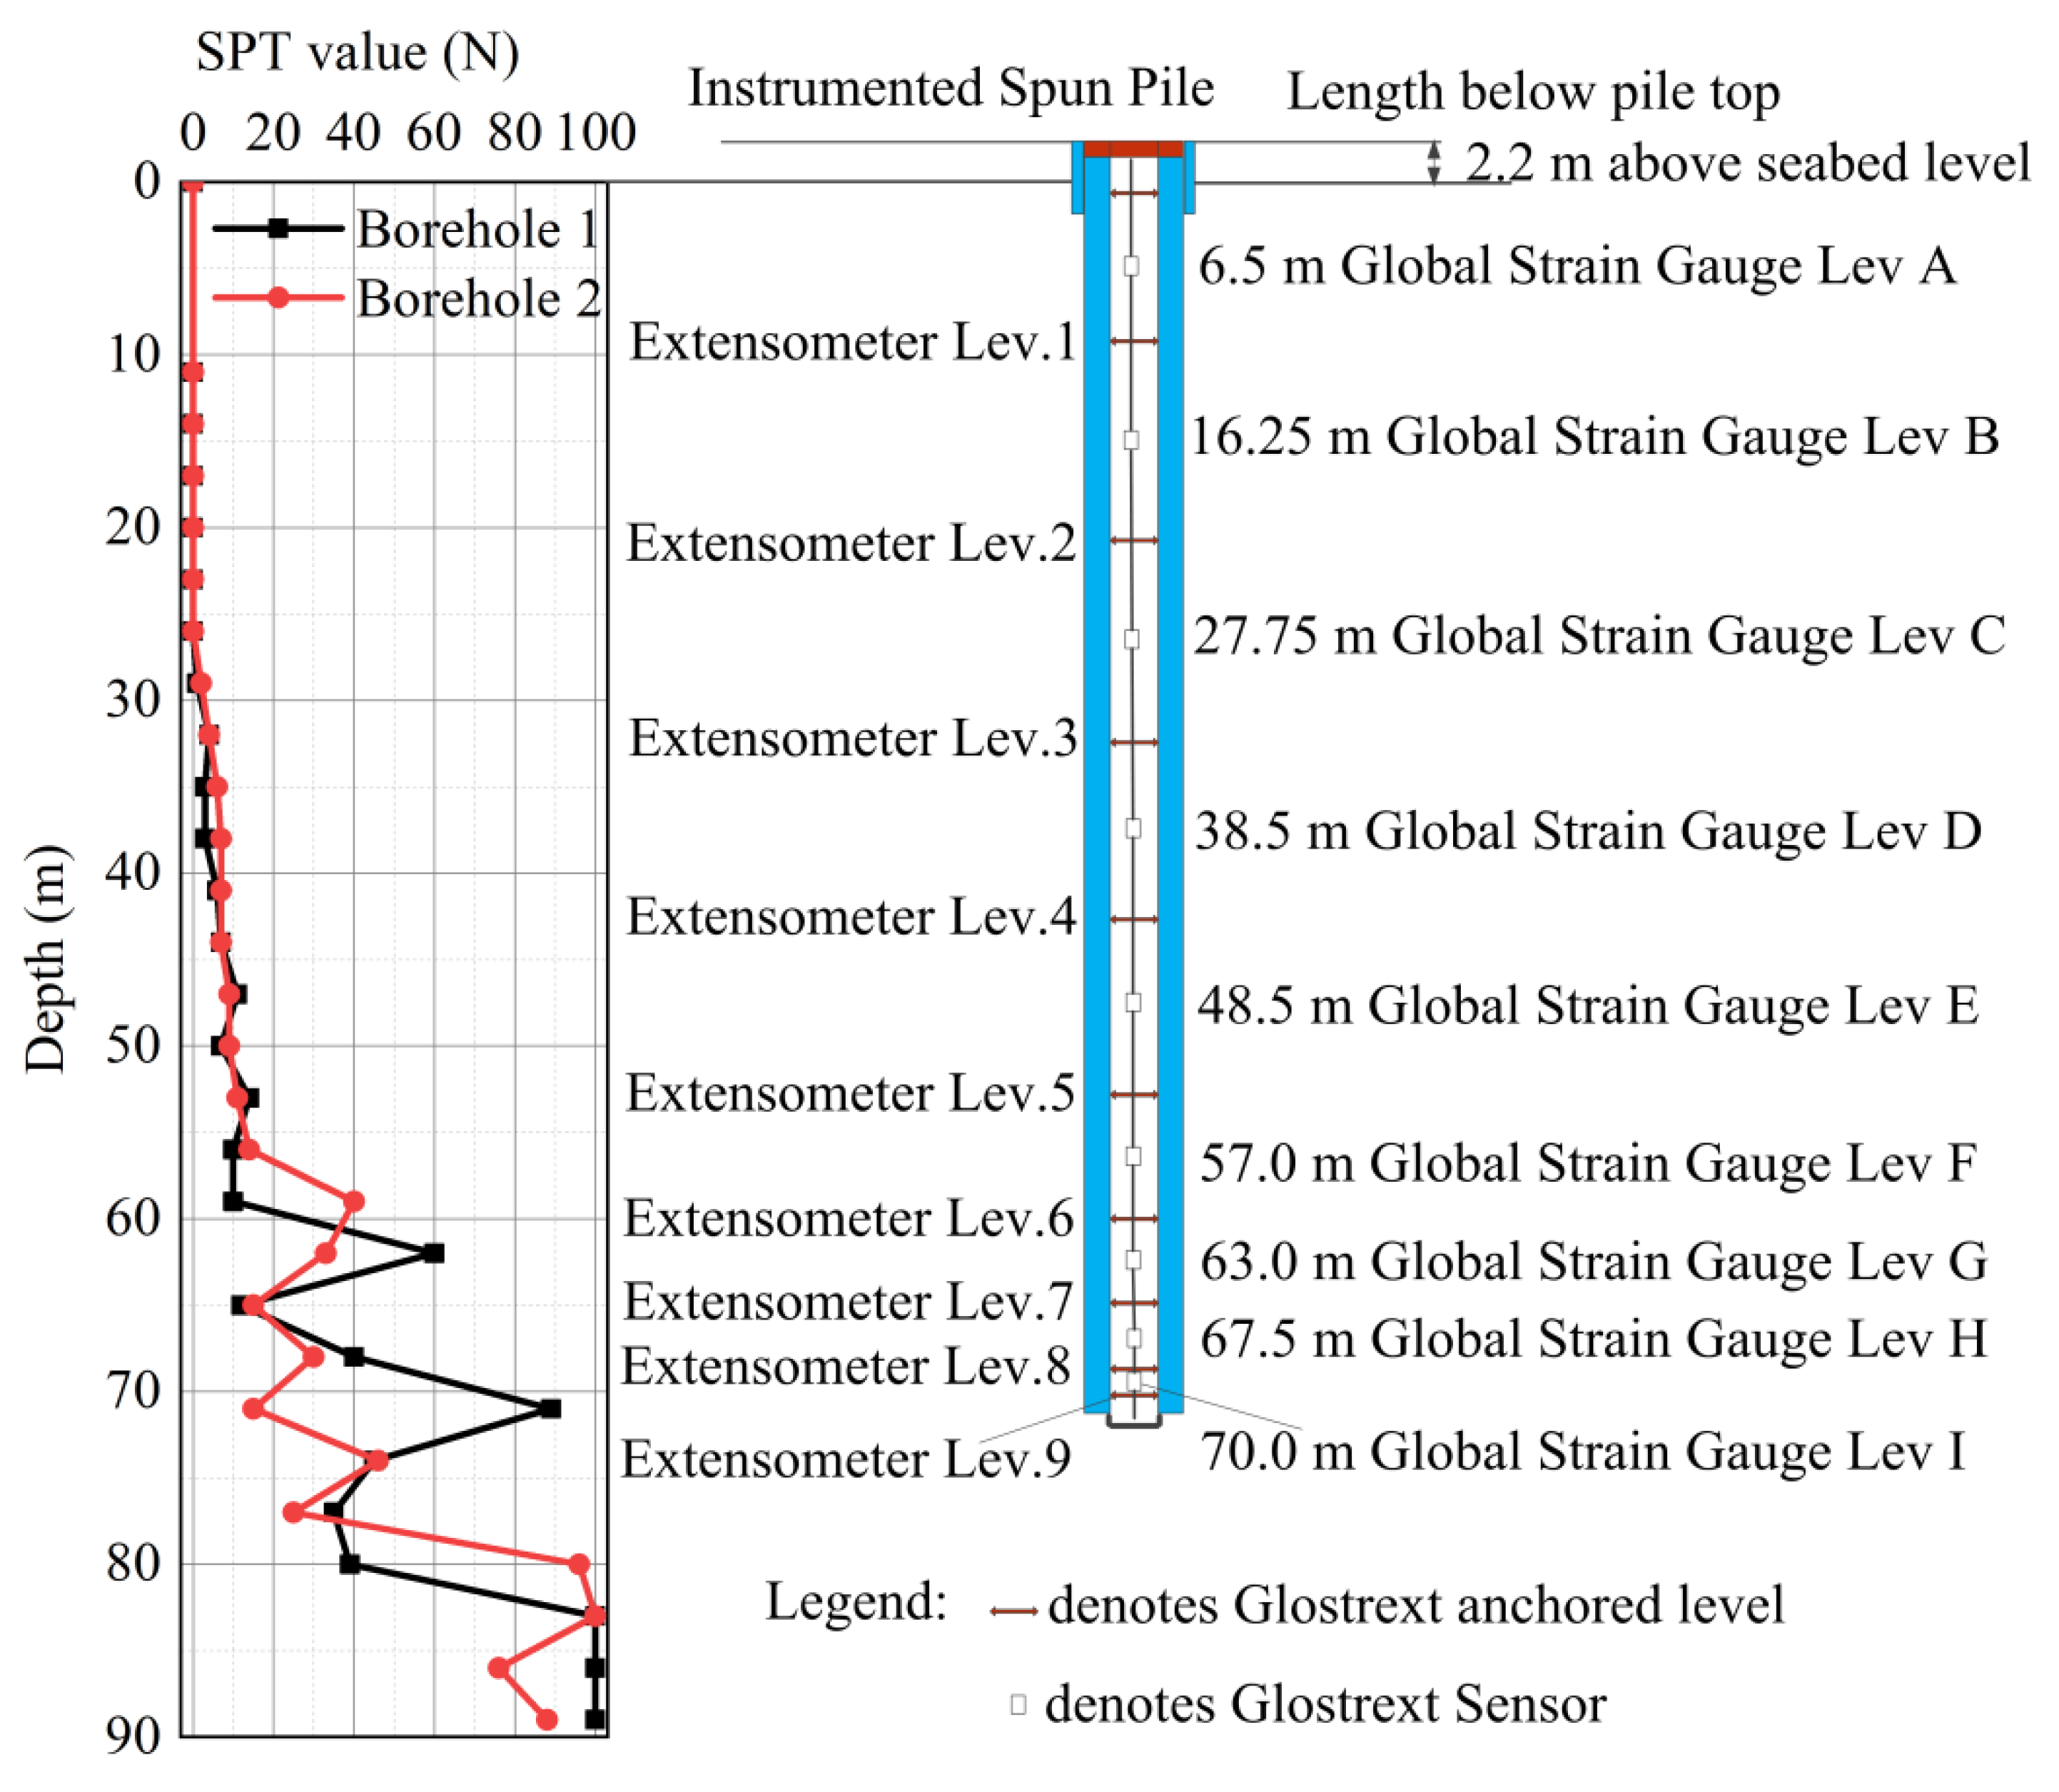
For the instrumented test spun pile, pile instrumentation was conducted using an advanced GLOSTREXT deformation monitoring system for determining axial loads and movements at various levels down the pile shaft, including the pile base level. The as-built pile instrumentation diagram is shown in Figure 3, with details summarized as follows:
(i)
VW Global Strain Gauges:
The Global Strain Gauges were installed at nine levels (level A to I, as shown in Figure 3) as:
  • Global Strain Gauges Level A was aimed at 4.3 m below ground (seabed) level (bgl);
  • Level B was aimed at 14.05 m bgl; Level C was aimed at 25.55 m bgl;
  • Level D was aimed at 36.3 m bgl; Level E was aimed at 46.3 m bgl;
  • Level F was aimed at 54.8 m bgl; Level G was aimed at 60.8 m bgl;
  • Level H was aimed at 65.3 m bgl; Level I was aimed at 67.8 m bgl accordingly.
(ii)
Vibrating Wire (VW) Extensometers:
The anchors for VW Extensometers were installed at 10 levels (as shown in Figure 3). The Extensometers installed at those anchored intervals were designated as:
  • Ext. Lev 1 at interval from 0.3 m to 8.3 m depth;
  • Ext. Lev 2 at interval from 8.3 m to 19.8 m depth;
  • Ext. Lev 3 at interval from 19.8 m to 31.3 m depth;
  • Ext. Lev 4 at interval from 31.3 m to 41.3 m depth;
  • Ext. Lev 5 at interval from 41.3 m to 51.3 m depth;
  • Ext. Lev 6 at interval from 51.3 m to 58.3 m depth;
  • Ext. Lev 7 at interval from 58.3 m to 63.3 m depth;
  • Ext. Lev 8 at interval from 63.3 m to 67.3 m depth;
  • Ext. Lev 9 at interval from 67.3 m to 68.3 m depth accordingly.

2.2.2. Pile Movement Monitoring System

The pile top settlement was monitored using the following instruments: four Linear Variation Displacement Transducers (LVDTs) mounted to the reference beams, with the plunger pressing vertically against the glass plates fixed to the pile top. Vertical scales were also provided on the reference beams to monitor any movement during load testing.
In the set-up used, the test load was applied using one hydraulic jack acting against the main beam. The jack was operated by an electric pump. The applied load was indicated by a calibrated Vibrating Wire Load Cell as the primary load measurement, while the pressure gauge reading was used for a secondary cross-checking purpose.

3. Results and Discussion

3.1. Results and Analysis of Dynamic Load Pile Driving Tests

The field result obtained is summarized in Table 3. The ratio of the ultimate bearing capacity of the pile when the soil is re-stabilized to the ultimate bearing capacity of the pile at the end of sinking is defined as the soil recovery factor K. Then, by comparing the results of high strain initial and re-strain tests on the same pile, the K value of the ultimate bearing capacity of the monopile under the corresponding geological conditions can be derived. The bearing capacity and lateral resistance of the four test piles, the size of the end resistance and their K values are shown in Table 3. As can be seen from Table 3, the prefabricated pipe pile bearing capacity is significantly time-sensitive. By the end of the dynamic test, the increase of the bearing capacity of each test pile was 27%~67%. The recovery coefficient of pile end resistance is not discrete, and the recovery coefficient of pile side resistance is more discrete. Compared with the initial drive, the K of end resistance increased by 14%, 2%, 6% and 4%, respectively, while the K of lateral resistance increased by 37%, 217%, 41% and 326%, respectively, after re-driving. Due to the damaging effect of hammering and sinking the pile on the soil around the pile, the bearing capacity of the pile at the early stage of sinking will be seriously affected, resulting in small results of the measured high strain initial hit test. The recovery coefficient of piles is generalizable under similar geological and construction conditions. Therefore, the high strain preliminary pile foundation results and recovery coefficient can be used to predict the final pile foundation bearing capacity, thus reducing the re-driving process, saving costs and improving engineering efficiency.
As can be seen from Table 3, the PHC piles’ bearing capacity was time-dependent and grew rapidly with time. In addition, the recovery coefficient of the lateral resistance of the PHC pile is much larger than that of end resistance. This conclusion is in agreement with the findings of Hu et al. [30]. In comparison, the growth rate of the bearing capacity of PHC piles in this test is much slower than that of steel piles. This is mainly because the PHC pile belongs to a concrete pile, and for extra-long PHC piles, the squeezing effect was more obvious. The pile driving caused serious damage to the soil and produced large excess pore water stress, so the bearing capacity recovery process was slower.
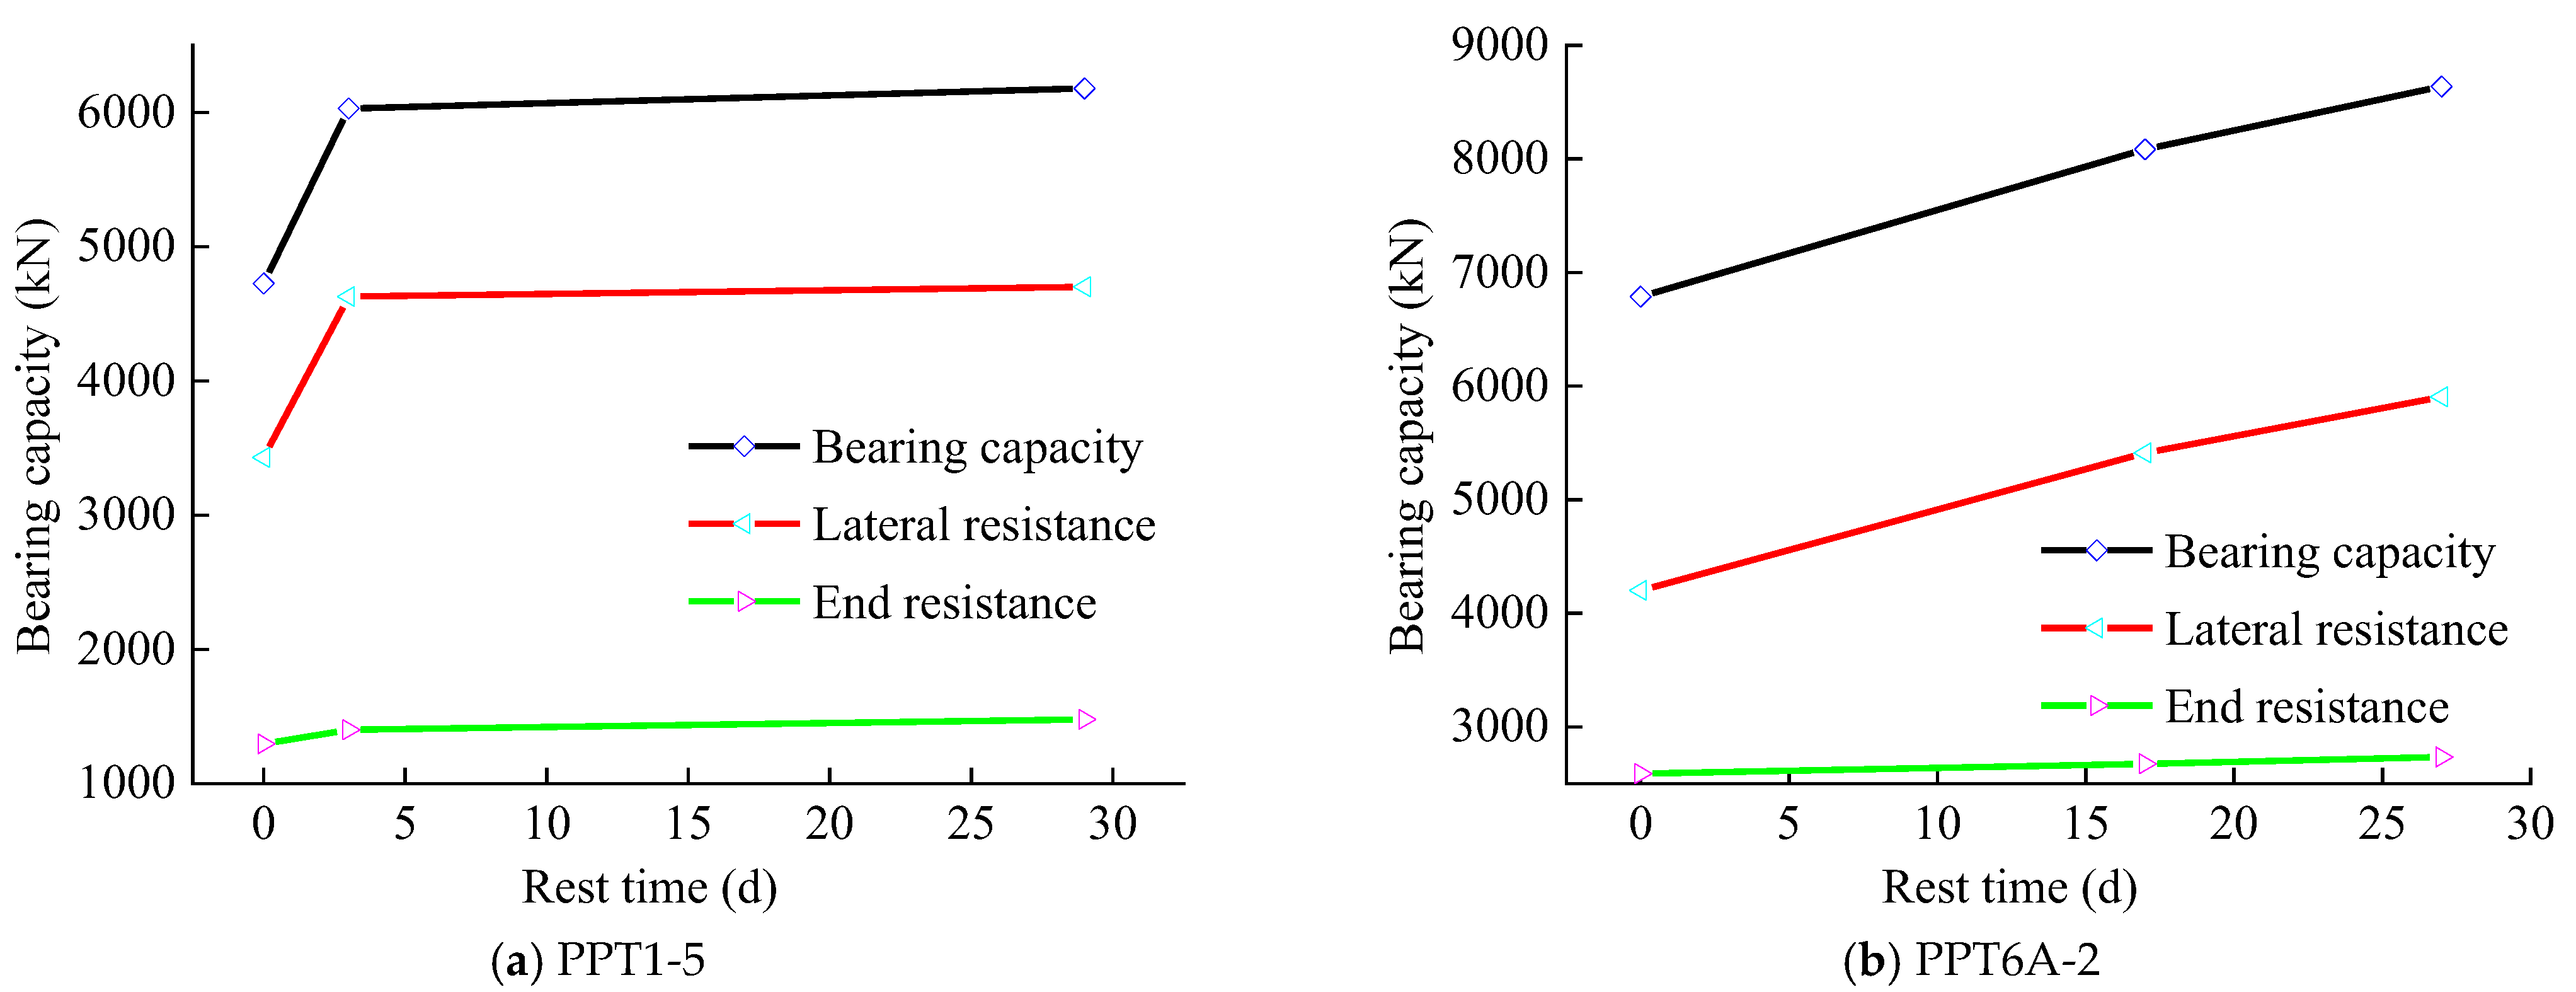
The bearing capacity of the PPT1-5 and PPT6A-2 test piles with different resting times are shown in Figure 4. From the figure, it can be seen that the bearing capacity increases with the increase of resting time. Moreover, the rate of increase of the bearing capacity was faster in the first three days of resting time, and the rate of increase tended to slow down afterwards. In addition, the increased value of pile lateral resistance mainly contributed to the increased value of the bearing capacity, while the increased value of pile end resistance was not significant.
From the magnitude of the lateral resistance and end resistance obtained from the test pile tests, it is clear that all four test piles are end-bearing friction piles. Comparing the recovery coefficients of side resistance and end resistance, it can be seen that the increase and increment of the side resistance of the four test piles with time are much larger than the end resistance. This indicates that the soil on the side of the pile, which mainly bears the load during the sinking of the pile, is continuously disturbed by the hammering, which causes significant damage and lower initial strength. Therefore, the proportional increase in lateral resistance during the resting period is also greater. The soil at the end of the pile has relatively little effect on its strength because it bears less pressure and is also less affected by the hammering.

3.2. Static Load Test Verification Analysis

In order to draw comparisons with the high strain test results and verify the reasonableness of the recovery coefficient values, vertical compressive static load tests were conducted on the four test piles successively. The static load tests were carried out by the anchor pile method, and each test pile was equipped with four anchor piles.
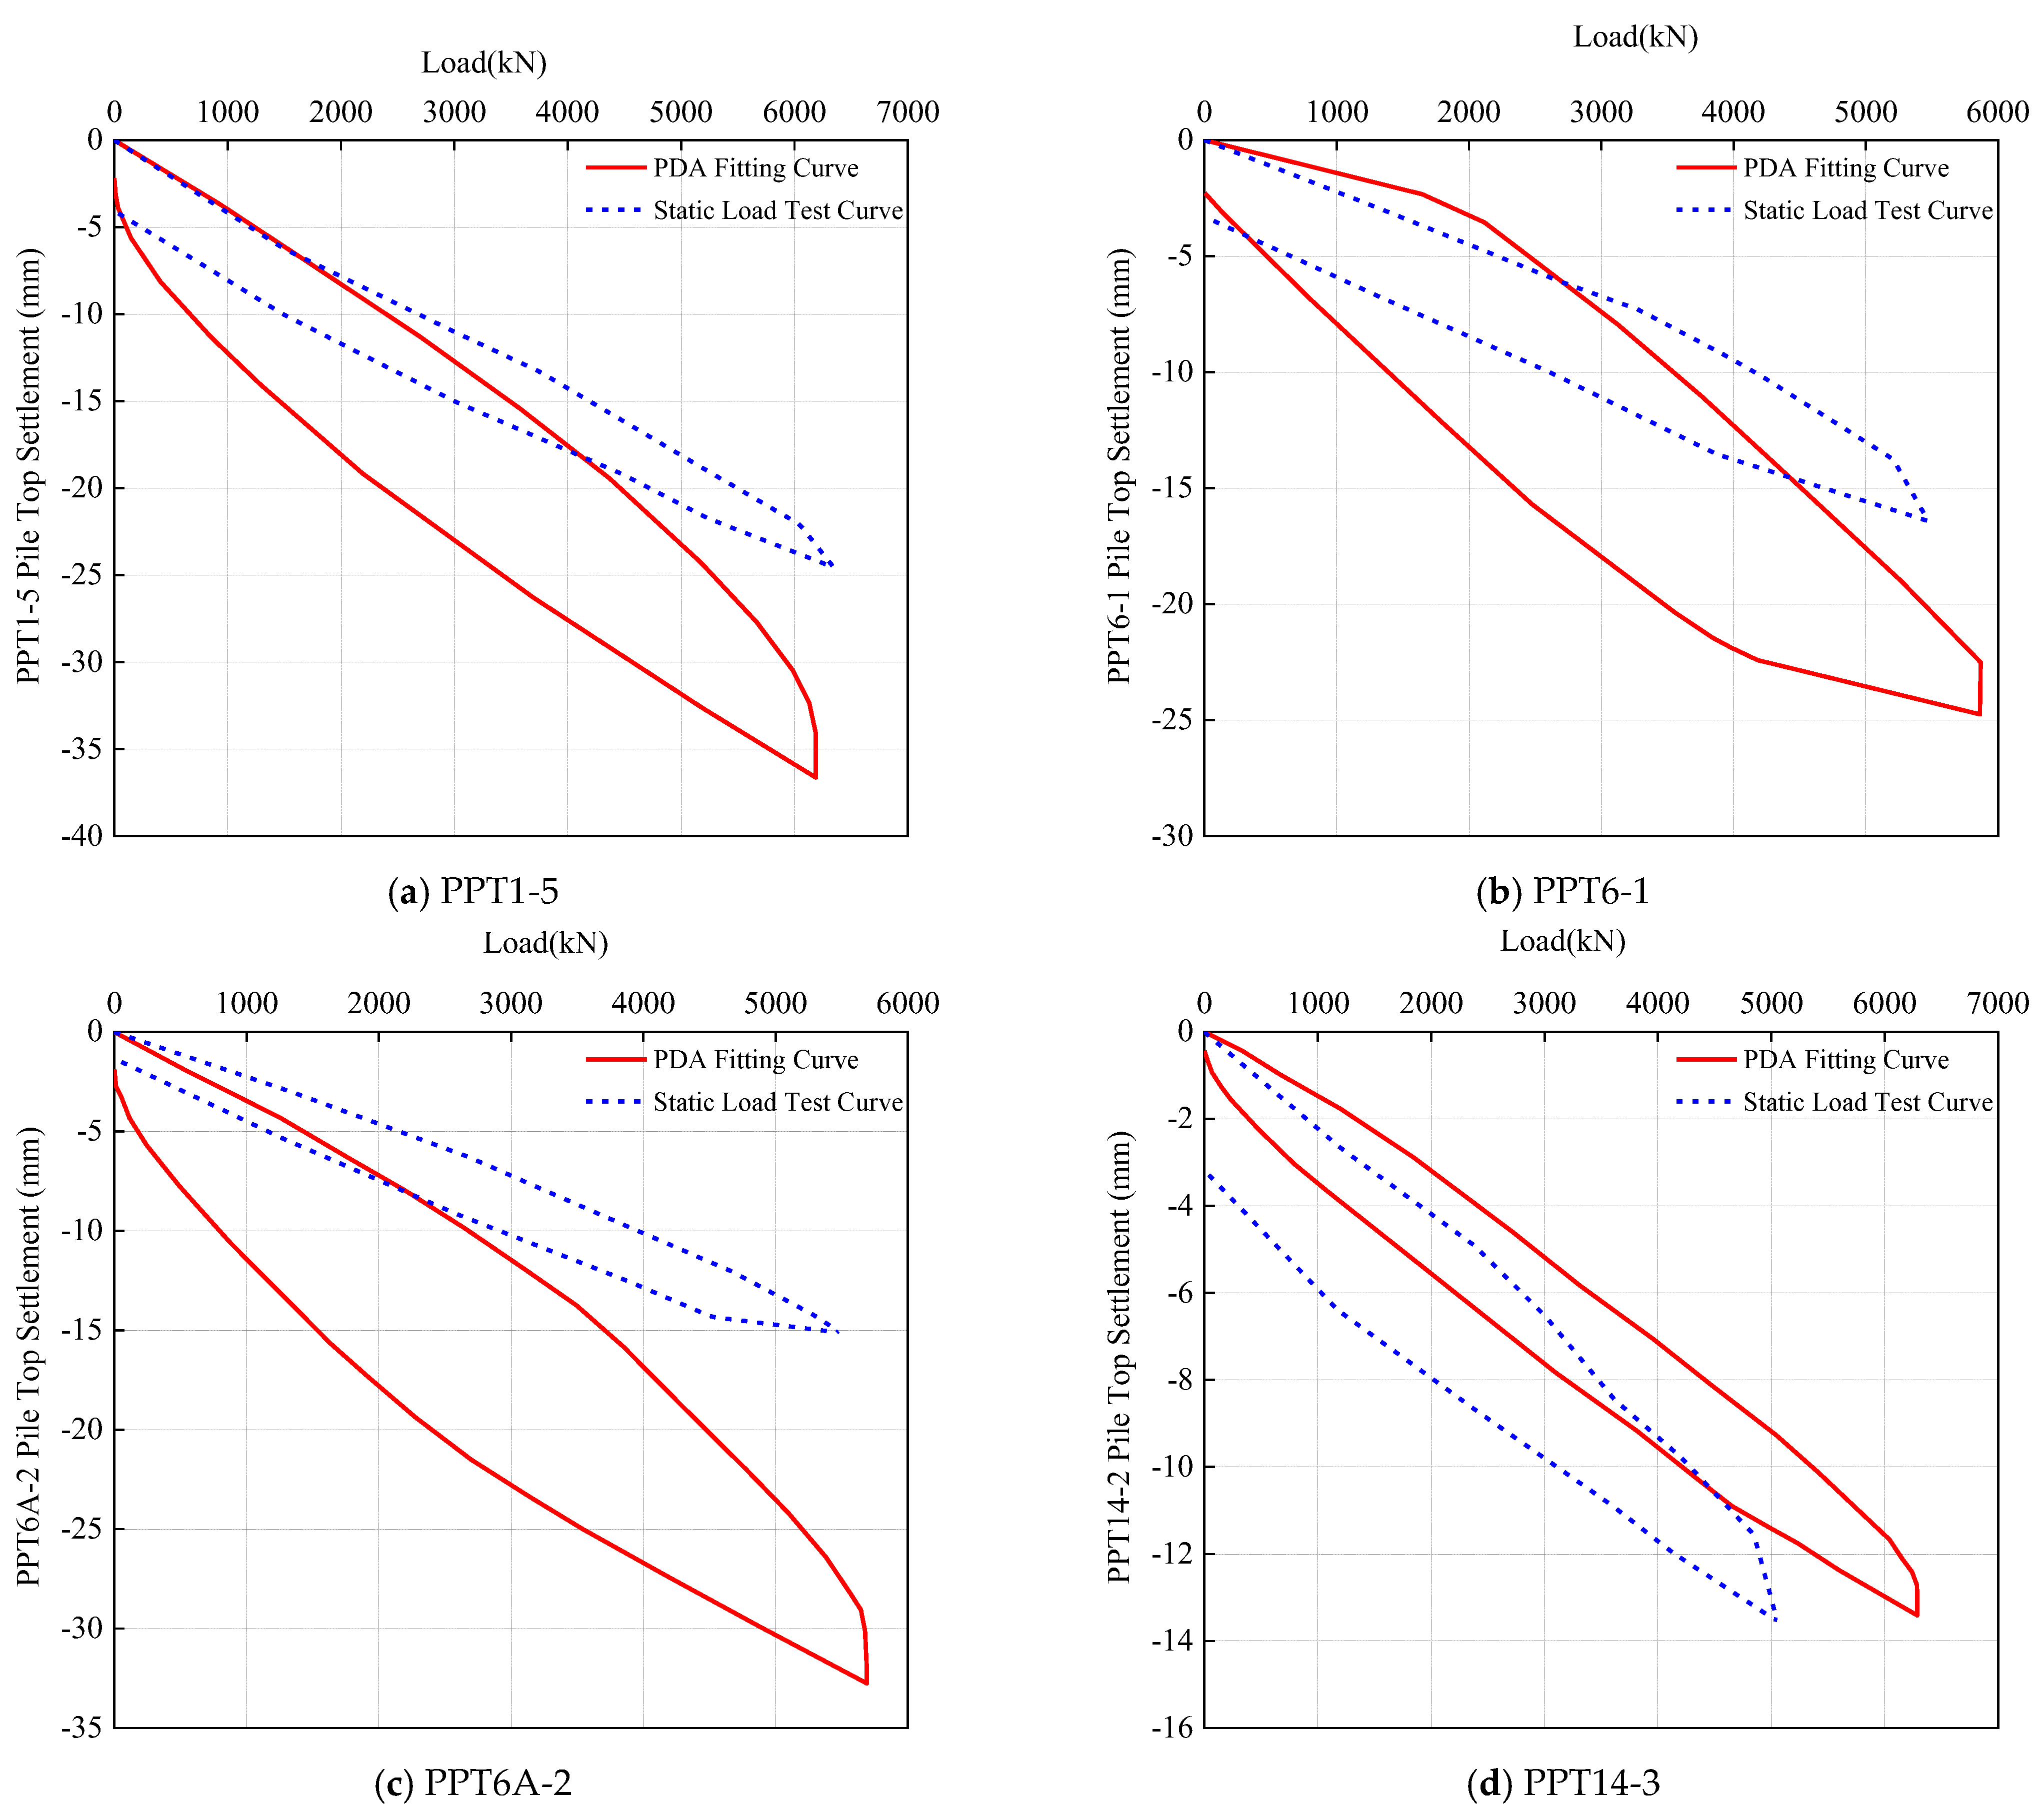
The static load test results of the four test piles are shown in Table 4, and the comparison between the static load and high strain test Q-s curves of the test piles is shown in Figure 5. From the figure and table, it can be seen that the Q-s curves of the static and dynamic load tests of the four piles are in poor coincidence. The Q-s curve of the vertical compressive static load test of a single pile is smooth, the unloading rebound curve is also smooth and the settlement is uniform at all levels. The maximum settlement of test pile PPT1-5 under the maximum loading of 6344 kN was 24.55 mm, and the residual displacement was 4.06 mm. The ultimate bearing capacity of the pile obtained by fitting the high strain test was 6187 kN. Test pile PPT6-1, which was loaded with a maximum load of 5471 kN, had a maximum settlement of 16.42 mm, a residual displacement of 3.3 mm and an ultimate bearing capacity of 5867 kN, obtained by fitting the high strain test. Test pile PPT6A-2 was loaded with a maximum load of 5489 kN, and had a maximum settlement of 15.12 mm, a residual displacement of 1.33 mm and an ultimate bearing capacity of 5689 kN, obtained by fitting the high strain test. The maximum settlement of test pile PPT14-3 was 13.55 mm, and the residual displacement was 3.18 mm under the maximum loading of 5053 kN. The ultimate bearing capacity of the pile obtained by fitting the high strain test was 6286 kN. Since the maximum loading of the static load test was 2.1 times the design load, and the final re-driven result of high strain was greater than the maximum loading of the static load test, the ultimate bearing capacity of the test pile was greater than the maximum loading of the static load test, and the test pile had a higher bearing capacity reserve. Compared with the dynamic load test, the maximum settlement of the static load test was generally smaller. This was mainly due to the fact that the static load test was conducted some time after the high strain re-driving. During this period, the pile bearing capacity remains in a generally stable state, but there may still be a small increase. In addition, the static load test loading did not reach its ultimate load. The Q-s curve is smooth and stable. It can be seen that the recovery coefficient selected for this project based on the high strain initial re-strike test is reasonable and safe.
Different from the research results of Ye et al. [26], the fitting Q-s curve of the high strain test is not in good agreement with the Q-s curve of the static load test. The first three piles in this test were all extra-long PHC piles over 50 m in length. It can be seen from Figure 5 that the high strain dynamic test results are similar to the static load test results, but the static load test settlement of super-long PHC piles was small. The reason for this was that the static load test was carried out some time after the high strain re-driving, during which the load bearing capacity of the extra-long pile would still increase. This also showed that the bearing capacity recovery time of extra-long PHC piles is longer than that of ordinary piles.
As can be seen from Table 4, there are differences in the ultimate loads of the dynamic and static tests. The main reasons for this phenomenon are: (1) the assumption of the elastic modulus of the pile material; (2) the error caused by the static resistance model of the soil on the pile side. For the convenience of analysis, the elastic linear model was adopted for the pile shaft during the analysis and calculation of high strain dynamic measurement, and E was a constant, independent of the stress and strain level. However, the internal force test results of the static load test showed that the axial stress-strain relationship of the reinforced concrete in the cross-section of the pile was non-linear. The current high strain analysis software treats the soil around the pile as an ideal elastic-plastic model, and simulates the soil resistance as an elastic-plastic spring. When the pile displacement s of the calculation element does not reach the limit value su, the static resistance Q of soil is proportional to s; after s exceeds su, the static resistance of the soil remains the ultimate soil resistance qu.

3.3. Results and Analysis of Static Load Tests

In order to fully test the bearing capacity and deformation of the test piles, extensometers and strain gauges were installed at different depths of the PHC pipe piles, as shown in Figure 3. Vibrating-wire load cell, Glostrext sensors, jacking system and pile movement monitoring devices were found to be in good working order, indicating the success of the instrumentation scheme. The large quantity of the high-quality data collected from these instruments is able to produce reliable information for meaningful interpretation.
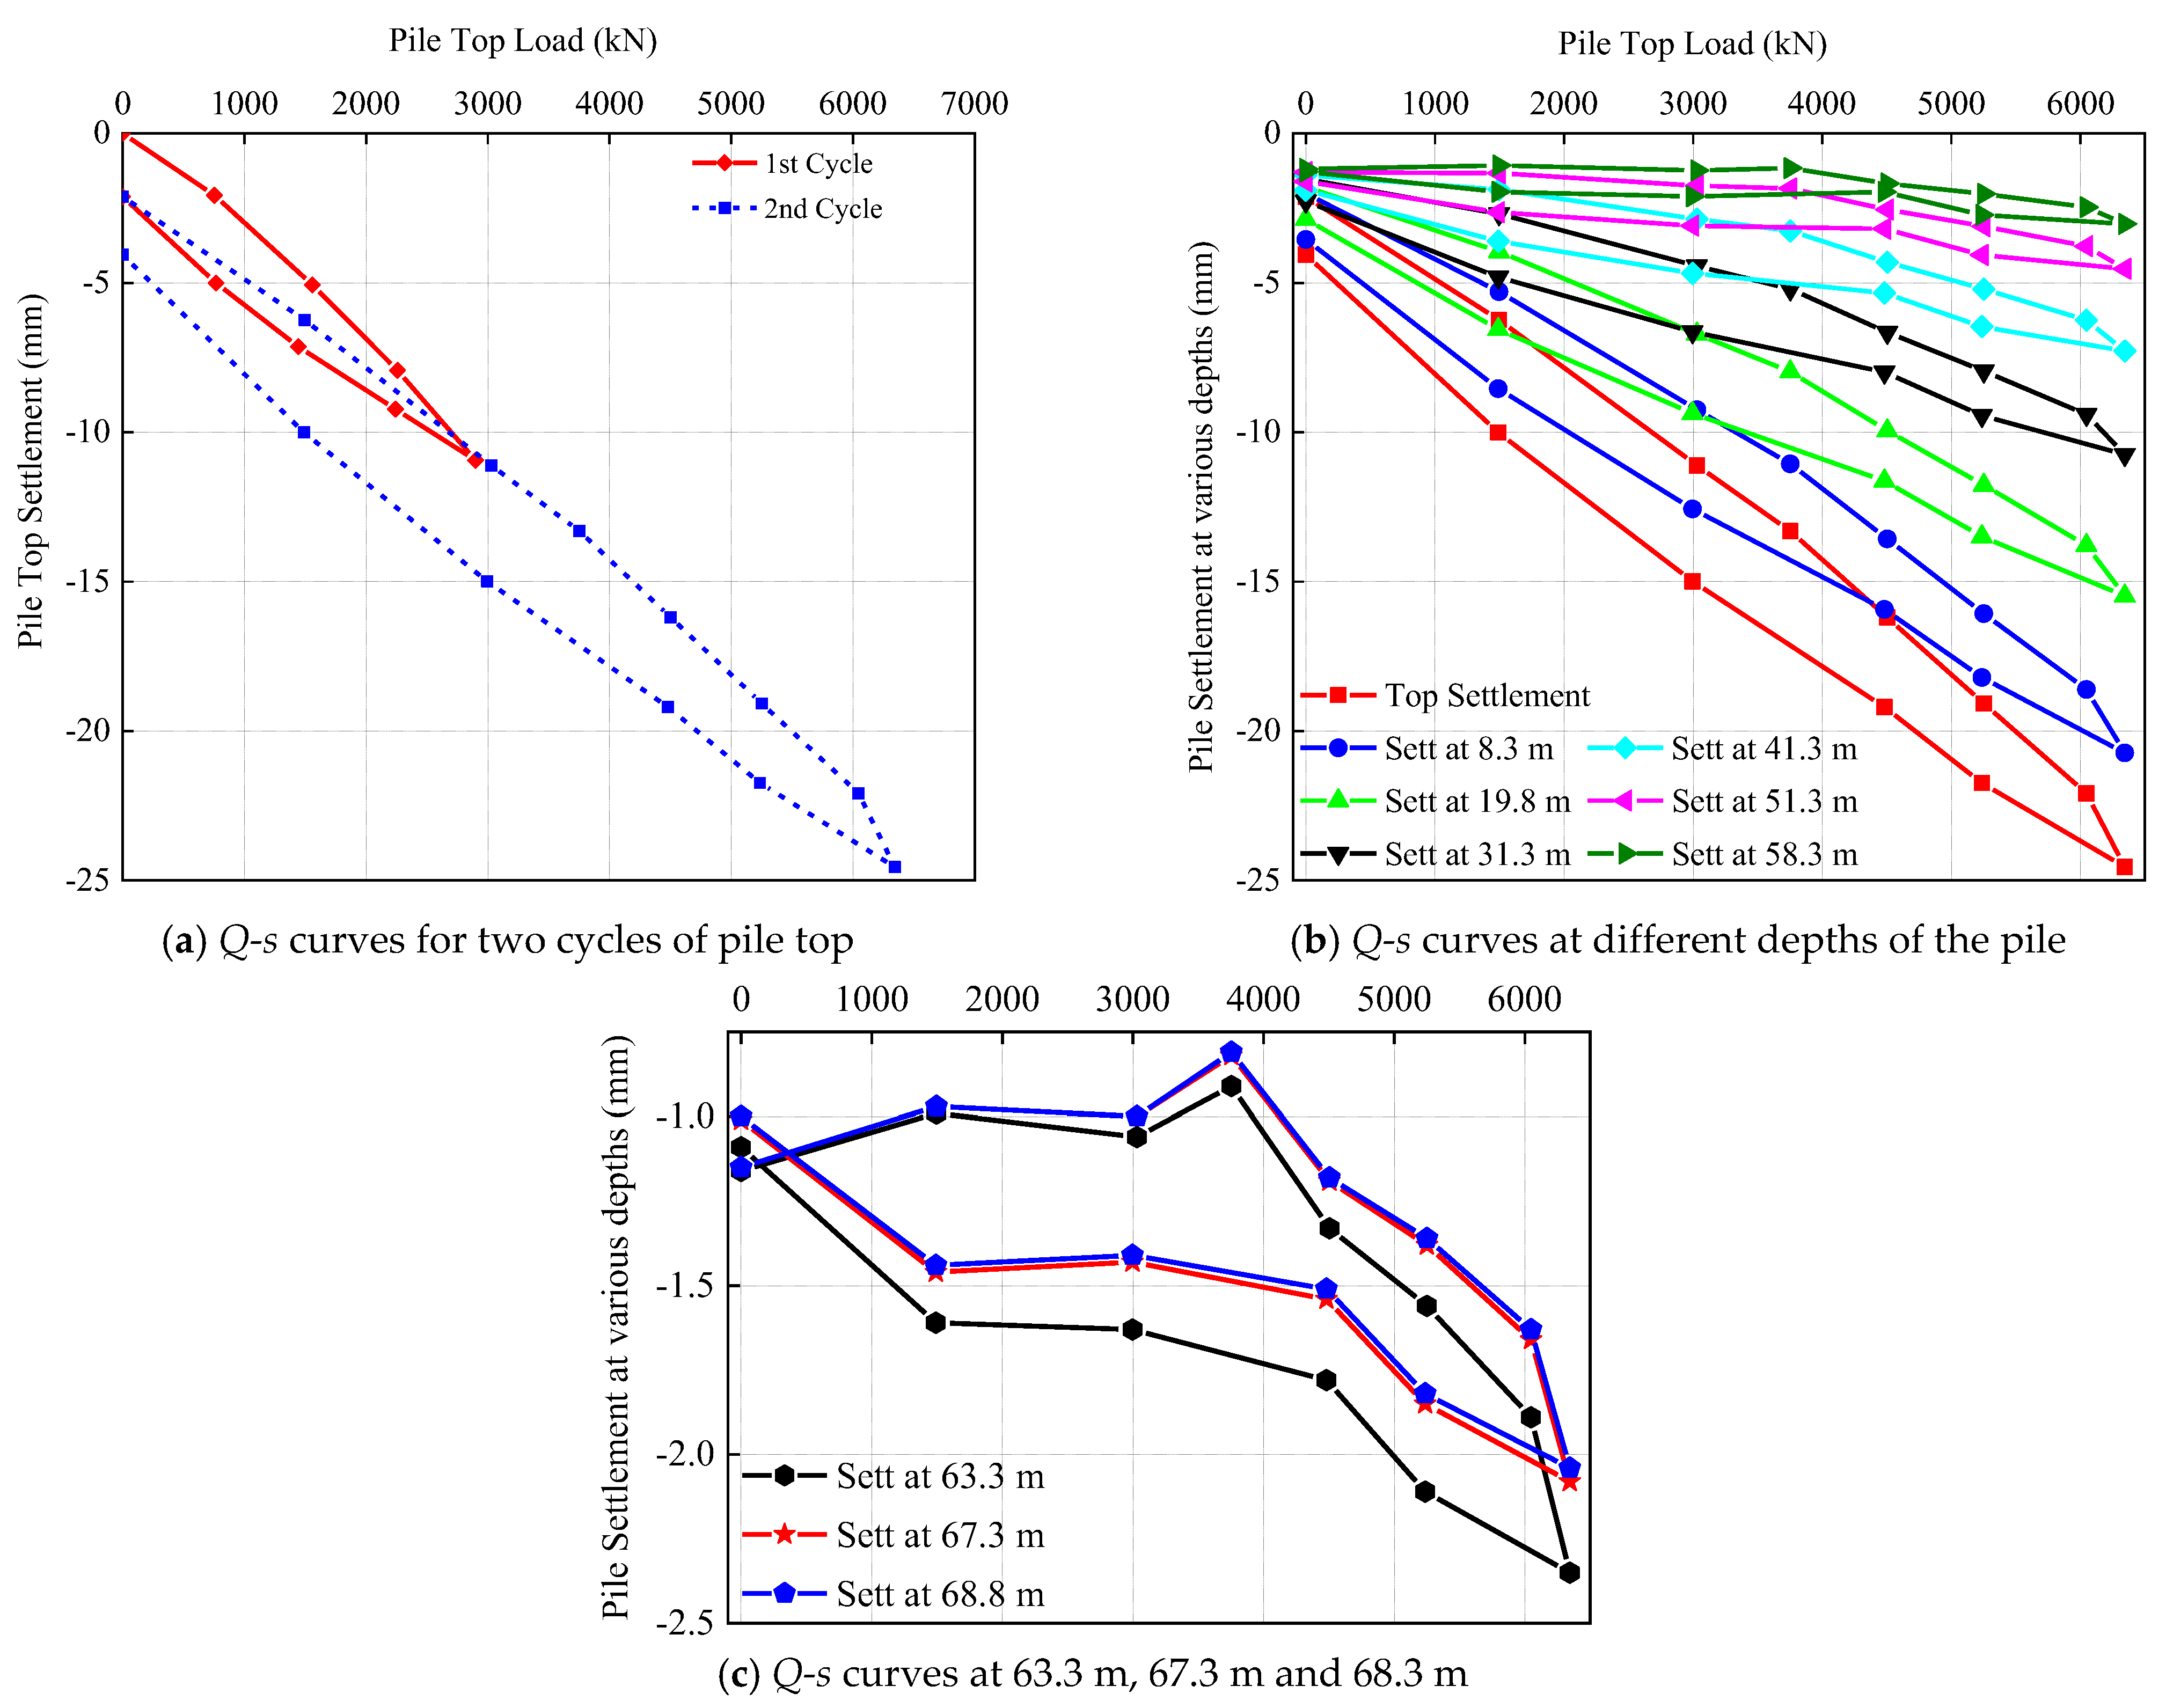
After the static load test, the Q-s curves of the test pile PPT1-5 are shown in Figure 6. The Q-s curves of the pile top for two loading cycles are shown in Figure 6a. The Q-s curve of the first cycle of the static load test was stable, and the settlement at all levels was uniform. The maximum load is the design load (3000 kN), the maximum settlement is 10.94 mm, the unloading rebound curve is also stable and the residual displacement is 2.12 mm. The Q-s curve of the second cycle of the static load test is stable, and the settlement of all levels is uniform. The maximum load is 2.1 times the design load (6344 kN), the maximum settlement is 24.55 mm, the unloading rebound curve is also stable and the residual displacement is 4.06 mm. The Q-s curves at different depths for the second loading cycles are shown in Figure 6b. It can be seen from the figure that the Q-s curves of different depths of the pile are similar in shape, and the loading and unloading curves are stable. Under the maximum load, the maximum settlement of the pile top is 24.55 mm. The settlement value of the pile is 20.73 mm at 8.3 m below the seabed surface, 15.48 mm at 19.8 m, 10.75 mm at 31.3 m, 7.28 mm at 41.3 m, 4.53 mm at 51.3 m, 3.03 mm at 58.3 m, 2.35 mm at 63.3 m, 2.08 mm at 67.3 m and 2.04 mm at 68.3 m. Under the maximum load, the maximum settlement and residual deformation decrease with the increase of pile depth.
The plot of the pile top loads vs. pile top settlement for the test cycles of maintained load testing are shown as Figure 7. The curves of each test pile in Figure 7 were all gradual curves, and there was no sudden drop after reaching the design loading value. The maximum settlement of the pile top under the first cyclic loading was 10.94 mm, 6.35 mm, 7.11 mm and 8.28 mm, respectively, and the residual settlement was 2.12 mm, 0.37 mm, 0.70 mm and 3.24 mm, respectively. The maximum settlement of the pile top under the second cyclic loading was 24.55 mm, 16.42 mm, 15.12 mm and 16.79 mm, respectively, and the residual settlement was 4.06 mm, 3.30 mm, 1.33 mm and 6.42 mm, respectively. Compared with the first cyclic loading, the maximum settlement of piles under the second cyclic loading increased by 2.24 times, 2.58 times, 2.12 times and 2.02 times, respectively. The maximum value of the second cycle loading was 2.1 times that of the first cycle loading. It can be seen from the settlement value and Q-s curve shape that under the action of 2.1DVL, the test piles are still in an elastic working state and have a high bearing capacity safety factor.
The load distribution curves, capable of indicating the load distribution along the shaft and at the base, were derived from computations based on the measured changes in global strain gauge readings and estimated pile properties.
Load transferred (PAve) at the midpoint of each anchored interval can be calculated as:
P Ave = ε E c A c
where
  • ε = average change in global strain gauge readings.
  • Ac = cross-sectional area of spun pile section.
  • Ec = concrete modulus of pile section.
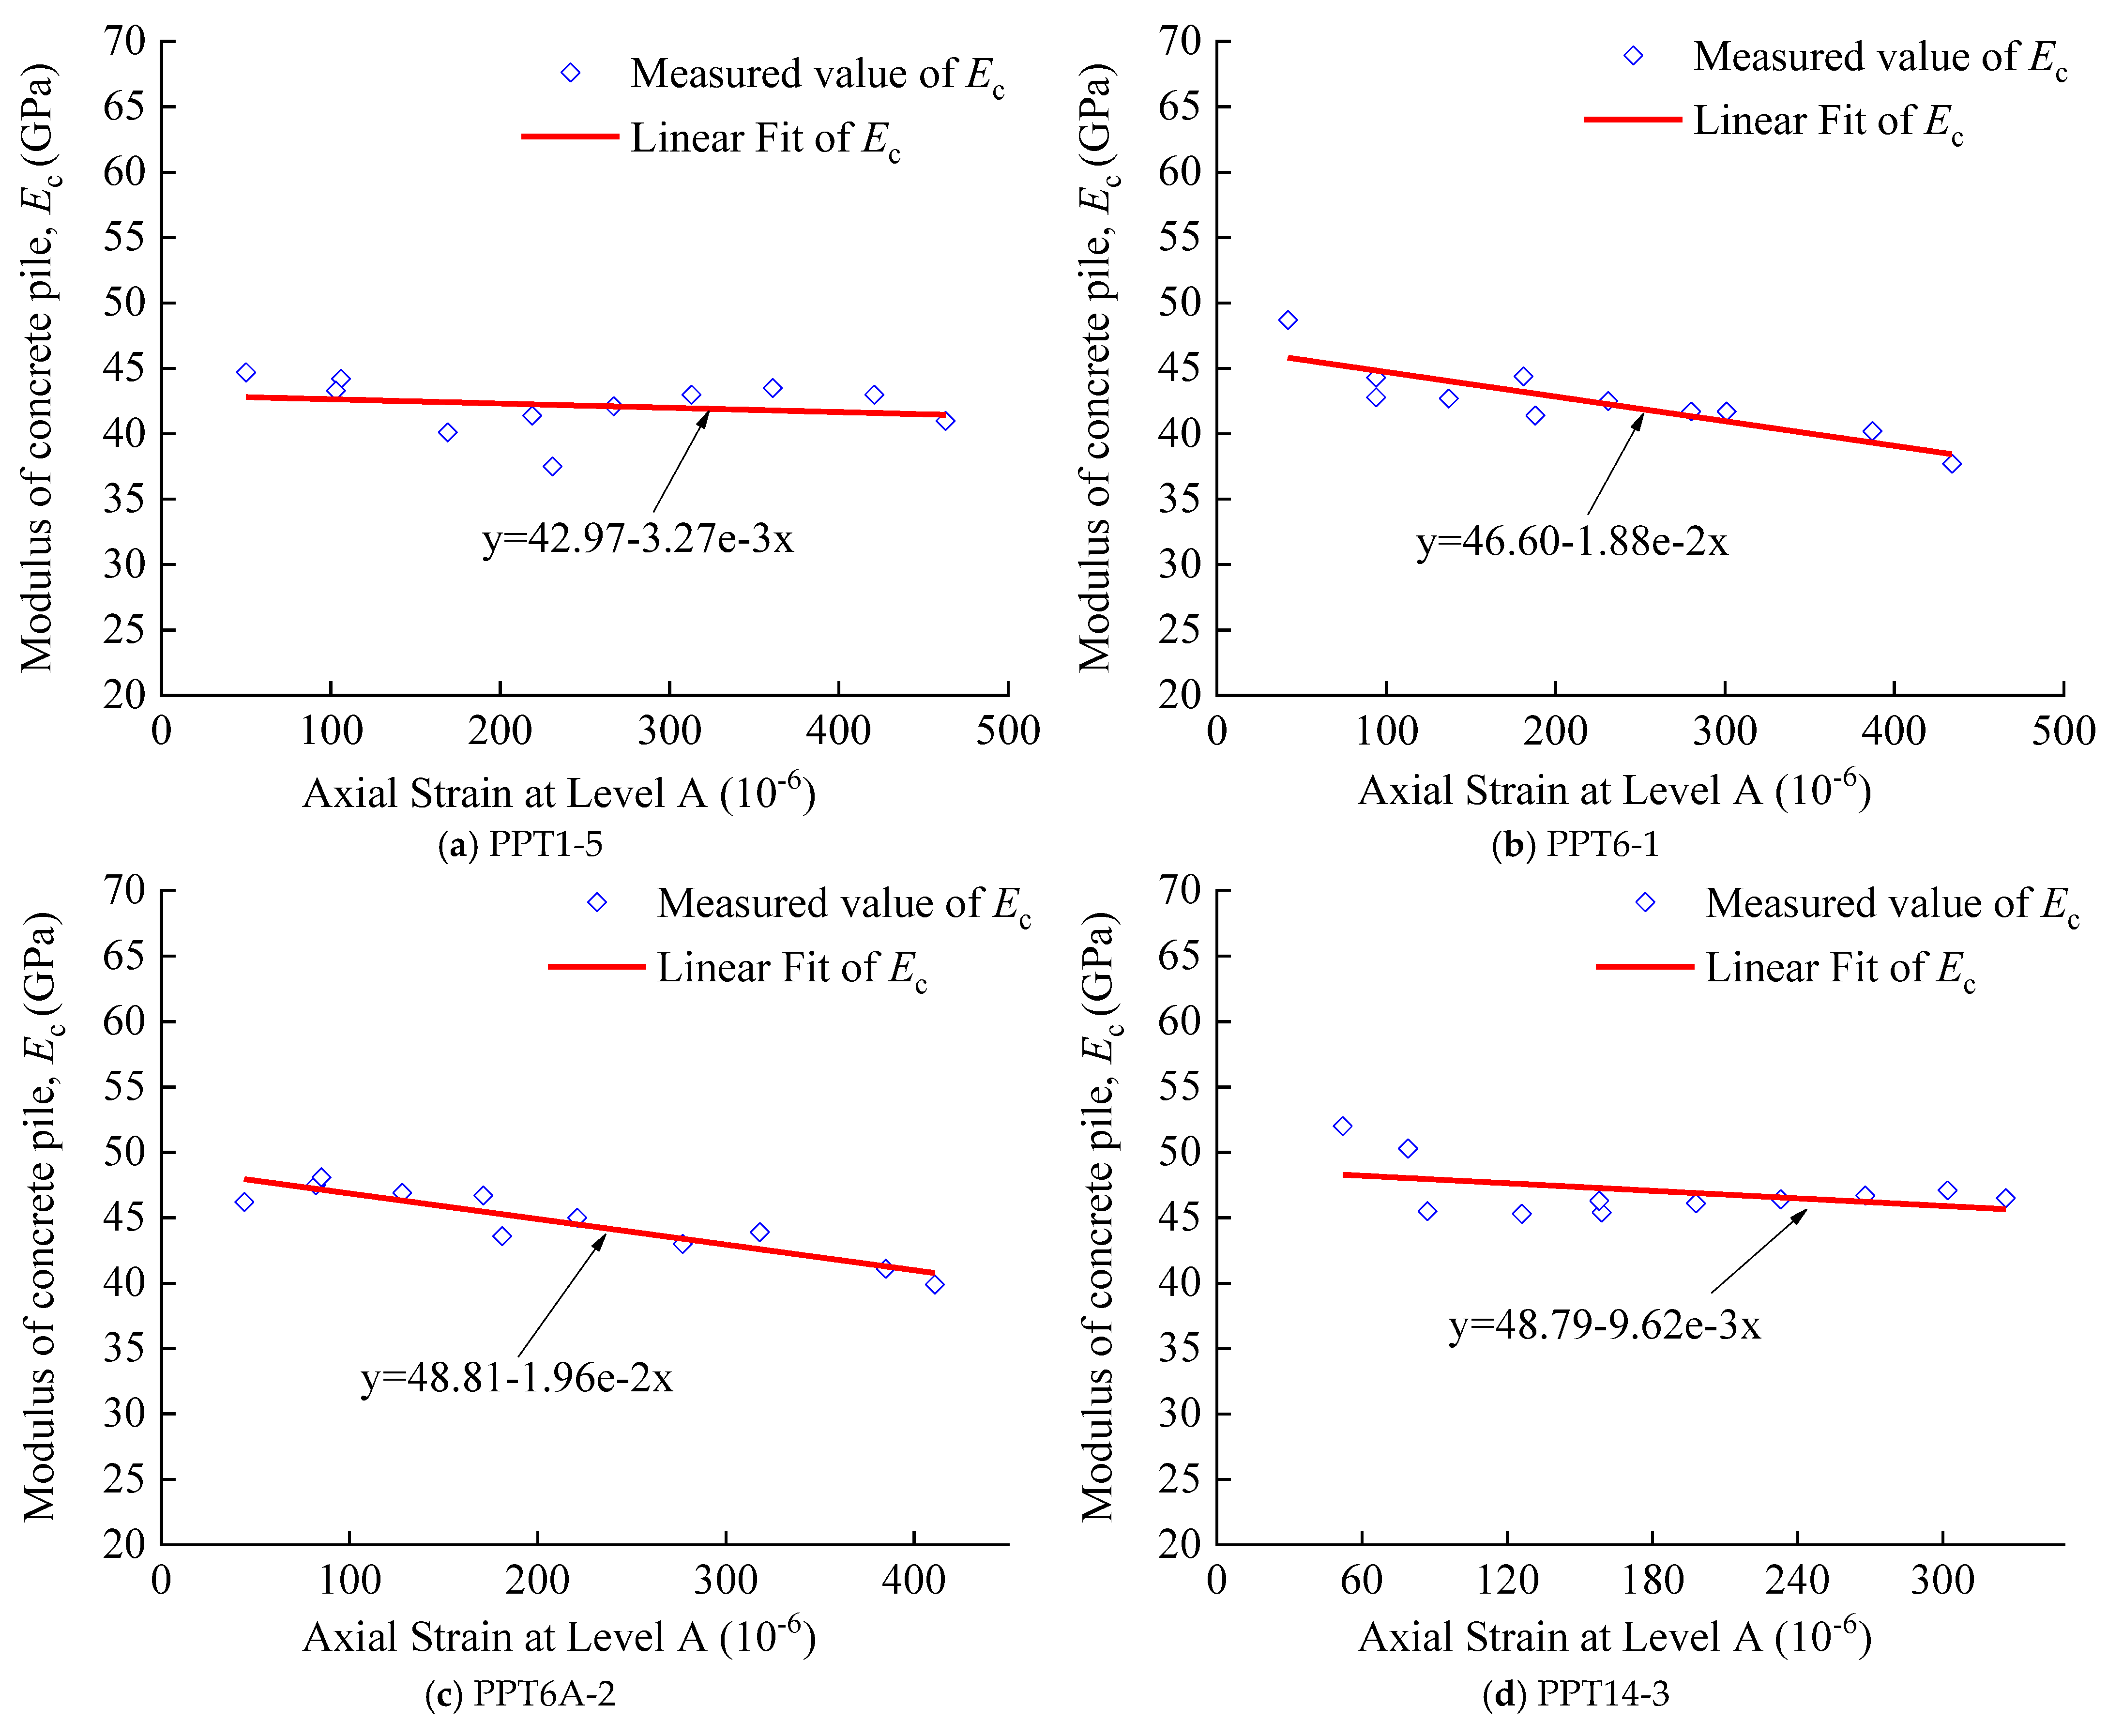
For the test pile, the concrete pile modulus, Ec was back-calculated by measuring the global strains near the pile top (short interval from 0.3 m to 8.3 m, sensor 1) and the pile top loads. For each stage of loading, Ec is back-calculated by assuming that the load at the midpoint of the anchored interval is equal to the applied load at the pile top.
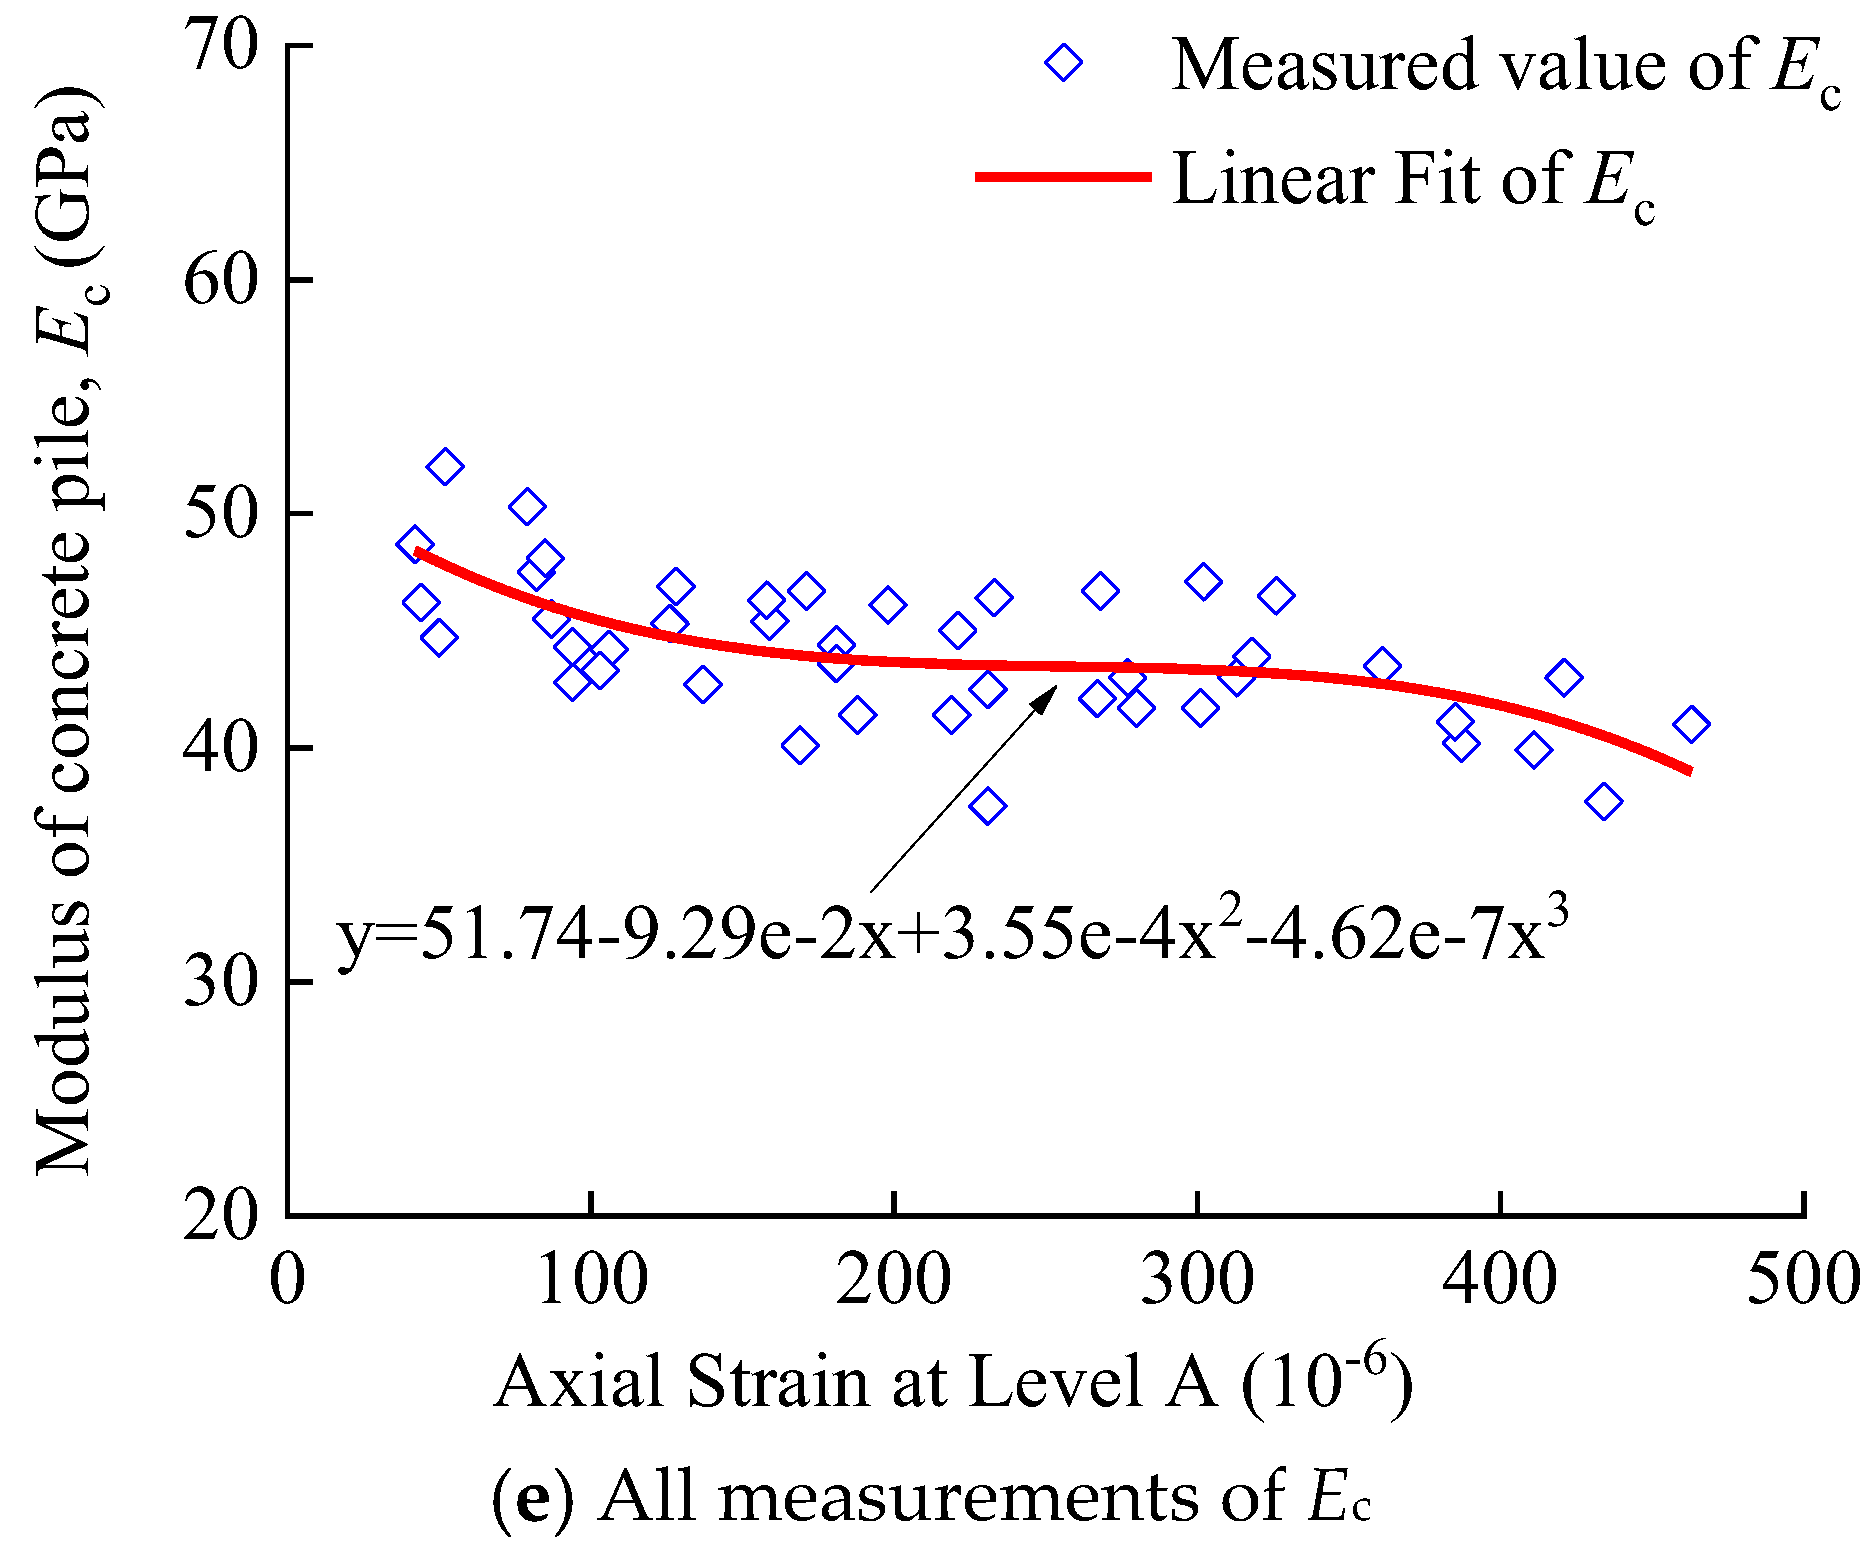
From C. Lam & S.A. Jefferis’s review [35], based on a comparison of the derived pile loads, the secant modulus method was found to be the most satisfactory. Ec values are also known to be strain-dependent. Therefore, the back-calculated concrete values for the test pile are plotted against the measured strain in Figure 8 to obtain a best fit curve to further increase the accuracy of analysis. The correlation coefficients of all fitted curves are greater than 0.6, which shows a good correlation. The difference between the loads at any two levels represents the shaft load carried by the portion of pile between the two levels. As can be seen from the figure, the measured values of Ec are not very different. The red line in the figure is the fitting curve of the concrete modulus to axial strain. The concrete modulus decreases continuously with the increase of the axial strain of the test pile. According to Lam, C. et al., any increase or subtraction of strain has a nonlinear effect on the concrete modulus values. In contrast, the results contained in this study seem to lean more towards a linear variation. This is mainly because the static load test was not loaded to the ultimate load. Within a certain load range, the concrete modulus changed approximately linearly.
The strain-dependent secant modulus is an important parameter for interpreting static load test results. To accurately determine the relationship between the concrete pile modulus and axial strain, all Ec measurements were put together for a fitting analysis, as shown in Figure 8e. Based on the Glostrext method, the strain-dependent secant modulus, Ec for the test piles, was represented in Figure 8e as E ≤ 52 GPa, giving a range from 52 GPa to 37.5 GPa over a recorded micro-strain range of 42–463. All test values fall within the acceptable range of the concrete pile modulus. The relationship between the concrete pile modulus and axial strain can be expressed as follows:
E c = 51.74 0.0929 ε + 3.55 e 4 ε 2 44.662 e 7 ε 3
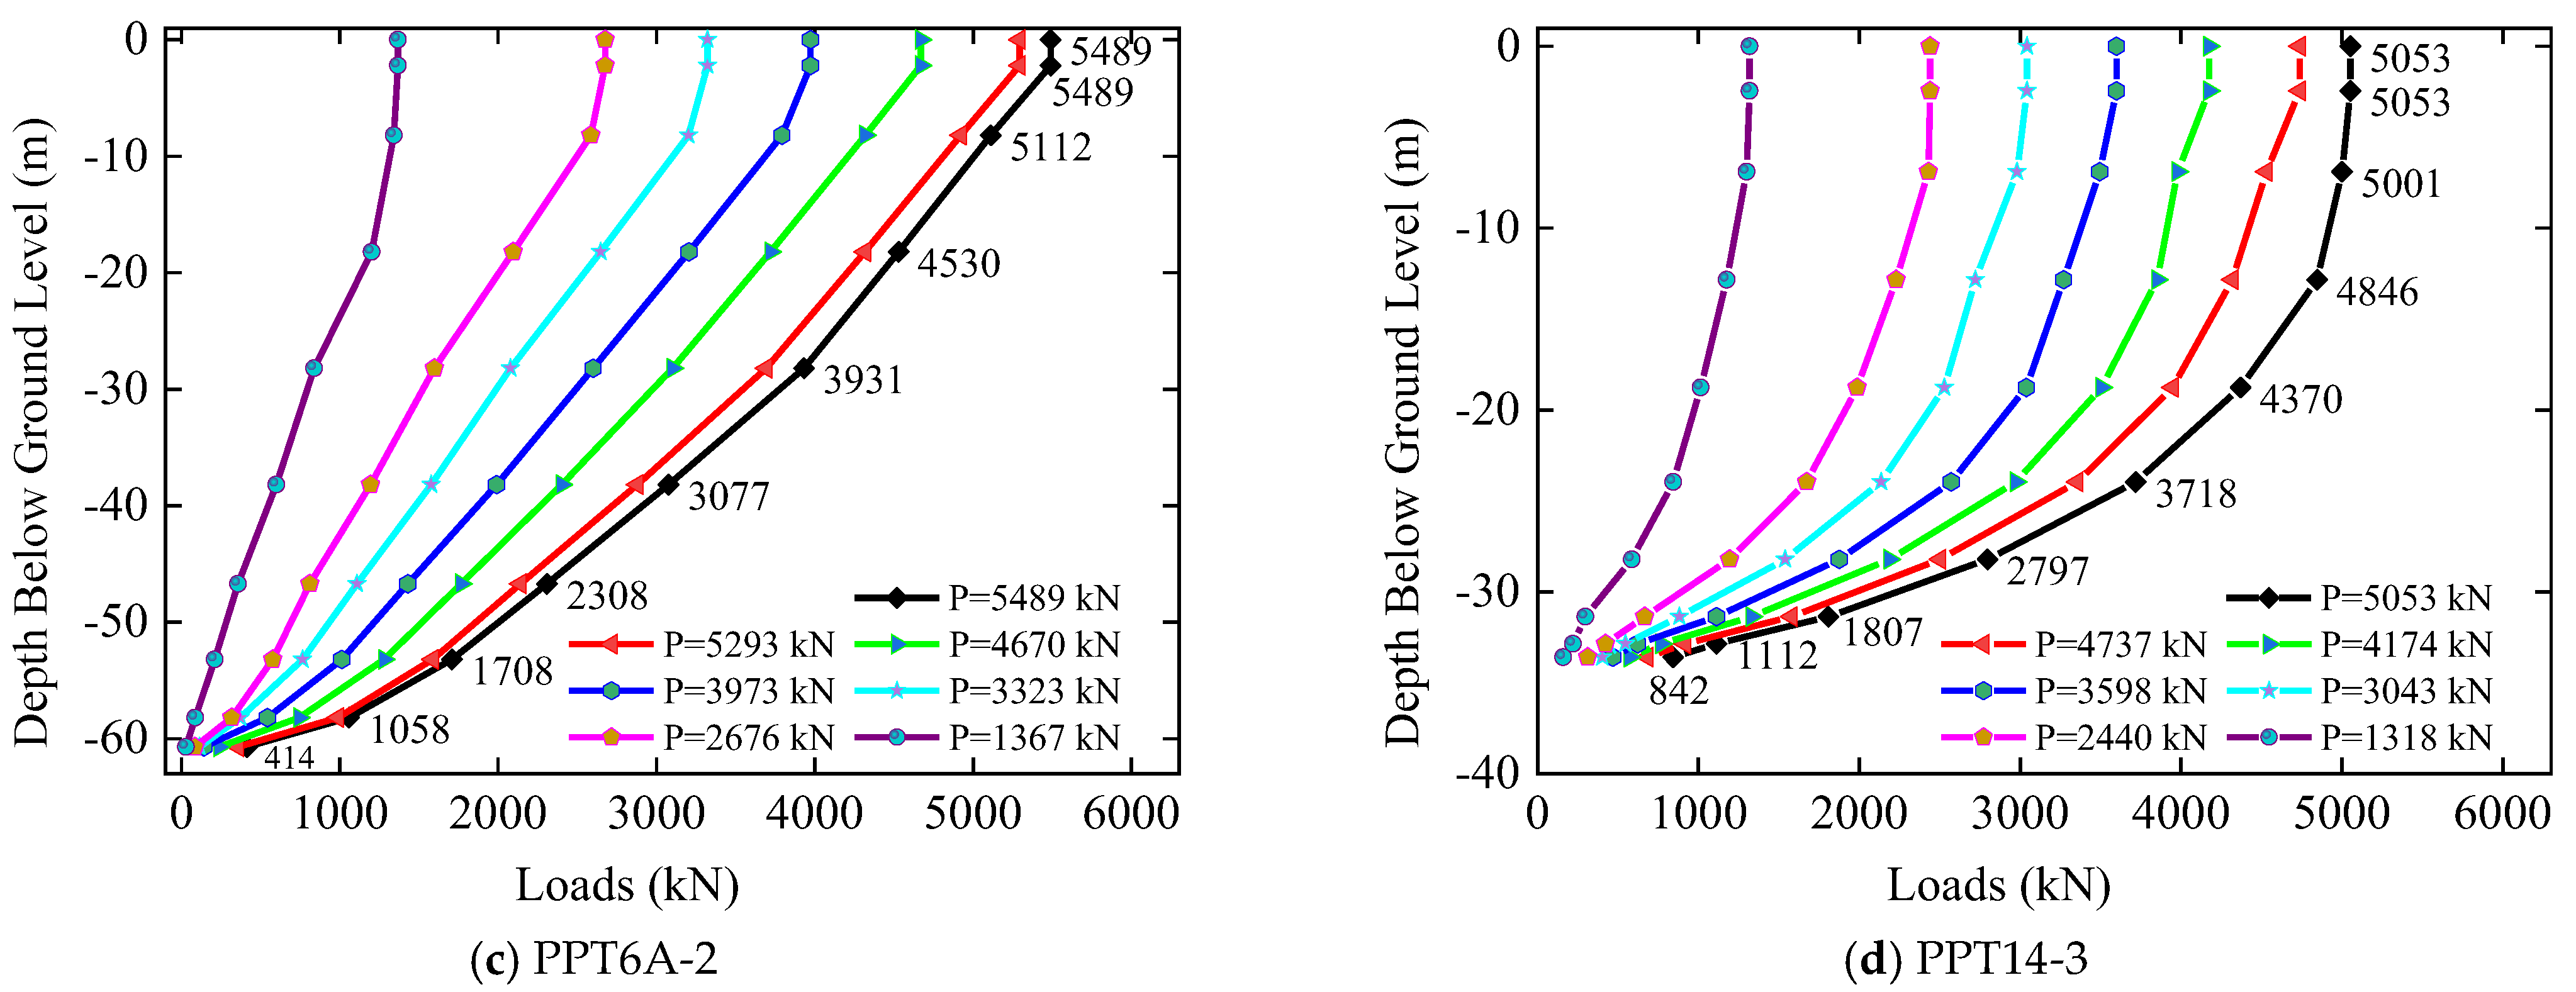
The load distribution curves for the test cycles are plotted in Figure 9 based on strain-load computations. The load distribution curves, capable of indicating the load distribution along the shaft and at the base, were derived from computations based on the measured changes in global strain gauge readings and estimated pile properties. It can be seen from Figure 9 that the load distribution curves of the four test piles are similar. With the increase of the buried depth of the pile, the load on the pile body is constantly decreasing. The end of the pile bears the least load. The loads on the pile bottoms of PPT1-5, PPT6-1, PPT6A-2 and PPT14-3 are 271 kN, 300 kN, 414 kN and 842 kN, respectively. This is mainly due to the different bearing layers at the bottom of the pile.
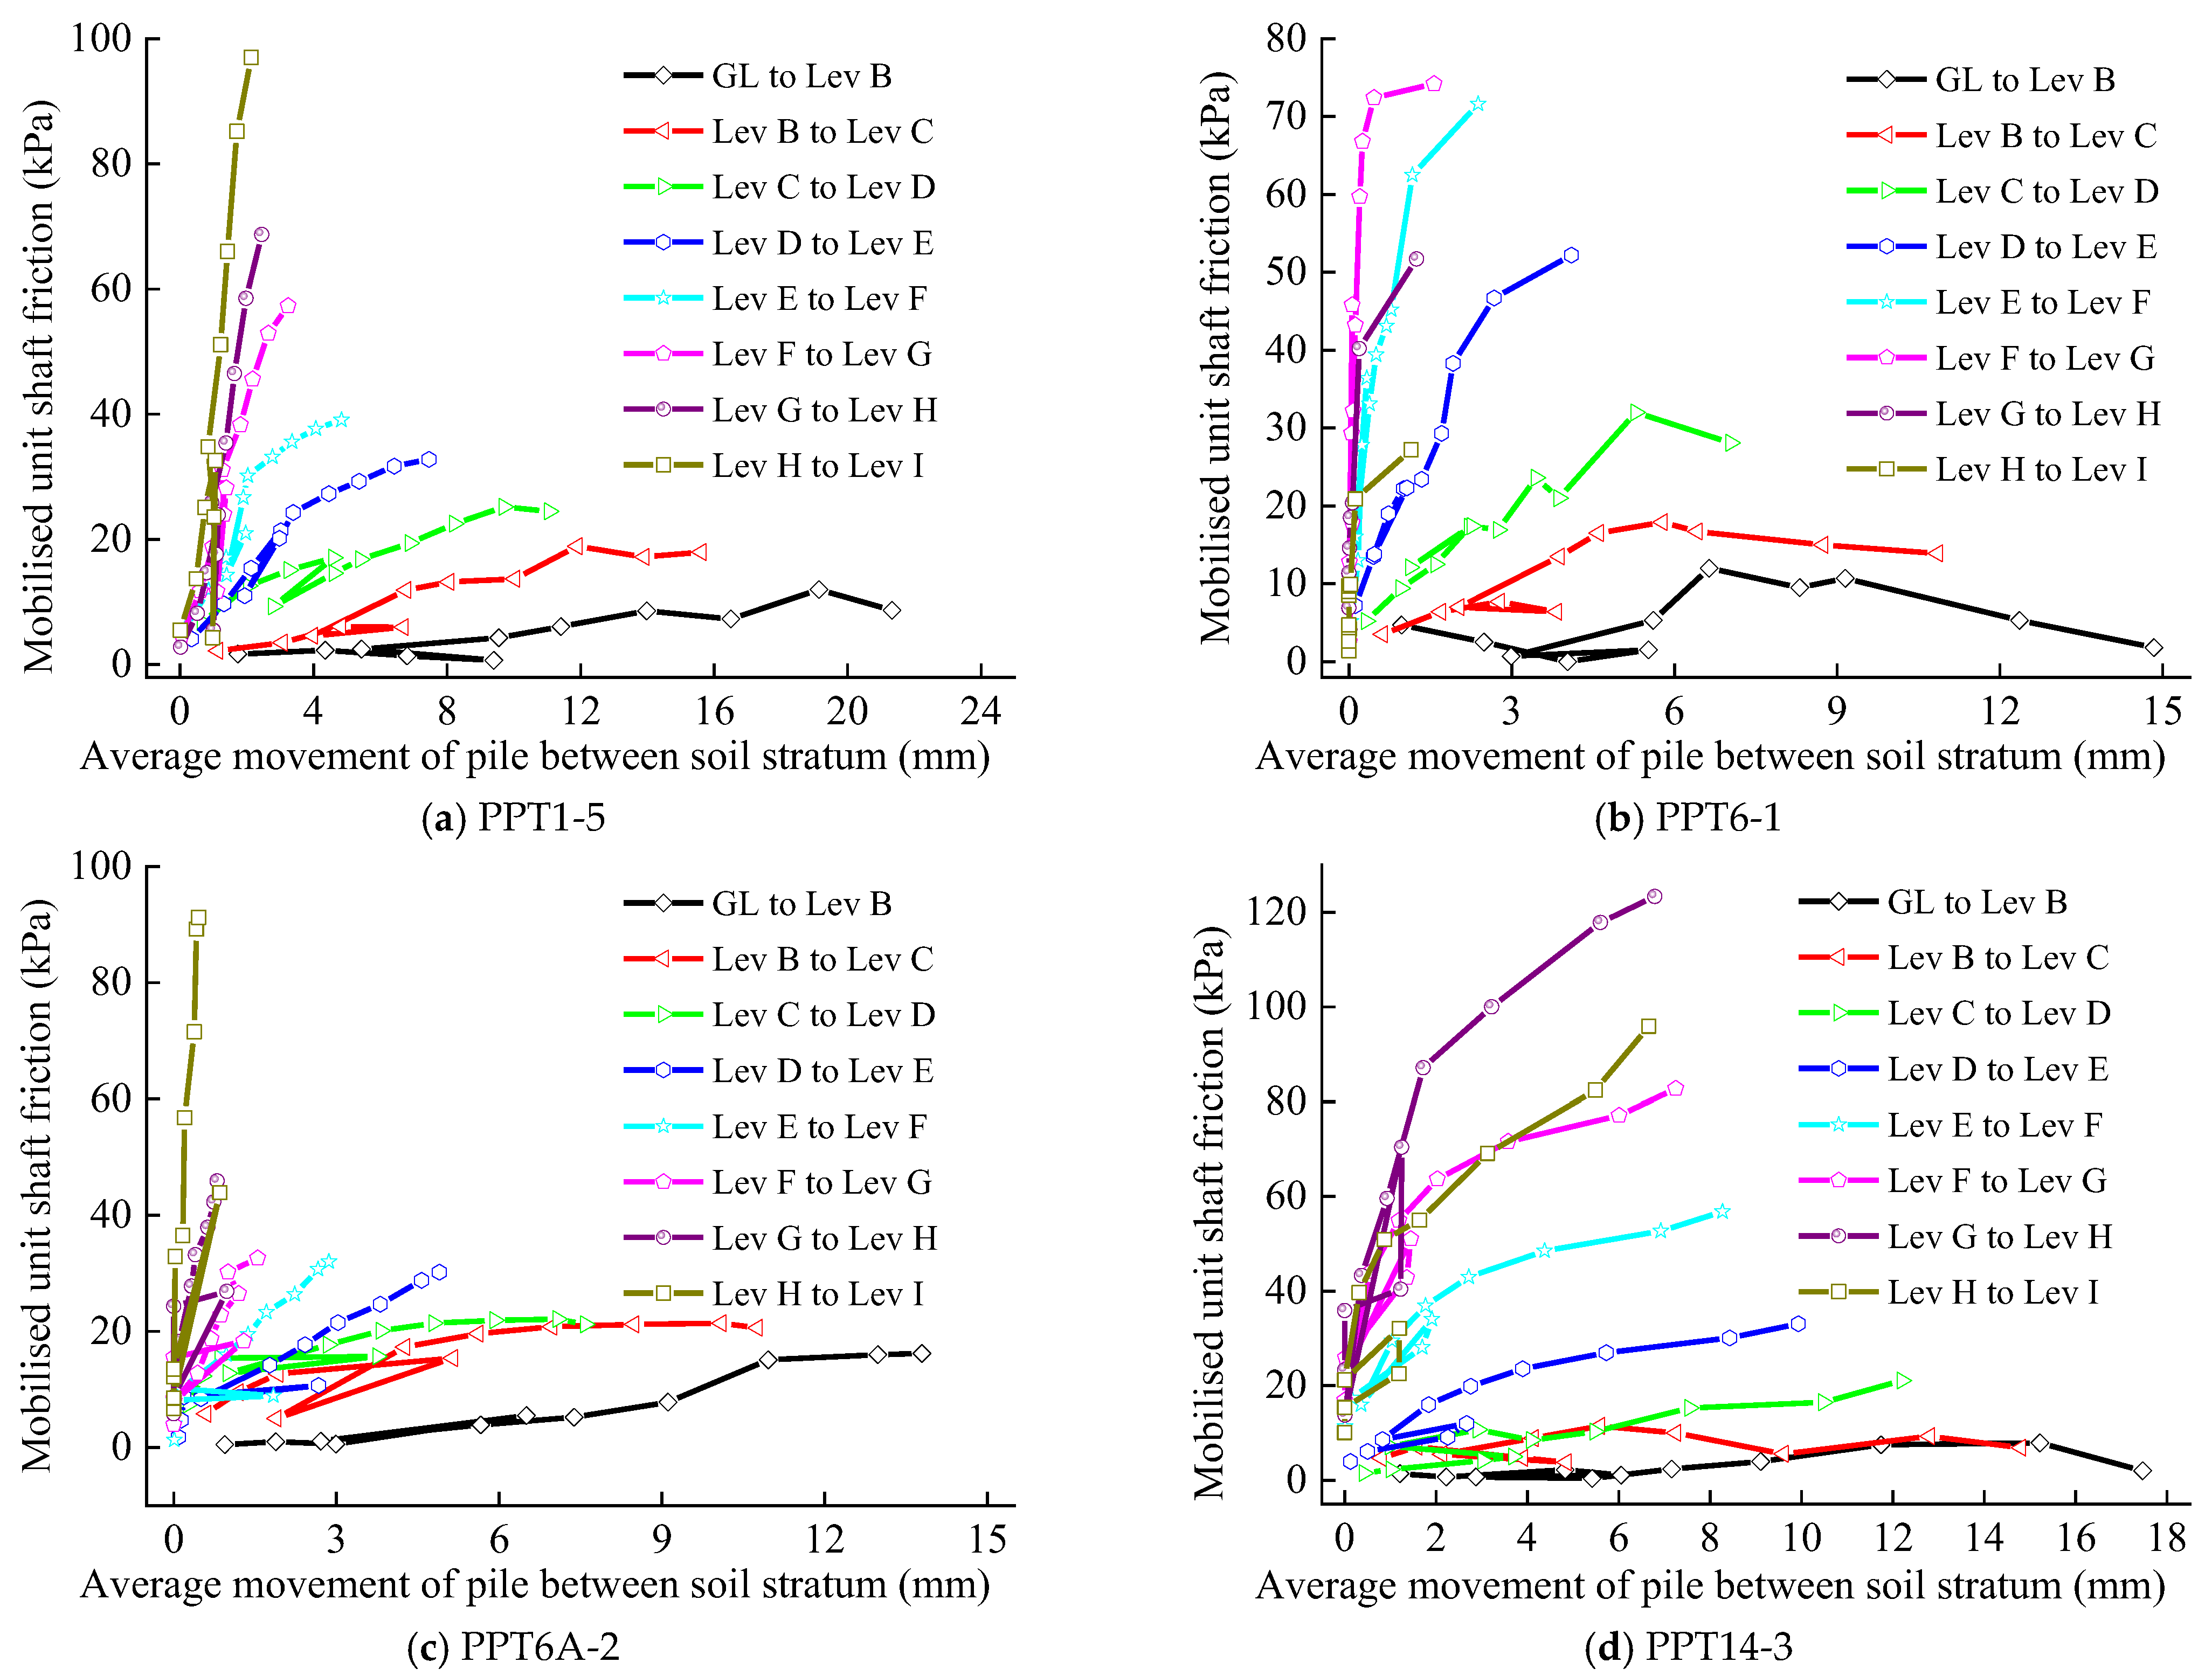
This test not only evaluates the load distribution characteristics of the pile body, but also measures the characteristic curve of the pile shaft friction resistance and the movement of the pile between different soil stratums (Figure 10). It can be seen from the figure that the side friction resistance of the pile increases with the increase of the movement of the pile between the soil layers. However, the magnitude of the increase is different. The greater the buried depth of the pile, the greater the increase in the unit lateral friction resistance of the pile with the movement of the pile. Taking PPT14-3 as an example, when the average movement of piles between soil layers is 6 mm, the unit pile shaft friction resistance of GL to Lev B, Lev B to Lev C, Lev C to Lev D, Lev D to Lev E, Lev E to Lev F, Lev F to Lev G and Lev G to Lev H are 1.19 kPa, 10.56 kPa, 11.81 kPa, 27.23 kPa, 51.18 kPa, 77.26 kPa and 119.62 kPa, respectively This is a relatively general rule. Of course, there are exceptions, such as Lev G to Lev H and Lev H to Lev I of test pile PPT6-1, and Lev H to Lev I of PPT14-3. Since the construction method, the surface style and stiffness of each pile are basically the same, and the main reason for these exceptions is the different soil properties. It is certain that in the construction of super-long pile foundations, the load test and geological exploration of the piles are very worthwhile. The soil layers in different depths around the pile have different stress states. For the upper soil layer, the confining pressure is small, and its lateral resistance is not easy to give full play. With the increase of depth and the confining pressure on the soil, the lateral resistance of the pile may gradually develop from top to bottom with the increase of the load. The relative movement of the pile and soil required for the full play of lateral friction resistance is related to the pile diameter, construction technology, soil properties and soil depth. The literature [36] stated that the relative pile-soil displacements required for the pile lateral friction resistance to be fully developed were 5–10 mm in cohesive soil layers and 10–20 mm in sandy soil layers. The relationship between the pile side friction resistance and the movement between stratum in this test is not consistent with that in this test. The test results show that the relative displacement of pile and soil required to give full play to the pile side friction resistance in clay soil is greater than 10 mm. As shown in Figure 10, in the clay layer from GL to Lev B, the relative displacement of PPT1-5, PPT6A-2 and PPT14-3 piles is 19.14 mm, 10.96 mm and 11.74 mm, respectively, when the side friction resistance is fully exerted. The softening of pile side friction occurs after the relative displacement of pile and soil exceeds the ultimate displacement. The softening of pile-soil relative displacement is more significant in shallow buried cohesive soil. After the side friction resistance of the upper part of the pile reaches the limit, different degrees of softening will occur. The side friction resistance of the lower part of the pile did not reach the limit.
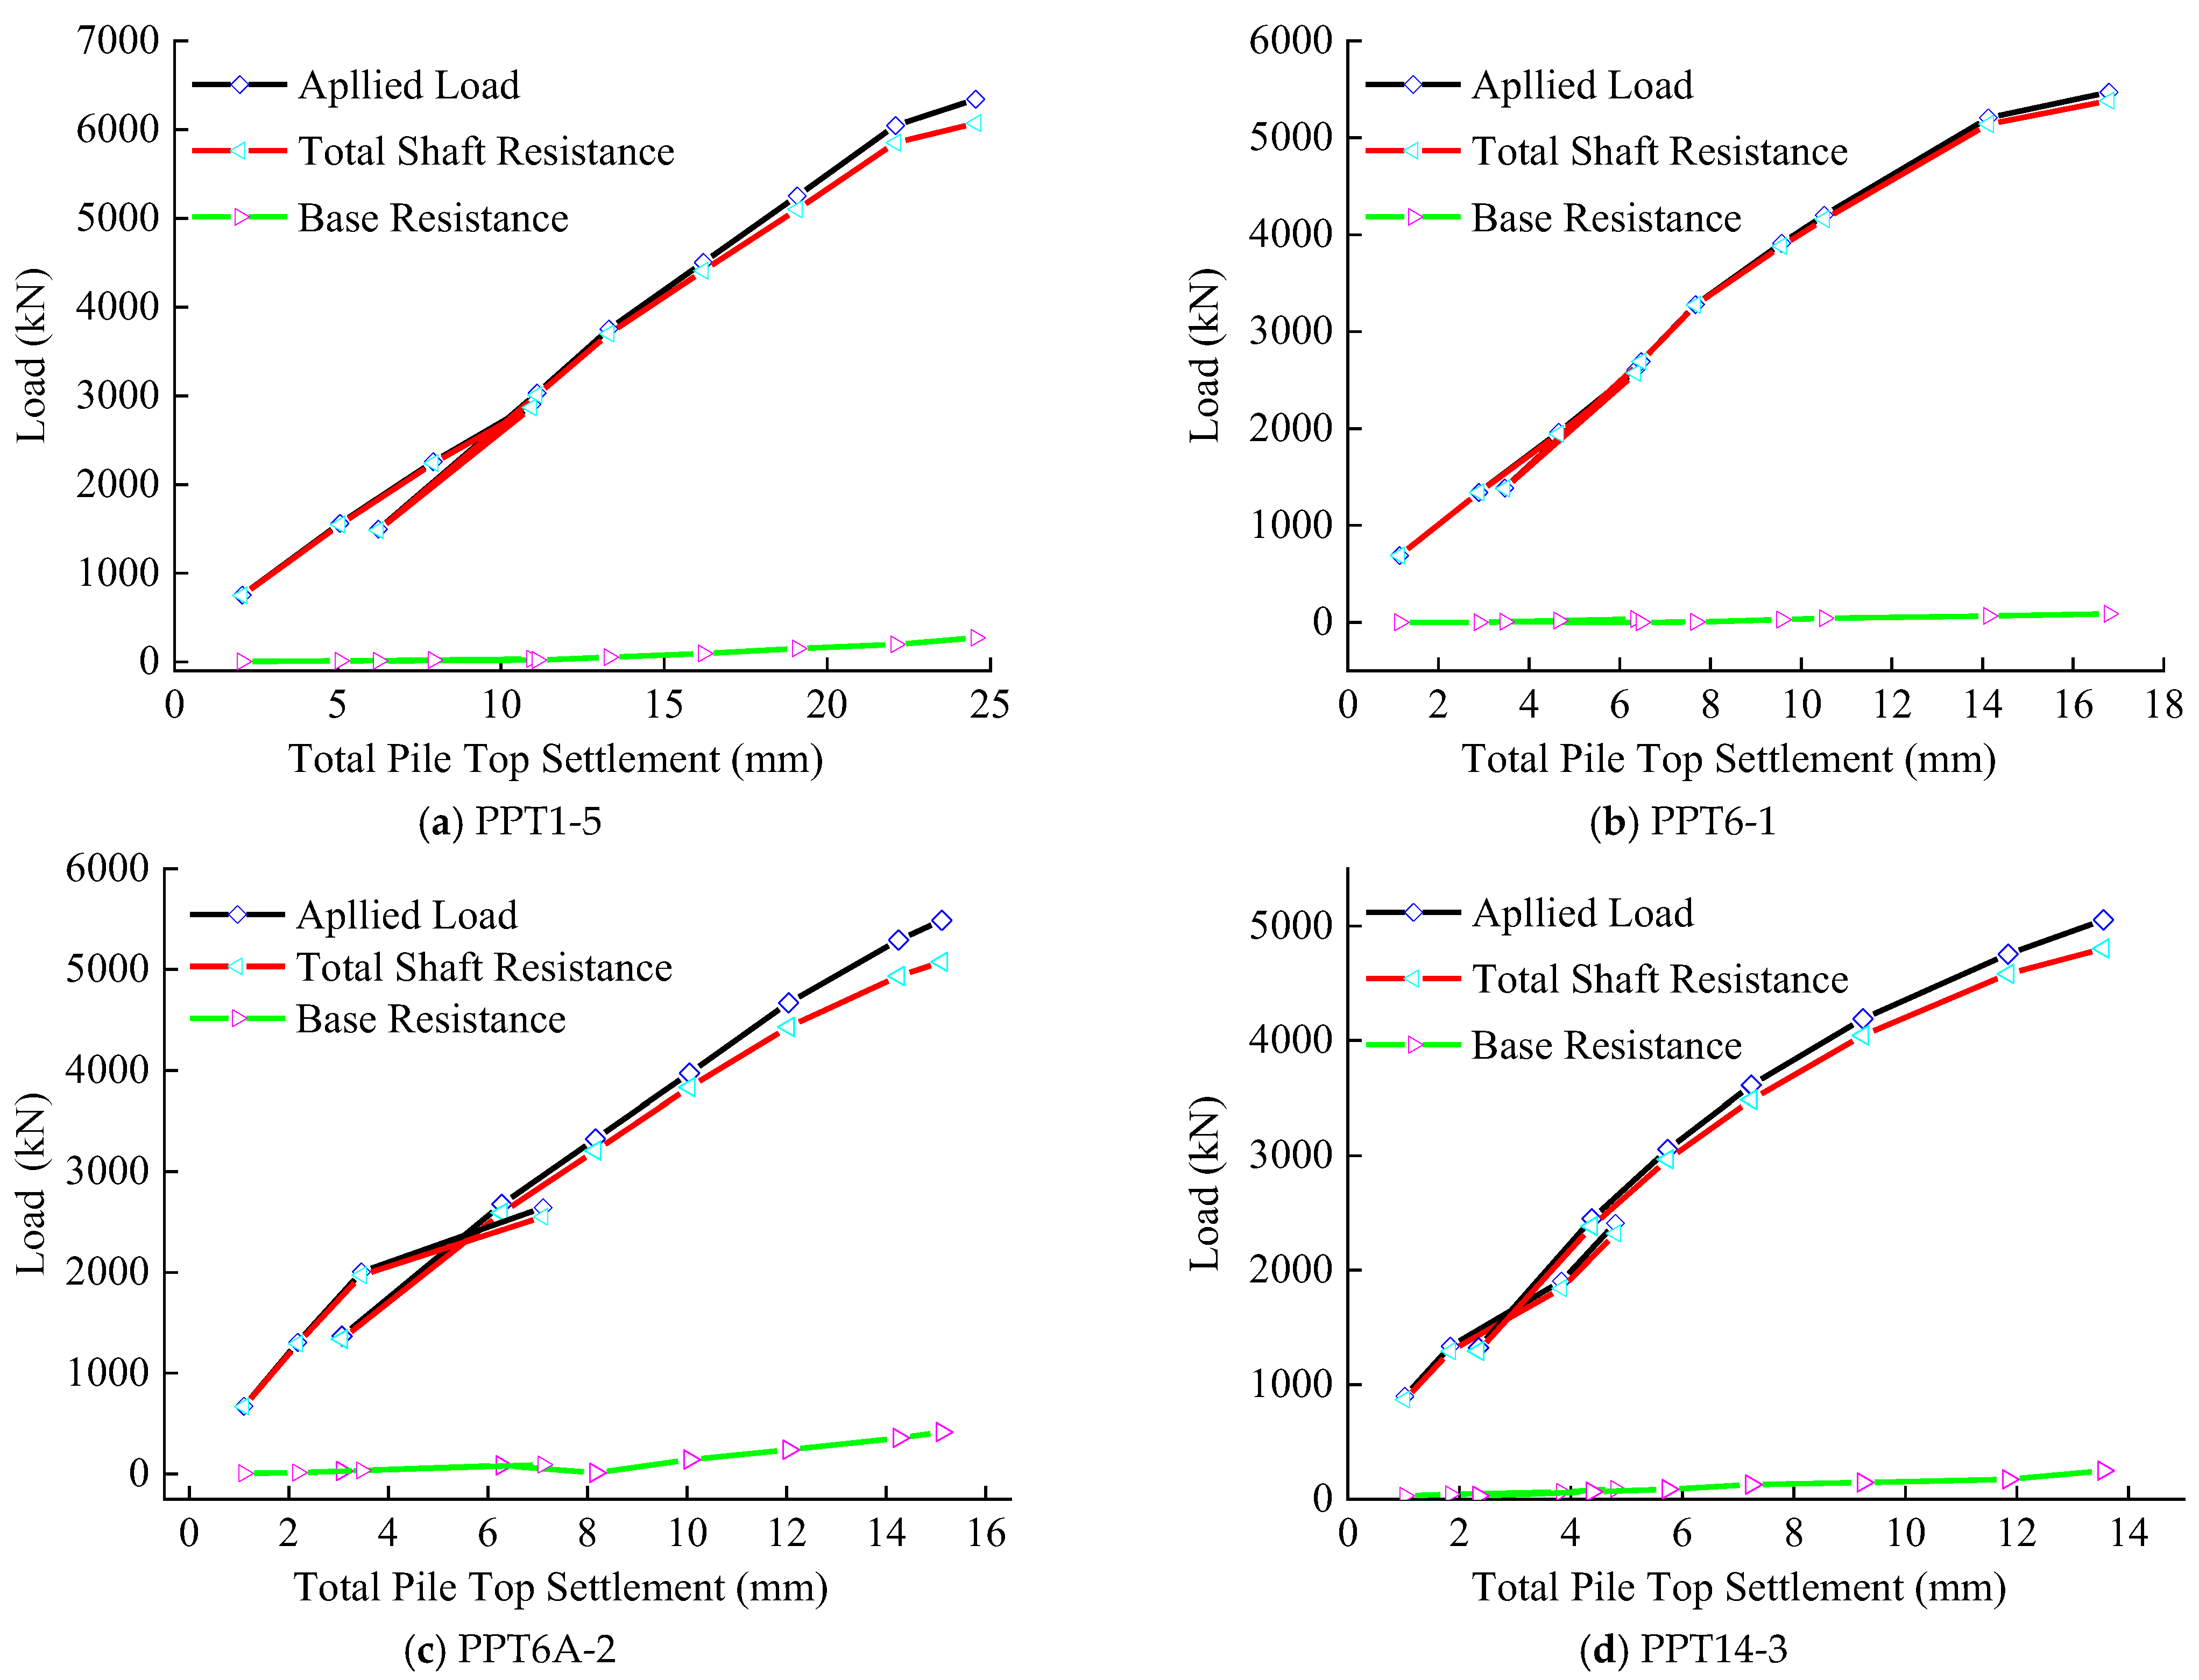
The relationship between the pile top load, total shaft friction resistance and base resistance and pile top settlement is shown in Figure 11. It is obvious that the total shaft friction resistance increases with the increase of the pile top settlement. However, the pile base resistance changes very little with the increasing pile top settlement. The changing trend of the total shaft friction resistance and the applied load is very similar. Their values are also very close. This indicates that the external load applied to the pile is mostly carried by the shaft friction resistance. The ratio of the total shaft friction resistance of the test piles PPT1-5, PPT6-1, PPT6A-2 and PPT14-3 to the external load at the initial loading is 99.47%, 100%, 99.26% and 96.88%, respectively. When the pile top reaches the maximum settlement, its proportion becomes 95.71%, 98.39%, 92.46% and 95.07%, respectively. At this time, the proportion of the pile bottom bearing the external load reaches the maximum, which is only 4.227%, 1.61%, 7.54% and 4.93%, respectively. The pile side resistance played a role before the pile tip resistance. The ultimate pile tip resistance will not come into play until the pile top displacement reaches a certain value. Therefore, for this test, the pile tip resistance has not been fully exerted due to the small displacement of the pile top, and the test load has not reached the ultimate bearing capacity of the test pile.
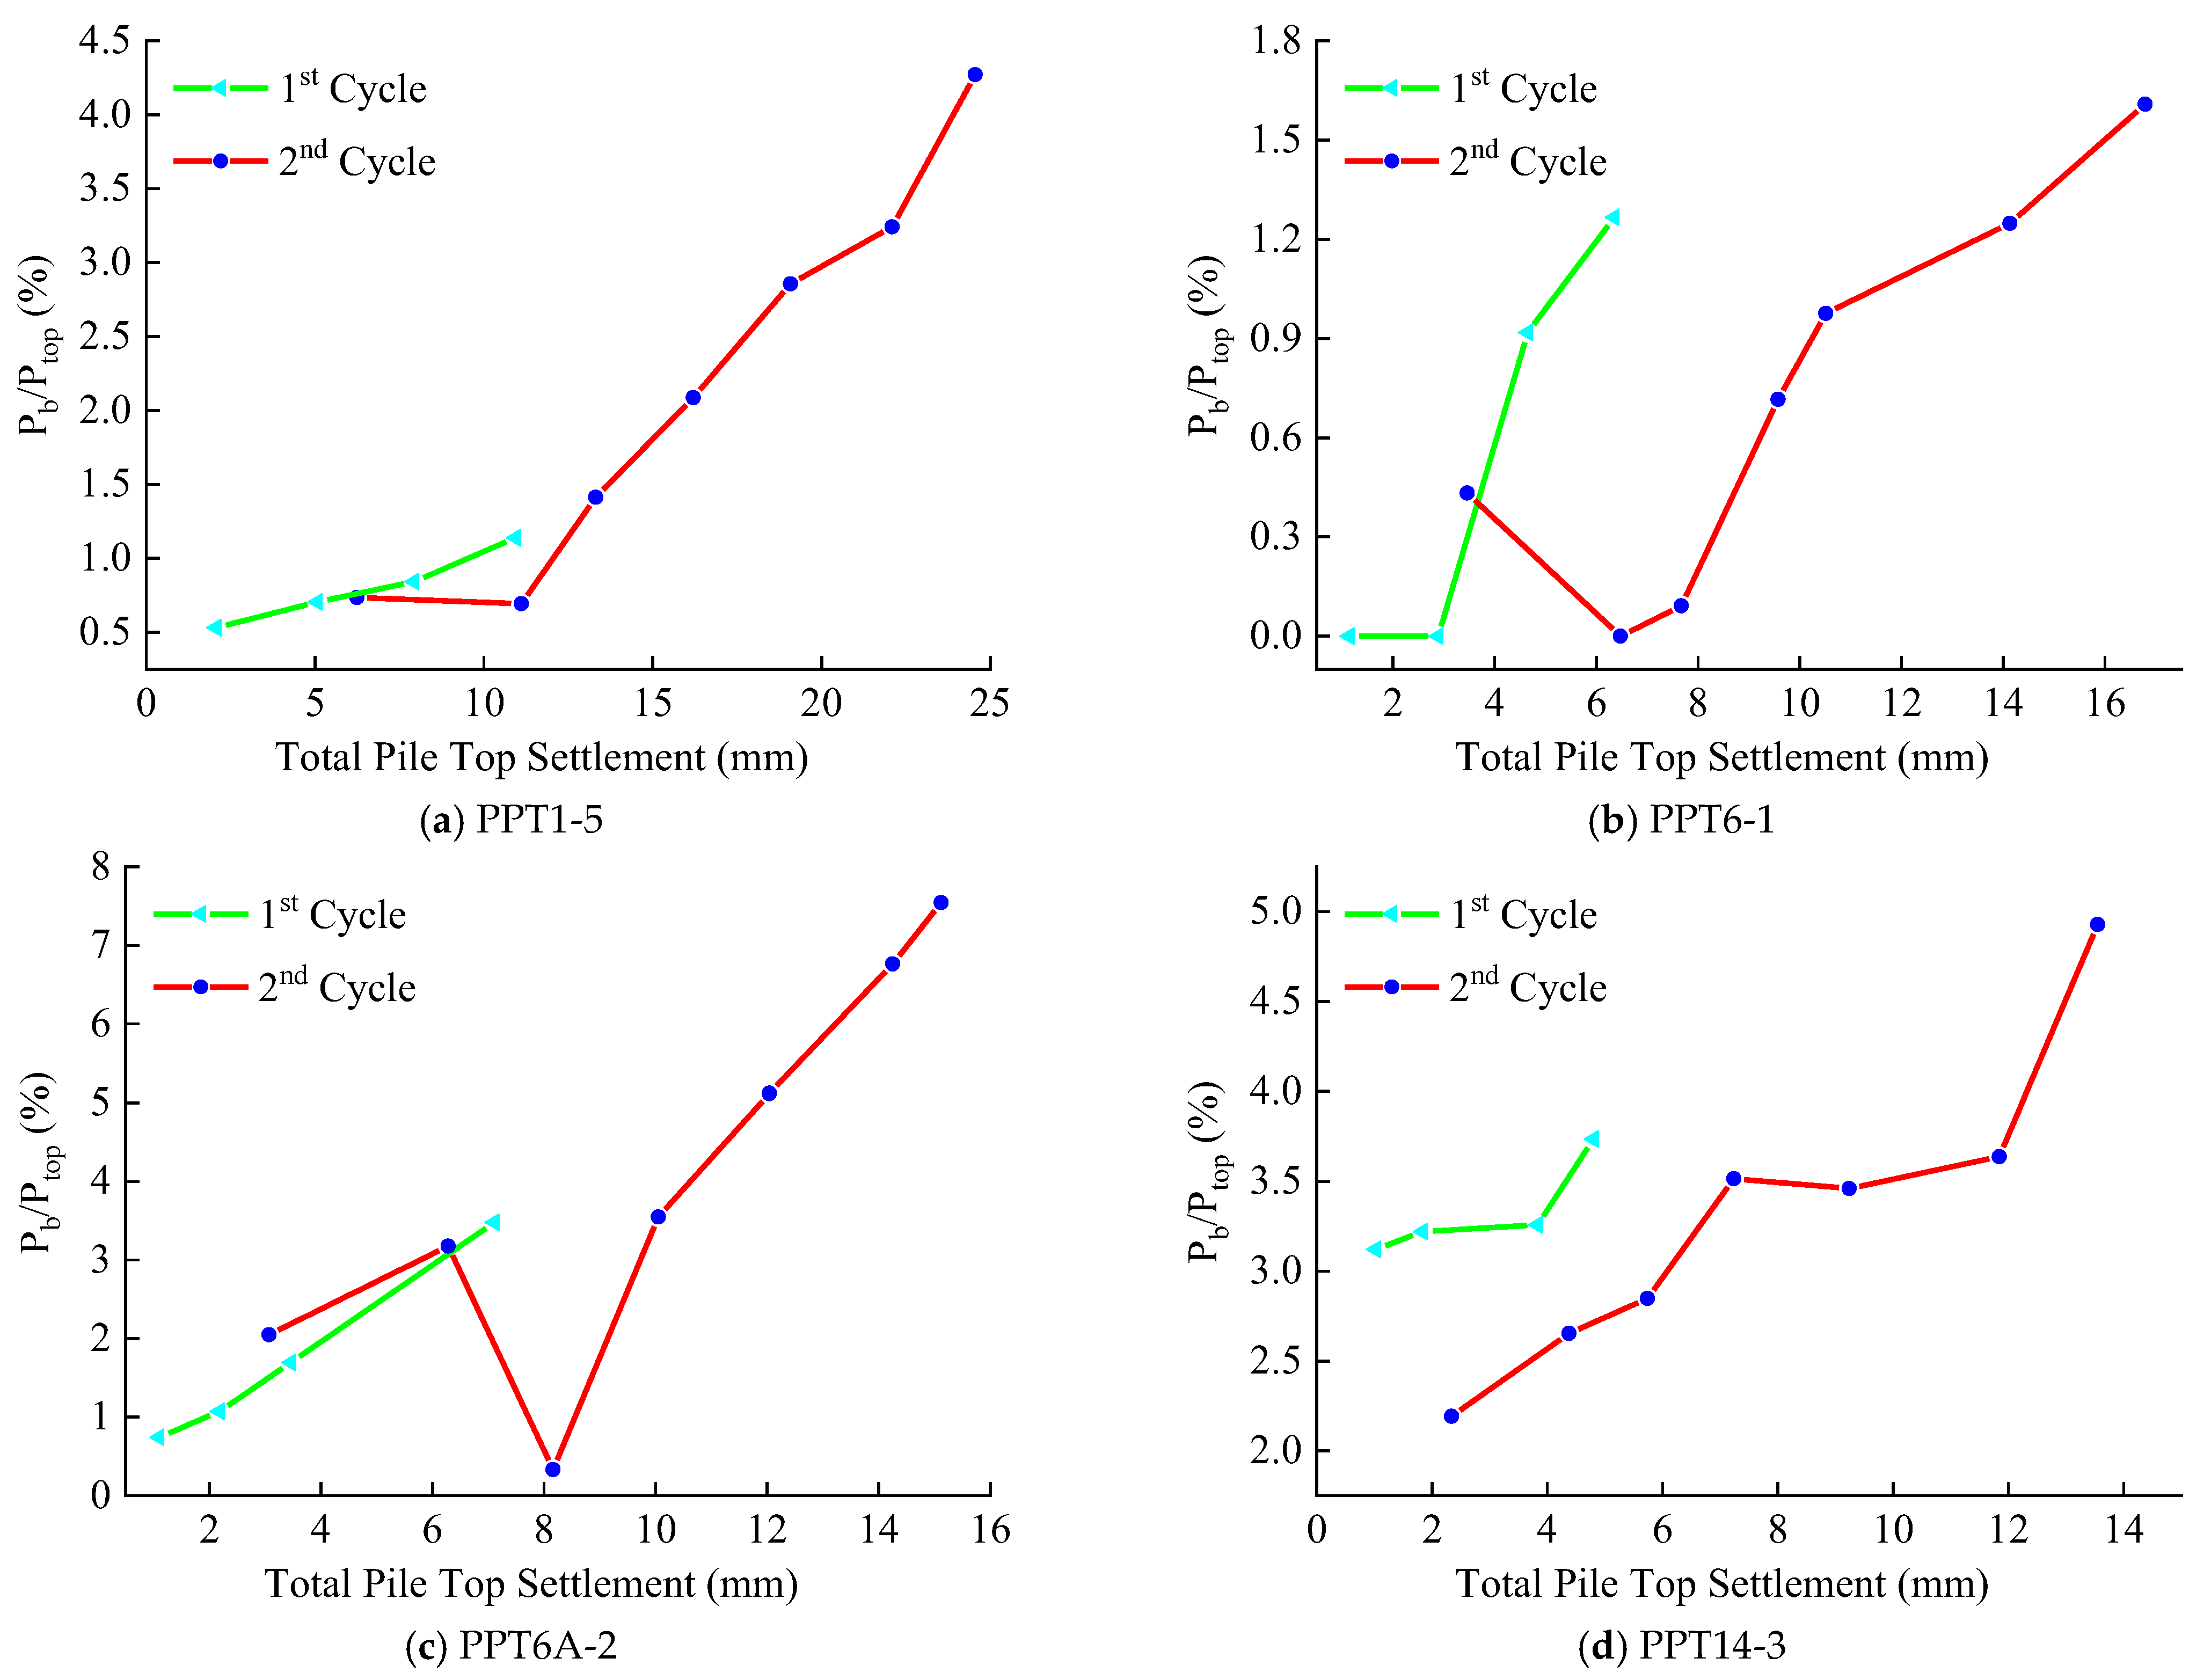
The relationship between the load ratio of the load at the base to the load at the top of the test piles and the settlement of the top of the piles is shown in Figure 12. As far as the general trend is concerned, the load ratio increases with the increase of the total settlement at the top of the pile. From the first cycle of loading, the load ratio of all test piles follows this pattern. The load ratios of the test piles PPT1-5, PPT6-1, PPT6A-2 and PPT14-3 increased from 0.53%, 0%, 0.74% and 3.12% to 1.14%, 1.27%, 3.48% and 3.73%, respectively. While in the second cyclic loading stage, the load ratio is not always increasing. For example, the load ratio of PPT6-1 first decreased, and then increased, while the load ratio of PPT6A-2 first increased, then decreased and increased again. However, from the beginning to the end of the second loading, the general trend of the load ratio is to increase with the increase of the pile top settlement. The load ratios of the test piles PPT1-5, PPT6-1, PPT6A-2 and PPT14-3 increased from 0.74%, 0.43%, 2.05% and 2.19% to 4.27%, 1.61%, 7.54% and 4.93%, respectively.
Due to the accumulation of pile compression, the displacement of the upper pile was always greater than that of the lower pile. Therefore, the upper friction always came into play before the lower friction, and the pile side friction remained unchanged after reaching the limit. With the increase of load, the side friction of the lower pile gradually mobilizes until the friction of the whole pile reaches the limit. The load that continued to increase was completely borne by the pile end. The long time of the two cycles of loading made the soil around the pile stress relaxation and the soil structure disturbed, forming loose soil layers and affecting the exertion of side resistance and end resistance. This caused the load ratio of some piles to fluctuate at the beginning of the second loading.

4. Conclusions

The pile foundation dynamic load and static load test is a well-known test to determine the bearing capacity, settlement deformation and integrity of pile foundation. However, such testing is very time-consuming and labor-intensive. In this paper, dynamic and static load field tests of the PHC pipe piles were carried out. The load-movement relationship, distribution of axial load along the piles and load transfer characteristics of the piles were discussed in detail in this paper. The results that can be drawn from this study can be summarized as:
  • The time-dependent behavior of the bearing capacity of prefabricated pipe piles was obvious. By the end of the dynamic test, the bearing capacity of each test pile increased by 27% to 66%. The final bearing capacity of the pile foundation can be roughly predicted by using the high strain initial driving results and restitution coefficient.
  • The bearing capacity of the PHC pipe piles increased rapidly within three days after driving, and then entered a slow growth stage. The increase of pile lateral resistance with time was much larger than that of end resistance.
  • The fitting Q-s curve of the high strain test was not in good agreement with the Q-s curve of the static load test. Taking the results of the static load method bearing capacity as the verification standard, the errors of the four piles’ high strain method bearing capacity are −2.4%, 7.2%, 3.6% and 24.4%, respectively.
  • Under 2.1 times the design load, the change range of the pile concrete modulus was from 37.5 GPa to 52 GPa, the change range of the pile side friction resistance was from 0 kPa to 97 kPa and the change range of the pile end to pile bottom load ratio was from 0% to 7.54%.
  • The relative displacement of the pile and soil required to give full play to the pile side friction resistance in clay soil was greater than 10 mm. The softening of pile-soil relative displacement was more significant in shallow buried cohesive soil. During the test, the shaft friction and end bearing of the lower part of the piles were not fully mobilized.

Author Contributions

Conceptualization, Y.X. and X.L.; methodology, Y.X. and X.L.; writing—review and editing, Y.X., X.L., J.Z. and L.S.; project administration and funding acquisition, X.L. All authors have read and agreed to the published version of the manuscript.

Funding

This research was funded by the Science and Technology Research and Development Project of China State Construction Engineering Group Co., Ltd., grant number CSCEC-2020-Z-21.

Institutional Review Board Statement

Not applicable.

Informed Consent Statement

Not applicable.

Data Availability Statement

The data used to support the findings of this study are included in the article.

Conflicts of Interest

The authors declare no conflict of interest.

References

  1. Wang, Y.H.; Sang, S.K.; Zhang, M.Y.; Bai, X.Y.; Su, L. Investigation on in-situ test of penetration characteristics of open and closed PHC pipe piles. Soils Found. 2021, 61, 960–973. [Google Scholar] [CrossRef]
  2. Nguyen, T.; Ly, K.D.; Nguyen-Thoi, T.; Nguyen, B.P.; Doan, N.P. Prediction of axial load bearing capacity of PHC nodular pile using Bayesian regularization artificial neural network. Soils Found. 2022, 62, 101203. [Google Scholar] [CrossRef]
  3. Zhang, G.J.; Liu, Z.Y.; Xiong, W.; Zhang, S.F.; Liu, S.Z.; Wang, Z.W.; Wang, Y.S. Dynamic Monitoring of the Standard Penetration of PHC Tubular Piles and Analysis of the Construction Effect Based on Monocular Visual Digital Photography. Appl. Sci. 2022, 12, 11468. [Google Scholar] [CrossRef]
  4. Kou, H.L.; Diao, W.Z.; Liu, T.; Yang, D.L.; Horpibulsuk, S. Field Performance of Open-Ended Prestressed High-Strength Concrete Pipe Piles Jacked into Clay. Sensors 2018, 18, 4216. [Google Scholar] [CrossRef] [Green Version]
  5. Wang, Y.H.; Sang, S.K.; Zhang, M.Y.; Liu, X.Y.; Yang, S.C. Field test of earth pressure at pile-soil interface by single pile penetration in silty soil and silty clay. Soil Dyn. Earthq. Eng. 2021, 145, 106666. [Google Scholar] [CrossRef]
  6. Hwang, T.; Cho, J.; Lee, Y.S. Calculation method for settlement of micropile installed in rock layers through field tests. Geomech. Eng. 2022, 31, 197–208. [Google Scholar] [CrossRef]
  7. Oktiovan, Y.P.; Otaki, T.; Obara, T.; Kono, S.; Asai, Y.; Kobayashi, K.; Watanabe, H.; Mukai, D. Shear performance evaluation of PHC piles under different levels of axial load ratio. Earthq. Eng. Struct. Dyn. 2022, 51, 2091–2112. [Google Scholar] [CrossRef]
  8. Wang, B.; Qi, L.; Yang, Y.D. Experimental Study on Bending Resistance of New Type Joint of Prestressed Concrete Pipe Pile. Symmetry 2022, 14, 1920. [Google Scholar] [CrossRef]
  9. Zhang, X.W.; Gong, S.F.; Xu, Q.B.; Gan, G.; Yu, X.D.; Lu, Y. Flexural performance of pretensioned spun concrete piles reinforced with steel strands. Mag. Concr. Res. 2022, 74, 757–777. [Google Scholar] [CrossRef]
  10. Cao, X.L.; Dai, G.L.; Gong, W.M.; Zhu, M.X.; Tang, J.A. Experimental study on the seismic behavior of new PHC piles. Arab. J. Geosci. 2020, 13, 1–8. [Google Scholar] [CrossRef]
  11. Huang, F.Y.; Shan, Y.L.; Javanmardi, A.; Luo, X.Y.; Chen, B.C. Seismic Performance of Various Piles Considering Soil-Pile Interaction under Lateral Cycle Loads for Integral Abutment Jointless Bridges (IAJBs). Appl. Sci. 2020, 10, 3406. [Google Scholar] [CrossRef]
  12. Yang, Z.J.; Li, G.C.; Nan, B. Study on Seismic Performance of Improved High-Strength Concrete Pipe-Pile Cap Connection. Adv. Mater. Sci. Eng. 2020, 2020, 4326208. [Google Scholar] [CrossRef]
  13. Kou, H.; Xing, D.; Zhang, M. Experimental study on influence of residual stress of jacked pile on bearing behavior of piles. Build. Struct. 2017, 47, 94–97. [Google Scholar]
  14. Noor, S.T.; Islam, M.S.; Mumtarin, M.; Chakraborty, N. Dynamic load test of full-scale pile for the construction and rehabilitation of bridges. In Proceedings of the 10th Asia Pacific Structural Engineering and Construction Conference, Langkawi, Malaysia, 13–15 November 2019; Volume 513. [Google Scholar] [CrossRef]
  15. Salgado, R.; Zhang, Y.; Abou-Jaoude, G.; Loukidis, D.; Bisht, V. Pile driving formulas based on pile wave equation analyses. Comput. Geotech. 2017, 81, 307–321. [Google Scholar] [CrossRef]
  16. Aghayarzadeh, M.; Khabbaz, H.; Fatahi, B.; Terzaghi, S. Interpretation of Dynamic Pile Load Testing for Open-Ended Tubular Piles Using Finite-Element Method. Int. J. Geomech. 2020, 20, 04019169. [Google Scholar] [CrossRef]
  17. Kou, H.L.; Chu, J.; Guo, W.; Zhang, M.Y. Field study of residual forces developed in pre-stressed high-strength concrete (PHC) pipe piles. Can. Geotech. J. 2016, 53, 696–707. [Google Scholar] [CrossRef]
  18. Zhou, J.J.; Yu, J.L.; Gong, X.N.; Zhang, R.H.; Yan, T.L. Influence of soil reinforcement on the uplift bearing capacity of a pre-stressed high-strength concrete pile embedded in clayey soil. Soils Found. 2019, 59, 2367–2375. [Google Scholar] [CrossRef]
  19. Kim, S.; Whang, S.W.; Kim, S. Pile Foundation Design Through the Increased Bearing Capacity of Extended End Pile. J. Asian Archit. Build. Eng. 2017, 16, 395–402. [Google Scholar] [CrossRef] [Green Version]
  20. Huynh, V.H.; Nguyen, T.; Nguyen, D.P.; Nguyen, T.S.; Huynh, T.M.D.; Nguyen, T.C. A novel direct SPT method to accurately estimate ultimate axial bearing capacity of bored PHC nodular piles with 81 case studies in Vietnam. Soils Found. 2022, 62, 101163. [Google Scholar] [CrossRef]
  21. Li, X.S.; Zhang, J.Q.; Xu, H.; Shi, Z.W.; Gao, Q.F. Static Load Test and Numerical Analysis of Influencing Factors of the Ultimate Bearing Capacity of PHC Pipe Piles in Multilayer Soil. Sustainability 2021, 13, 13166. [Google Scholar] [CrossRef]
  22. Choi, Y.; Kim, D.C.; Kim, T.H. Field Evaluation of the Vertical Bearing Capacity of a Screw Pretensioned Spun High-Strength Concrete Pile. Mar. Georesources Geotechnol. 2016, 34, 474–485. [Google Scholar] [CrossRef]
  23. Lehane, B.M.; Li, L.; Bittar, E.J. Cone penetration test-based load-transfer formulations for driven piles in sand. Geotech. Lett. 2020, 10, 568–574. [Google Scholar] [CrossRef]
  24. Li, L.; Li, J.-P.; Sun, D.-A.; Fang, R. Time-dependence of bearing capacity of jacked piles in natural saturated clay. Rock Soil Mech. 2017, 38, 2515–2522. [Google Scholar] [CrossRef]
  25. Yang, Y.; Kong, M.; Cui, X. Study on the Time of Negative Skin Friction of Single Pile in Collapsible Loess. Chin. Q. Mech. 2019, 40, 384–391. [Google Scholar]
  26. Ye, X.; Wu, J.T.; Li, G.W. Time-dependent field performance of PHC pile-cap-beam-supported embankment over soft marine clay. Transp. Geotech. 2021, 26, 100435. [Google Scholar] [CrossRef]
  27. Sakr, M. Comparison between high strain dynamic and static load tests of helical piles in cohesive soils. Soil Dyn. Earthq. Eng. 2013, 54, 20–30. [Google Scholar] [CrossRef]
  28. Dudek, N. Pile group settlement analysis on the basis of Static Load Test. In Proceedings of the 22nd International Scientific Conference on Construction—The Formation of Living Environment (FORM), Tashkent Inst Irrigat & Agr Mechanizat Engineers, Tashkent, Uzbekistan, 18–21 April 2019; Volume 97. [Google Scholar] [CrossRef]
  29. Zhang, X.; Xu, G. Finite element analysis of mechanical behavior of PHC pipe piles with mixed reinforcement in pressurized situations. Build. Sci. 2018, 34, 54–60. [Google Scholar]
  30. Hu, X.; Wang, X.; Lou, X.; Chen, M. Experimental study on time effect of large diameter steel pipe piles under complex geological conditions at sea. Ocean. Eng. 2019, 37, 93–100. [Google Scholar]
  31. Wei, Y.J.; Wang, D.L.; Li, J.W.; Jie, Y.X.; Ke, Z.D.; Li, J.U.; Wong, T.M. Evaluation of Ultimate Bearing Capacity of Pre-Stressed High-Strength Concrete Pipe Pile Embedded in Saturated Sandy Soil Based on In-Situ Test. Appl. Sci. 2020, 10, 6269. [Google Scholar] [CrossRef]
  32. Wang, Y.; Liu, X.; Zhang, M.; Yang, S.; Sang, S. Field Test of Excess Pore Water Pressure at Pile-Soil Interface Caused by PHC Pipe Pile Penetration Based on Silicon Piezoresistive Sensor. Sensors 2020, 20, 2829. [Google Scholar] [CrossRef]
  33. Ren, J.W.; Xu, Q.B.; Chen, G.; Liu, C.B.; Gong, S.F.; Lu, Y. Flexural performance of pretensioned centrifugal spun concrete piles with combined steel strands and reinforcing bars. Structures 2021, 34, 4467–4485. [Google Scholar] [CrossRef]
  34. Liu, C.; Tang, M.; Hu, H.; Chen, H.; Liu, C.; Hou, Z. Comparative study on vertical compressive bearing behavior of PHC pipe piles based on high strain method and static load method. Build. Struct. 2022, 52, 136–140. [Google Scholar]
  35. Lam, C. Discussion of “Comprehensive Load Test on Prestressed Concrete Piles in Alluvial Clays and Marl in Savannah, Georgia” by Yong Tan and Guoming Lin. J. Perform. Constr. Facil. 2015, 29, 178–190. [Google Scholar] [CrossRef]
  36. Zhao, C.; Lu, J.; Sun, Q.; Zhu, T.; Li, S. Experimental Study of Load Transmission Property of Large-Diameter Bored Cast-In-Situ Deep and Long Pile in Different Soil Layers. Chin. J. Rock Mech. Eng. 2009, 28, 1020–1026. [Google Scholar]
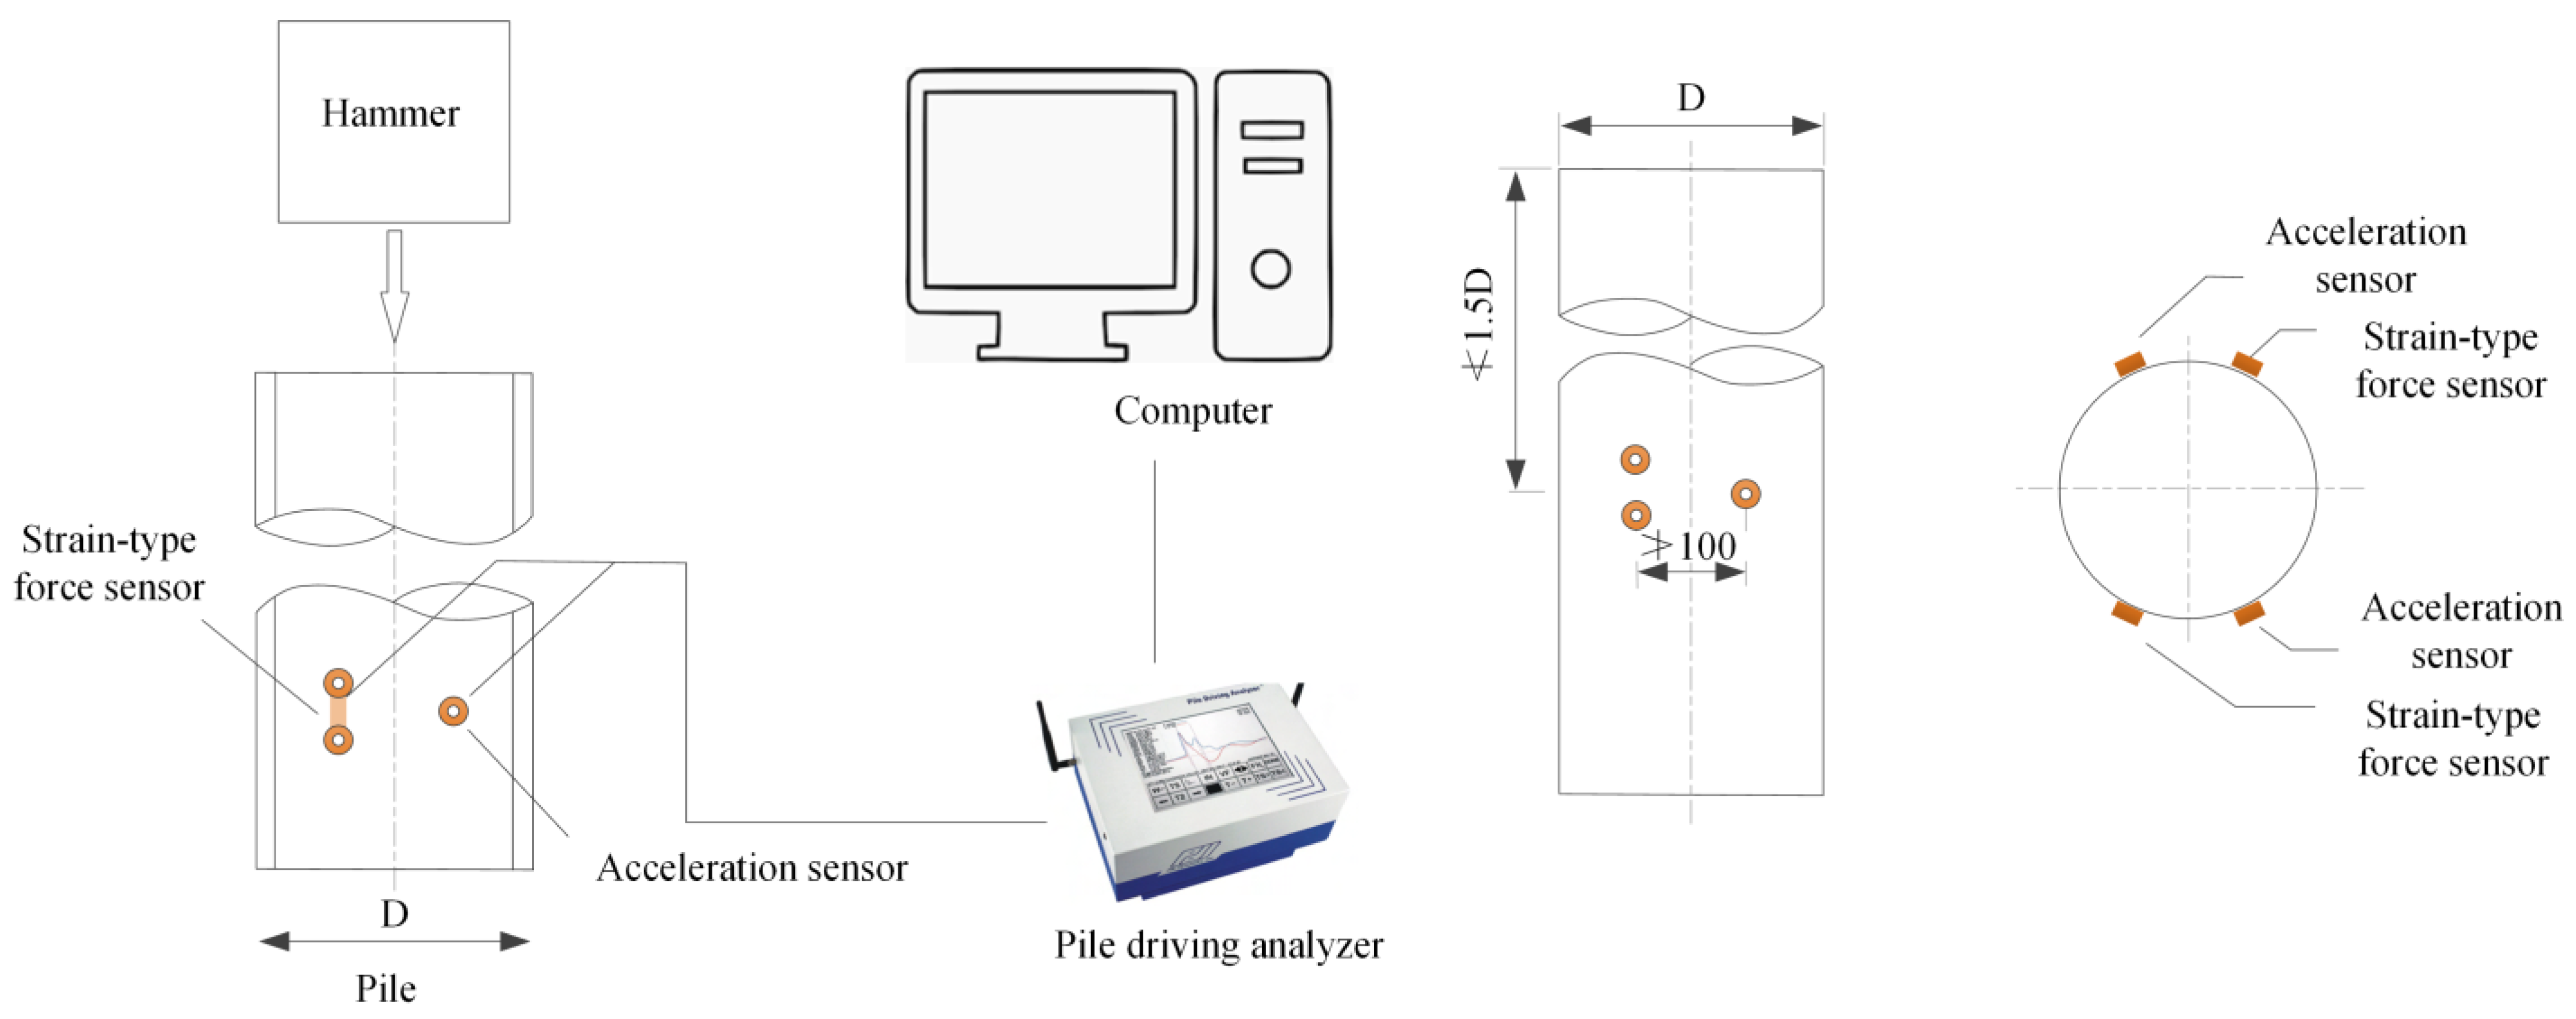
Figure 1. Connection diagram of high strain dynamic testing instruments and equipment.
Sustainability 15 05161 g001
Figure 2. Soil properties at the test pile.
Sustainability 15 05161 g002
Figure 3. Instrumentation levels and pile driving record for static load test pile PPT1-5.
Sustainability 15 05161 g003
Figure 4. Bearing capacity of test piles with different rest times.
Sustainability 15 05161 g004
Figure 5. Dynamic and static load test Q-s curves.
Sustainability 15 05161 g005
Figure 6. PPT1-5 Q-s curves.
Sustainability 15 05161 g006
Figure 7. Plot of pile top loads vs. pile top settlement for test cycles of maintained load testing.
Sustainability 15 05161 g007
Figure 8. Plot of concrete pile modulus versus axial strain.
Sustainability 15 05161 g008aSustainability 15 05161 g008b
Figure 9. Load distribution curves for 2nd loading pile of test piles.
Sustainability 15 05161 g009aSustainability 15 05161 g009b
Figure 10. Load transfer characteristics during the loading phase.
Sustainability 15 05161 g010
Figure 11. Plot of the relationship between pile top load, total lateral resistance and end resistance and pile top settlement.
Sustainability 15 05161 g011
Figure 12. Plot of the relationship between pile-end to pile-top load ratio and pile-top settlement.
Sustainability 15 05161 g012
Table 2. The test parameters of the test piles.
Pile NumberDiameter (mm)Pile Length (m)Length Under Sensor (m)Mud Entry Depth (m)Hammer Weight (tons)Drop Height (m)
PPT1-59007875.569.5200.7
PPT6-19007872.770.6201.2
PPT6A-2900656360.15201.2
PPT14-3900373534201.0
Table 3. The test piles’ bearing capacity and their recovery coefficient.
Pile NumberRest Time (d)Bearing Capacity (kN)Lateral Resistance (kN)End Resistance (kN)K of Bearing CapacityK of Lateral ResistanceK of End Resistance
PPT1-504725.63429.81295.81.001.001.00
36030.34628.91401.41.281.351.08
296179.24701.01478.21.311.371.14
PPT6-106689.62353.24336.41.001.001.00
179540.45104.34436.11.432.171.02
PPT6A-206788.34199.72588.61.001.001.00
178084.65410.62674.01.191.291.03
278638.95905.32733.61.271.411.06
PPT14-304760.91347.43413.51.001.001.00
217936.94397.13539.81.673.261.04
Table 4. Static load test results.
Pile NumberMaximum Loading (kN)High Strain Load (kN)Maximum Settlement (mm)Residual Settlement (mm)
PPT1-56344618724.554.06
PPT6-15471586716.423.3
PPT6A-25489568915.121.33
PPT14-35053628613.553.18
Disclaimer/Publisher’s Note: The statements, opinions and data contained in all publications are solely those of the individual author(s) and contributor(s) and not of MDPI and/or the editor(s). MDPI and/or the editor(s) disclaim responsibility for any injury to people or property resulting from any ideas, methods, instructions or products referred to in the content.