
An Appraisal on China’s Feed-In Tariff Policies for PV and Wind Power: Implementation Effects and Optimization

Abstract
1. Introduction
1.1. Research Background
1.2. Literature Review
1.2.1. Evaluative Dimensions
1.2.2. Research Methods
1.3. Research Gap and Contributions
2. Materials and Methods
2.1. The Influencing Factors
2.2. Assumptions
2.3. Assessment Elements and the Structure of the Appraisal Models
2.4. Specification of the Appraisal Models
2.4.1. Evaluation Model of Implementation Effects
Net Economic Benefits
Net Environmental Benefits
Net Comprehensive Benefits
2.4.2. Optimization Model for Policy Design
2.5. Data Description of the Appraisal Models
2.5.1. Evaluation Model of Implementation Effects
Net Economic Benefits
Net Environmental Benefits
2.5.2. Optimization Model for Policy Design
3. Results and Discussion
3.1. Evaluation Model of Implementation Effects
3.2. Optimization Model for Policy Design
4. Suggestions
Supplementary Materials
Author Contributions
Funding
Institutional Review Board Statement
Informed Consent Statement
Data Availability Statement
Acknowledgments
Conflicts of Interest
References
- NDRC. Notice on Improving the Feed-In Tariff Policy for Wind Power, China. 2019. Available online: https://www.ndrc.gov.cn/xxgk/zcfb/tz/201905/t20190524_962453.html?code=&state=123 (accessed on 1 February 2023).
- NDRC. Notice on Issues Related to Improving the Feed-In Tariff Mechanism for Photovoltaic Power Generation, China. 2019. Available online: https://www.ndrc.gov.cn/xxgk/zcfb/tz/201904/t20190430_962433.html?code=&state=123 (accessed on 1 February 2023).
- NDRC. Notice on Matters Related to China’s Feed-in Tariff Policy for New Energy in 2021. 2021. Available online: https://www.ndrc.gov.cn/xwdt/tzgg/202106/t20210611_1283089.html?code=&state=123 (accessed on 1 February 2023).
- Wei, Y.; Zou, Q.-P.; Lin, X. Evolution of price policy for offshore wind energy in China: Trilemma of capacity, price and subsidy. Renew. Sustain. Energy Rev. 2021, 136, 110366. [Google Scholar] [CrossRef]
- Liu, J.; Lu, Y. Research on the evaluation of China’s photovoltaic policy driving ability under the background of carbon neutrality. Energy 2022, 250, 123809. [Google Scholar] [CrossRef]
- Chen, Z.; Cheung, K.C.K.; Qi, X. Subsidy policies and operational strategies for multiple competing photovoltaic supply chains. Flex. Serv. Manuf. J. 2021, 33, 914–955. [Google Scholar] [CrossRef]
- Huang, J.; Xue, F.; Song, X. Simulation analysis on policy interaction effects between emission trading and renewable energy subsidy. J. Mod. Power Syst. Clean Energy 2013, 1, 195–201. [Google Scholar] [CrossRef]
- Bouich, A. Study and Characterization of Hybrid Perovskites and Copper-Indium-Gallium Selenide thin films for Tandem Solar Cells. Ph.D. Thesis, Universitat Politècnica de València, València, Spain, 2020. [Google Scholar] [CrossRef]
- Yao, X.; Liu, Y.; Qu, S. When will wind energy achieve grid parity in China?—Connecting technological learning and climate finance. Appl. Energy 2015, 160, 697–704. [Google Scholar] [CrossRef]
- Zhang, X.; Liu, W.; Zhang, H. Can China Realize the Grid Parity Target of Centralized Photovoltaic Power by 2020? Emerg. Mark. Financ. Trade 2021, 57, 740–756. [Google Scholar] [CrossRef]
- Ouyang, X.; Lin, B. Levelized cost of electricity (LCOE) of renewable energies and required subsidies in China. Energy Policy 2014, 70, 64–73. [Google Scholar] [CrossRef]
- Lin, B.; Li, J. Quantitative evaluation of renewable energy policies in China based on stochastic dynamic recursion. J. Econ. Res. 2014, 49, 89–103. [Google Scholar]
- Zhang, M.; Zhang, C.; Liu, L.; Zhou, D. Is it time to launch grid parity in the Chinese solar photovoltaic industry? Evidence from 335 cities. Energy Policy 2020, 147, 111733. [Google Scholar] [CrossRef]
- Karneyeva, Y.; Wüstenhagen, R. Solar feed-in tariffs in a post-grid parity world: The role of risk, investor diversity and business models. Energy Policy 2017, 106, 445–456. [Google Scholar] [CrossRef]
- Schuman, S.; Lin, A. China’s Renewable Energy Law and its impact on renewable power in China: Progress, challenges and recommendations for improving implementation. Energy Policy 2012, 51, 89–109. [Google Scholar] [CrossRef]
- Sahu, B.K. Wind energy developments and policies in China: A short review. Renew. Sustain. Energy Rev. 2018, 81 Pt 1, 1393–1405. [Google Scholar] [CrossRef]
- Maroušek, J.; Hašková, S.; Zeman, R.; Váchal, J.; Vaníčková, R. Assessing the implications of EU subsidy policy on renewable energy in Czech Republic. Clean Technol Env. Policy 2015, 17, 549–554. [Google Scholar] [CrossRef]
- Chang, K. Economic effects of renewable energy subsidy based on the perspective of cost and benefit. Ind. Technol. Econ. 2015, 34, 98–105. [Google Scholar]
- Biondi, T.; Moretto, M. Solar Grid Parity dynamics in Italy: A real option approach. Energy 2015, 80, 293–302. [Google Scholar] [CrossRef]
- Li, Q.; Chen, M. Real Option Theoretical and Empirical Analysis on Feed-in-tariff (FIT) Policy of Wind Electricity in China. Chin. J. Manag. Sci. 2016, 24, 65–73. [Google Scholar]
- Tu, Q.; Mo, J.; Fan, Y. The evolution and evaluation of China’s renewable energy policies and their implications for the future. China Popul. Resour. Environ. 2020, 30, 29–36. [Google Scholar]
- Tu, Q.; Mo, J.; Betz, R.; Cui, L.; Fan, Y.; Liu, Y. Achieving grid parity of solar PV power in China- The role of Tradable Green Certificate. Energy Policy 2020, 144, 111681. [Google Scholar] [CrossRef]
- Zhao, H.-R.; Guo, S.; Fu, L.-W. Review on the costs and benefits of renewable energy power subsidy in China. Renew. Sustain. Energy Rev. 2014, 37, 538–549. [Google Scholar] [CrossRef]
- Zhao, X.; Mahendru, M.; Ma, X.; Rao, A.; Shang, Y. Impacts of environmental regulations on green economic growth in China: New guidelines regarding renewable energy and energy efficiency. Renew. Energy 2022, 187, 728–742. [Google Scholar] [CrossRef]
- Zhao, X.-G.; Li, P.-L.; Zhou, Y. Which policy can promote renewable energy to achieve grid parity? Feed-in tariff vs. renewable portfolio standards. Renew. Energy 2020, 162, 322–333. [Google Scholar] [CrossRef]
- CPIA. China PV Industry Development Roadmap (2021 Version), China. 2022. Available online: http://www.chinapv.org.cn/road_map/1016.html (accessed on 1 February 2023).
- GWEC. China’s Current Power Crisis Could Represent an Opportunity for the Wind Industry. 2021. Available online: https://gwec.net/wp-content/uploads/2021/11/Analysis_Chinas-current-power-crisis-could-represent-an-opportunity-for-the-wind-industry.pdf (accessed on 1 February 2023).
- Weiss, M.; Junginger, M.; Patel, M.K.; Blok, K. A review of experience curve analyses for energy demand technologies. Technol. Forecast. Soc. Chang. 2010, 77, 411–428. [Google Scholar] [CrossRef]
- BCG. Anchoring Carbon Neutrality: The Electric-Power Industry Sets Sail for Emissions Reductions, China. 2021. Available online: https://pdf.bcgpublications.cn/pdfs/141.pdf (accessed on 1 February 2023).
- Choi, D.G.; Park, S.Y.; Park, N.-B.; Hong, J.C. Is the concept of ‘grid parity’ defined appropriately to evaluate the cost-competitiveness of renewable energy technologies? Energy Policy 2015, 86, 718–728. [Google Scholar] [CrossRef]
- Lin, B. High-quality growth of the Chinese economy in the process of carbon neutrality. J. Econ. Res. 2022, 57, 56–71. [Google Scholar]
- Zhang, A.H.; Sirin, S.M.; Fan, C.; Bu, M. An analysis of the factors driving utility-scale solar PV investments in China: How effective was the feed-in tariff policy? Energy Policy 2022, 167, 113044. [Google Scholar] [CrossRef]
- Wu, J.; Zhang, B. Is local grid parity affordable in China? Discussion on the regional wind power potential and investment returns under policy uncertainty. Energy Policy 2022, 170, 113254. [Google Scholar] [CrossRef]
- GWEC. Wind Power a Cornstone of the Global Economic Recovery: “Re-Building Better” for the Future, Brussels. 2020. Available online: https://gwec.net/wp-content/uploads/2020/06/Green-Recovery-Statement-EN-2.pdf (accessed on 1 February 2023).
- IEA. Special Report on Solar PV Global Supply Chains. 2022. Available online: https://iea.blob.core.windows.net/assets/d2ee601d-6b1a-4cd2-a0e8-db02dc64332c/SpecialReportonSolarPVGlobalSupplyChains.pdf (accessed on 1 February 2023).
- Zhang, X.; Guo, X.; Zhang, X. Bidding modes for renewable energy considering electricity-carbon integrated market mechanism based on multi-agent hybrid game. Energy 2023, 263 Pt A, 125616. [Google Scholar] [CrossRef]
- Li, L.; Ye, F.; Li, Y.; Chang, C.-T. How will the Chinese Certified Emission Reduction scheme save cost for the national carbon trading system? J. Environ. Manag. 2019, 244, 99–109. [Google Scholar] [CrossRef] [PubMed]


| Influencing Factors | Screening Basis of Influencing Factors | Influencing Range |
|---|---|---|
| Feed-in tariffs for PV and wind power | As core contents of FIT policies, the level of feed-in tariffs and the price formation mechanism will directly affect the investment and operation activities of PV and wind power enterprises [2,3], thus affecting the economic benefits generated by FIT policies. | Economic contribution generated by FIT policies |
| The price formation mechanism of feed-in tariffs | ||
| The generation cost of PV and wind power | As the basis for the update and adjustment of FIT policies, the declining trend in the generation cost of PV and wind power provides the space for the reduction in feed-in tariffs and the opportunity for the price formation mechanism to carry out the de-subsidized reform. | |
| The generation cost of thermal power | Thermal power is the main guaranteed power supplied in China at present. The difference between the generation cost of thermal power and the generation cost of PV and wind power will affect the design of the price formation mechanism of FIT policies and the verification of feed-in tariffs, thus indirectly affecting the benefits generated by FIT policies in economic terms. | |
| R&D investment in PV and wind power generation enterprises | The smooth conversion of R&D investment will help PV and wind power enterprises reduce the generation cost [21], thereby creating room for reduction in feed-in tariffs and influencing the economic contribution of FIT policies. | |
| Power generating demand for PV and wind power | Generating demand for PV and wind power will influence power producers’ investment decisions, generation costs, carbon emission reduction costs, as well as the level and price formation mechanism of the feed-in tariff, and other factors that affect the economic and environmental contribution of FIT policies. | Economic and environmental contribution generated by FIT policies |
| Costs of carbon reduction in the power sector | The development of PV and wind power generation technologies will help reduce the overall expense of carbon emission reduction in the power industry and increase the benefits of FIT policies in terms of environmental protection. | Environmental contribution generated by FIT policies |
| Subsidies for PV and wind power generation | Subsidies for PV and wind power generation are important carriers to reflect the environmental value of PV and wind power [22]. As core elements of the FIT policy, the source and intensity of subsidies for PV and wind power will influence the environmental contribution of the FIT policy [23,24]. |
| Assumptions | Basis | |
|---|---|---|
| Target policies | The guiding price policy and the parity policy. | |
| Implementation periods | Guiding price policy (July 2019–July 2021) | The Notice on Improving the Feed-in tariff Policy for Wind Power and the Notice on Issues Related to Improving the Feed-in Tariff Mechanism for Photovoltaic Power Generation both have been implemented since 1 July 2019. |
| Parity policy (August 2021–August 2023) | The Notice on Matters Related to China’s Feed-in Tariff Policy For New Energy in 2021 has been implemented since 1 August 2021, and a follow-up document on the continued implementation of the parity policy was issued in April 2022. Considering the guiding price policy and the parity policy are both for transitional adjustments, we assume that the implementation period of the parity policy will last 2 years, the same as the guiding price policy. | |
| The object of policy implementation | Assume centralized PV and onshore wind power projects as the object of policy implementation. | |
| Pricing formation mechanism | To emphatically examine the macro-regulatory effects of the FIT policies, we assume the government-regulated FIT as the only price formation mechanism in the following discussion. | |
| Factors Influencing the Implementation Effects of FIT Policies for PV and Wind Power | Assessment Elements of the Appraisal Models | |
|---|---|---|
| Feed-in tariffs for PV and wind power | Net Economic Benefits | Net Comprehensive Benefits = Net Economic Benefits + Net Environmental Benefits |
| The price formation mechanism of feed-in tariffs | ||
| The generation cost of PV and wind power | ||
| The generation cost of thermal power | ||
| R&D investment in PV and wind power generation enterprises | ||
| Power-generating demand for PV and wind power | Net Economic Benefits and Net Environmental Benefits | |
| Costs of carbon reduction in the power sector | Net Environmental Benefits | |
| Subsidies for PV and wind power generation | ||
| The Structure and the Critical Objectives of Appraisal Models | Evaluation Objectives | |
|---|---|---|
| Evaluation Model of Implementation Effects: to evaluate whether the implementation effect of the current policy has been improved compared with the previous policy | 1 | Identify which FIT policy is more conducive to promoting the development of PV and wind power [25], according to the results of Net Comprehensive Benefits. |
| 2 | Compared with traditional thermal power generation, test whether PV and wind power projects have greater economic competitiveness under the support of the last two-phase FIT policies. | |
| 3 | Analyze the impact of the last two-phase FIT policies on the R&D activities of PV and wind power generation enterprises. | |
| 4 | Assess the substitution effect of the market compensation mechanisms on the government subsidy during the last two-phase FIT policies. | |
| 5 | Assess the curbing effect of carbon dioxide emissions brought by the last two-phase FIT policies. | |
| Optimization Model for Policy Design: to evaluate whether the existing policy is suitable for continued implementation in the future and put forward ideas for optimizing policy design. | 1 | By calculating the optimal feed-in tariffs under a multi-scenario and multi-objective framework, test whether the existing feed-in tariff has reached the level of maximizing implementation effects, and estimate the room for the price reduction in the future. |
| 2 | Analyze whether the existing pricing mechanism is suitable for long-term implementation and put forward corresponding suggestions for policy optimization. | |
| Variables | Meanings |
|---|---|
| Net economic benefits of FIT policies for PV and wind power at No. period: after times of R&D investment and times escalation in the generation cost of thermal power (billion CNY) | |
| Weighted average feed-in tariff of PV and wind power at No. period (CNY/kWh, value-added tax included) | |
| Weighted average costs of PV and wind power at No. period: after times of R&D investment (CNY/kWh) | |
| The generation cost of thermal power generation at No. period: after times escalation in costs (CNY/kWh) | |
| Generating capacity of PV and wind power at No. period (kWh) | |
| Cumulative installed capacity of PV/wind power at No. period (kw) | |
| R&D investment (billion CNY) | |
| Parameters | Meanings |
| Discount rate | |
| Probability of the escalation in the generation cost of thermal power | |
| Number of the implementation period of FIT policies (years) | |
| Cumulative number of R&D investments (times) | |
| Cumulative number of the escalation in thermal power costs (times) | |
| Total implementation periods of FIT policies (years) | |
| Weighted average feed-in tariff of PV and wind power during the guiding price policy (CNY/kWh, value-added tax included) | |
| Weighted average feed-in tariff of PV and wind power during the parity policy (CNY/kWh, value-added tax included) |
| Meanings | |
|---|---|
| Economic Earnings | Economic Earnings, i.e., the comparative returns contributed by the development of PV and wind power industries compared to that of the thermal power industry. In particular, when values are higher than , the substitution effect of PV and wind power projects on thermal power projects will bring positive economic benefits to China. In contrast, when values are no more than , the increase in the generating capacity of PV and wind power will raise the overall expenses of power consumption, bringing negative economic benefits for the country and weakening the economic attractiveness of PV and wind power projects. |
| Economic Costs | Economic Costs of FIT policies can be measured by the economic profit earned by the power generation projects under the guidance of FIT policies. For power generation enterprises, the economic profit depends on the difference between the revenue and the costs regulated and influenced by FIT policies. From another point of view, the economic profit earned by power generation enterprises can be understood as the costs paid by the state to obtain a stable electricity supply by introducing the FIT policies. Therefore, we defined economic profit for PV and wind power projects as the Economic Costs of FIT policies. |
| The PV of Future Net Economic Benefits | The Present Value of Future Net Economic Benefits will be expressed as the cumulative discounted value of the Net Economic Benefits over the remaining implementation period. |
| Corresponding Formulas | |
|---|---|
| Economic Earnings | |
| Economic Costs | |
| The PV of Future Net Economic Benefits |
| Variables | Meanings |
|---|---|
| Net environmental benefits of the FIT policies for PV and wind power at No. k period (CNY) | |
| Net comprehensive benefits of the FIT policies for PV and wind power at No. k period: after times of R&D investment and times escalation in the generation cost of thermal power (CNY) | |
| The weighted average price of green certificates at No. k period (CNY/sheet) | |
| The volume of green certificate traded (sum of subsidized and non-subsidized TGC) at No. k period (sheets) | |
| Costs of CO2 emission reduction per ton of standard coal consumption at No. k period (CNY/tonne) | |
| emission factor per ton of standard coal consumption at period No. k period (tonnes/standard coal) | |
| Standard coal consumption per unit of thermal power generation at period No. k period(g standard coal/kWh) |
| Meanings | |
|---|---|
| Benefits of Emission Reduction | Under the positive incentive of the FIT policies, the development of PV and wind power industries can save a large amount of emission reduction costs for the state, especially the costs of emission reduction. Hence, the overall savings in the costs of emission reduction due to the FIT policies can be used to evaluate the Benefits of Emission Reduction in FIT policies. |
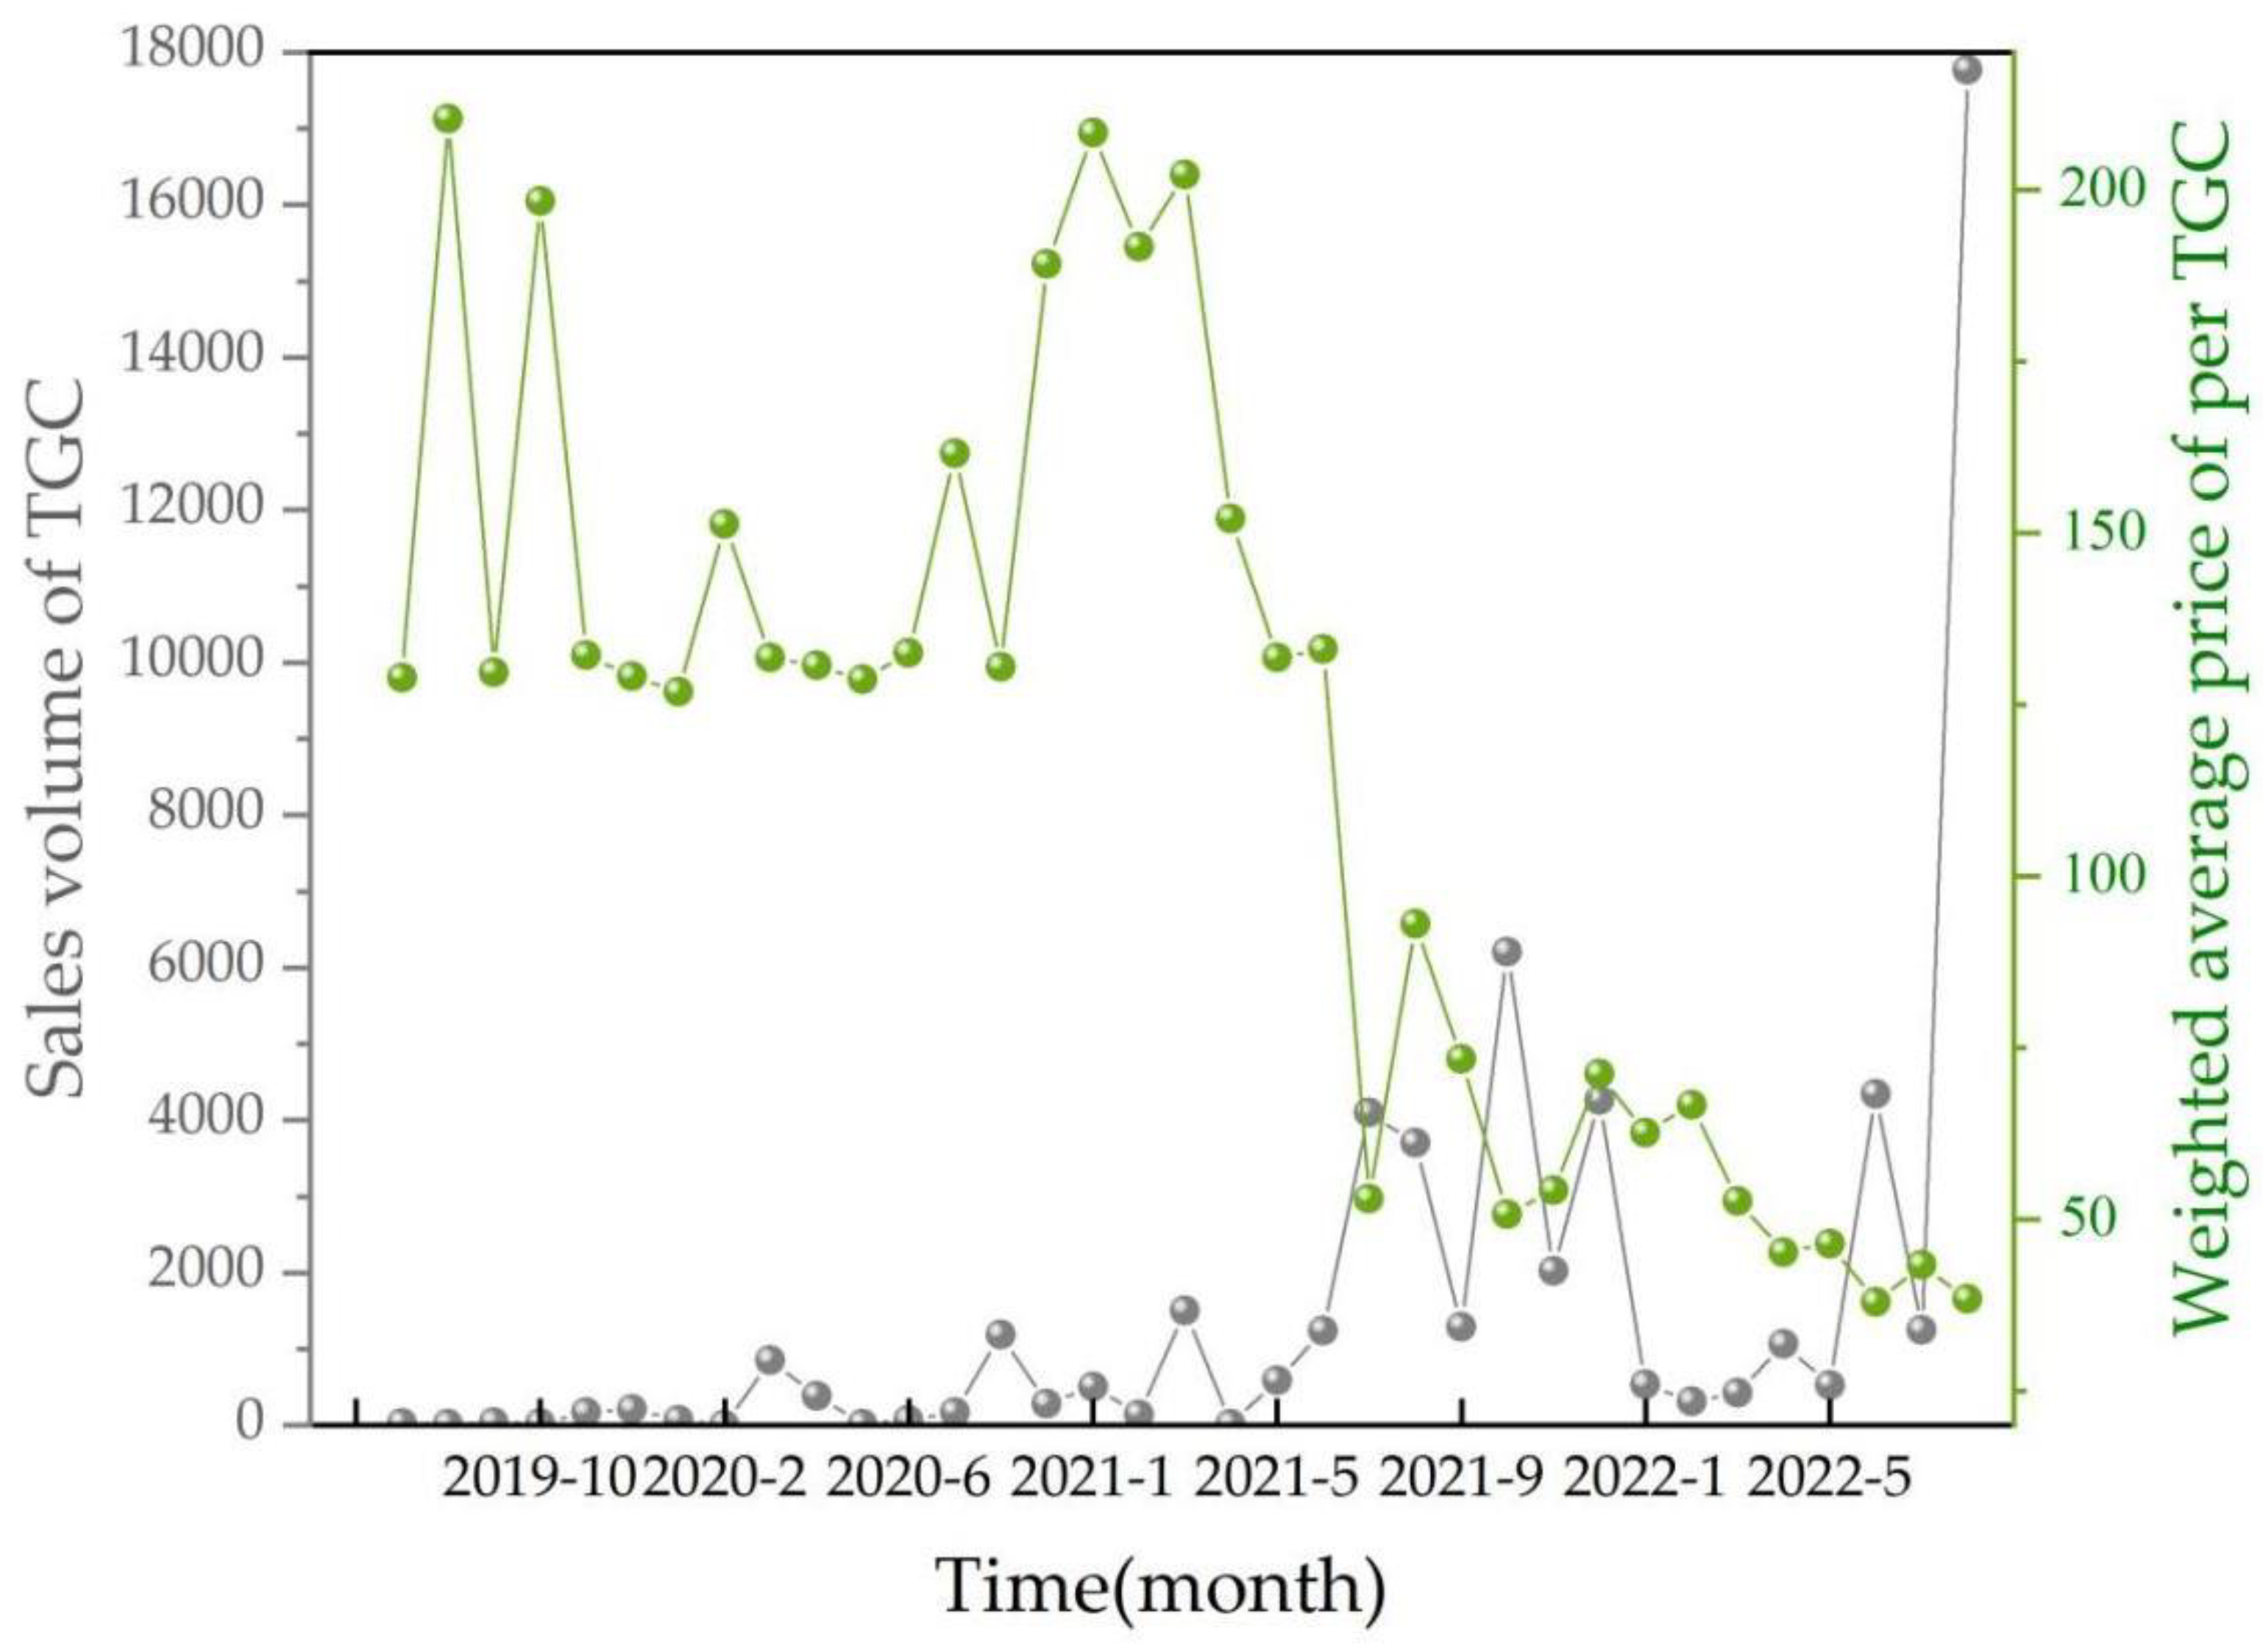
| Benefits for State Subsidies | The parity reform removed the state subsidy for incremental projects and permitted the issuance of unsubsidized green certificates. For now, PV and wind power generation enterprises are allowed to receive reasonable compensation through the sale of traded green certificates and CCER (Chinese Certified Emission Reduction, not yet restarted nationwide). Hence, we only use the total revenue of tradable green certificates to measure the savings in the expenditure of state subsidy due to the introduction of market-orientated compensation mechanisms. |
| The PV of Future Net Environmental Benefits | The Present Value of Future Net Environmental Benefits will be expressed as the cumulative discounted value of the Net Environmental Benefits of the policy over the remaining implementation period. |
| Corresponding Formulas | |
|---|---|
| Benefits of Emission Reduction | |
| Benefits for State Subsidies | |
| The PV of Future Net Environmental Benefits |
| Parameters | Meanings | Values | Sources and Assumptions |
|---|---|---|---|
| T | Total implementation periods of FIT policies (years) | 2 | Assuming the implementation period of the parity policy will execute 2 years, the same as the guiding price policy. |
| Risk-free interest rate | 0.021 | The benchmark interest rate for 2-year deposits was set by the People’s Bank of China in 2021. | |
| Discount rate | 0.979 | ||
| Annual volatility of the generation cost of thermal power | 0.151 | Based on monthly data on Bohairim Steamcoal Price Index from 2018 to 2022, obtained from the WIND Data. | |
| u | Rate of increase in the generation cost of thermal power | 0.112 | , is the proportion of coal price in the generation cost of thermal power which is calibrated based on real-time data of thermal power plants in a group company in China. |
| d | Rate of decrease in the generation cost of thermal power | 0.861 | |
| Probability of the escalation in thermal power costs | 0.999 | ||
| Annual investment in R&D (CNY billion) | 18.019 | Based on the public data on the R&D investment of 133 listed companies in PV and wind power generation. | |
| Learning rate for the costs of PV and wind power | 0.019 | Based on data published by IRENA in 2021. |
| Generating Capacity of PV and Wind Power (GWh) | 2022 | 2023 |
|---|---|---|
| Conservative scenario | 949,676.80 | 1,060,715.20 |
| Neutral scenario | 1,149,078.00 | 1,229,405.00 |
| Positive scenario | 1,236,374.40 | 1,490,761.60 |
| Parameters | Meaning | Values | Source |
|---|---|---|---|
| Costs of emission reduction per ton of standard coal consumption in 2021 (CNY/tonne) | 180.00 | BCG Research [29] | |
| emission factor per ton of standard coal consumption in 2021 (tonnes/standard coal) | 2.60 | China Carbon Emissions Trading Network | |
| Standard coal consumption per kilowatt hour of thermal power generation at period in 2021 (g standard coal/kWh) | 330.00 |
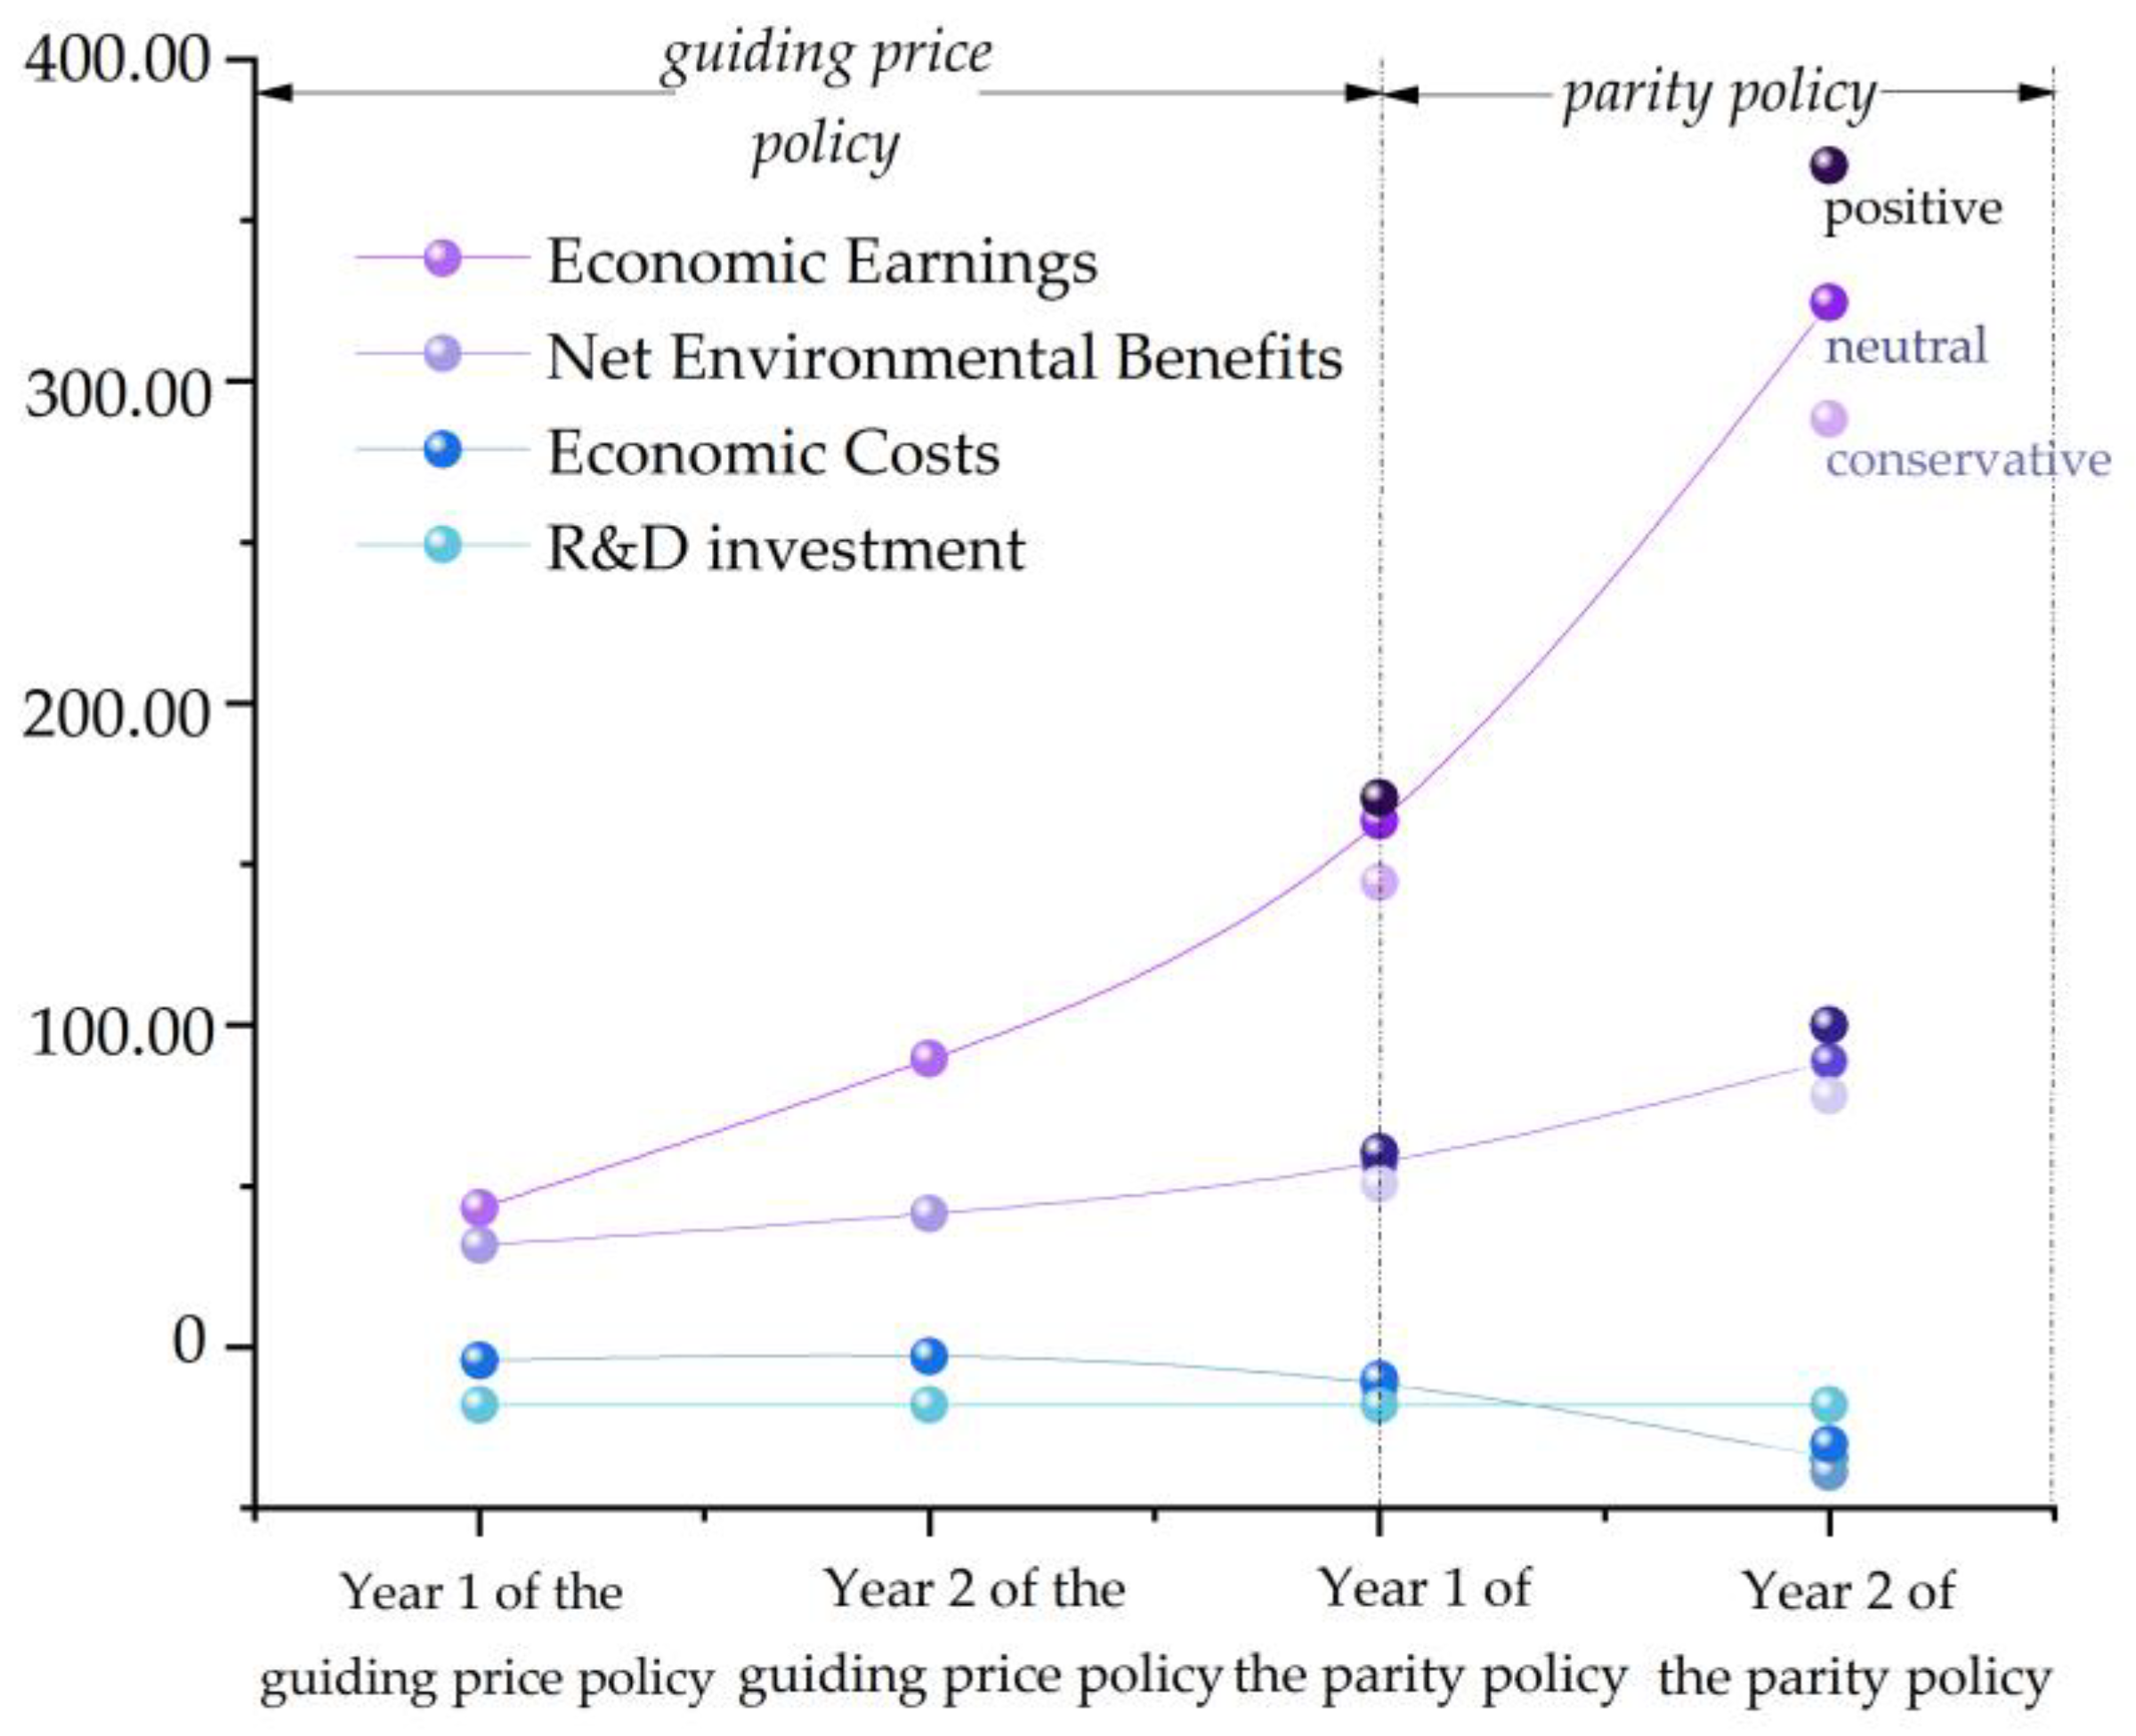
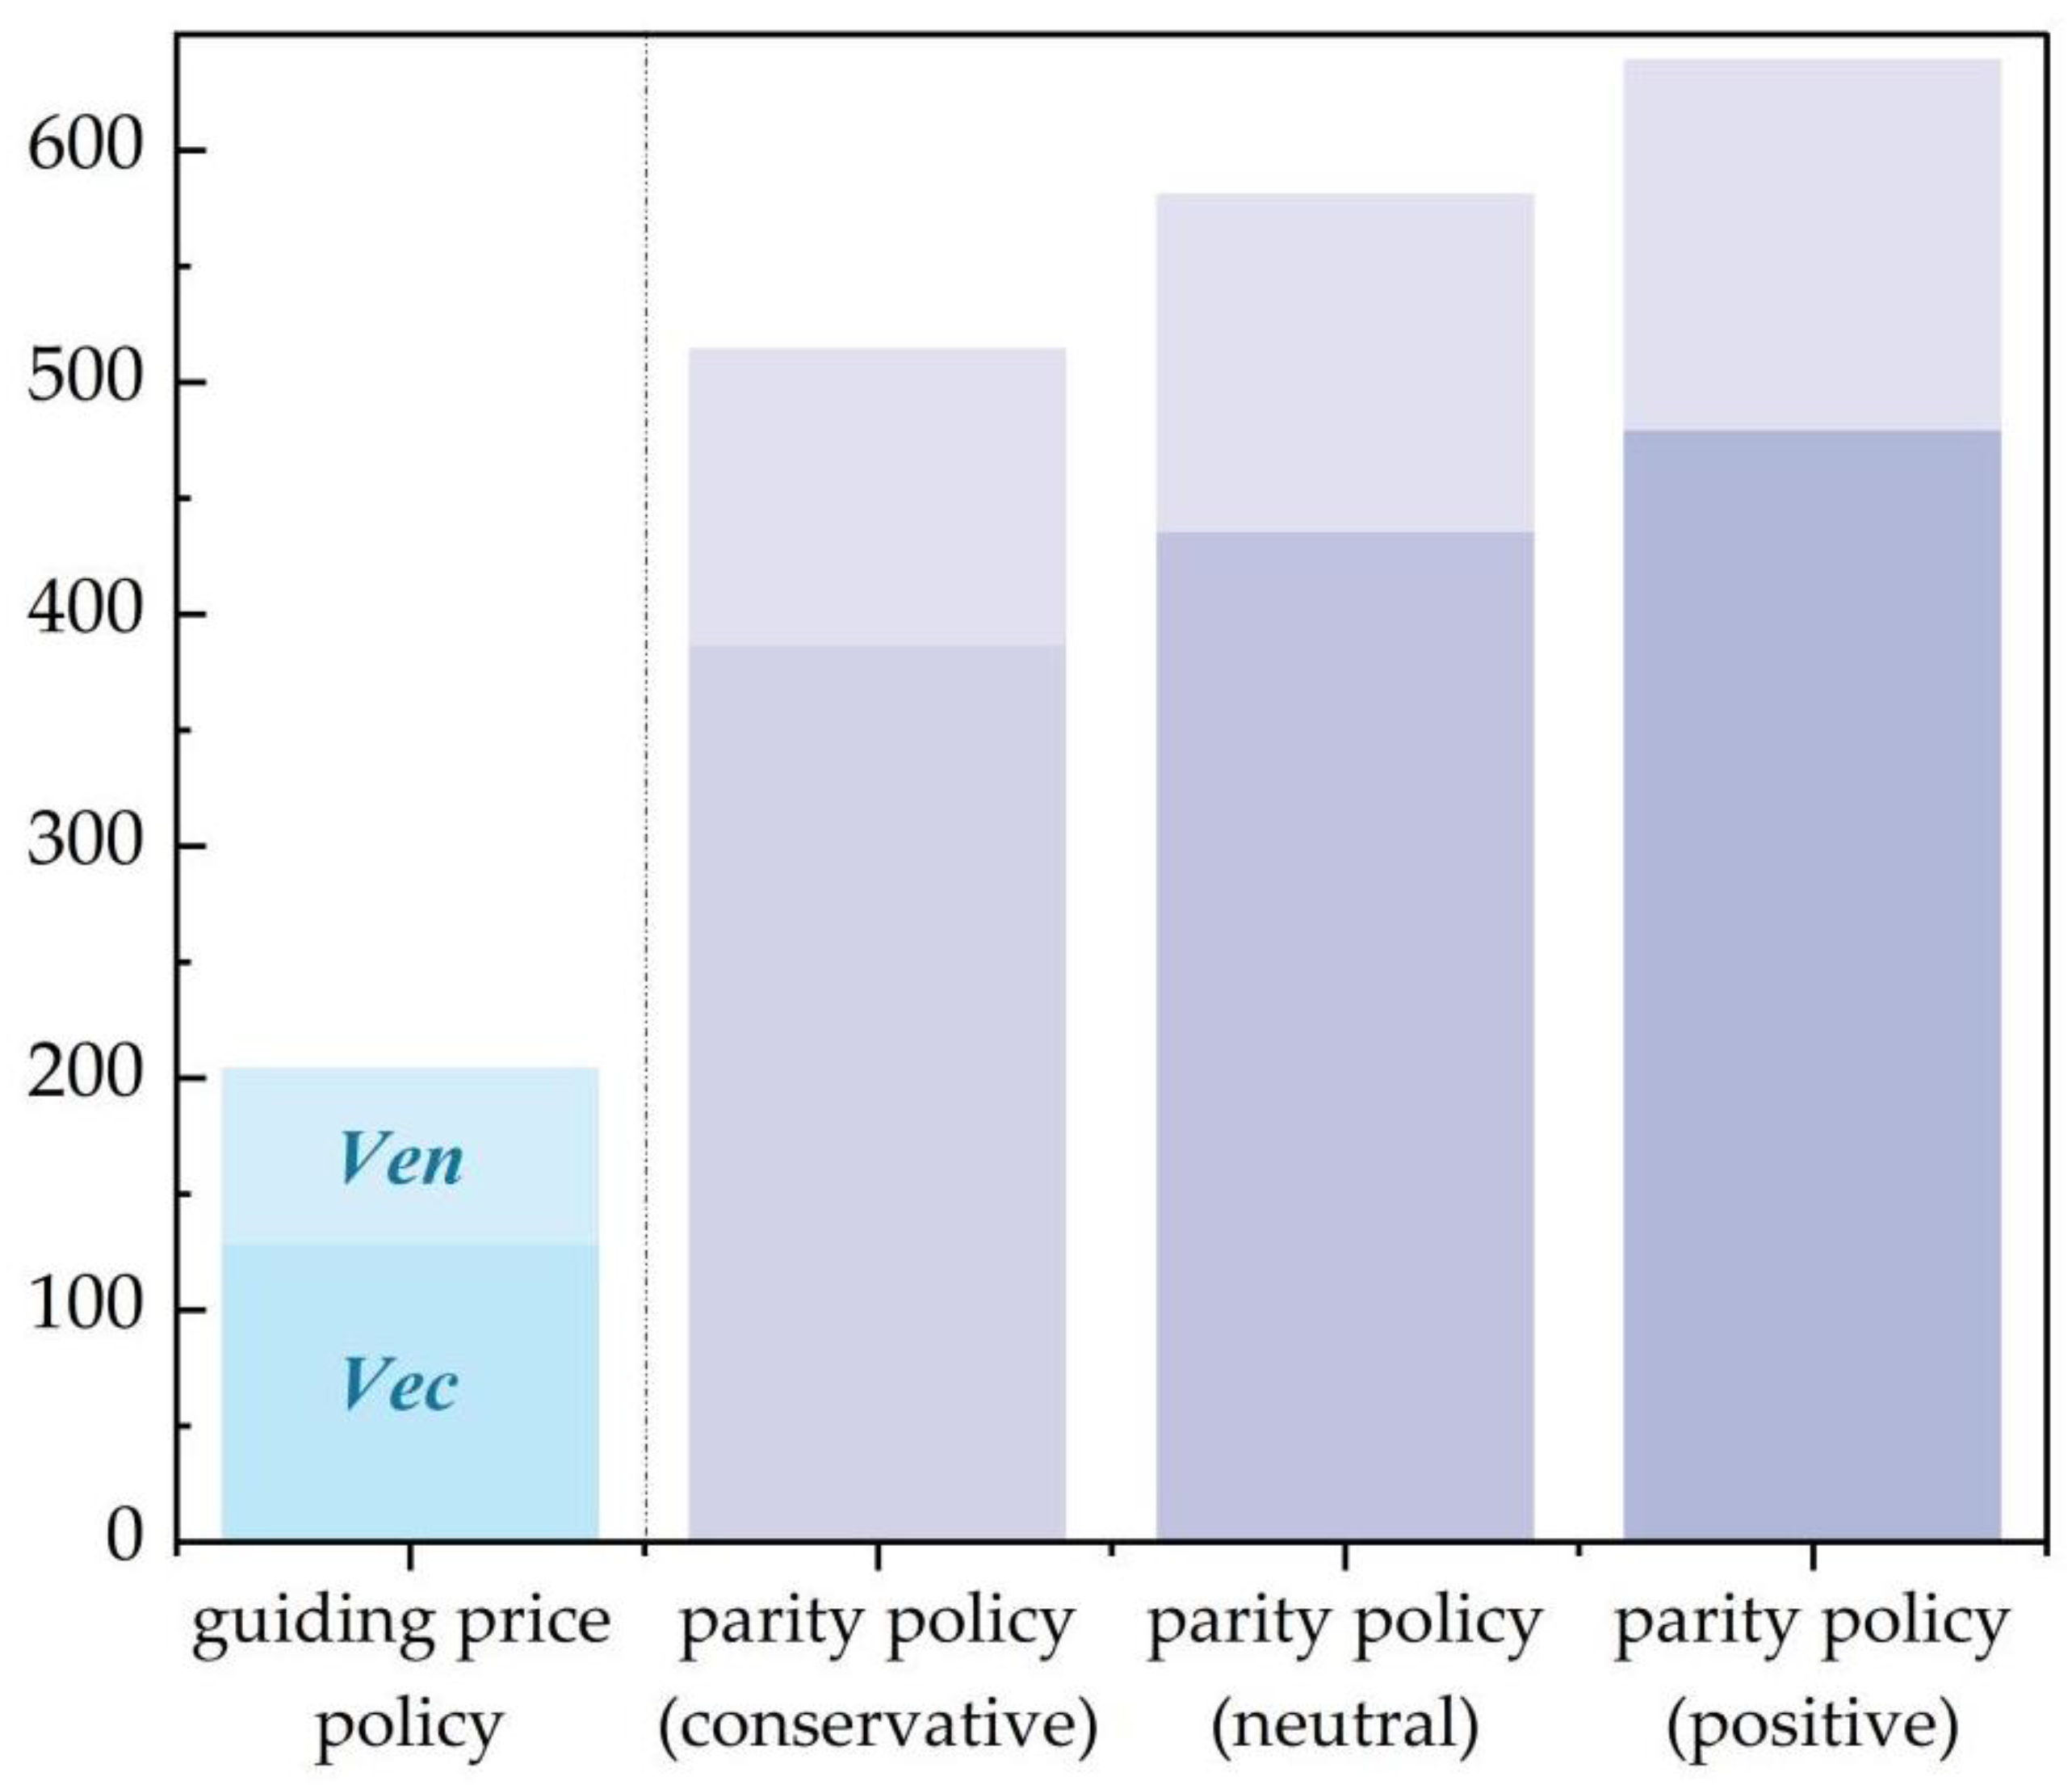
| Guiding Price Policy | Parity Policy | ||||||||
|---|---|---|---|---|---|---|---|---|---|
| Year 1 | Year 2 | Year 1 | Year 2 | Year 1 | Year 2 | Year 1 | Year 2 | ||
| Conservative | Neutral | Positive | |||||||
| Economic Earnings | 43.259 | 89.483 | 144.327 | 288.274 | 163.365 | 324.359 | 170.573 | 366.991 | |
| Economic Costs | −4.250 | −2.927 | −10.051 | −30.229 | −11.429 | −34.421 | −12.032 | −38.784 | |
| Invest in R&D? | No | No | No | No | No | No | No | No | |
| Benefits of Emission Reduction | 31.706 | 41.477 | 50.575 | 78.033 | 57.511 | 88.855 | 60.547 | 100.115 | |
| Benefits for State Subsidies | 0.001 | 0.001 | 0.002 | 0.008 | 0.002 | 0.008 | 0.002 | 0.008 | |
| 203.558 | 513.862 | 580.276 | 638.406 | ||||||
| Rate of change (%) | - | 152.440% | 185.067% | 213.624% | |||||
| Appraisal Model | Evaluation Objectives | Main Conclusions | |
|---|---|---|---|
| Evaluation Model of Implementation Effects | 1 | Identify which FIT policy is more conducive to promoting the development of PV and wind power, according to the results of Net Comprehensive Benefits. | The parity policy is more conducive to promoting the development of PV and wind power compared to the guiding price policy. |
| 2 | Compared with traditional thermal power generation, testing whether PV and wind power projects have greater economic competitiveness under the support of the last two-phase FIT policies. | Under the support of the last two-phase FIT policies, PV and wind power projects have greater economic competitiveness. | |
| 3 | Analyze the impact of the last two-phase FIT policies on the R&D activities of PV and wind power generation enterprises. | The last two-phase FIT policies have not been effective in encouraging R&D investment in the market of PV and wind power generation. | |
| 4 | Assess the substitution effect of the market compensation mechanisms on the government subsidy during the last two-phase FIT policies. | The market compensation mechanism of green certificates has a limited substitution effect on government subsidies during the last two-phase FIT policies, which makes it difficult to relieve the pressure of government subsidies. | |
| 5 | Assess the curbing effect of carbon dioxide emissions brought by the last two-phase FIT policies. | Compared to the guiding price policy, the effect of the parity policy to suppress carbon dioxide emissions proved better. | |
| Sliding Scale | Sliding Scale | Sliding Scale | Sliding Scale | |||||
|---|---|---|---|---|---|---|---|---|
| 5.20 | 0.304 | −5.69% | 472.57 | 0.55% | 182.03 | 5.06% | 654.61 | 1.76% |
| 5.85 | 0.313 | −2.90% | 470.57 | 0.12% | 177.44 | 2.41% | 648.01 | 0.74% |
| 6.50 | 0.322 | - | 469.99 | - | 173.27 | - | 643.26 | - |
| 7.15 | 0.340 | 5.48% | 473.76 | 0.80% | 166.19 | −4.08% | 639.95 | −0.51% |
| 7.80 | 0.340 | 5.48% | 471.55 | 0.33% | 165.88 | −4.27% | 637.43 | −0.91% |
| Appraisal Model | Evaluation Objectives | Main Conclusions | |
|---|---|---|---|
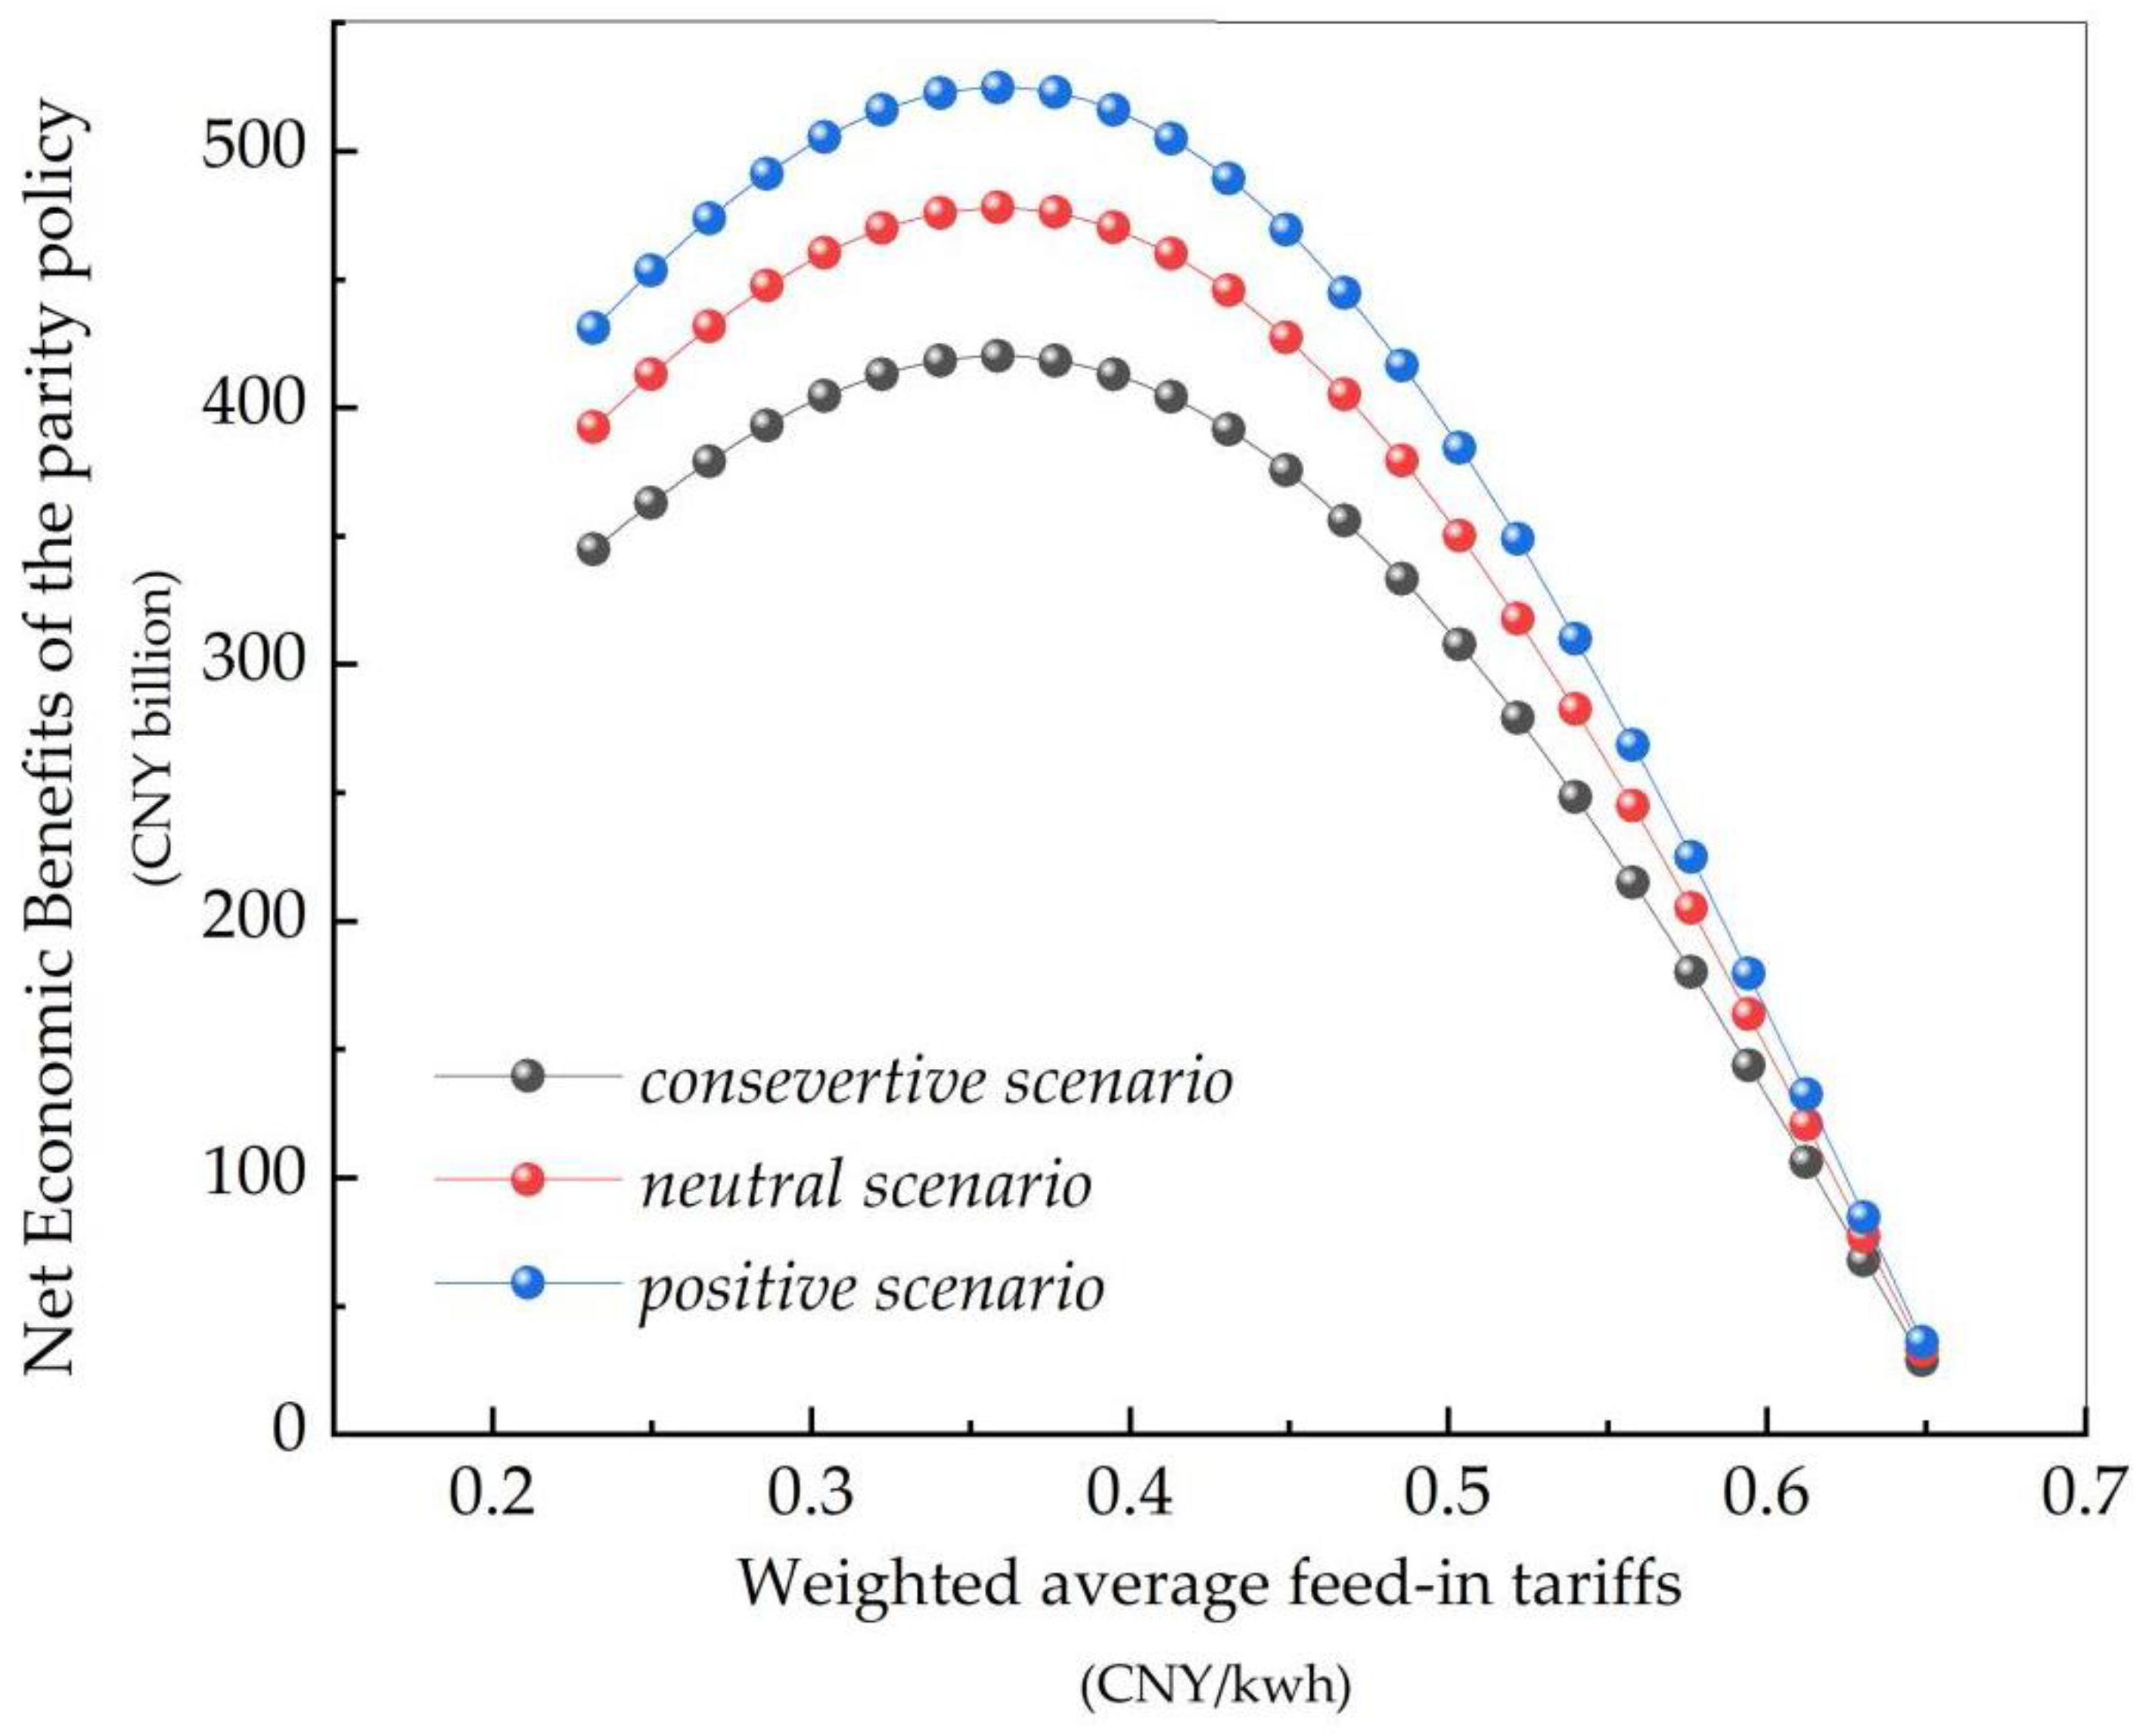
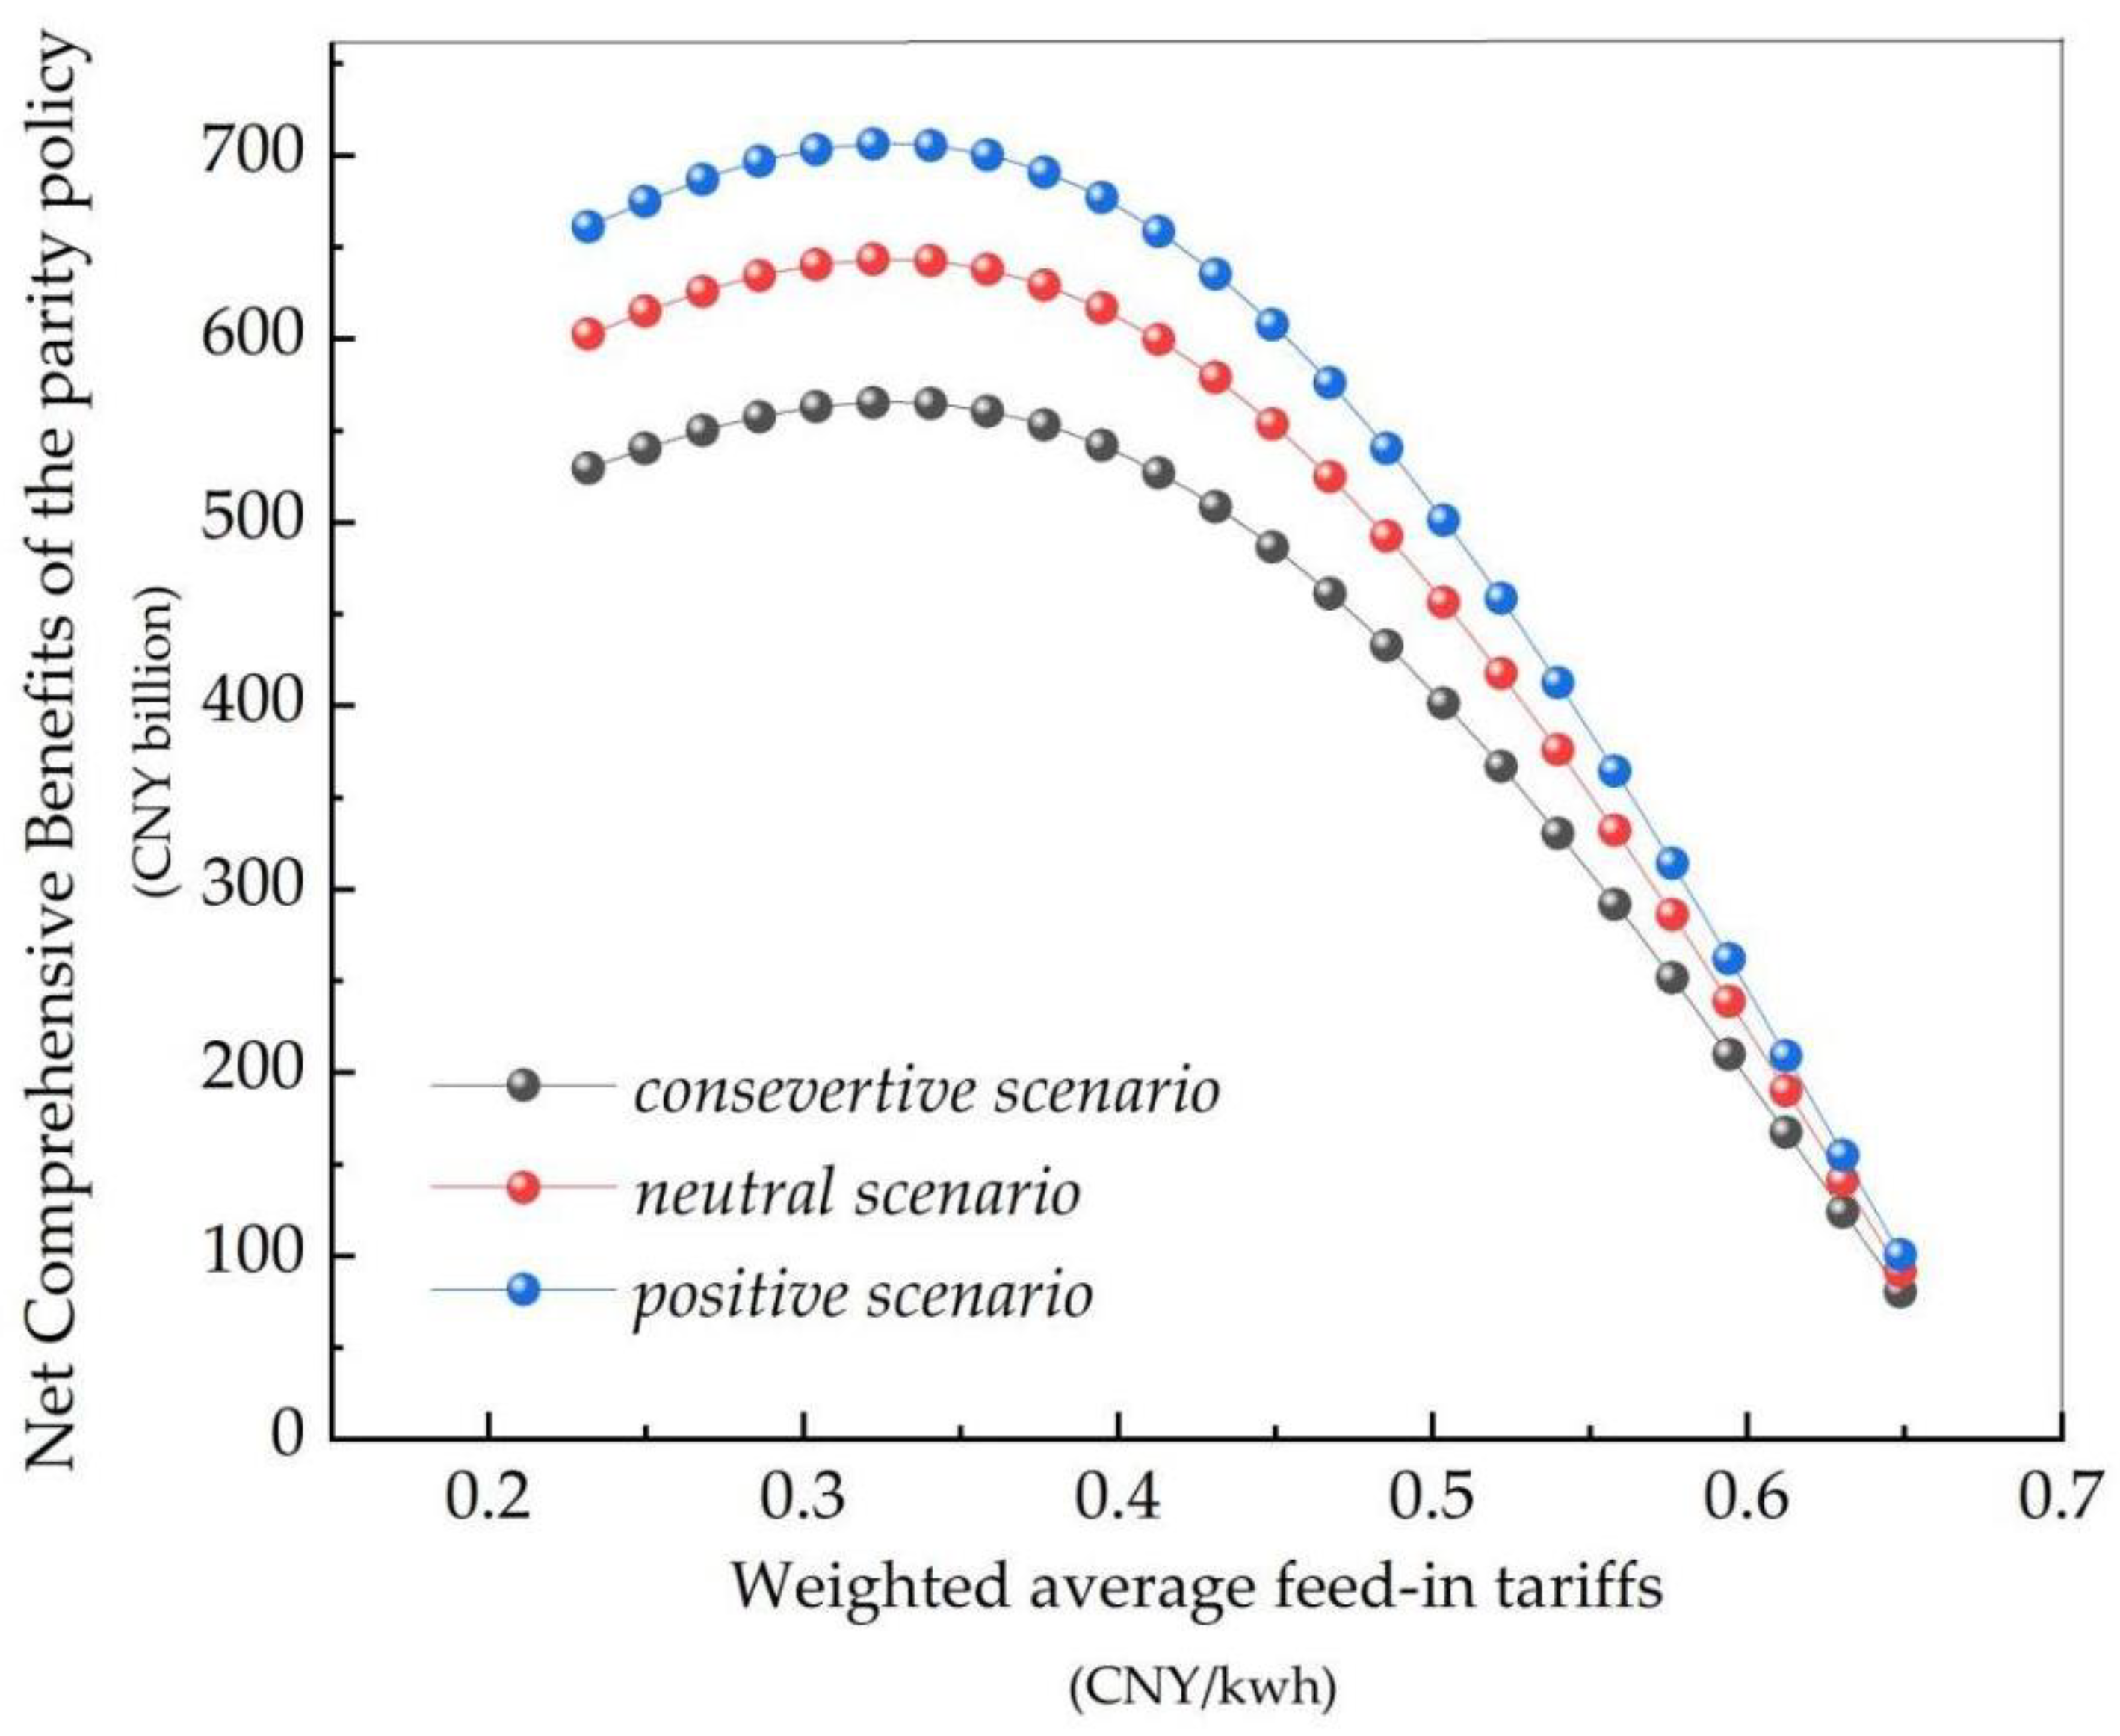
| Optimization Model for Policy Design | 1 | By calculating the optimal feed-in tariffs under a multi-scenario and multi-objective framework, test whether the existing feed-in tariff has reached the level of maximizing implementation effects, and estimate the room for the price reduction in the future. | The existing weighted average feed-in tariff exercised by the parity policy is higher than the optimal weighted average feed-in tariffs that maximize the implementation effects, and there is still space for price reduction. |
| 2 | Analyze whether the existing pricing mechanism is suitable for long-term implementation and put forward corresponding suggestions for policy optimization. | The existing pricing mechanism is not suitable for long-term implementation. | |
| The Optimal Weighted Average Feed-In Tariffs (CNY/kWh, Value-Added Tax Included) | ||||
|---|---|---|---|---|
| Maximizing Net Economic Benefits | Room for Reduction | Maximizing Net Comprehensive Benefits | Room for Reduction | |
| Conservative scenario | 0.358 | −10.615% | 0.322 | −22.981% |
| Neutral scenario | 0.359 | −10.306% | 0.322 | −22.981% |
| Positive scenario | 0.359 | −10.306% | 0.323 | −22.601% |
Disclaimer/Publisher’s Note: The statements, opinions and data contained in all publications are solely those of the individual author(s) and contributor(s) and not of MDPI and/or the editor(s). MDPI and/or the editor(s) disclaim responsibility for any injury to people or property resulting from any ideas, methods, instructions or products referred to in the content. |
© 2023 by the authors. Licensee MDPI, Basel, Switzerland. This article is an open access article distributed under the terms and conditions of the Creative Commons Attribution (CC BY) license (https://creativecommons.org/licenses/by/4.0/).
Share and Cite
Song, X.; Huang, Y.; Zhang, Y.; Zhang, W.; Ge, Z. An Appraisal on China’s Feed-In Tariff Policies for PV and Wind Power: Implementation Effects and Optimization. Sustainability 2023, 15, 5137. https://doi.org/10.3390/su15065137
Song X, Huang Y, Zhang Y, Zhang W, Ge Z. An Appraisal on China’s Feed-In Tariff Policies for PV and Wind Power: Implementation Effects and Optimization. Sustainability. 2023; 15(6):5137. https://doi.org/10.3390/su15065137
Chicago/Turabian StyleSong, Xiaohua, Yamin Huang, Yulin Zhang, Wen Zhang, and Zeqi Ge. 2023. "An Appraisal on China’s Feed-In Tariff Policies for PV and Wind Power: Implementation Effects and Optimization" Sustainability 15, no. 6: 5137. https://doi.org/10.3390/su15065137
APA StyleSong, X., Huang, Y., Zhang, Y., Zhang, W., & Ge, Z. (2023). An Appraisal on China’s Feed-In Tariff Policies for PV and Wind Power: Implementation Effects and Optimization. Sustainability, 15(6), 5137. https://doi.org/10.3390/su15065137