Article

Identification and Spatial Correlation of Imported Timber Landing Processing Industrial Clusters in Heilongjiang Province of China

College of Engineering and Technology, Northeast Forestry University, Harbin 150040, China
*
Author to whom correspondence should be addressed.
Sustainability 2023, 15(6), 5061; https://doi.org/10.3390/su15065061
Submission received: 31 January 2023 / Revised: 7 March 2023 / Accepted: 8 March 2023 / Published: 13 March 2023
(This article belongs to the Section Sustainable Urban and Rural Development)

Abstract

:
This paper analyzed the clustering degree and spatial distribution characteristics of the imported timber landing processing industry in China’s Heilongjiang province based on the survey and statistical data during 2019–2021. The location entropy method was used to quantify the clustering degree of timber landing processing. Multi-distance spatial clustering analysis, hotspot analysis, and spatial autocorrection analysis were conducted to identify the spatial pattern of enterprises and analyze the hotspots and spatial correlation among the prefecture-level cities in the region. Results showed that there was obvious industrial agglomeration in imported timber landing processing in Heilongjiang Province, and the overall spatial pattern of the industry showed significant spatial aggregation at different spatial scales. The hotspots were primarily concentrated in the southeast of the province with a high level of industrial development, while the cold spots were primarily in the western and northern parts with a low level of industrial development. The distribution of the imported timber landing processing industry at the provincial level was positively correlated, but not very significantly. There was large spatial heterogeneity for the imported timber landing processing industry. Some suggestions were put forward in order to accelerate the construction of imported timber landing processing industrial clusters in the region.

1. Introduction

With the implementation of China’s Natural Forest Resources Protection Project (NFRPP) and the rapid development of the domestic economy, China’s domestic industrial timber supply has been far from meeting the growing demand for timber consumption [1]. In addition to strengthening timber saving and improving the comprehensive utilization rate of timber, the main solution to this huge gap is to import timber from other countries [2]. Currently, China is the world’s largest timber importer [3]. In 2021, China’s timber import volume reached 96.51 million m3 (log volume), an increase of 32.43% compared with 2011 and 416.39% compared with 2000 [4,5]. Russian timber is an important part of China’s imported timber, accounting for more than 40% of the total [6]. As China’s northernmost province with the highest latitude, Heilongjiang Province plays an important role in the China–Russia timber trade with the help of geographical advantages and preferential policies [7]. Since 2010, Heilongjiang’s annual timber import from Russia has remained over 4.5 million m3, with a total amount of over 800 million US dollars [8]. In 2017, the import volume from Russia even surpassed 8 million m3 [9]. Although affected by the recent COVID-19 epidemic and the adjustment of Russia’s log export policy, the fluctuation of Heilongjiang’s timber import volume was not significant. In 2021, Heilongjiang’s timber import reversed the downward trend, increasing to 11.17 million m3 (log volume), an increase of 16.7% compared to 2020 [10].
Even though a large amount of Russian timber was imported by Heilongjiang province every year, a considerable part of it was either directly transported to other provinces for processing by sea or cross docking at ports or sold to other provinces in the form of logs, sawn wood, or square-edged timber [11]. The main reason was that Heilongjiang was in an inferior position in terms of timber processing technology innovation, improvement of product added value, and the timber processing industrial system, compared with other provinces with more developed timber processing industries, which resulted in poor capacity to undertake landing processing of imported timber and a lack of large-scale competitive advantage [12]. In recent years, Heilongjiang province strived to accelerate landing processing of imported timber by issuing a series of incentive policies in order to stimulate the local economy and promote the deep economic integration of China–Russia border areas [13]. By 2014, there were more than 2000 timber processing and furniture manufacturing enterprises in the province, with an annual processing capacity of 9.6 million m3, of which 311 enterprises were above the designated scale [14]. The processing capacity of imported Russian timber was further improved. Suifenhe, Tongjiang, and Jiayin ports accounted for approximately 80% of the imported Russian timber in Heilongjiang Province. Among them, Suifenhe had become the largest Russian timber import distribution center and timber landing processing zone in China with a landing processing rate of 35% [14]. In order to accelerate the construction of imported timber landing processing industrial clusters in Heilongjiang Province and realize the transformation and upgrade from a channel economy to a port economy and an industrial economy, it is particularly important to identify and analyze the spatial pattern of the existing imported timber landing processing industrial clusters.
An industrial cluster is a new form of industrial organization, which is more effective compared with an industrial organization in a decentralized state [15]. It also provides a new analytical way of thinking for solving the development problems of resource-based industrial clusters. To date, a great number of studies have been conducted on the identification of industrial clusters and the commonly used methods for identifying industrial clusters include location quotient (LQ), input-output analysis (IOA), principal component factor analysis (PCFA), multivariate clustering analysis (MVC), etc. [16,17,18]. To better display the identification and classification results, the spatial pattern analysis was carried out together with the identification of industrial clusters. For example, Carroll et al. [19] used location quotients and hotspot analysis (Getis-Ord’s Gi* statistic) to identify and classify the potential cluster regions in the transportation equipment industry of four states in the Midwestern USA. Chen and Yan [20] proposed the concept of the composite location quotient (CLQ) based on regional industrial output, number of employees, and number of enterprises and applied it to identify and classify the oil and gas resource industrial clusters in China. Titze et al. [21] identified interrelated sectors via national input–output tables in Germany with the help of minimal flow analysis (MFA) and found concentrations of vertical clusters in only 27 of 439 German Nomenclature des Unités Territoriales Statistiques (NUTS)-3 regions. Cho [22] identified the spatial concentrations and linkage properties of industrial clusters in the Chungbuk region of Korea using a three-step approach, which is composed of the cluster index, Getis-Ord’s Gi*, and quantitative input–output analysis. Arif and Purnomo [23] identified the location and assessed the economic clusters of leading industries in Surakarta City, Indonesia based on the number of units and labor absorption using the Exploratory Spatial Data Analysis (ESDA).
With respect to the imported timber landing processing industrial clusters in China, several studies have been carried out and most of them have focused on the border provinces such as Inner Mongolia and Heilongjiang. For example, Sun et al. [24] analyzed the advantages of developing an imported timber landing processing industrial cluster in the border city of Manchuria in Inner Mongolia from the aspects of geographical advantage, China–Russia relationship, industrial parks, raw material supply, and government support. Yan [25] launched an empirical study to analyze the driving mechanism of developing timber processing industrial clusters in the border city of Manchuria based on the method of the Analytical Hierarchy Process (AHP). Pang [26] used the diamond theory model to analyze the competitiveness of Manchuria’s timber processing industrial clusters in terms of productive factors, market demand, the structure of enterprises, related industries, and government and opportunities. Pang and Sun [27] also put forward the current problems after sorting out the development status of landing processing industrial clusters in the borders of Inner Mongolia. Wu [14] analyzed the status of importing Russian timber in Heilongjiang province during the period of 2009–2012 and the effects of imported timber landing processing. The author also pointed out the major problems of imported timber landing processing such as the incomplete industrial chain, dominant primary processing, the weak ability to undertake imported timber processing, and the lower market competitiveness compared with the southern Yangtze-river delta of China. In summary, the quantitative identification of the imported timber landing processing industrial clusters in Heilongjiang Province of China was still in a blank state, and the corresponding spatial pattern analysis on the imported timber landing processing industrial clusters was rarely reported.
The objectives of the paper are to (1) investigate the current status of imported timber landing processing industrial clusters in Heilongjiang province through the questionnaire method and the location quotient, (2) obtain the spatial pattern and spatial autocorrelation of the imported timber landing processing enterprises in Heilongjiang Province by using spatial analysis methods, and (3) provide policy implications on how to accelerate the construction of imported timber landing processing industry cluster in Heilongjiang province.

2. Materials and Methods

2.1. Identification of Industrial Clusters

In this study, the location entropy method was used to calculate the agglomeration degree of the imported timber landing processing industry in Heilongjiang province. Based on the location quotient (LQ) value, the agglomeration status and forming tendency of the imported timber landing processing industry in this region were evaluated. The location entropy method was originally proposed by P. Haggett in 1965 and has been widely used to analyze local industry specialization and identify industry clusters in regions of all sizes due to the characteristics of easy data acquisition and simple calculation [28,29,30,31,32]. An LQ is computed as an industry’s share of a regional total for some economic statistic divided by the industry’s share of the national total for the same statistic. The calculation formula is expressed as:
L Q = n i / n j N i / N j
where LQ represents the location entropy of the imported timber landing processing industry in Heilongjiang Province, n i represents the amount of imported landing processed timber in Heilongjiang Province, n j represents the total amount of goods imported by Heilongjiang Province, N i represents the amount of timber imported nationwide, and N j represents the total amount of goods imported in the country. An LQ of less than 1.0 means that the specialization level of the imported timber landing processing industry in Heilongjiang Province is lower and industrial clusters have not been formed yet. The greater the LQ value, the higher the possibility of forming industrial clusters. When LQ is equal to 1.0, it indicates that the specialization level of the imported timber landing processing industry in Heilongjiang province is equivalent to the national average. When LQ is greater than 1.0, it indicates that the imported timber landing processing industry in Heilongjiang Province is at a higher level and has certain advantages over the national level. The greater the LQ value, the more obvious the advantages and the higher the professionalism of the industrial clusters. In order to identify the industrial clusters in Heilongjiang province, the LQs of the prefecture-level cities were also computed.

2.2. Spatial Pattern and Correlation Analysis

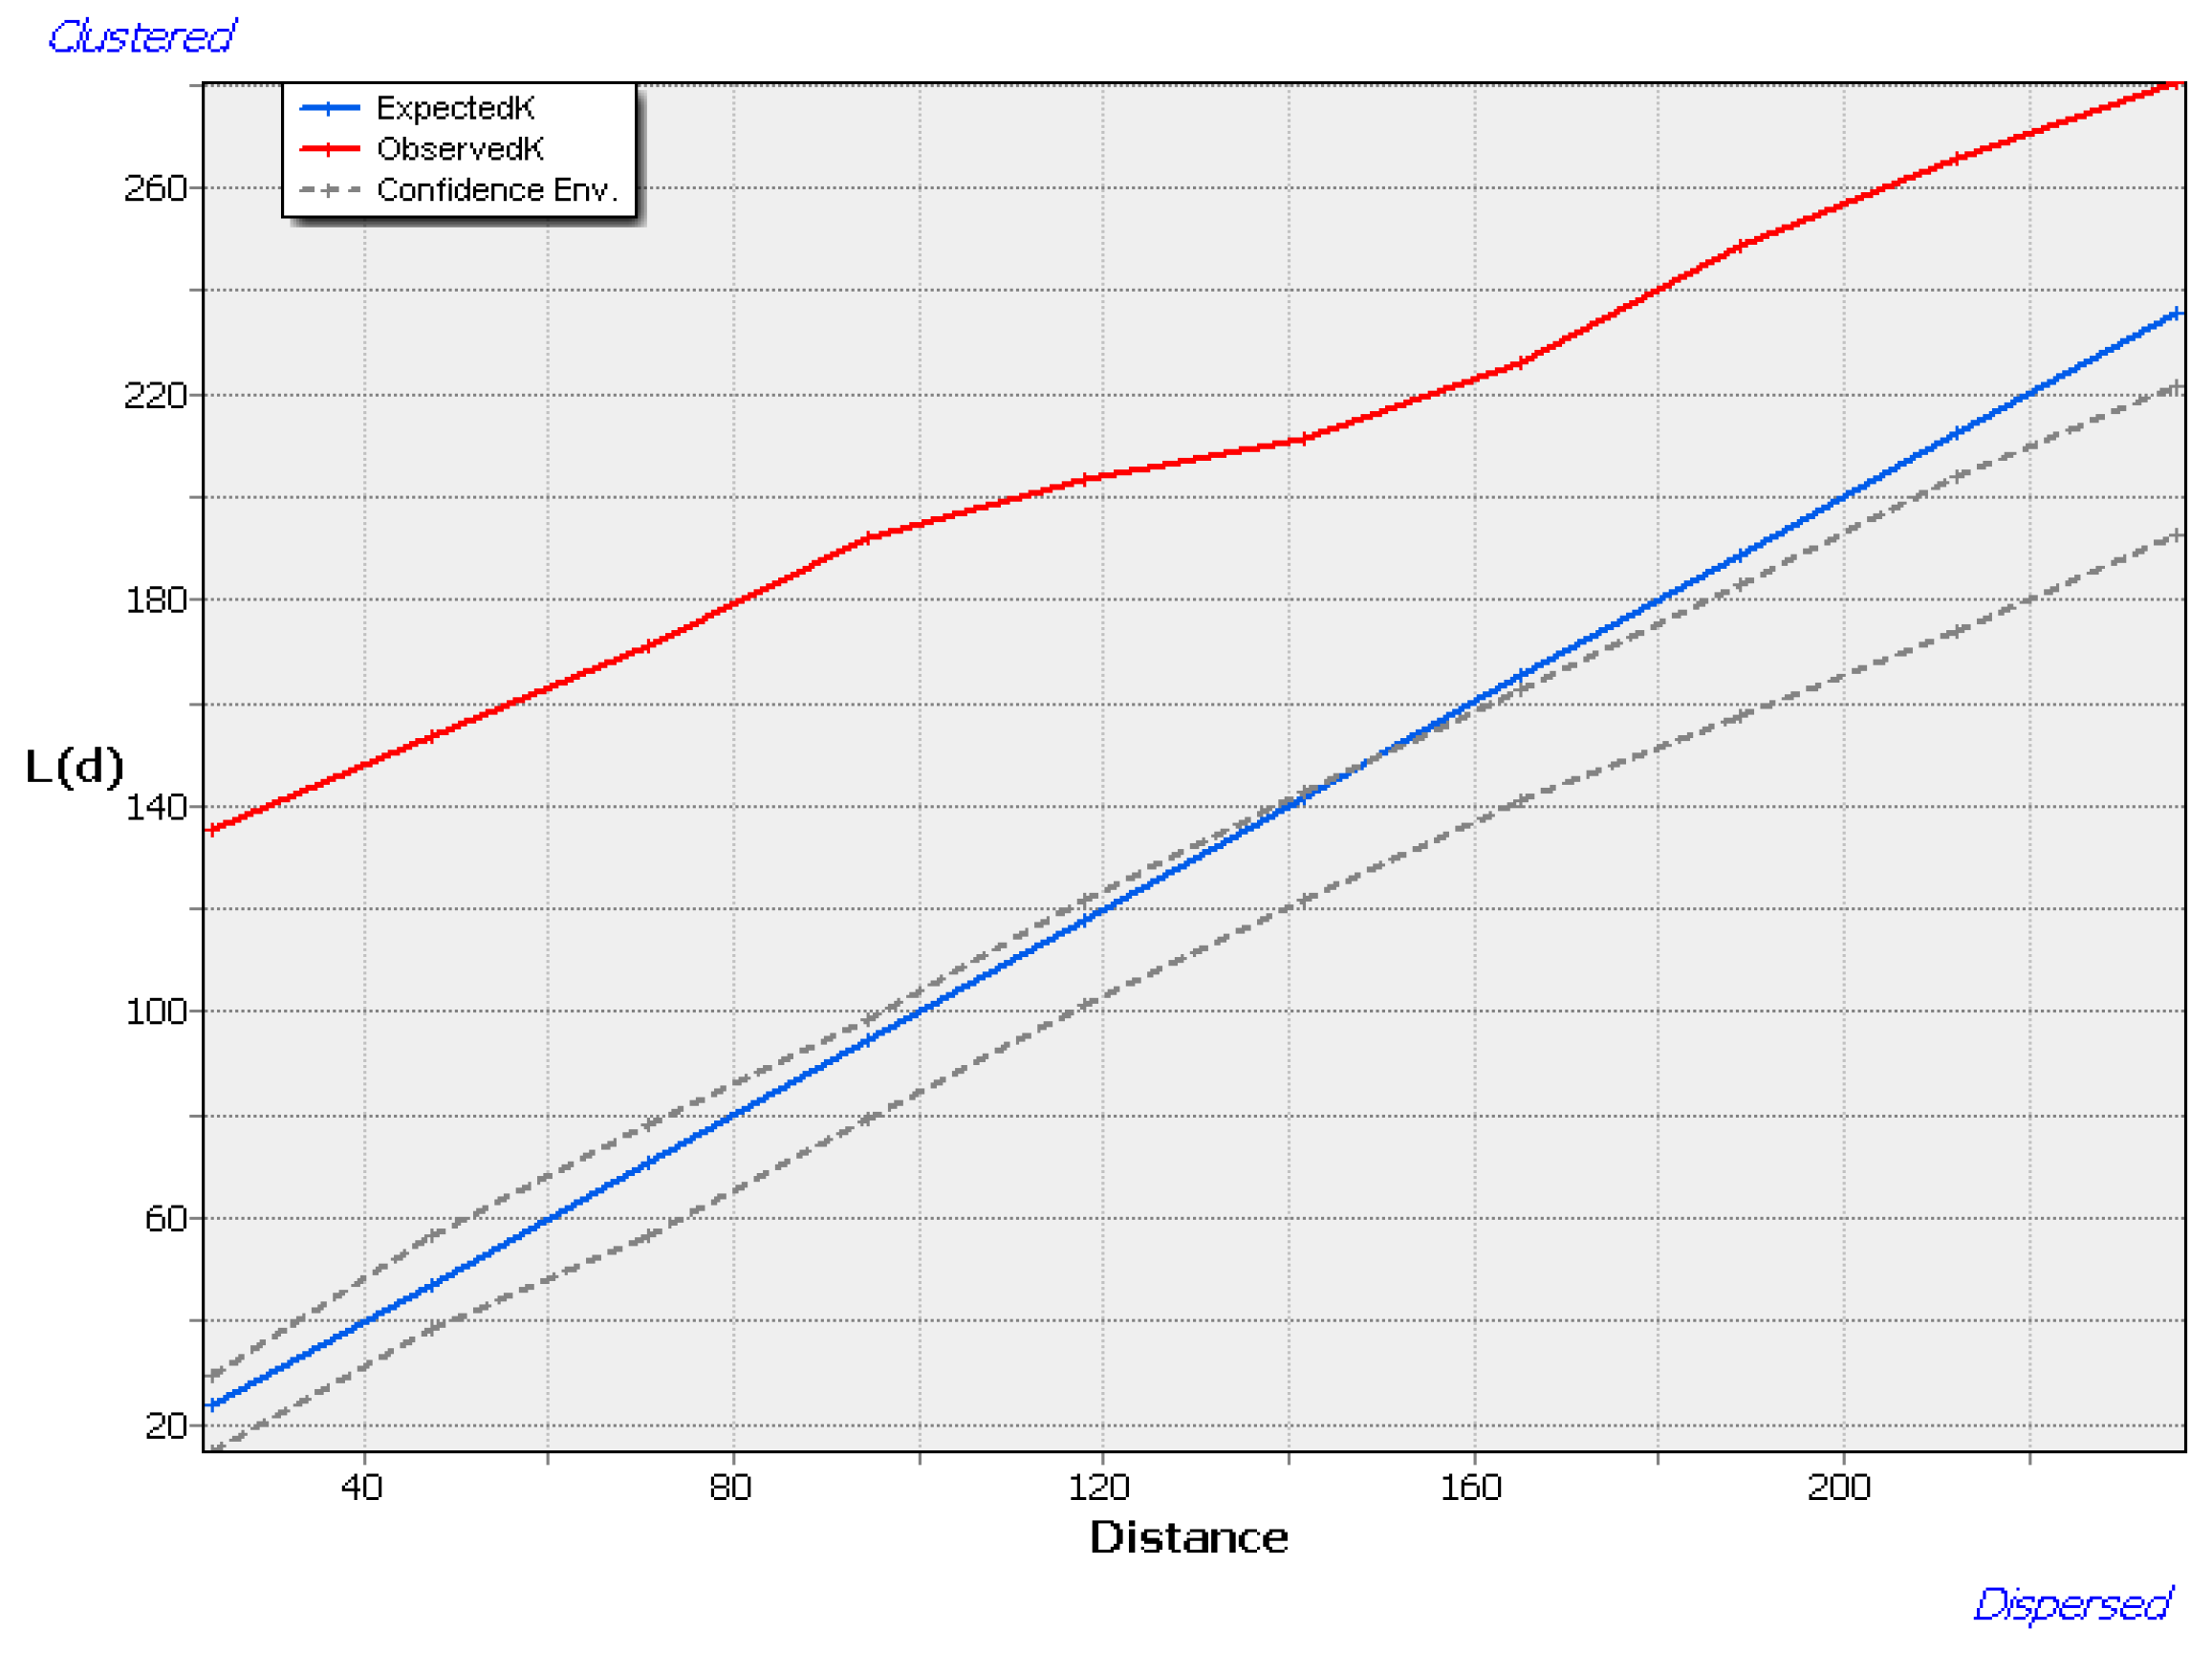
2.2.1. Multi-Distance Spatial Clustering Analysis

In spatial pattern analysis, one of the important parameters of distribution features for spatial elements is the spatial distance, which can be used to characterize different aggregation patterns of the elements [33]. In this study, Ripley’s K function [34,35] was used to explore the spatial aggregation scale of the imported timber landing processing industry in Heilongjiang province, so as to quantify the aggregation characteristics of the industry. Generally, Ripley’s K function is converted into Ripley’s L(d) function to evaluate the variations of spatial aggregation of elements [36]. The calculation formula is as follows:
L ( d ) = A i = 1 n j = 1 n K i j / ( π n ( n 1 ) ) ( i j )
where d represents the Euclidean distance and the aggregation scale of the timber landing processing industry, n is the number of input elements, A represents the area of the study area, and Kij is the weight of the elements. When the Euclidean distance between region i and j is greater than or equal to d, Kij = 0, otherwise Kij = 1. Within a certain range of distance, the observed value of Kij higher than the predicted value indicates a high degree of aggregation of the industry, otherwise, it indicates a highly dispersed degree. If the observed value of K is greater than the upper limit of the confidence interval (HiconfEnv), the spatial aggregation is statistically significant. If the observed value of K is less than the lower limit of the confidence interval (LwConfEnv), the space dispersion is statistically significant [37].

2.2.2. Hotspot Analysis

Hotspot analysis is one of the main spatial statistical methods, which was proposed by Getis and Ord [38,39]. It has been applied in many aspects, such as geographical emotional characteristics, crime geography, agglomeration degree of industrial development, etc. [40,41,42,43,44]. Hotspot analysis is used to calculate the G i * statistic of each element and then applies a cold-to-hot type of rendering to the output z-scores. A higher z-score indicates the presence of hotspot clusters in this area; in contrast, a smaller z-score indicates the presence of cold-spot aggregation in this area [45,46]. In this study, hotspot analysis was used to divide the study area into hotspots, sub-hotspots, sub-cold-spots, and cold-spots using the ArcGIS platform. The G i * statistic is calculated as follows:
G i * = ( j = 1 n W i j X j - X ¯ j = 1 n W i j ) / ( S n n - 1 j = 1 n W i j 2 - 1 n - 1 ( j = 1 n W i j ) 2 )
where G i * is the Z score, X j is the landing processing volume of imported timber for element j, X ¯ is the average value of the landing processing volume of all elements, S refers to the standard deviation of land processing volume, W i j is the spatial weight of the elements (1 for the adjacent area, 0 for the non-adjacent area), and n is the total number of elements. When G i * is positive and significant, the higher the value, the more intense the clustering of the imported timber landing processing hotspots. When G i * is negative and significant, the lower the value, the more intense the clustering of the imported timber landing processing cold-spots.

2.2.3. Spatial Autocorrelation Analysis

Spatial autocorrelation analysis can be used to evaluate how well objects correlate with other nearby objects across a spatial area. Measures of spatial autocorrelation can be categorized as global or local indicators of spatial association (LISA) [47]. The global spatial autocorrelation focuses on the overall trend of the distribution of variables in the whole area and indicates the degree of clustering. Global Moran’s I is the commonly used global spatial autocorrelation statistic [48]. In this study, Global Moran’s I was calculated to quantify the clustering degree of imported timber landing processing enterprises in Heilongjiang province. The calculation formula is shown in Equation (4). The value for Moran’s I ranges from −1 to 1 where −1 means that the imported timber landing processing enterprises are perfectly dispersed, 0 means that they are randomly dispersed, and 1 means that they are perfectly clustered together.
I = i = 1 n j = 1 n W i j ( X i - X ¯ ) ( X j - X ¯ ) S 2 i = 1 n j = 1 n W i j
The local spatial autocorrelation is used to specifically measure the local spatial correlation between the focused area and the adjacent area [49]. It is generally measured using the local Moran’s I index (Ii) [50], and the calculation formula is as follows:
I i = ( X i - X ¯ ) S 2 j = 1 n W i j ( X j X ¯ )
It is noted that there are two parts in Equation (5), one is the locally standardized value and the other is the space lag vector. Both parts can take positive values, negative values, and 0. Therefore, four combinations of relationships (++, +−, −+, −−) can be obtained, which are noted as high–high aggregation (H–H), high–low aggregation (H–L), low–high aggregation (L–H), and low–low aggregation (L–L) [51,52]. The H–H region indicates that the level of the timber landing processing industry in one area is higher than the regional average, and the industry in the neighborhood is positively correlated with the industry in the area. The H–L region indicates that the level of the timber landing processing industry in one area is higher than the regional average, but it has a lower drive force to the industrial development of the adjacent area, showing a negative correlation with an adjacent area. L–H indicates that the level of the timber landing processing industry in one area is lower than the regional average, and the level of the adjacent area is higher than that of the entire region. In this case, this area can be defined as a transitional area for industrial development clustering. L–L indicates that the levels of the timber landing processing industry in one area and the adjacent area are all lower than the regional average, indicating that the degree of industrial agglomeration is not high, but at the development stage.

2.3. Data Investigation

According to the Directory of Wood Processing and Furniture Manufacturing Enterprises in China (2022 version) (https://industry.emagecompany.com/wood/, accessed on 20 June 2022), the number of wood processing and furniture manufacturing enterprises in Heilongjiang province was 689. In the summer of 2022, a telephone survey was conducted based on the listed enterprises in the directory to gather information about imported timber landing processing in the province during the period of 2019–2021. The questions were designed to obtain answers related to concerns about whether or not to utilize imported timber, import sources, annual production capacity, the volume of logs imported, the volume of sawn wood imported, any potential business barriers, policy suggestions, future trends, etc. All the feedback was put into an MS Excel sheet and checked for completeness for later analysis. The total volume of timber imported by Heilongjiang province in 2019 and 2020 was obtained from Heilongjiang Statistical Yearbook (2020–2021). Since the statistical data of Heilongjiang province for 2021 has not been published yet, the online China Customs Import and Export Data [10] was used to obtain the volume of timber imported by Heilongjiang province in 2021. In order to explore the spatial relationship among the timber landing processing enterprises, the coordinates of the enterprises were obtained using Coordinate Picker (https://lbs.qq.com/getPoint/, accessed on 20 June 2022), which were then input into the software of ArcGIS to realize visualization.

3. Results

3.1. Status of Imported Timber Landing Processing Industry in Heilongjiang Province

3.1.1. Results of Imported Timber Landing Processing Rate in Heilongjiang Province

The survey results of imported timber landing processing in Heilongjiang Province are summarized in Table 1. Two hundred and forty-three pieces of feedback were received, so the response rate of the survey was 35.27%. It is noted that among the enterprises with effective feedback, 102 enterprises had imported timber landing processing business in the past three years, and 141 enterprises did not use imported timber due to a change in business mode or enterprise shutdown. Mudanjiang City had the largest volume of imported timber landing processing at 535,380 m3, accounting for 65.49% of the total landing processing, followed by Qitaihe City (59,560 m3, 7.29%) and Harbin City (58,860 m3, 7.20%). During the period of 2019–2021, the surveyed average landing processing volume for imported timber in Heilongjiang province was approximately 817,510 m3 (log volume), of which imported logs landing processing was approximately 413,500 m3 and the rest was sawn wood (286,900 m3). According to Heilongjiang Statistical Yearbook (2020–2021) and China Customs Import and Export Data (2021), the annual imported timber in Heilongjiang province during the period of 2019–2021 was 10.23 million m3. Combined with this number and the response rate of the survey, we can obtain a landing processing rate of 22.53% for the imported timber in Heilongjiang province.

3.1.2. Location Quotient of Imported Timber Landing Processing Industry in Heilongjiang Province

According to the reported import quantities and import value of logs and sawn wood in Heilongjiang province during 2019–2021, the average unit price of imported logs was 900.80 Chinese Yuan (CNY)/m3 and the average unit price of imported sawn timber was 1366.50 CNY/m3. Combined with the survey results and response rate, the landing processing value for imported logs was CNY 10.56 billion, and the landing processing value for imported sawn wood was CNY 11.14 billion. Therefore, the total amount of landing processing for imported timber in Heilongjiang province was CNY 21.70 billion. By using Equation (1), the LQ of imported timber landing processing in Heilongjiang province was computed as 2.37, greater than 1.0, which indicated that there was a higher level of specialization in imported timber landing processing in this province. To identify the industrial clusters for imported timber landing processing in the future, the LQs of the major prefecture-level cities were computed and the results are presented in Table 2. It is shown that the LQs of Mudanjiang, Yichun, and Hegang were significantly greater than 1.0, which indicated that the specialization levels in timber processing were relatively higher, and high-quality industrial agglomeration existed in these cities. As a border city, Mudanjiang has become the largest Russian timber distribution center in China, which has absolute professional advantages and an obvious economy of scale. It has the ability to lead the development of industrial clusters of timber landing processing. The city of Yichun was a traditional forestry resource-based city with complete industrial supporting facilities. With the implementation of NFRPP, the supply of local forest resources was restricted in this city, so a significant part of the timber supply depended on importing from other sources such as Russian timber. Even though the LQ value of Yichun was far higher than that of Mudanjiang, it should be noted that the significantly lower average total import value of Yichun contributed to most of the difference between the two cities.

3.2. Spatial Analysis of Imported Timber Landing Processing Enterprises in Heilongjiang Province

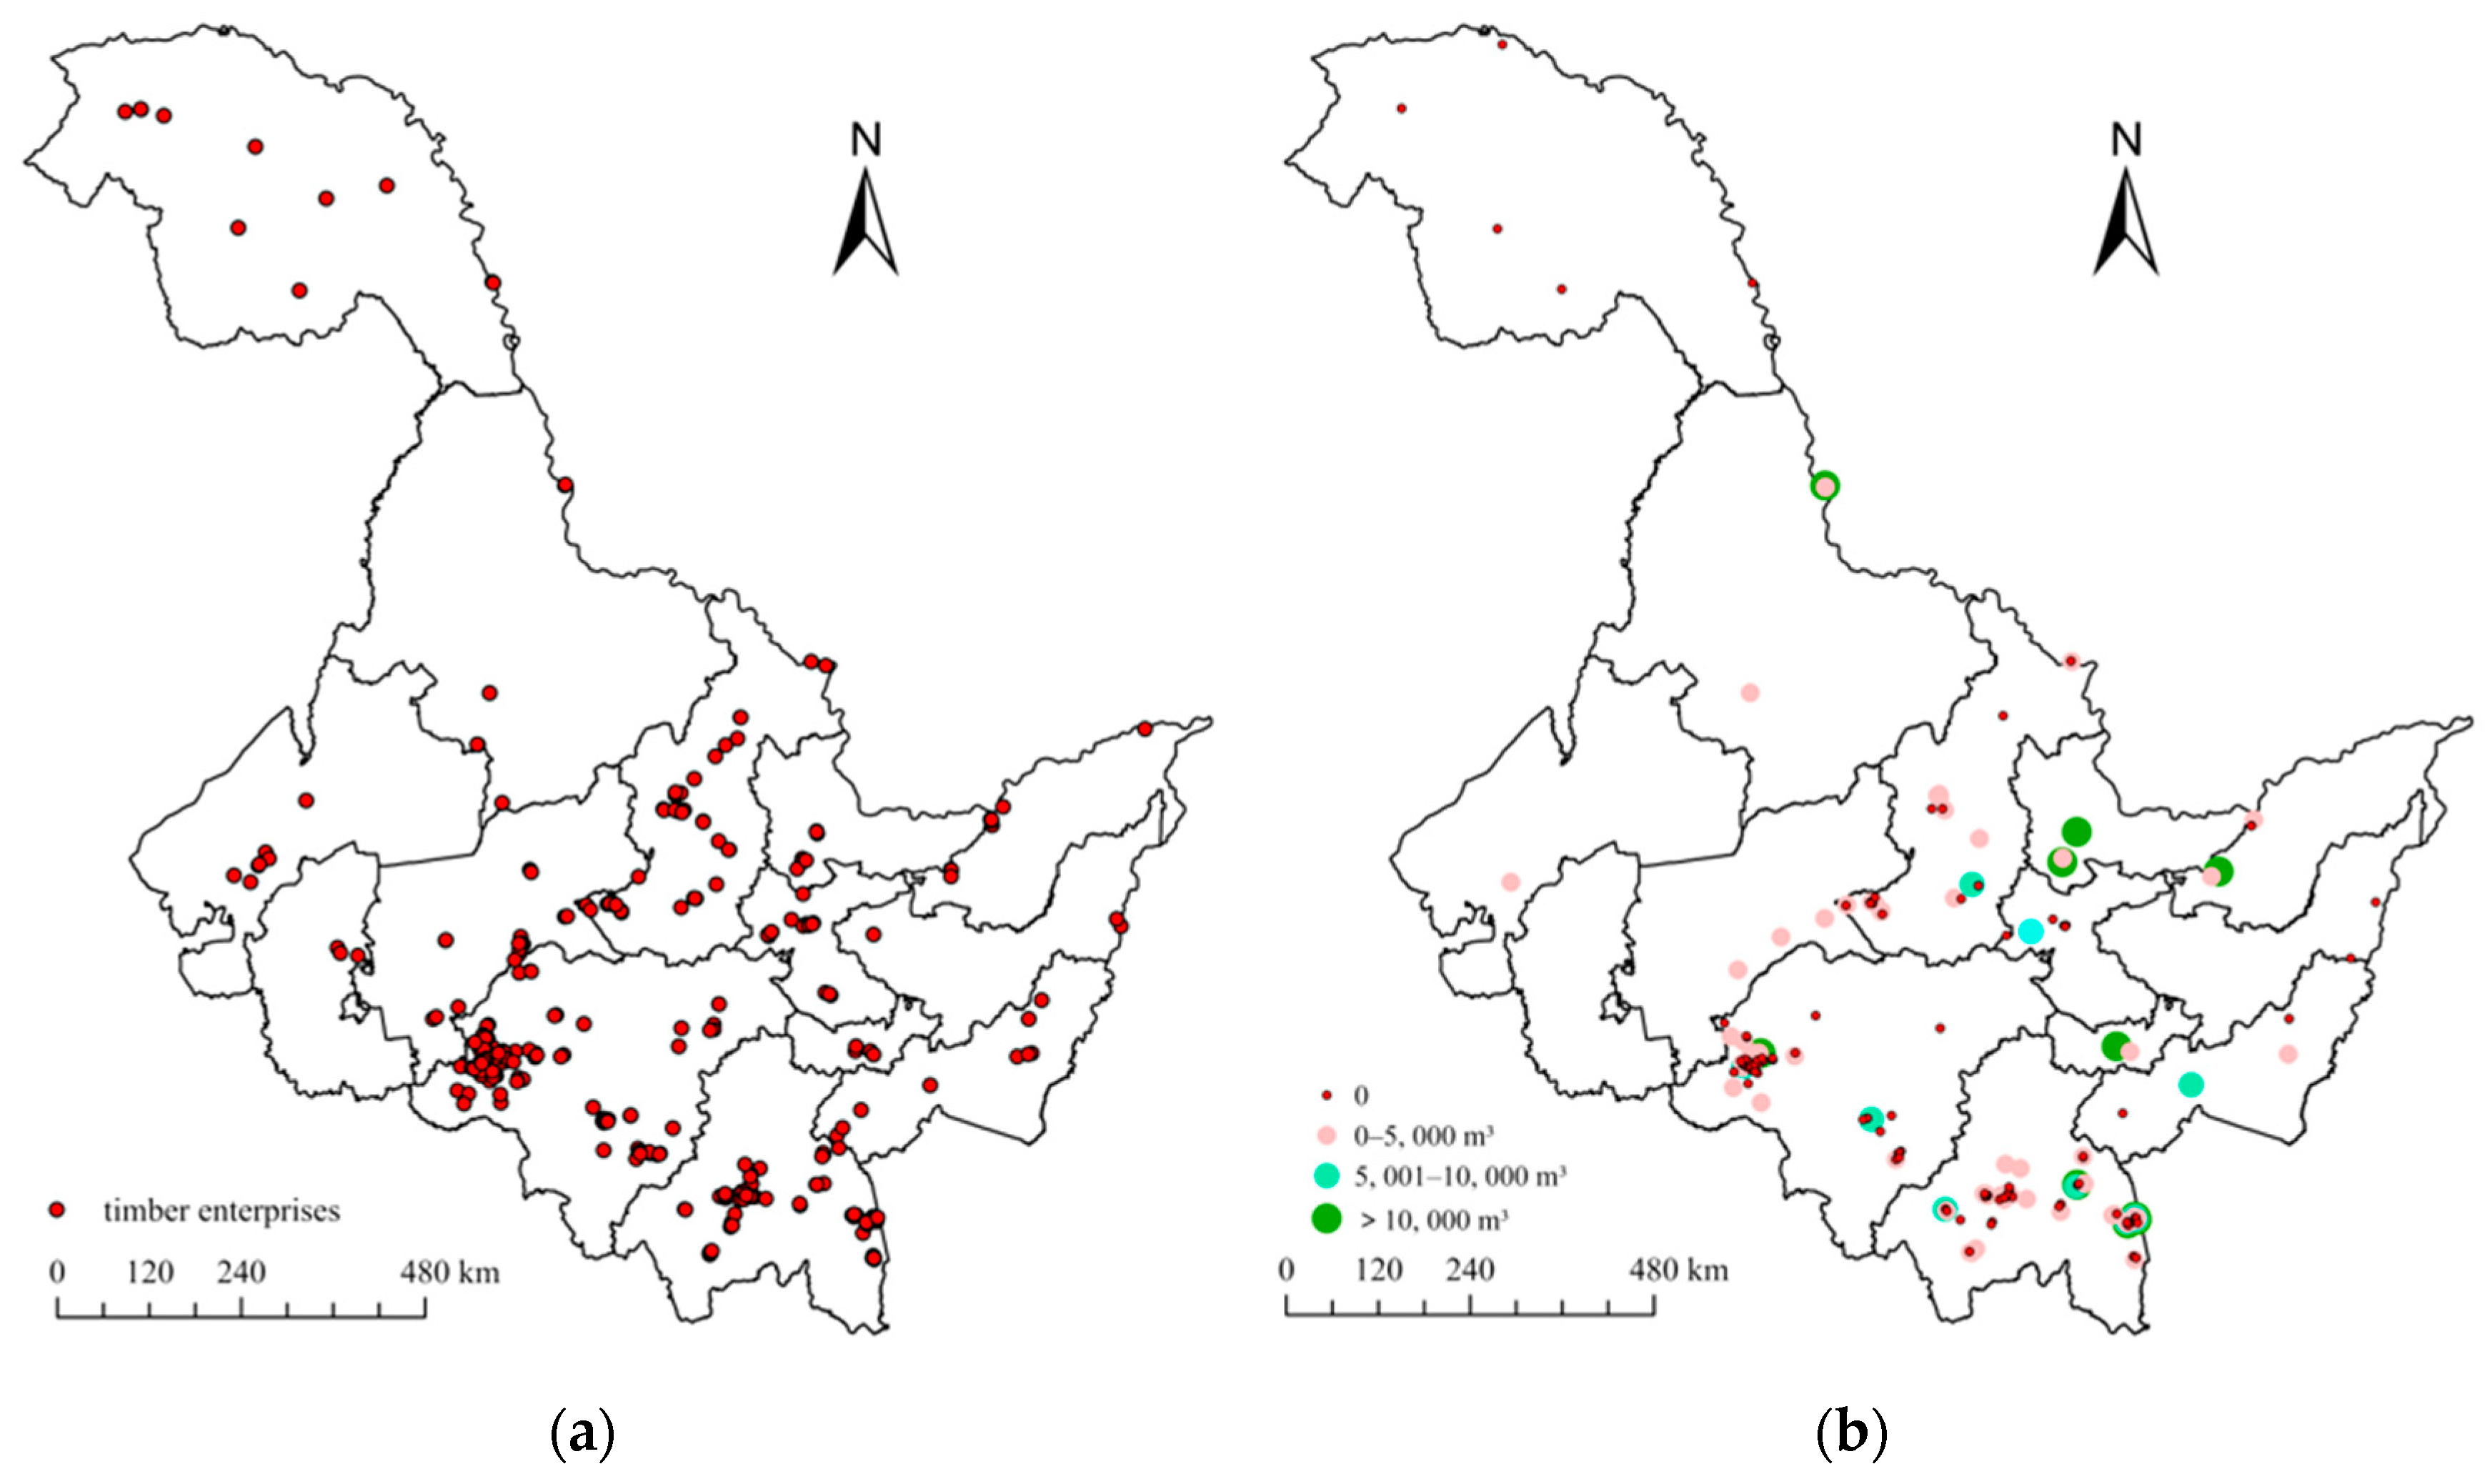
3.2.1. Spatial Distribution of Timber Landing Processing Enterprises

The distribution of 689 timber processing and furniture manufacturing enterprises in Heilongjiang province is illustrated in Figure 1a, and the 243 enterprises surveyed were visualized and classified into four categories of 0, 0–5000 m3, 5001–10,000 m3, and >10,000 m3 based on the volume of timber landing processing (Figure 1b). It is shown that the timber processing and furniture manufacturing enterprises in Heilongjiang Province were primarily located in the prefecture-level cities of Mudanjiang, Harbin, and Yichun, and most of the timber imports for landing processing were concentrated in Mudanjiang, accounting for 65.49% of the total timber landing processing in the province, followed by Qitaihe (7.29%), Harbin (7.2%), Yichun (5.20%), and Hegang (5.0%). In summary, the timber landing processing rate in Heilongjiang province was not very high; however, from the viewpoint of prefecture-level cities, especially the landing process concentration area of Mudanjiang, the timber landing processing rate was still very high. Currently, there are 331 timber processing and furniture manufacturing enterprises in the city of Mudanjiang, of which 79 enterprises belong to medium-sized and above enterprises (annual operating revenue > 500 million Chinese yuan), accounting for 46.74% of the total medium-sized and above enterprises in the same industry in Heilongjiang province. There are 49 medium-sized and above timber processing and furniture manufacturing enterprises in the county-level city of Suifenhe and the timber landing processing rate in this city reached 70%.

3.2.2. Spatial Clustering Analysis on Imported Timber Landing Processing Enterprises

The distance-based Ripley’s K function in ArcGIS was used to explore the spatial aggregation mode of the imported timber landing processing industry in Heilongjiang province at different spatial scales. Monte Carlo simulation was conducted to test the data significance at the confidence level of 99% through 999 simulations. The cluster analysis result of imported timber landing processing enterprises is illustrated in Figure 2, in which the horizontal axis is the spatial scale in km, the vertical axis is L(d), the red line represents the observation value, the blue line represents the predicted value, and the dashed lines are the upper and lower envelope traces. It is shown that the observed value was always significantly higher than the predicted value and the upper envelope trace as the spatial scale increased from 0 to 200 km, which indicated that the distribution of imported timber landing processing enterprises in Heilongjiang province showed significant spatial aggregation at different spatial scales.

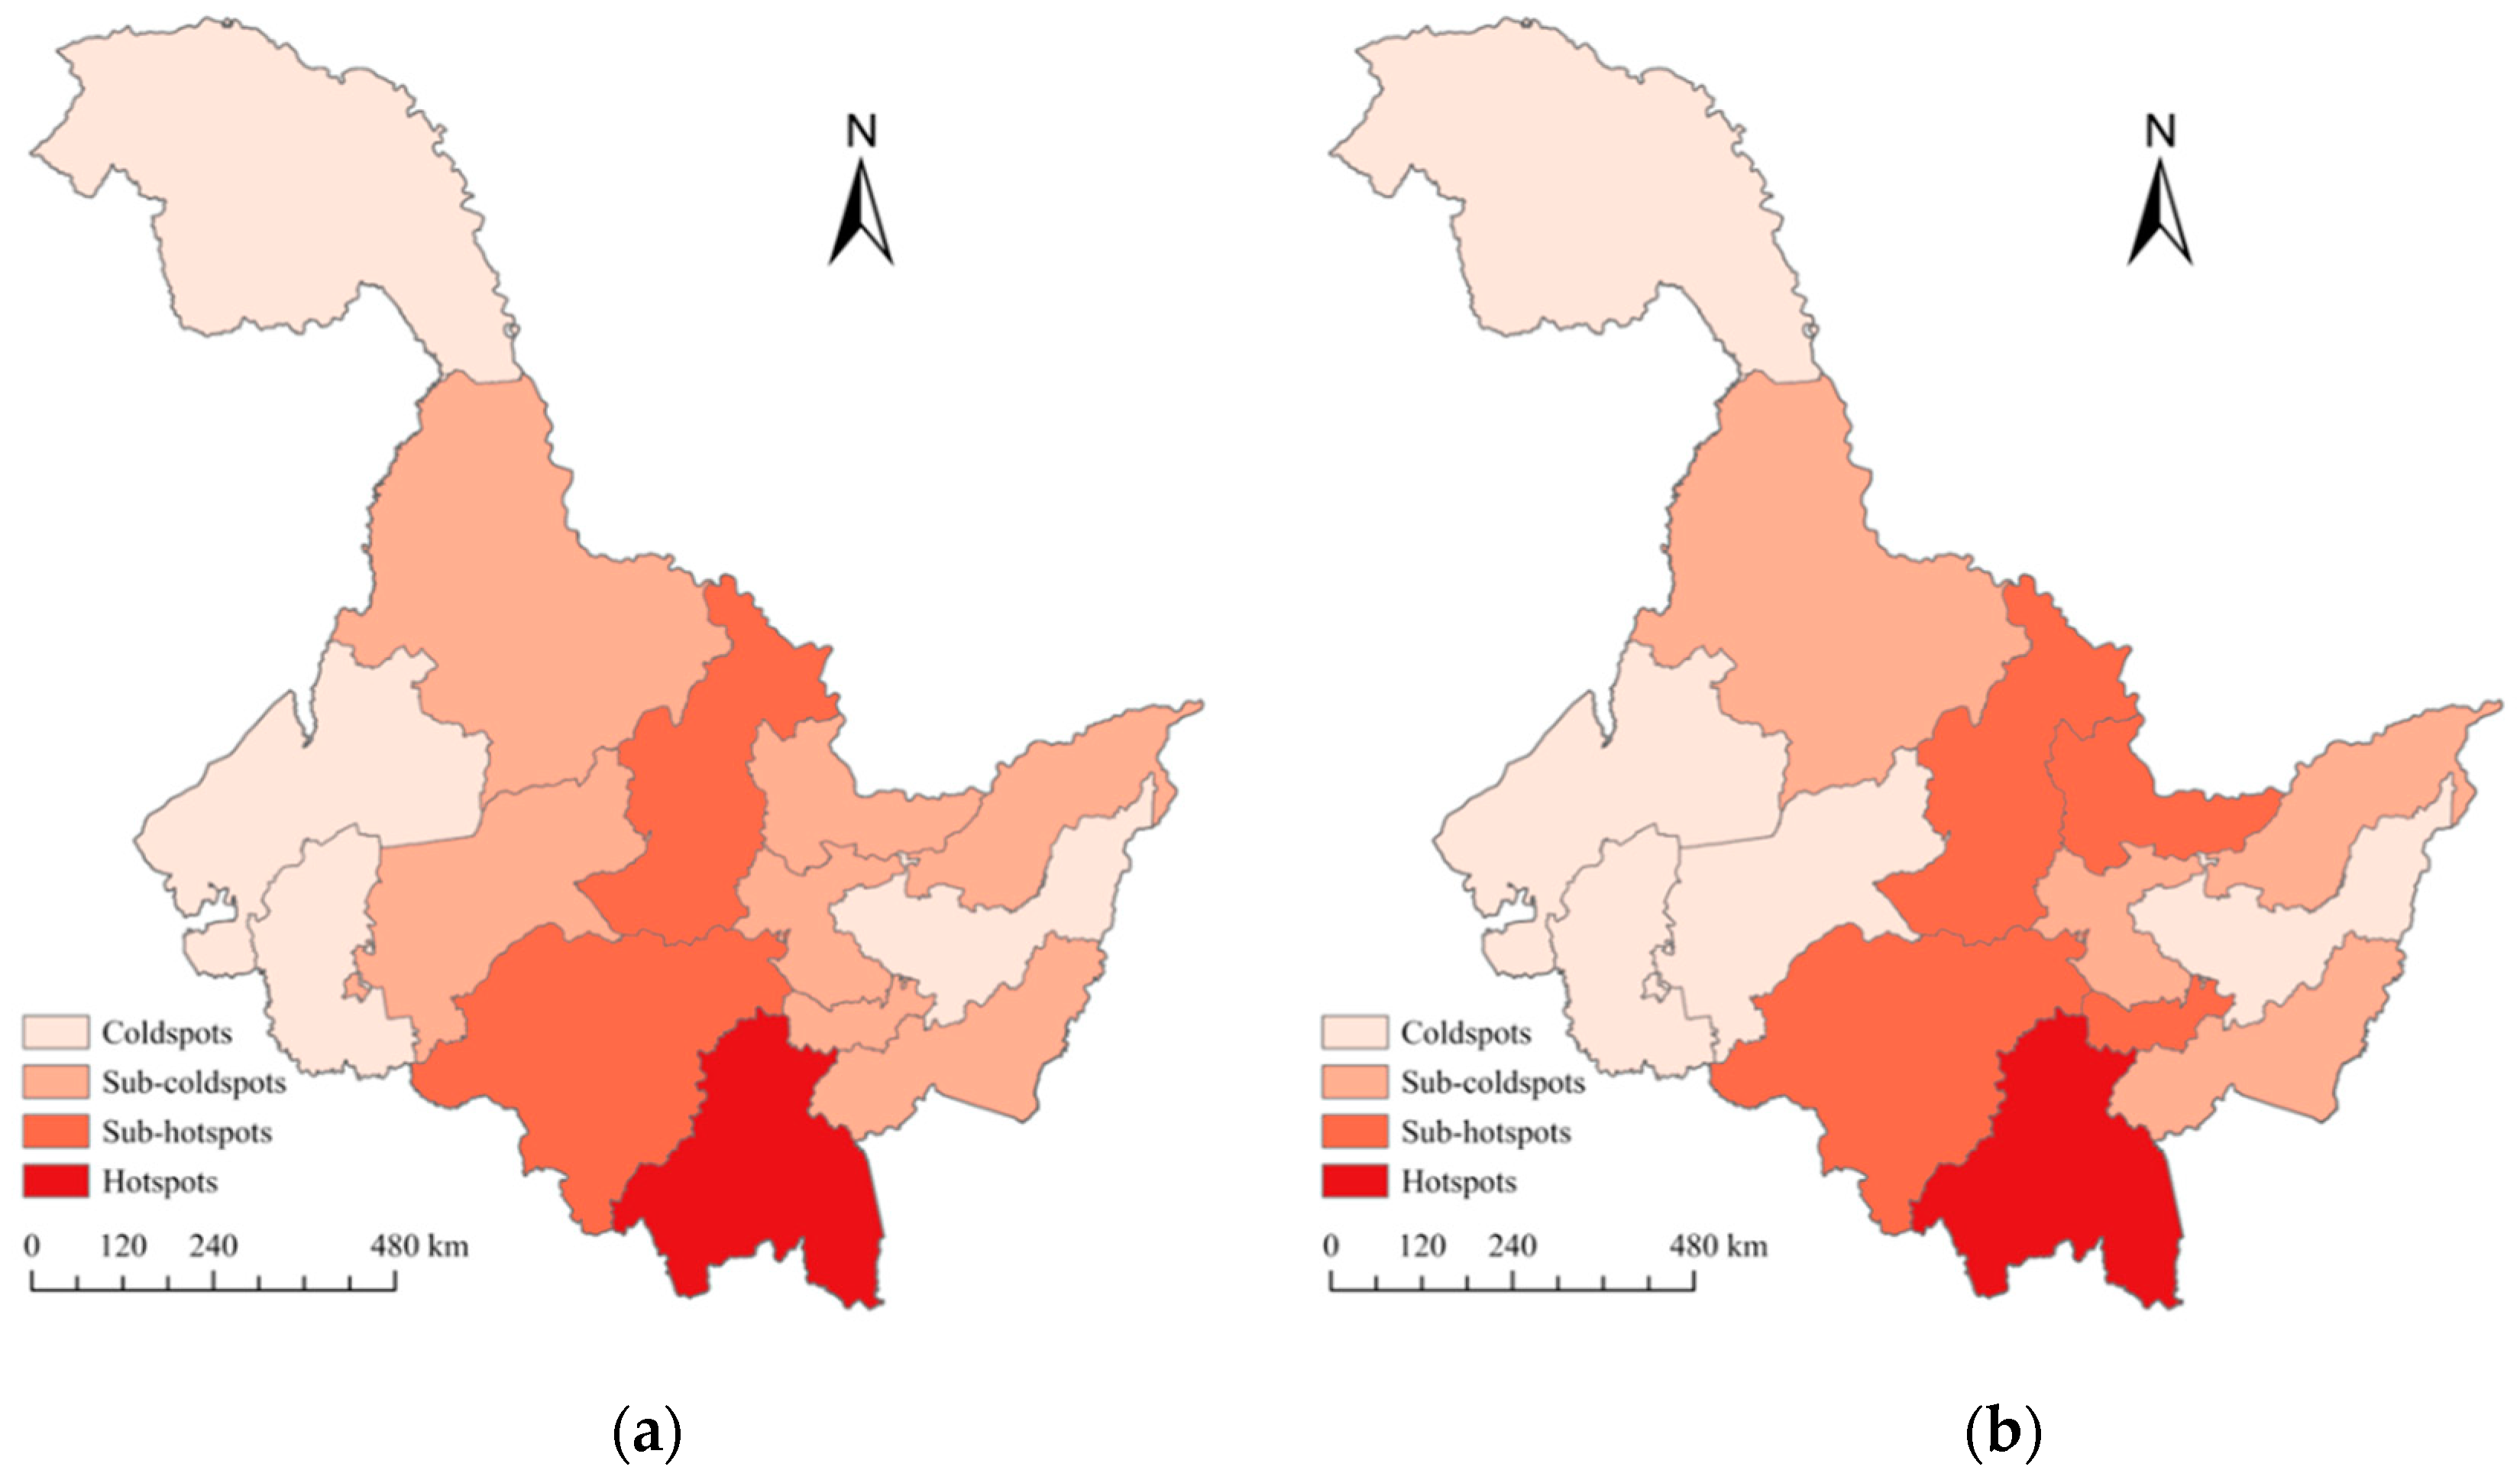
3.2.3. Hotspot Analysis on Imported Timber Landing Processing Enterprises

The hotspot analyses on the number of surveyed imported timber landing processing enterprises (volume > 0 m3) and landing processing volume by prefecture-level cities are shown in Figure 3. The Jenks Natural breaks classification method in the hotspot analysis of ArcGIS (Environmental Systems Research Institute, Inc., Redlands, CA, USA) was used to divide the prefecture-level cities into hotspots, sub-hotspots, sub-cold-spots, and cold-spots.
It can be seen from Figure 3 that the spatial distributions of the four categories (hotspots, sub-hotspots, sub-cold-spots, and cold-spots) in terms of the number of surveyed enterprises (volume > 0 m3) and landing processing volume were quite similar, indicating that the spatial pattern of the imported timber landing processing industry in Heilongjiang Province was generally consistent. The number of hotspots, sub-hotspots, sub-cold-spots, and cold-spots in terms of the number of surveyed enterprises was 1, 2, 5, and 5, respectively; while the number of hotspots, sub-hotspots, sub-cold-spots, and cold-spots in terms of landing processing volume was 1, 3, 4, and 5, respectively. Mudanjiang city was the only hotspot in Heilongjiang Province under the analyses of both cases. The sub-hotspots were primarily concentrated in the area of Harbin and Yichun. The sub-cold-spots included Jiamusi and Jixi. The cold spots were widely distributed, primarily in Qiqihar, Daqing, and Shuang Yashan and other regions. From a regional perspective, the imported timber landing processing industry in Heilongjiang Province was highly concentrated in the southeast of the province and highly discrete in the west and north. Industrial agglomeration gradually increased from north to south.

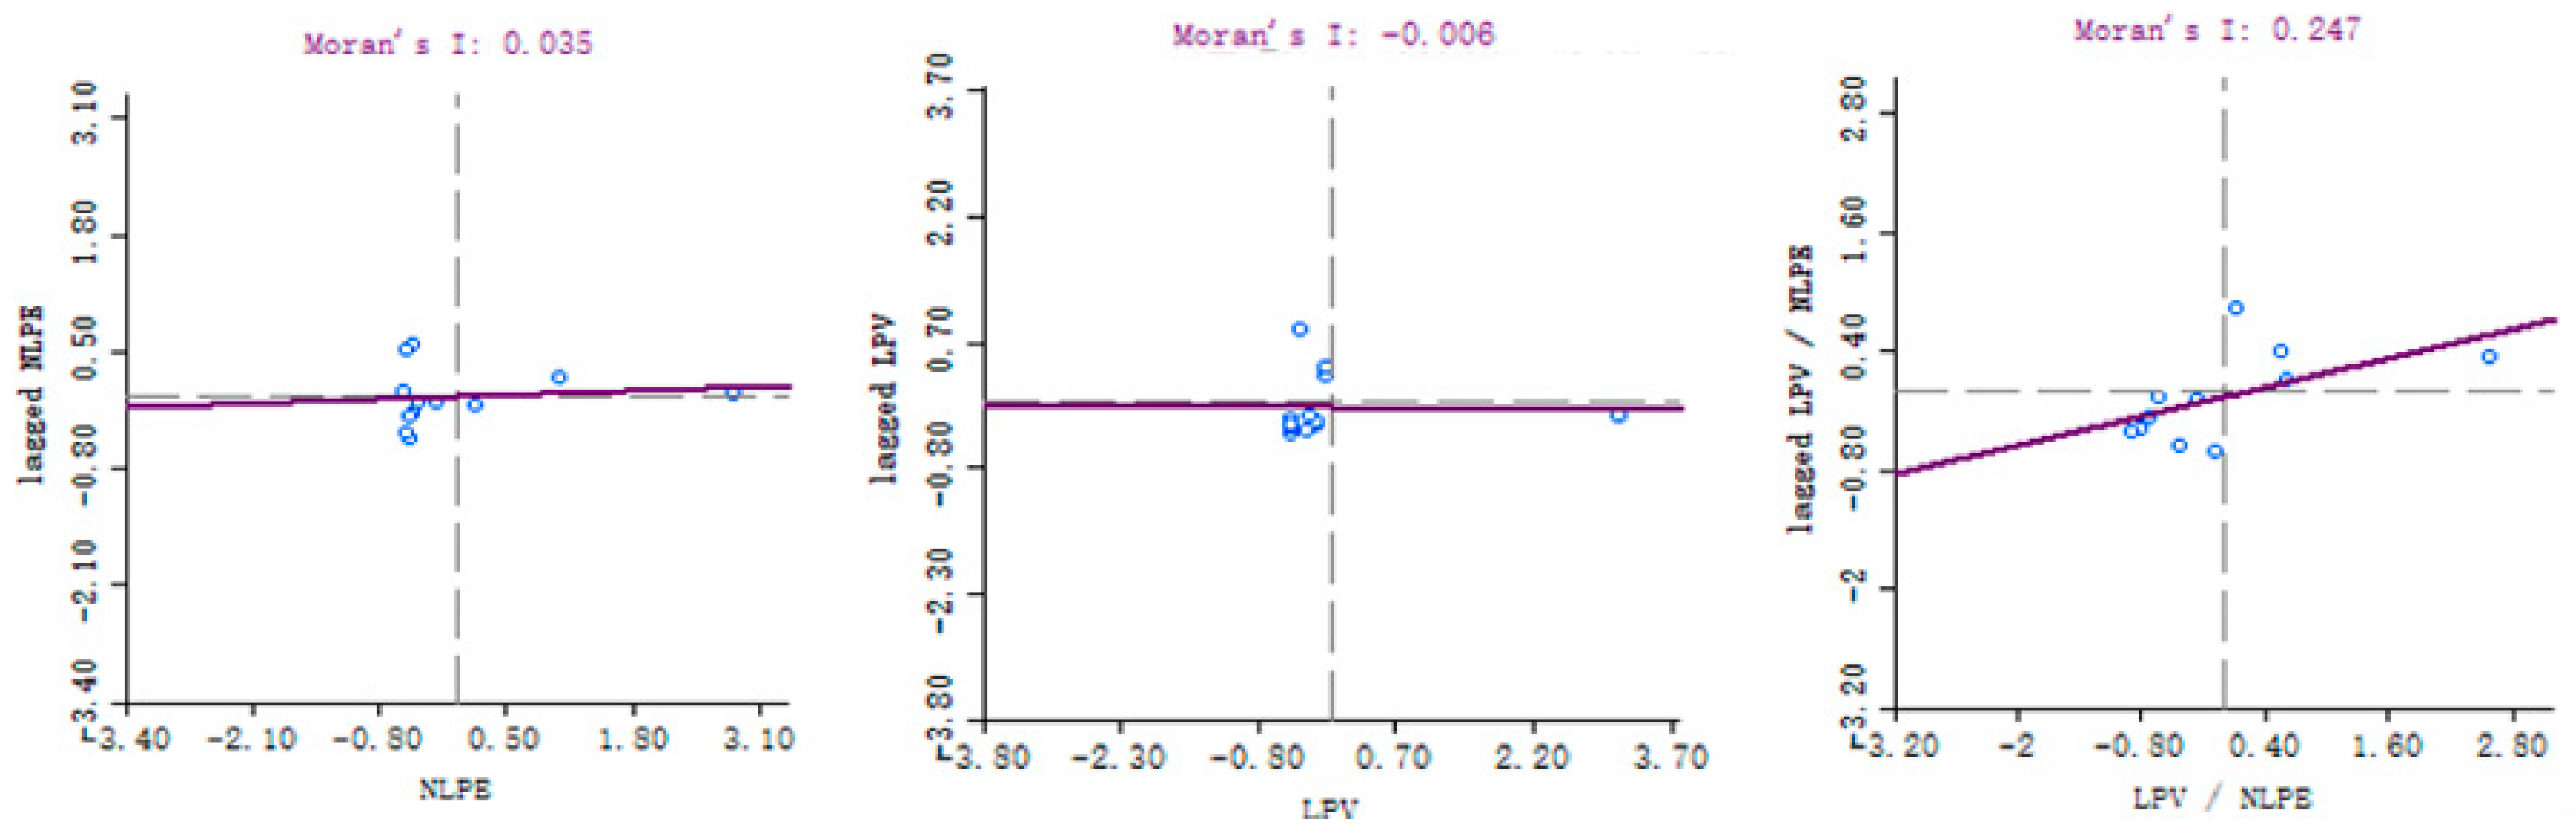
3.2.4. Spatial Autocorrelation on the Imported Timber Landing Processing Enterprises

In this study, global autocorrelation on the imported timber landing processing enterprises was conducted in terms of the number of landing processing enterprises (NLPE) and landing processing volume (LPV) by prefecture-level cities using a global Moran’s I index (Equation (4)). Moran’s I bivariate analysis was also conducted based on the two variables (NLPE/LPV). The results are shown in Figure 4. The global Moran’s I index for NLPE, LPV, and NLPE/LPV was 0.035, −0.006, and 0.247, respectively. When considering only the landing processing volume, Moran’s I < 0, indicating that the overall imported timber landing processing industry in Heilongjiang Province was negatively correlated, but the trend of negative correlation was not significant. However, when considering only the distribution of timber processing enterprises and the bivariate composite index, Moran’s I > 0, which indicated that the overall imported timber landing processing industry in Heilongjiang Province was positively correlated in both cases. Combined with the results of the cluster analysis on the imported timber landing processing industry, it can be seen that the overall imported timber landing processing industry was showing an aggregated distribution with a certain positive correlation.
To further explore the spatial relationship between each prefecture-level city and its neighboring urban areas, local spatial autocorrelation was conducted based on the bivariate composite index using Equation (5) and four types of local spatial autocorrelation were obtained, including high–high concentration (H–H), high–low concentration (H–L), low–high concentration (L–H), and low–low concentration (L–L). The results are presented in Table 3.
It is shown in Table 3 that the imported timber landing processing industry in Heilongjiang Province had formed different spatial distribution patterns. The H–H concentration was located in the city of Mudanjiang, which had a strong ability to drive the surrounding industries due to the well-developed timber processing industry. The H–L concentration was primarily in Harbin, the capital city of Heilongjiang province. The imported timber landing processing industry in Harbin was well developed, but there was a negative correlation with the neighboring cities such as Daqing and Suihua. The L–H aggregation was primarily in Daqing, Sui Suihua, Shuangyashan, and Jiamusi. The imported timber landing processing industries in these cities were not well developed, but the industrial development in the surrounding area such as Mudanjiang and Harbin were better. The L–L concentration was in Hegang, Qitaihe, Qiqihar, Yichun, Jixi, and Heihe. The imported timber landing processing industry development in these areas and the surrounding area were lower. In summary, the imported timber landing processing industry in Heilongjiang Province showed a polarization trend, with the industry primarily concentrated in the cities of Mudanjiang and Harbin, and spreading to Shuangyashan, Suihua, Daqing, Jiamusi, and other cities, which further verified that the spatial aggregation of the imported timber landing processing industry gradually increased from north to south.

4. Discussions

4.1. Comparison of Imported Timber Landing Processing Status in Heilongjiang Province

The frontier provinces have superior advantages in landing processing compared to other regions [24,25,26,27,53]. Landing processing of imported timber can not only increase local tax revenue and employment and stimulate local economic development but also promote the deep economic integration of China–Russia border areas [54,55]. The landing processing rate and the construction of industrial clusters for the imported timber are of great concern for the local government of Heilongjiang province. Our study revealed that there was obvious industrial agglomeration for imported timber landing processing in Heilongjiang province. However, the landing processing rate of imported timber in the province based on the survey data during 2019–2021 was only 22.53%, lower than the 30% landing processing rate at the provincial level during 2016–2019 reported by the local government [56]. The main reasons for this phenomenon included the irrational industrial structure, incomplete industrial chain, insufficient number of well-known brand enterprises, low level of technology innovation, etc. In addition, the outbreak of the epidemic, fluctuations in the RMB exchange rate, and Russian timber export policy also had impacts on the development of the local timber processing industry [57]. Therefore, some improvements are critically needed in order to accelerate the development of imported timber landing processing industrial clusters in the province.

4.2. Spatial Characteristics of Timber Landing Processing Industrial Clusters in Heilongjiang Province

It is also important to identify the hotspots of the imported timber landing processing industry in Heilongjiang province and understand the spatial autocorrelation relationships among different regions. Our results showed that the distribution of imported timber landing processing enterprises in Heilongjiang province presented significant spatial aggregation at various spatial scales. The aggregation degree of the imported timber landing processing industry gradually increased from north to south. Most of the timber landing processing enterprises were concentrated in the southeast part of the province, especially in the border city of Mudanjiang. Mudanjiang city was the only hotspot in Heilongjiang Province in terms of the number of landing processing enterprises and landing processing volume. The main reason is that Mudanjiang is the most important distribution center for imported timber landing processing in the province, which has three open ports to Russia (Suifenhe, Dongning, and Heihe ports), the largest volume of imported timber landed, and more than 40% of the province’s medium-sized and above timber processing enterprises [58]. As the capital city of Heilongjiang, Harbin and three other cities (Yichun, Qitaihe, and Hegang) were the sub-hotspots in terms of landing processing volume. These locations have advantages in terms of resource acquisition, technology innovation, and labor availability compared to the other cities.

4.3. Policy Implications

To better promote the development of the imported timber landing processing industry and construct high-quality industrial clusters in Heilongjiang province, some policy implications were put forward as follows:
(1) Cultivate and introduce some well-known brand enterprises to play leading and exemplary roles. Relying on the platforms of Harbin, Heihe, and Suifenhe areas in Heilongjiang Pilot Free Trade Zone, the local government can introduce more well-known brand enterprises to accelerate the imported timber landing processing by implementing a series of support policies and special reward funds. In addition, the local government should also focus on the cultivation of the local key enterprises by increasing the support for new investment, technological transformation, and capacity expansion in the aspects of tax revenue support, financing channels, and employment, and give these enterprises the same preferential policies as a business invitation when reaching a certain scale.
(2) Extend and improve the landing processing industrial chain to promote the sustainable development of industrial clusters and strengthen resource development cooperation with the surrounding countries such as Russia to extend the landing processing industrial chain. With the implementation of tightening timber export policies in Russia, it is essential to change the cooperation strategy with Russia, encourage domestic enterprises to build factories in Russia, and engage positively in building overseas timber processing parks with the integration of forest harvesting, timber processing, logistics, and service. What is more, it is of great importance to improve the whole industrial chain of imported timber landing processing in the province by integrating timber purchasing, processing, manufacturing, circulating, supplying auxiliary materials, and recycling of abandoned products so as to promote the upgrading of industrial structure.
(3) Improve the deep processing capacity of imported timber resources and increase the added value of the products. Encourage timber landing processing enterprises to increase investment and processing capacity in wood deep processing and implement the construction of terminal products. Enhance the competitiveness and innovation ability of the timber landing processing enterprises by strengthening the cooperation among timber processing enterprises, colleges and universities, and research institutes in information acquisition and analysis, technological innovation, and enterprise management. Strengthen the storage of technological talents by carrying out project cooperation and establishing a practice and training base for college students.
(4) Build major landing processing zones to drive the coordinated development of all regions in the province. In order to improve the aggregation of the timber landing processing industry, it is necessary to make good use of the border trade cooperation zones and export processing zones to carry out imported timber landing processing. The government should make more efforts to actively conduct overall planning for the development of the timber landing processing industry, coordinate the trade disputes and industrial division in the whole region, construct the linkage development mechanism of cities and counties for imported timber landing processing, and form larger cross-regional industrial clusters.

4.4. Limitations and Future Research

This study has provided data support and policy implications regarding imported timber landing processing in Heilongjiang province of China, which can also provide references for other regions in the world. However, it should be noted that there are also some limitations in this study. Due to the constraints of survey data availability, the accuracy of the study results (i.e., landing processing rate, location quotient, etc.) may be affected. In addition, the statistical data at the city level was not complete during the period of 2019–2022, so the location quotients by cities were not computed. Future research can be conducted by analyzing the impact factors of imported timber landing processing and the evolution of the industrial clusters for imported timber landing processing in Heilongjiang province.

5. Conclusions

In this study, the agglomeration analysis and spatial distribution pattern analysis on the imported timber landing processing industry in Heilongjiang province of China were conducted based on the survey data and statistical data during the period of 2019–2021. The following conclusions are drawn from the study:
(1) The LQ of the imported timber landing processing industry in Heilongjiang province of China was 2.37, which indicated that there was obvious industrial agglomeration in imported timber landing processing. Specifically, the cities of Mudanjiang, Yichun, and Hegang showed a higher level of specialization in imported timber landing processing. However, the landing processing rate of imported timber in the province was not high, dropping from 30% in 2016–2019 to 22.53% in 2019–2021.
(2) The distribution of imported timber landing processing enterprises in Heilongjiang province showed significant spatial aggregation at different spatial scales. The city of Mudanjiang was the only hotspot, followed by the sub-hotspots of Harbin, Yichun, Qitaihe, and Hegang, while the cold-spots were concentrated in Qiqihar, Daqing, Shuangyashan, and the Daxing’anling prefecture. On the whole, the aggregation degree of imported timber landing processing was higher in the southeast of Heilongjiang province, while the dispersion degree was higher in the west and north. Industrial agglomeration gradually increased from north to south.
(3) The imported timber landing processing industry showed a certain degree of positive correlation in consideration of the number of landing processing enterprises and landing processing volume. In addition, there was large spatial heterogeneity of the timber landing processing industry at the provincial scale. The timber landing processing industries in the cities of Daqing, Suihua, Shuangyashan, and Jiamusi were not well-developed, but there existed some certain development potential for these regions. The border city of Mudanjiang played a strong driving role in the development of timber processing industries in the surrounding cities such as Harbin, Qitaihe, and Jiamusi.

Author Contributions

Conceptualization, B.Z. and J.W.; methodology, B.Z, X.Q. and J.W.; software, B.Z. and Z.C.; validation, B.Z., Z.C. and J.W.; formal analysis, B.Z., X.Q. and X.H.; investigation, B.Z. and X.Q.; writing—original draft preparation, B.Z., X.Q. and X.H.; writing—review and editing, J.W.; supervision, J.W.; project administration, J.W.; funding acquisition, J.W. All authors have read and agreed to the published version of the manuscript.

Funding

This research was funded by the Key Research Topics of Economic and Social Development in Heilongjiang Province, grant number 22202.

Institutional Review Board Statement

Not applicable.

Informed Consent Statement

Not applicable.

Data Availability Statement

The data used to support the findings of this study are available from the corresponding author upon request.

Acknowledgments

The authors would like to acknowledge Heilongjiang Federation of Social Sciences for providing support to this study.

Conflicts of Interest

The authors declare no conflict of interest. The funder had no role in the design, execution, interpretation, or writing of the study.

References

  1. Zhang, H.; Zhao, Q.; Kuuluvainen, J.; Wang, C.; Li, S. Determinants of China’s lumber import: A bounds test for cointegration with monthly data. J. For. Econ. 2015, 21, 269–282. [Google Scholar] [CrossRef]
  2. Liu, N.W.; Cao, C.K.; Yu, X.X. China’s import and export trade of wood and wood products in 2020 and its outlook in 2021. China For. Prod. Ind. 2021, 58, 65–68. [Google Scholar]
  3. Jiang, Y.H.; Chen, Y.; Jiang, H.F. Trend and volatility of China’s timber imports. World For. Res. 2021, 34, 56–61. [Google Scholar]
  4. Han, B. Analysis on China timber imports trend. Constr. Sci. Technol. 2021, 20, 17–21. [Google Scholar]
  5. National Bureau of Statistics of China. Chinese Statistical Yearbook-2001; China Statistical Publishing House: Beijing, China, 2001.
  6. Roman, K. The Research on Russian Timber Export Trade to China. Master’s Thesis, Soochow University, Suzhou, China, 2021. [Google Scholar]
  7. Cheng, B.D. Current status, problem and countermeasures of timber import trade of Heilongjiang Province. For. Sci. Technol. 2009, 34, 60–63. [Google Scholar]
  8. Heilongjiang Bureau of Statistics. Heilongjiang Statistical Yearbook-2021; China Statistical Publishing House: Beijing, China, 2021.
  9. Xu, H.Z.; Wang, D.M.; Zhang, C. Analysis of pest epidemic situation of Russian timber imports through Heilongjiang Province. For. Sci. Technol. 2018, 43, 48–51. [Google Scholar]
  10. General Administration of Customs of the People’s Republic of China. China Customs Import and Export Data. Available online: Stats.customs.gov.cn (accessed on 20 October 2022).
  11. Liu, C. The Study on Sustainable Development of Timber Import Trade between Heilongjiang Province and Russia. Master’s Thesis, Northeast Forestry University, Harbin, China, 2010. [Google Scholar]
  12. An, C.S. Study on the competitiveness of enterprises trading with Russia in Heilongjiang Province. Stat. Consult. 2014, 3, 28–30. [Google Scholar]
  13. Li, X.L.; Liu, Z.G.; Tan, S. Evolution of spatial organization pattern of economic cooperation between Heilongjiang of China and Far East of Russia. Acta Geogr. Sin. 2022, 77, 2083–2096. [Google Scholar]
  14. Wu, R. Research on the imported Russian timber landing processing in Heilongjiang province. Sib. Stud. 2014, 41, 40–43. [Google Scholar]
  15. Zhang, D.M.; Xie, J.M. Literature review on industrial cluster. Contemp. Econ. 2017, 18, 140–141. [Google Scholar]
  16. Rosenfeld, S.A. Bringing business clusters into the mainstream of economic development. Eur. Plan. Stud. 1997, 5, 3–23. [Google Scholar] [CrossRef]
  17. Czamanski, S.; Ablas, L.A.d.Q. Identification of industrial clusters and complexes: A comparison of methods and findings. Urban Stud. 1979, 16, 61–80. [Google Scholar] [CrossRef]
  18. Lv, Y.W.; Sun, H. Research on identification of industrial cluster in Xinjiang based on the maximizing deviation and cluster analysis method. Sci. Technol. Manag. Res. 2012, 24, 174–178+183. [Google Scholar]
  19. Carroll, M.C.; Reid, N.; Smith, B.W. Location quotients versus spatial autocorrelation in identifying potential cluster regions. Annu. Reg. Sci. 2008, 42, 449–463. [Google Scholar] [CrossRef]
  20. Chen, L.F.; Yan, L. Identification of industrial clusters of oil and gas in China based on composite location quotient. China Popul. Resour. Environ. 2012, 22, 152–157. [Google Scholar]
  21. Titze, M.; Brachert, M.; Kubis, A. The identification of regional industrial clusters using qualitative input-output analysis (QIOA). Reg. Stud. 2011, 45, 89–102. [Google Scholar] [CrossRef]
  22. Cho, C. The identification of industrial clusters in the Chungbuk region in Korea. World Technopolis Rev. 2017, 6, 130–147. [Google Scholar]
  23. Arif, M.; Purnomo, D. Measuring spatial cluster for leading industries in Surakarta with Exploratory Spatial Data Analysis (ESDA). J. Ekon. Pembang. 2017, 18, 64–81. [Google Scholar] [CrossRef] [Green Version]
  24. Sun, D.Z.; Pang, B.; Yan, H.C. Analysis on advantage of imported wood landing process industry cluster in Inner Mongolia port area. China For. Prod. Ind. 2017, 44, 3–6. [Google Scholar]
  25. Yan, H.C. Analysis on dynamic mechanism of timber processing industry cluster’s development of border port city. China For. Prod. Ind. 2016, 43, 11–14. [Google Scholar]
  26. Pang, B. Analysis on the competitiveness advantages of timber processing industrial cluster in Manchuria based on diamond theory model. Mod. SOE Res. 2019, 10, 130–131. [Google Scholar]
  27. Pang, B.; Sun, D.Z. Development status and problem analysis of the industry cluster in Inner Mongolia port. J. Inn. Mong. Univ. Financ. Econ. 2016, 14, 37–40. [Google Scholar]
  28. Haggett, P. Locational Analysis in Human Geography; Edward Arnold: London, UK, 1965. [Google Scholar]
  29. Moral, S.S. Industrial clusters and new firm creation in the manufacturing sector of Madrid’s metropolitan region. Reg. Stud. 2009, 43, 949–965. [Google Scholar] [CrossRef] [Green Version]
  30. Morar, S. Geographical specialization in Spanish agriculture before and after integration in the European Union. Reg. Sci. Urban Econ. 2004, 34, 309–320. [Google Scholar] [CrossRef] [Green Version]
  31. Li, H.Y. Research on Industrial Spatial Layout of Dashiqiao Based on ESDA; Shenyang Jianzhu University: Shenyang, China, 2019. [Google Scholar]
  32. Pominova, M.; Gabe, T.; Crawley, A. The stability of location quotients. Rev. Reg. Stud. 2022, 52, 296–320. [Google Scholar] [CrossRef]
  33. Wang, T.T.; Chen, G.X.; Yuan, F. Spatial-temporal aggregation characteristics and indication of metallogenic cores of Magmatite in the middle and lower reaches of the Yangtze River based on GIS. Geogr. Geo-Inf. Sci. 2020, 36, 19–25. [Google Scholar]
  34. She, B.; Zhu, X.Y. Spatial distribution and evolution of city management events based on the spatial point pattern analysis: A case study of Jianghan District, Wuhan City. Prog. Geogr. 2013, 32, 924–931. [Google Scholar]
  35. Kosfeld, R.; Eckey, H.F.; Lauridsen, J. Spatial point pattern analysis and industry concentration. Ann. Reg. Sci. 2011, 47, 311–328. [Google Scholar] [CrossRef] [Green Version]
  36. Xu, S.H. Hotspot analysis on the domestic tourist source market in Wuhan. J. Hubei Univ. Arts Sci. 2020, 41, 51–57. [Google Scholar]
  37. Galia, T.; Tichavský, R.; Wyżga, B.; Mikuś, P.; Zawiejska, J. Assessing patterns of spatial distribution of large wood in semi-natural, single-thread channels of Central Europe. Catena 2022, 215, 106315. [Google Scholar] [CrossRef]
  38. Getis, A.; Ord, J. The analysis of spatial association by use of distance statistic. Geogr. Anal. 1992, 24, 189–206. [Google Scholar] [CrossRef]
  39. Yu, W.H.; Ai, T.H.; Yang, M.; Liu, J.P. Detecting “Hot Spots” of facility POIs based on kernel density estimation and spatial autocorrelation technique. Geomat. Inf. Sci. Wuhan Univ. 2016, 41, 221–227. [Google Scholar]
  40. Mitchell, L.; Frank, M.R.; Harris, K.D.; Dodds, P.S.; Danforth, C.M. The geography of happiness: Connecting Twitter sentiment and expression, demographics, and objective characteristics of place. PLoS ONE 2013, 8, e64417. [Google Scholar] [CrossRef] [Green Version]
  41. Zhu, Y.L.; Jing, C.F.; Fu, J.Y. Analysis of space-time pattern of robbery crime based on space-time cube. Sci. Surv. Mapp. 2019, 44, 132–138+145. [Google Scholar]
  42. Wang, Z.L.; Liu, X.J.; Lu, J. Construction and spatial-temporal analysis of crime network: A case study on Burglary. Geomat. Inf. Sci. Wuhan Univ. 2018, 43, 759–765. [Google Scholar]
  43. Zhang, F.; Song, X.N.; Dong, H.Z. Analysis of the green competitiveness index of manufacturing industry and its evolution characteristics of time and space pattern in Guangdong-Hong Kong-Macao greater bay area. China Soft Sci. 2019, 10, 70–89. [Google Scholar]
  44. García-Palomares, J.C.; Gutiérrez, J.; Mínguez, C. Identification of tourist hot spots based on social networks: A comparative analysis of European metropolises using photo-sharing services and GIS. Appl. Geogr. 2015, 63, 408–417. [Google Scholar] [CrossRef]
  45. Shan, B.Y.; Zhang, Z.X.; Chen, Y.Q. Analysis methods of spatio-temporal patterns and its empirical applications —A case of study of manufacturing industry of Shandong Province. J. Geomat. Sci. Technol. 2021, 38, 624–630+638. [Google Scholar]
  46. Chen, Z.L.; Wu, J.Z. Evolution of logistics industry carbon emissions in Heilongjiang Province, China. Sustainability 2022, 14, 9758. [Google Scholar] [CrossRef]
  47. Wu, J.; Yang, A.T. Empirical analysis of economic spatial structure of Beijing-Tianjin-Hebei region based on ESDA and CSDA. China Soft Sci. 2010, 3, 111–119. [Google Scholar]
  48. Ord, J.K.; Getis, A. Local spatial autocorrelation statistics: Distributional issues and an application. Geogr. Anal. 1995, 27, 286–306. [Google Scholar] [CrossRef]
  49. Zhou, X.F. Study on Spatial and Temporal Evolution of Regional Economic Differences between Northeast Provincial Border-Regions Based on ESDA-GIS; Northeast Normal University: Changchun, China, 2019. [Google Scholar]
  50. Anselin, L. Local indicators of spatial association-LISA. Geogr. Anal. 1995, 27, 93–115. [Google Scholar] [CrossRef]
  51. Wu, D.L.; He, W.; Li, Z. Spatial-temporal difference and influencing factors of cultivated land Use efficiency of Sichuan Province based on DEA-ESDA. J. Sichuan Norm. Univ. 2020, 43, 270–276. [Google Scholar]
  52. Silva, G.S.; Amarante, P.A.; Amarante, J.C.A. Agricultural clusters and poverty in municipalities in the Northeast Region of Brazil: A spatial perspective. J. Rural Stud. 2022, 92, 189–205. [Google Scholar] [CrossRef]
  53. Yang, Y.Y. Analysis on the characteristics and problems of border trade processing industry cluster in Guangxi Border Port. J. Cust. Trade 2021, 42, 112–121. [Google Scholar]
  54. Zhao, M.X. Study on the Impacts of Ending Entirety Deforestation on Wood Processing Industry of Heilongjiang Province; Northeast Forestry University: Harbin, China, 2017. [Google Scholar]
  55. Wu, J.Z.; Wang, H.; Liu, B.F. Influencing factors for the import of wooden forest products in Heilongjiang Province. J. Northeast For. Univ. 2021, 49, 95–99. [Google Scholar]
  56. Northeast Network. Summary of the Business Work in Heilongjiang Province during the 13th Five-Year Plan. Available online: https://baijiahao.baidu.com/s?id=168483243472921060&wfr=spider&for=pc (accessed on 10 October 2022).
  57. Li, H.J.; Cheng, B.D.; Yang, J. The influence of epidemic situation on the layout of global value chain of timber industry. J. Agrotech. Econ. 2022, in press. [Google Scholar]
  58. Jia, Q.W. Study on Timber Industry Development in Mudanjiang City; Jilin University: Changchun, China, 2014. [Google Scholar]
Figure 1. Distribution of all timber processing and manufacturing enterprises and surveyed imported processing enterprises in Heilongjiang province. (a) All enterprises; (b) Surveyed enterprises.
Sustainability 15 05061 g001
Figure 2. Cluster analysis results of imported timber landing processing enterprises (Distance unit: km).
Sustainability 15 05061 g002
Figure 3. Hotspot analysis of the distribution of imported timber landing processing enterprises. (a) Number of surveyed enterprises (processing volume > 0); (b) Landing processing volume.
Sustainability 15 05061 g003
Figure 4. Global autocorrelation of timber landing processing enterprises in Heilongjiang province.
Sustainability 15 05061 g004
Table 1. Summary of surveyed imported timber landing processing enterprises by cities.
CityNo. of Timber Processing EnterprisesNo. of Surveyed EnterprisesSurvey Percentage (%)Landing Processing Volume (1000 m3)
Harbin158493158.86
Suihua18527.782.38
Qiqihar9111.120.50
Jiamusi341029.4133.23
Mudanjiang33112638.06535.38
Heihe9333.3327.52
Jixi12866.6717.04
Hegang1033040.50
Qitaihe536059.56
Shuangyashan41250.00
Daqing300-
Daxing’anling21628.57-
Yichun752837.3342.54
Total68924335.27%817.51
Table 2. Location quotients of imported timber landing processing by major prefecture-level cities in Heilongjiang Province during 2019–2021 (Unit: billion CNY).
CityPrefecture-Level CitiesHeilongjiang ProvinceLQ
Average Timber Landing Processing ValueAverage Total Import ValuePercentage (%)Average Timber Landing Processing ValueAverage Total Import ValuePercentage (%)
Harbin1.72125.351.3721.701346.31.610.85
Mudanjiang13.27218.986.0621.701346.31.613.76
Jiamusi1.0537.782.7721.701346.31.611.72
Yichun1.064.1925.3921.701346.31.6115.75
Heihe0.7633.042.3021.701346.31.611.43
Hegang1.2220.196.0221.701346.31.613.74
Table 3. LISA aggregation analysis for imported timber landing processing industry in Heilongjiang province.
Cluster CategoryRegionDevelopment Trends
H–HMudanjiangAttract surrounding industries to gather
H–LHarbinHigh level of self-development, but negatively correlated with surrounding
L–HShuangyashan, Suihua, Jiamusi, DaqingLow level of development, but has potential for development
L–LHegang, Qitaihe, Qiqihar, Yichun, Jixi, HeiheLow level of self and surrounding development
Disclaimer/Publisher’s Note: The statements, opinions and data contained in all publications are solely those of the individual author(s) and contributor(s) and not of MDPI and/or the editor(s). MDPI and/or the editor(s) disclaim responsibility for any injury to people or property resulting from any ideas, methods, instructions or products referred to in the content.

