1. Introduction
The globalization and containerization of cargo have resulted in a substantial increase in the geographical distance over which goods are transported, the establishment of new trade routes, and an upsurge in trade throughput at ports. Currently, maritime transport handles close to 80% of international trade [
1]. Port congestion, which represents a significant challenge for maritime logistics [
2], has been found to cause terminal delays, equipment bottlenecks, environmental pollution, suboptimal port operations, and ultimately, economic losses [
3]. The exacerbation of port congestion can also be attributed to the growth of vessel sizes [
4], regulatory requirements, the formation of alliances among shipping lines, and opposition to port expansion projects [
5]. The expansion of intermodal transport and the growth of trade volume have resulted in a transformation from monopoly to intense competition among ports, leading to increased levels of port congestion [
6].
Ports play a crucial role in economic development, hence, decision-makers invest substantial amounts to alleviate congestion and increase port capacity in order to maintain sustainable port development and retain competitiveness with rival ports. However, the increase in infrastructure investment may result in disordered and wasteful competition among ports [
7]. This phenomenon is particularly significant in port clusters, which are characterized by ports that are situated near each other and share similar transport networks and hinterlands [
8]. It was observed that solely relying on increased port capacity and infrastructure planning with a competitive mindset may not yield the expected benefits in ports within a cluster. The competition between ports within a cluster also does not yield any benefits for the service providers operating in these ports, and they benefit more from mutual development through cooperation [
9]. The expectation that expanding port capacity would simply solve the congestion problem is also not practical for many ports. Specifically, for city ports, expanding capacity may be challenging due to land restrictions and high expansion costs, making effective management of port capacity the key to reducing congestion and maintaining financial stability [
10]. To address the increasing demand, terminal operators and ports in clusters have begun to cooperate at various levels, including planning, strategy, and real-time operations [
11].
According to Wang et al. [
12], the effective utilization of resources within port clusters, which are spatially close to each other, increases the competitiveness of the entire cluster when competing with rival port clusters. This can be achieved through the cooperation schemes of port cluster subsystems, such as integrated port governance, which involves a centralized decision-making process by a governing body (e.g., government, port authority) to allocate functions to each port in the cluster, thus, overcoming fragmented governance. Additionally, the integration of capacities of ports within clusters plays a crucial role in reducing overinvestment and avoiding the waste of assets [
13].
The integration of management and supply chains in port clusters is studied and practiced in several regions [
7], such as the Yangtze River port clusters in China [
14], the Port of Rotterdam in the Netherlands [
15], and the Kobe–Osaka port cluster in Japan [
16]. Despite various proposed cooperation schemes and integrated port governance models for port clusters [
17], these models often focus on macroscopic perspectives and overlook the operational benefits. To date, there is no study in the literature that evaluates the benefits of vessel transfer policies and dry port integration in the context of cooperative schemes for port clusters at the operational and inter-port levels. The use of the microsimulation method for evaluating the benefits of cooperative schemes for port clusters is also lacking.
In this study, an attempt is made to address the scarcity of operational level studies on inter-port cooperation within clusters and contribute to the existing literature on the topic. The study aims to do so by proposing a cooperation scheme with a vessel transfer policy and the implementation of a dry port. The contribution of the paper to the literature is threefold: (1) Development of a conceptual cooperation model that targets regulation of cargo transport between cluster ports to reduce port storage capacities, increase mutual berth utilization, and decrease vessel waiting times utilizing a dry port; (2) To thoroughly examine the operational level of the study using a microsimulation model. Hence, it aims to provide a deeper and more comprehensive evaluation of the advantages of the cooperation model for port clusters; (3) Development of a novel decision-making module and its integration with the microsimulation model for improving the vessel transfer policy performance.
In the first part of this article, a literature review on the concepts of port cooperation and competition is provided. The proposed dry port integrated port cooperation policy and DES modeling are discussed in the methodology section. Then, the model execution scenarios and model results are presented and discussed considering performance metrics. In the conclusion, the benefits of port cooperation for the port cluster are summarized.
2. Literature Review
Research on port cooperation and competition covers a wide range of topics and can be categorized as intra-port, inter-port, port integration, and coopetition concepts. Cooperation between ports or terminals generally refers to the collaboration between operators in various areas to reduce environmental costs and enjoy economic benefits while competing to increase profits [
18]. The concept of port cooperation first emerged in the early literature as a way to reduce port costs through a win–win strategy [
19]. Among inter-port studies, Hoshino [
20] emphasized the importance of cooperation among minor Japanese ports to compete with Korean and Chinese ports and proposed tactical management strategies. Kavirathna et al. [
11] evaluated the competitiveness of Colombo and Southeast Asian ports as transshipment hubs using a generalized cost approach and discrete port choice model.
There is a large body of literature on port cooperation, which can be categorized based on the methods used, such as mathematical models, simulation, and empirical approaches. Port integration and cooperation studies have often used empirical analysis and case reports [
21]. For example, Inoue [
16] examined the Kobe and Osaka port alliance through expert interviews, a review of the port’s policy history, and a comparative analysis of alliance practices. Stamatović et al. [
22] used data analysis and semi-structured expert interviews to study Adriatic ports and concluded that a joint marketing approach was useful for attracting new services to the region. Ferretti et al. [
23] used a multiple-case analysis approach to evaluate port planning and concession management for Italian ports. Wu and Yang [
24] used comparative analysis to propose integration and cooperation schemes for Chinese ports.
Mathematical models were extensively used for capacity optimization studies to compare regional cooperation [
25]. Ruan et al. [
26] proposed a port-service network consisting of a hub and multiple ports, allowing small and medium-sized ports to share their services with the hub. A mixed-integer linear programming (MILP) model was developed to find the optimal solutions while considering budget constraints. Kavirathna et al. [
27] used a non-linear mathematical optimization model and generalized cost approach to assess the intra-port competition and found that operator incentives for terminal ownership scenarios can vary. Kavirathna et al. [
28] used MILP to evaluate terminal cooperation at the intra-port level by implementing a vessel transfer policy to minimize total delay and maximize total profit. Takebayashi and Hanoka [
29] proposed a bi-level optimization model for maximizing benefits and minimizing costs for different port cooperation strategies and congestion levels.
Other studies have used economic theory models to address cooperation and integration. Guo et al. [
30] used real options theory to make optimal investment and exit decisions for ports under uncertainty and congestion and found that port clusters increased capacity utilization by 30% after integration. Game theory, which describes the interactions between multiple rational players to achieve optimal returns, was widely applied to the issue of port competition. Wang et al. [
31] used dynamic game and port demand scenarios to evaluate competitive equilibrium strategies for close-distance ports and inter-port integration. Yuan et al. [
32] implemented dynamic game scenarios for two ports to compare pricing, demand in competition, and cooperation applications using service substitution level and Pareto equilibrium. Cui and Notteboom [
33] used a game theory model to investigate the effects of cooperation for public and private ports, considering private-objective and service differentiation levels. Ishii et al. [
34] examined the effects of inter-port competition by applying a game-theoretical approach with Nash equilibrium, constructing a non-cooperative game-theoretic model where each port strategically selects charges at the time of capacity investment. The vessel-based Nash bargain solutions were formulated to evaluate strategies for sharing port capacity with maximum profit [
35]. Game theory has also been used to analyze port cooperation under emission taxes for public and private ports [
33] and to reduce port charges through linear cooperation [
36].
Despite the abundance of mathematical modeling approaches in the literature, simulation-based analysis of port cooperation and integration is limited. For example, Lee and Low [
37] employed resource profile simulation with random variables to study the management of quay, yard, and gate resources for the capacity requirements of intra-port terminal cooperation. Ref. [
38] utilized numerical simulation methods to examine port competition by coupling game theory models, and Ref. [
39] implemented a numerical simulation method to investigate the effects of regional port integration. In the context of disaster prevention, Liu et al. [
40] employed numerical simulation to evaluate the benefits of port cooperation and found that it led to a reduction in the total risk cost. Microsimulation methods were also utilized for the assessment of port and hinterland logistics. Irannezhad et al. [
41] proposed a multi-agent simulation model with reinforcement learning to analyze vertical and horizontal cooperation for hinterland port logistics. Recently, Nikghadam et al. [
42] implemented agent-based simulation modeling to evaluate the in-port cooperation of terminal service providers in the Port of Rotterdam. Their findings reveal that waiting times can be reduced by up to 30%, and both service providers can improve their performance through such cooperation.
In addition to cooperation and port integration studies, the topic of dry ports was extensively researched in the literature. A dry port refers to an inland intermodal terminal that has a direct connection to ports with high-capacity transport and allows customers to handle standardized units, similar to a port. Dry ports play a critical role in improving connectivity between the port and hinterland, inducing port and regional development, coordinating supply chains [
43], expanding port capacity [
10], and increasing city–port container flow [
6]. The use of dry ports was also highlighted in studies on improving port cooperation [
44]. Kramberger et al. [
45] used a port-choice model with linear programming and the analytical hierarchy process to evaluate the use of dry ports for expanding a port’s hinterland. Chang et al. [
46] utilized data envelope analysis and regression models to examine the effect of Chinese dry ports on regional competition and concluded that implementing integrated management strategies for ports and dry ports is crucial for improving freight transport efficiency. Discrete event simulation (DES) and agent-based simulation modeling were widely used to evaluate the capacity of the port and dry port hinterland logistics and railway freight transport for dry ports [
47].
In the literature, the cooperation of ports was extensively analyzed at the intra-port and inter-port levels, considering factors that influence port decisions on competition and cooperation, such as service price, service quantity, the service level of ports, port privatization level, and emission tax. Mathematical and empirical models, such as MILP, numerical simulation, and game theory models, are commonly used in the literature, while a few studies have used DES modeling to analyze cooperation and integration. Moreover, the existing literature has not addressed the practical level of inter-port cooperation within a port cluster incorporating the integration of dry ports, nor has it provided quantitative results on the advantages of inter-port collaboration utilizing simulation models. Furthermore, no study has been identified that examines dry ports as a means for enhancing port cooperation and establishes a definitive cooperation model at the operational level while explicitly defining the model’s mechanism. This study aims to fill the gaps in the literature by proposing a cooperation scheme that utilizes vessel transfer policy, dry port integration, and a new port selection decision-making module to improve operational-level port cooperation for clusters.
4. Model Execution Scenarios
In the study, several DES model alternatives were implemented. the DES-C model represents the conventional transport model with port competition in a cluster without a dry port, which serves as a baseline for the model validation phase. Additional DES models were created to evaluate the benefits of cooperation and the effects of different vessel transfer policies. The DES1, DES2, and DES3 models were devised to address a hypothetical scenario that pertains to two neighboring ports in a port cluster, possessing identical characteristics and sharing a nearby dry port. The DES1 model evaluates cooperation with an active PSM in a port cluster. The DES2 model represents a port competition scenario with a shared dry port in which vessels proceed to a predetermined port without routing at a PSP. In contrast, the DES3 model represents DPC policy in which a suitable port is selected based on the number of routing and waiting vessels without using PSM. The port selection decision for the DES3 model is made by using Equation (1).
where
and
, respectively, represent the number of routing vessels and the number of waiting vessels at the “i-th” port. If the total number of vessels in the queues is equal, a port is randomly assigned based on a discrete probability distribution DISC(0.5,1).
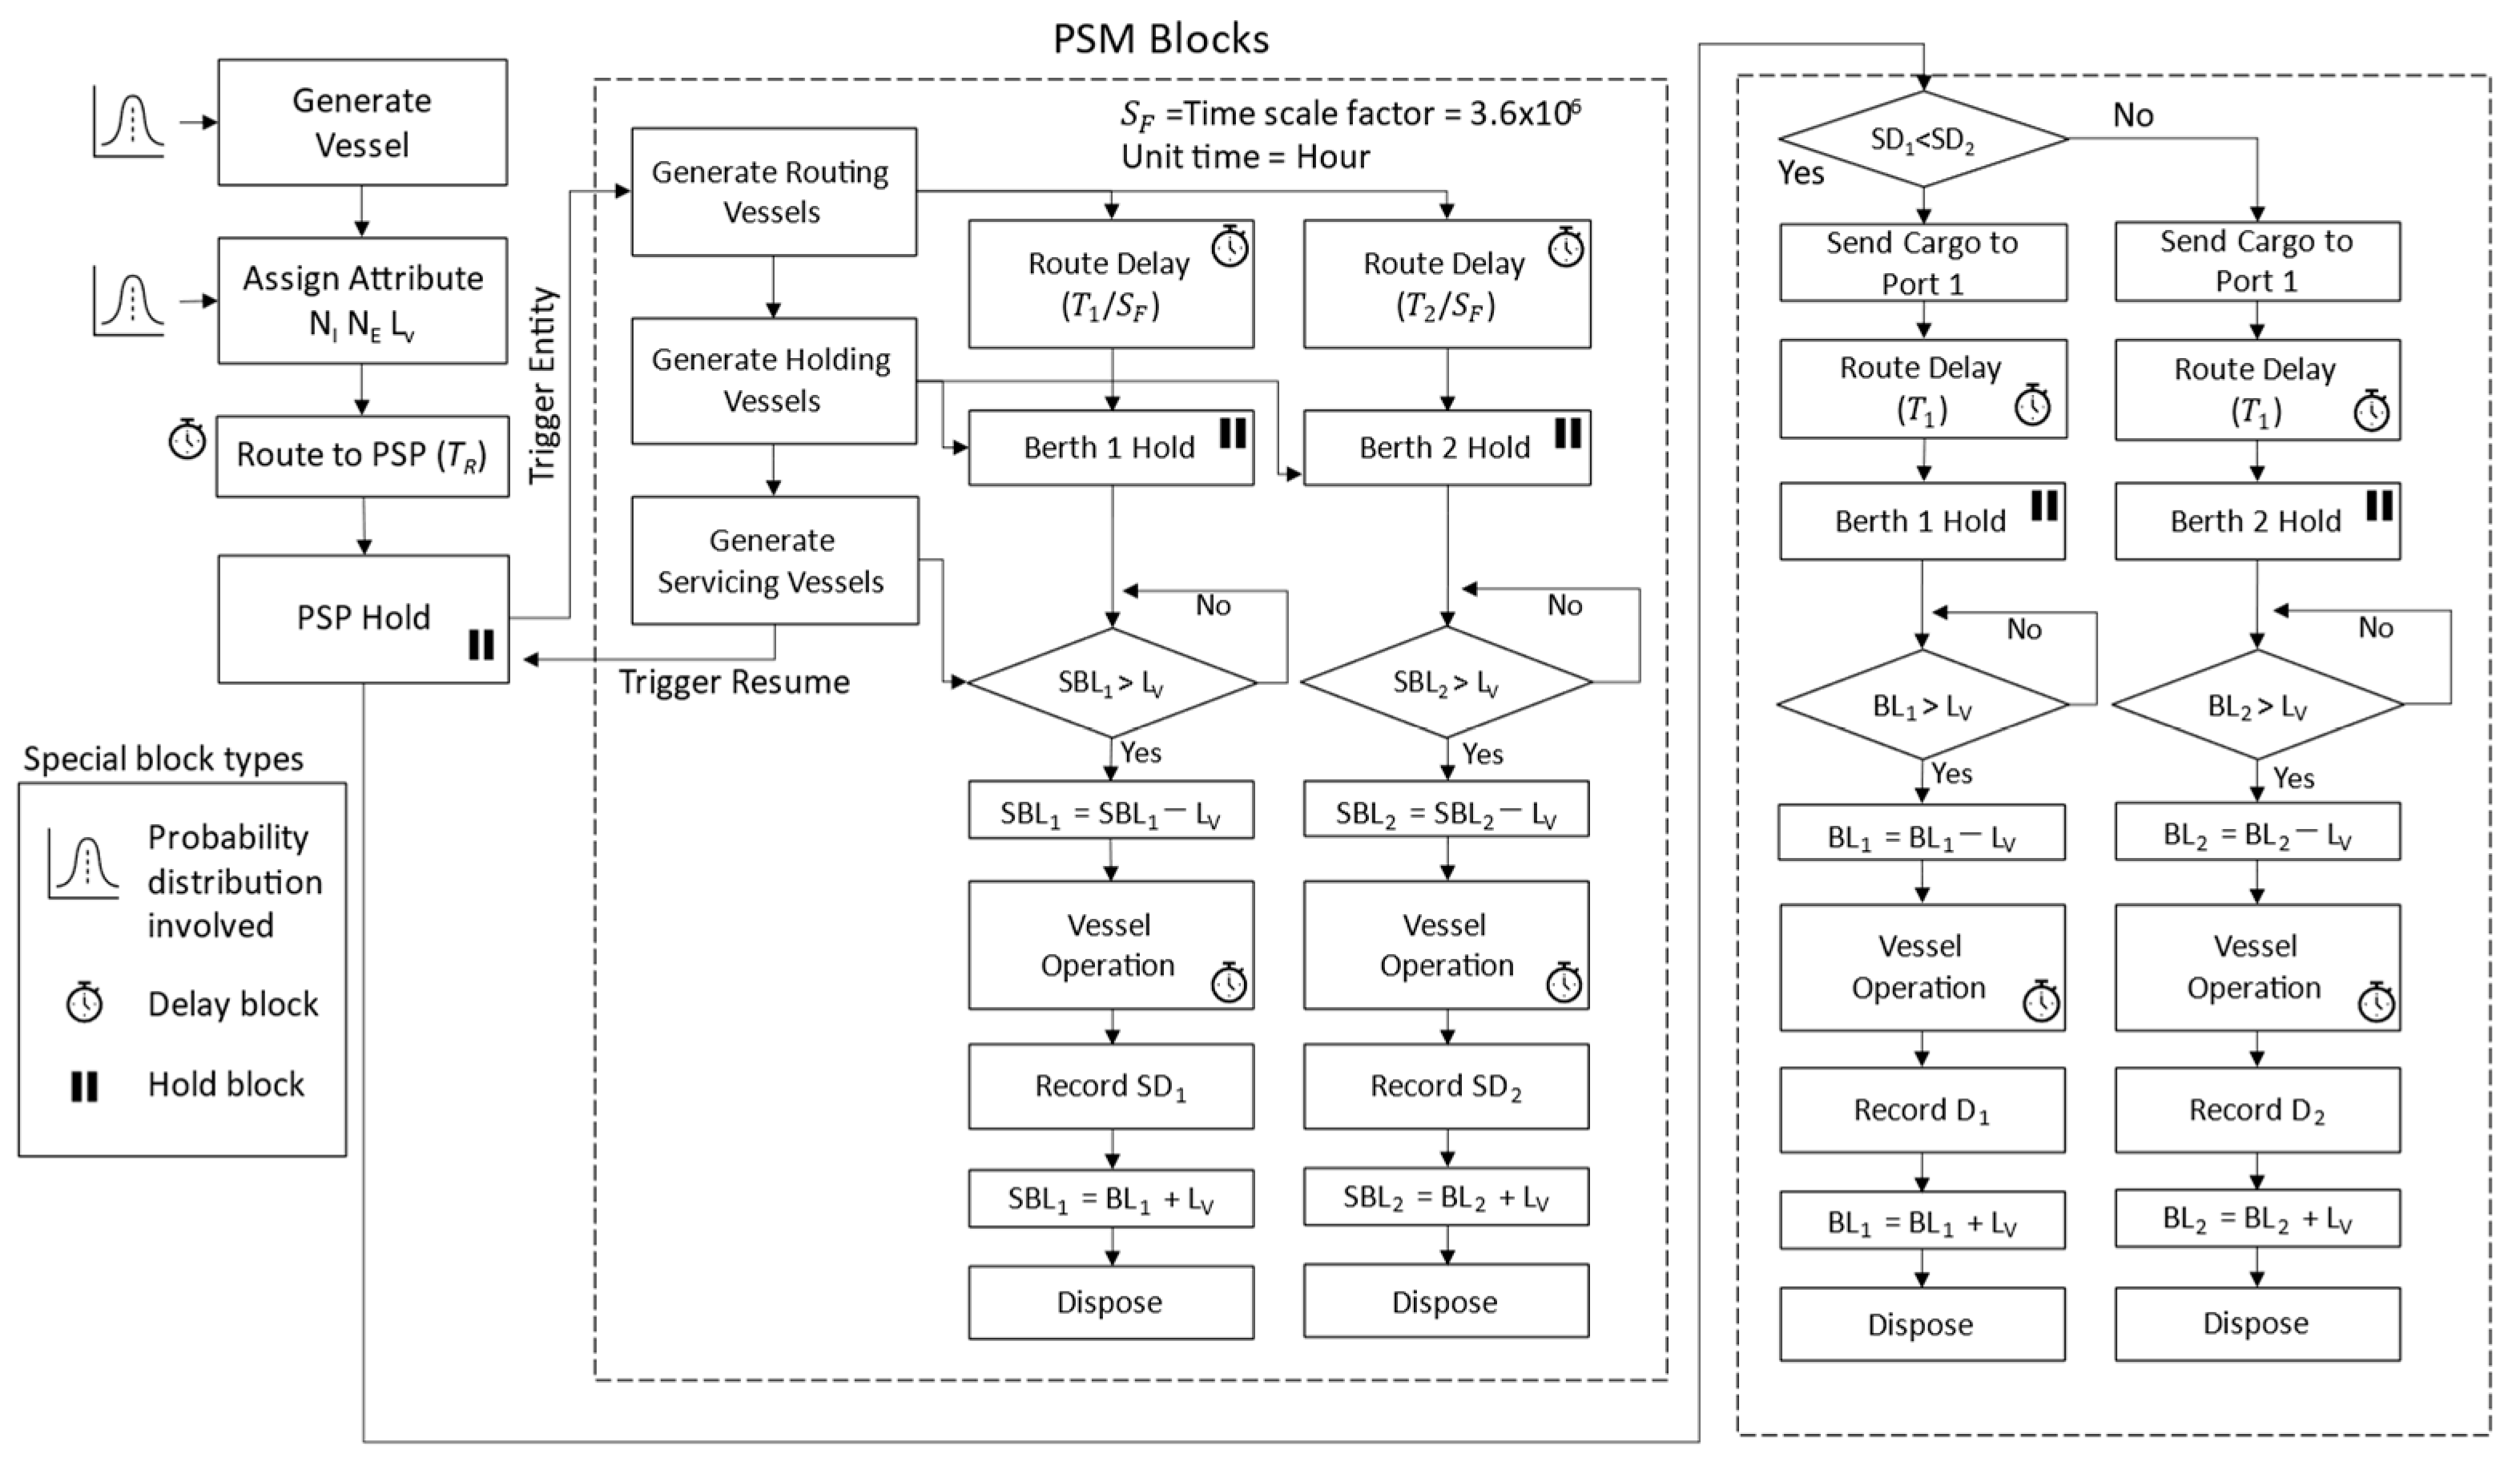
Figure 7 shows the schematic diagrams of the DES models, and
Table 1 provides a summary of the characteristics of DES model policies. Notably, the DES models do not account for detailed container import processes. It is assumed that import containers are transported from the port to the dry port and delivered after a specified dwell time. The control parameters of the model are encapsulated in
Table 2.
To ensure a realistic scenario, the values of
,
, and
were selected in accordance with data on a typical city port in Izmir, Turkey [
10]. The DES model was replicated 100 times (
= 100). Additionally, several assumptions were made about vessel operations and container arrival processes as follows: (1) The arrival time of an export container for a specific vessel was assigned using a uniform probability distribution with a minimum of 0 and a maximum of
days (UNIF (0,
)) before the arrival of the vessel to the PSP. (2) The berthing queues followed a first-come-first-served policy. (3) Port congestion (equipment or storage bottlenecks) or operational disruptions such as equipment maintenance was not included in the scenarios. (4) Since the ports were identical,
and
were assumed to be 24 h and,
were 350 m. (5) The vessel clearance length was 20 m. (6) The vessel handling rate was determined using a triangular distribution with the minimum, most probable, and maximum values of 3 min, 4 min, and 5 min, respectively. (7) The vessel interarrival times were assumed to follow an exponential distribution with a mean of hours 3.2 h to 4.0 h (
= 3.2 h to
= 4.0 h) for the high and low traffic scenarios. (8) Various factors affect port selection from the perspective of vessel operators, and therefore, the desirability of ports within a cluster may vary. In order to eliminate the impact of these factors, it is assumed that the desirability of both ports is similar in terms of cost (cargo handling cost, vessel operation costs, etc.) and service factors (processing time, port delays, congestion, etc.). A hypothesis is posited that the two ports being examined possess equidistant proximity to dry ports, with similar one-day transfer times for cargo. Additionally, it is presupposed that the connectivity of their respective hinterlands is uniform and holds no bearing on the decision-making process for port selection by vessels.
To compare the outcomes of the model and ascertain the presence of any significant differences between the means of the outputs from the DES model, an independent samples
t-test is employed. The null and alternative hypothesis of the two-sample
t-test for unpaired data is defined as
:
=
and
:
≠
, and the test statistic “
” is determined using the Equation (2).
where
and
are the sample sizes,
and
are the sample means, and
and
are the sample variances. If
, then
is rejected where
is the critical value of the t distribution with
ν degrees of freedom with a significance level of
α. For the details of the hypothesis testing, refer to Law [
52].
6. Results and Discussion
To assess the performance of the DES models, metrics were defined based on the port inventory and vessel delays. The average number of containers per day in a port storage area was represented by
. The delays experienced by vessels were categorized into two types: berth waiting delays (
) and vessel operation delays (
).
refers to the period a vessel has to wait before being accepted to dock at the port, while
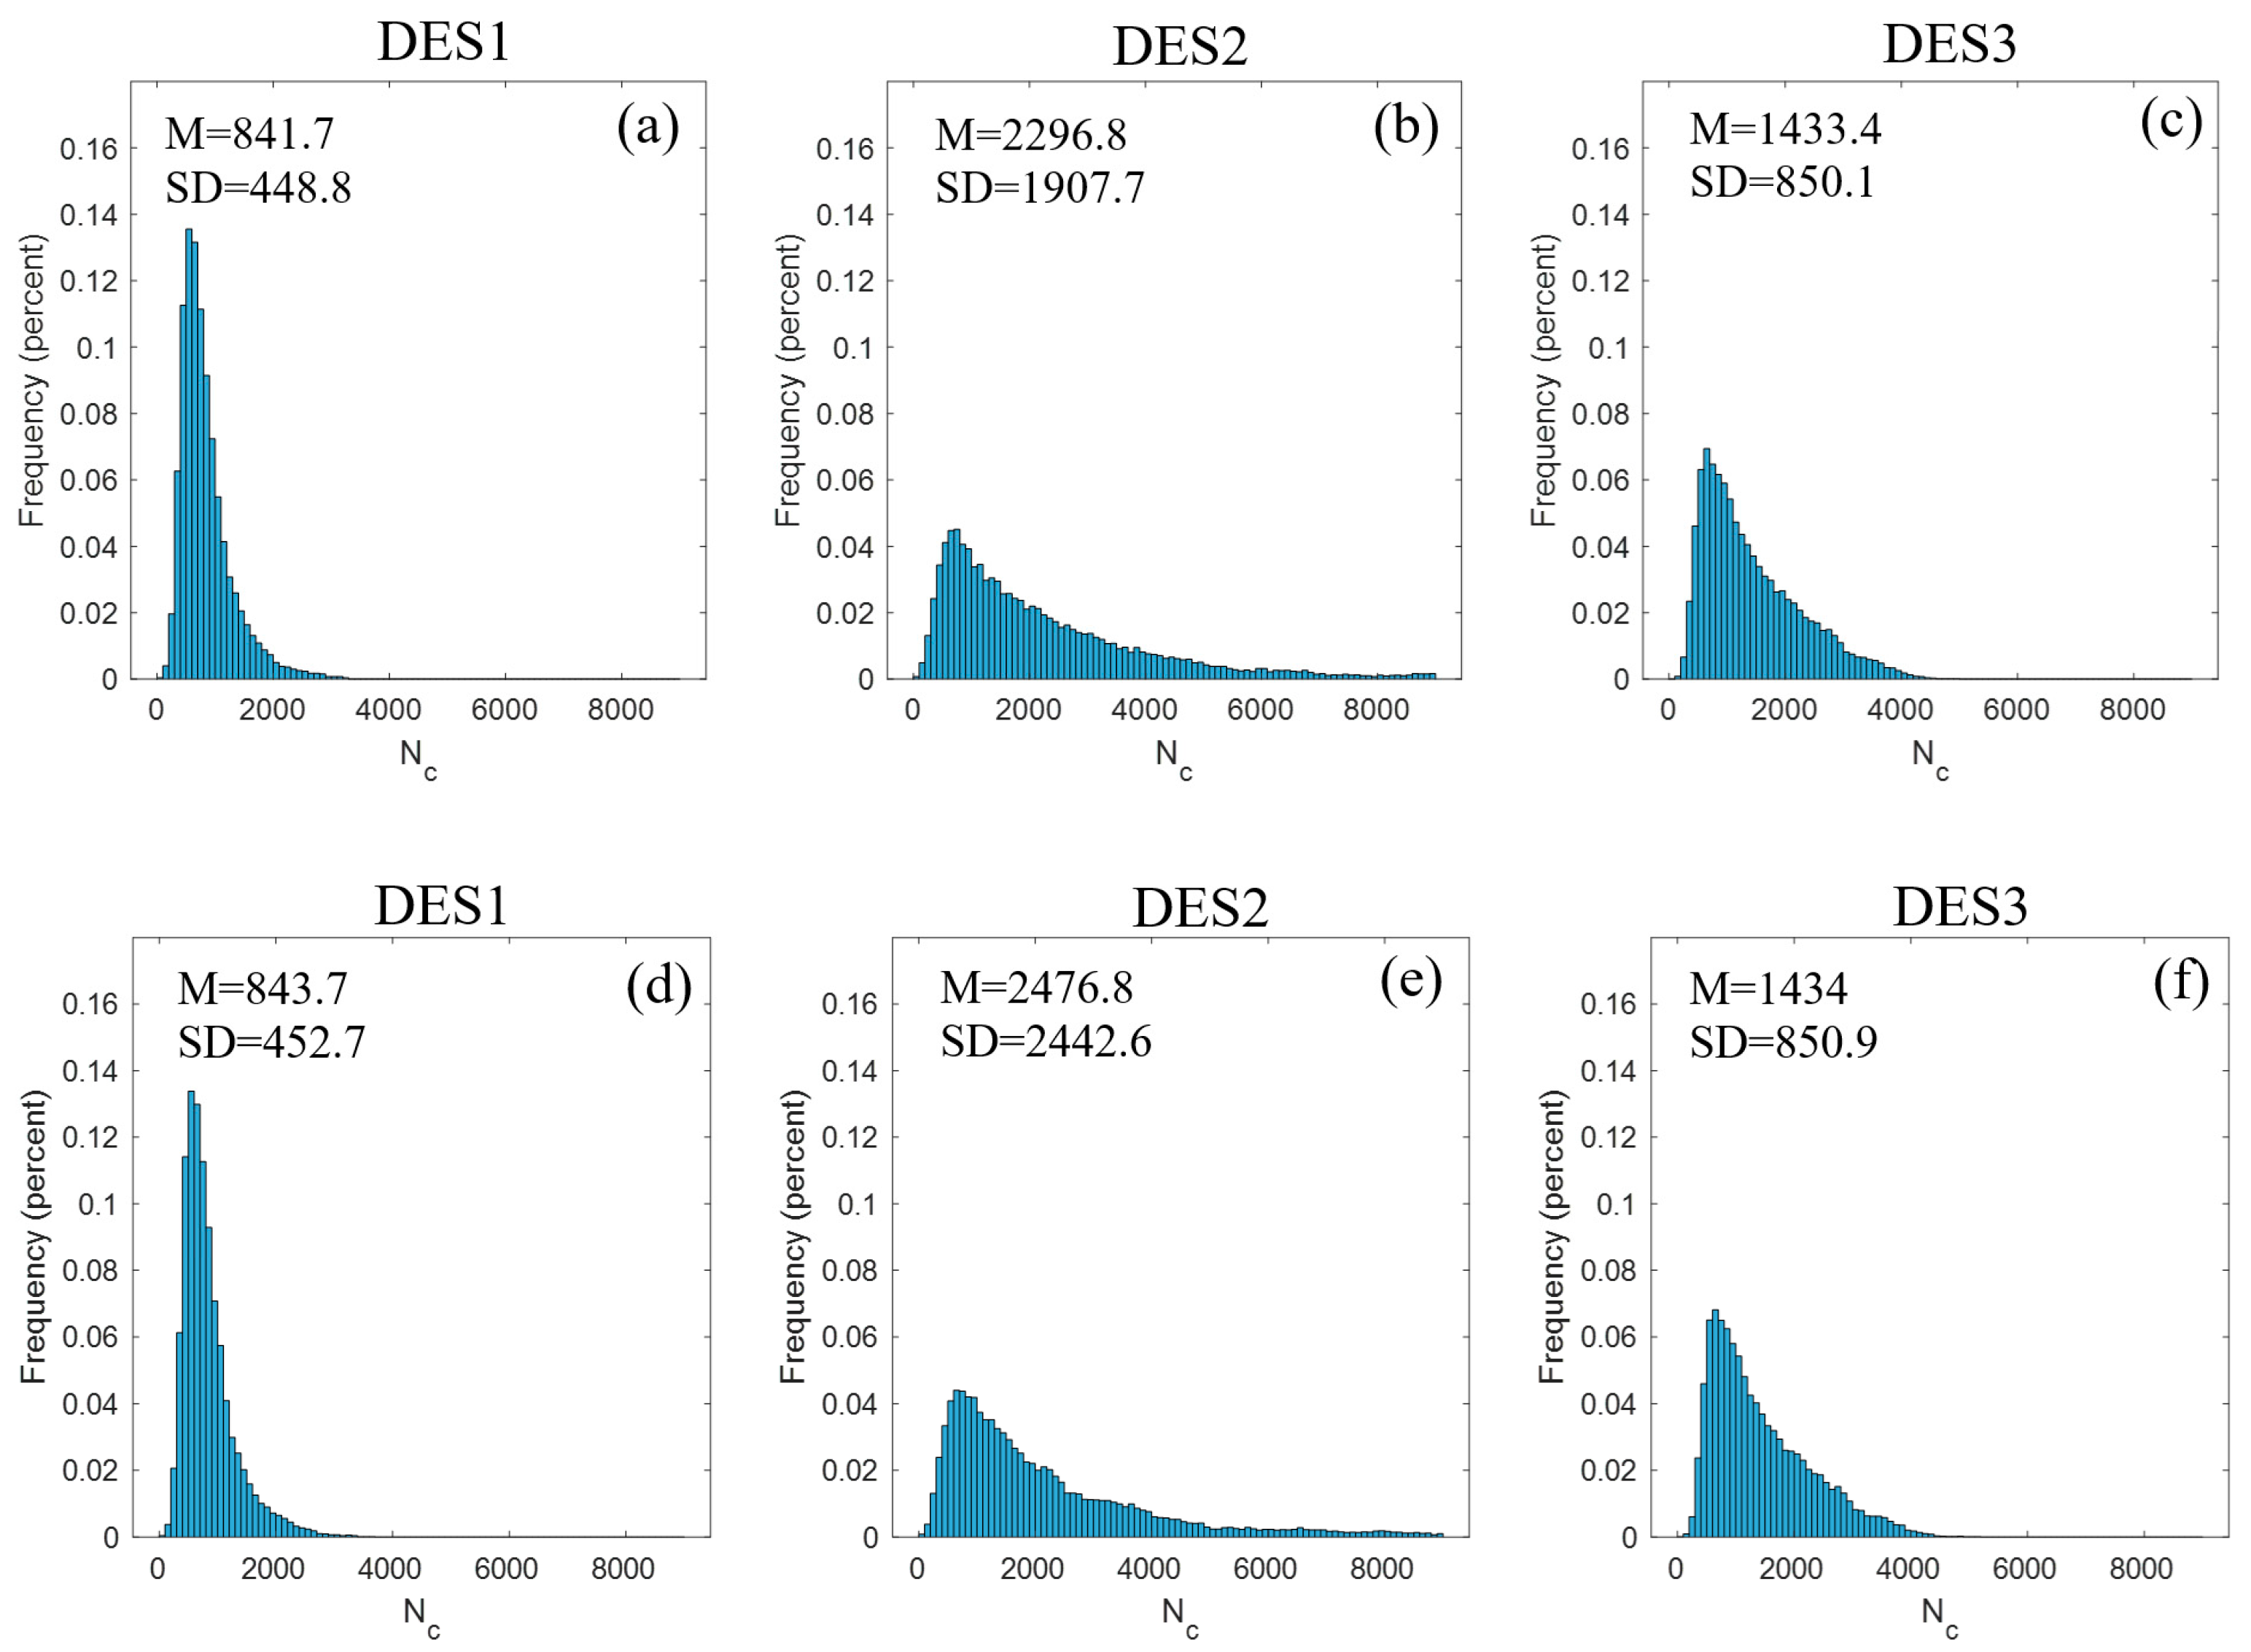
corresponds to the duration between the start of routing at the PSP and the completion of vessel operations. After the completion of the DES model executions, time-persistent statistics of
were collected and averaged over 24-h intervals, and histograms were generated. For all DES models, histograms of
values are shown in
Figure 9a–c for Port 1 and
Figure 9d–f for Port 2 considering the DES1, DES2, and DES3 models.
It is seen that the DES1 model has less dispersion and lower mean and standard deviation values for
when
= 0.4 h, (M = 841.7 and SD = 448.8) compared to the DES2 and DES3 models. The mean value of
increased by 172.9% from 841.7 to 2296.8 containers for the DES2 model and by 70.3% to 1433.4 containers for the DES3 model at Port 1. When comparing the DES2 and DES3 models, it was found that mean
values for both ports were, on average, 66.5% higher for the DES2 model than for the DES3 model. This result suggests that the inter-port cooperation scheme is more advantageous than the competition scenario in decreasing port storage congestion. The study also considered the values of
= 3.6 h and
= 4.0 h scenarios to analyze the effect of variable port traffic on the model results. The sample descriptives and
t-test results are summarized in
Table 3 for DES models and variable
values.
Upon analyzing the results, it was observed that the DES2 model always provided higher mean
values compared to the DES1 and DES3 models. The
t-test statistical test was used to determine whether the difference between the DES1 and DES3 models was significant. If the scenario with
= 3.2 h is considered for the DES1 model, it is observed that the mean
value decreased by 36.5% and 47.7% at Port 1 and decreased by 36.8% and 47.9% at Port 2 compared to the DES2 and DES3 models for the scenarios with
= 3.6 h and
= 4.0 h, respectively. As seen in
Table 3, there is a significant difference in the mean
value between the DES1 and DES3 models for all traffic scenarios. Specifically, the difference in the mean
value was significant considering DES1 (M = 841.7, σ = 448.8) and DES3 models (M = 1433.4, SD = 850.1), t(54,847) = 116.77,
p = 0.000 for Port 1 and considering DES1 (M = 843.7, SD = 452.7) and DES3 models (M = 1434, SD = 850.9), t(54,847) = 116.18,
p = 0.000 for Port 2. A decrease in vessel traffic results in a reduction in the significance of the distinction between the DES1 and DES3 models. It was observed that the storage area capacities of ports for different vessel traffic values and DES models vary significantly. A significant increase was observed for the vessel traffic scenario of
= 3.2 h where
in the DES2 model increased by 251.4% and rose from 1739.3 to 6112.2 containers compared to the DES1 model. For the same traffic scenario, the
value for the DES3 model increased by 80.1% compared to the DES1 model, from 1739.4 to 3133.4 containers for Port 1.
When considering scenarios of
= 3.6 h and
= 4.0 h, smaller port storage capacities are found for DES models. Especially when comparing the
= 3.6 and
= 4.0 h scenarios, the declines in
values between scenarios for the DES1, DES2, and DES3 models are 56.1%, 82.3%, and 75.1%, respectively, for Port 1. Similar characteristic declines are also seen for Port 2. When comparing the DES1 and DES3 models within the
= 4.0 h scenario, the differences in
values between
= 3.6 h and
= 4.0 h scenarios are significantly reduced for both ports. Similarly, the difference between
values decreased with the decreased vessel traffic. The mean
values for traffic scenarios are shown in
Table 4.
When
Table 4 is examined, it is observed that the mean
values for the DES1 model are lower than the other DES models in all traffic scenarios and for all ports. In the
= 3.2 h scenario, the mean
value for the DES1 is 156% and 63% higher for the DES2 and DES3 models, respectively (153.38 h and 97.62 h). The differences between the DES models for
are similar for Port 2 as well. In the scenarios with less frequent vessel traffic, it is observed that the differences between the models for mean
value gradually decrease. For example, in the
= 3.6 h scenario, mean
for Port 1 and Port 2 is 44.32 h and 44.23 h, respectively, and this value increases by 29% and 6% for the DES2 and DES3 models in Port 1. In the
= 4.0 h scenario, it is noteworthy that the difference between the mean
values for the DES1 and DES3 models is quite small. However,
t-test statistics indicate that there is a statistically significant difference between the DES1 (M = 41.08, SD = 5.94) and DES3 models (M = 42.30, SD = 7.05) considering the
= 4.0 h scenario, with t(210,577) = 43.42,
p = 0.00.
Sensitivity Analysis: Non-Similar Berth Lengths
The present study undertakes a sensitivity analysis on the varying berth length of Port 1 (
), using
as the performance metric. At this stage,
is held constant. The resulting deviation of the mean
for Port 1, Port 2, and the average of the ports are illustrated in
Figure 10a,
Figure 10b, and
Figure 10c, respectively.
The analysis of
Figure 10 revealed that the reduction in the mean
values for all models of Port 1 was concurrent with increasing
value. For Port 2, despite the fixed quay length, a decrease in mean
values was observed with the shared use of quay lengths in cooperation scenarios of DES1 and DES3 models resulting from vessel transfer policy. The DES2 model implemented in Port 2 exhibited a constant value of 9.05 h/vessel for the mean
value across all
values due to the absence of port cooperation and, the non-application of vessel transfer policies. The DES1 model obtained comparable values of mean
values for Port 1 and Port 2 due to the effective performance of PSM in managing vessel transfer policies. In contrast, the DES2 model showed a higher discrepancy in mean
values between ports, which can be attributed to the inadequate performance of the DES3 model’s vessel transfer policy that only considers the number of vessels in queues. Furthermore, the DES3 model exhibited lower performance compared to the DES1 model in terms of vessel delays. Changes in
values were also investigated in conjunction with policy differences between DES models and changes in the number of serviced vessels.
Figure 11 shows the annual mean number of serviced vessels (
) in ports for varying
values, with
Figure 11a representing the DES1 model,
Figure 11b representing the DES2 model, and
Figure 11c representing the DES3 models.
Figure 11a illustrates that in the DES1 and DES3 models, the vessel transfer policy has resulted in a substantial redirection of vessels that were originally scheduled to receive service in ports due to a reduction in quay length. Conversely,
Figure 11b demonstrates the operation of the DES2 model, wherein no significant difference in mean
values for different
values was observed in the absence of port cooperation, and both ports serviced similar numbers of vessels. Upon further examination of the figures, it becomes evident that the efficiency of the PSM is superior to that of the DES3 model. Specifically, for
= 300 m, the number of vessels serviced in Port 2 was 11% and 8.8% higher than that in Port 1 for DES1 and DES3 models, respectively. Similarly, with an increase in quay length at Port 1, the PSM significantly redirected vessels to Port 1 using the vessel transfer policy. When
was set at 375 m, 400 m, and 425 m, the number of vessels handled in Port 2 increased by 12.9% to 28.9% compared to Port 1. The DES3 model exhibited similar but inferior behavior compared to DES1 with an increase of 3.3% to 8.0%.
The present study’s findings were compared to the existing literature on port cooperation and resource sharing. Although no operational-level studies were found regarding vessel sharing and microsimulation, tactical planning studies in the literature that supported port cooperation and resource sharing were considered. One such investigation examined the collaboration between the neighboring Japanese Hakata and Kitakyushu ports with overlapping hinterlands using a simulation study [
53]. The study found that vessel sharing and port specialization increased port productivity, similar to the present study’s findings. It is suggested that port cooperation should be considered in terms of port capacity and restrictions. In cases where a congested port’s authority emphasizes improved profits, it may be rational for them not to expand the port capacity and instead attempt to identify a partner for cooperation [
29]. Additionally, the literature suggests cooperation schemes can increase capacity utilization rates and time savings by more than 30%, further supporting the findings of this study [
42].
Another study on the ports of San Antonio and Valparaíso indicated that port cooperation and vessel sharing policies, considering different vessel sizes, can speed up cargo operations and contribute to berth productivity and utilization in parallel with the results of present study [
25]. However, the study emphasized that cooperation alone does not increase the total economic benefit, and partial cooperation schemes and port specialization for different vessel groups must be considered. Furthermore, the study also highlights the importance of a sustainable and strong inter-port cooperation relationship for continuing the port cooperation scheme. This outcome is also important for the present study since two ports need to continue a full-scale port cooperation and share the vessels without any further obligations. This kind of cooperation is reported to be more suitable for ports operated by the same stakeholders or shipping lines (such as APL terminals, Maersk Group, etc.). Finally, the study emphasized the importance of considering emissions in future studies, which is also a limitation of the present study [
54].
7. Conclusions
The efficient operation of port clusters is crucial to handle the increasing global trade output. Inter-port cooperation among port clusters is emphasized in the literature and practice, especially in Chinese port clusters. However, no operational cooperation schemes have been demonstrated for adjacent port cluster ports, and microsimulation studies have not been implemented to evaluate the operational level of benefits of cooperation. Dry port integration for port cooperation is also an untouched topic in the literature. To quantify the actual effect of port integration, this paper conducted research from the perspective of the operational level and vessel transfer policies among ports in clusters and integration of the dry ports and inland container terminals or dry ports. The study used a conceptual port integration model that incorporated dry ports for improved coupling coordination. The DES approach was used to construct three representative microsimulation models with dry port integration with two vessel transfer policies and one no-cooperation scenario. A microsimulation study was conducted for a typical port cluster with two adjacent ports and a close-distance dry port with a daily cargo delivery scheme. The outputs of the models were evaluated using performance metrics of vessel delays, storage capacities, and the number of serviced vessels, using t-test statistics. The following conclusions can be made for the study: (1) The utilization of the DPC model facilitates the development of a collaborative environment among ports within a port cluster, resulting in reduced storage space requirements and a more compact port layout. This is particularly advantageous for port cities where obtaining terminal land can be prohibitively expensive. (2) By integrating dry ports, the DPC model offers superior vessel operation and berth waiting times when compared to non-cooperative scenarios. (3) The successful implementation of the DPC model also depends on a well-defined vessel transfer policy, which can further decrease delays and improve operational performance. The PSM, in combination with the DES1 model, can serve as a decision-support system and provide substantial benefits to the performance of the vessel sharing mechanism. (4) In terms of effectiveness and efficiency with varying berth lengths, the PSM with the DES1 model is also more reliable and robust than the DES3 model.
With regard to sustainability, this paper made multiple contributions to the sustainable development of ports. According to ESCAP [
55], strategic objectives for the four dimensions of port sustainability are categorized into economic, environmental, social, and institutional dimensions. This study focuses on the economic dimension, aiming to improve the efficiency of existing port facilities, provide integrated logistics services, increase the speed of goods movement, reduce delays, enhance the market share of the port cluster by promoting inter-cluster level competition, and contribute to the long-term strategic growth of the ports within the cluster. Furthermore, this study has the potential to contribute to the social and environmental dimensions by promoting an efficient transport system for port cities, where dry port integration can significantly reduce road freight transport and encourage a more environmentally friendly transport model.
In conclusion, the suggested collaboration strategy and integration of dry ports provide notable advantages, such as decreased storage area demands and enhanced coordination of port clusters. However, it should be noted that although the proposed DPC model and vessel sharing policy have significant benefits, the study also indicated several limitations. Generally, the proposed model is a conceptual model, and the model execution is based on a scenario that does not exist. Therefore, it is likely that the effectiveness of PSM will be reduced as the complexity of the model increases due to different parameters that may arise during the application of the model to the real world. For example, delays in land-side operations (due to yard and gate congestion, resulting in delays in vessel operations), bottlenecks caused by port equipment, fluctuations in vessel traffic, and various parameters need to be considered in the model, and the reliability of the DPC model and performance of the PSM needs to be evaluated comprehensively under extreme conditions. In addition, for port clusters usually consisting of more than two ports, different operational delays for dry ports and PSP arise due to the locations of the ports and increase the complexity of vessel routing decisions.
The most important example of the limitations during the implementation of the DPC model is the creation of a sustainable and reliable railway freight corridor. The proposed cooperation scheme directs vessels to the port where they can receive faster service before they arrive at the port. The challenge is to ensure that the cargo is sent to the port one day in advance and kept ready in the port. As mentioned in the discussed section before, a high level of integration between dry ports and ports is necessary for this to happen. A more conservative approach would be to choose a longer delivery period and advance the PSP vessel transfer decision to an earlier date to avoid the risk of cargo not being ready.
Nevertheless, certain issues require further exploration. Although an un-idealized case study may bring various uncertainties and challenges and contribute to the literature, further development of the study and the integration of decision support systems such as reinforcement learning into the application of vessel transfer policy and parameter optimization for decision support systems are also leading issues. Additionally, evaluating the performance of the DPC model for more complex and heterogeneous port cluster systems can be considered an important research area. As also stated in the discussion section, testing a model that includes different types of loads, port vessel specialization, and handling differences will result in a more realistic outcome and contribute to the literature. Another literature gap is the environmental impact assessment topic. Demonstrating the benefit of the DPC model in reducing emissions under the current topic of green ports is planned. In this way, the benefit provided by port cooperation can be demonstrated more widely by associating it with the emissions reduction and carbon pricing through an environmental cost model for many decision-makers.


