Article

Do Carbon Footprint Estimates Depend on the LCA Modelling Approach Adopted? A Case Study of Bread Wheat Grown in a Crop-Rotation System

by
Sara González-García
1,*,
Fernando Almeida
2 and
Miguel Brandão
3
1
CRETUS Institute, Department of Chemical Engineering, Universidade de Santiago de Compostela, 15782 Santiago de Compostela, Spain
2
Department of Crop Production and Engineering Projects, High Polytechnich School of Engineering, Universidade de Santiago de Compostela, 27002 Lugo, Spain
3
Division of Sustainability Assessment and Management, Department of Sustainable Development, Environmental Science and Engineering, School of Architecture and the Built Environment, KTH-Royal Institute of Technology, 100 44 Stockholm, Sweden
*
Author to whom correspondence should be addressed.
Sustainability 2023, 15(6), 4941; https://doi.org/10.3390/su15064941
Submission received: 16 January 2023 / Revised: 27 February 2023 / Accepted: 8 March 2023 / Published: 10 March 2023

Abstract

:
This study aims to assess the impact of global warming on winter wheat cultivation under different rotation systems with potato, maize or oilseed rape over a six-year period in the region of Galicia, Spain, to identify the rotation system most favorable from a climate change perspective. An attributional life cycle assessment (ALCA) with economic allocation (retrospective assessment of impacts) and a consequential life cycle assessment (CLCA) with system expansion (impacts of a change) were performed to identify discrepancies and differences in the results in this impact category and thus in the decision supported by the farmers, whose main goal is to produce wheat grain for bread purposes with the lowest carbon footprint. The global warming results modelled with ALCA and CLCA can be contradictory. In general, the climate change impact was considerably higher when modelled with CLCA than with ALCA. Farming activities were consistently identified as hotspots when using both CLCA and ALCA, but other hotspots differed in terms of their contributions. Concerning the ranking of cropping systems that produce grain with the lowest greenhouse gases emission levels, contradictory results were identified in some cases between the LCA modelling approaches. Nevertheless, the cultivation of native winter wheat under ecological management is always the preferred choice, regardless of the approach. However, wheat rotation with potato is preferrable in the ALCA, and with maize in the CLCA. The assumptions required to perform a CLCA have a large impact on results. The allocation of burdens between the co-products in the ALCA involves a level of uncertainty since discrepancies arise with the selection of the allocation procedure. Thus, the assumptions made affect the results considerably and have a direct effect on the final conclusions.

1. Introduction

Climate change is already having deep consequences on people’s lives and the biodiversity of our planet [1]. Climate change affects agriculture in several ways, such as crop yields and livestock productivity. Specifically, in southern European countries, a reduction in crops yields is projected because of future climate change (high temperatures and droughts) [2,3]. Consequently, it also affects other issues, such as the price and quality of products, as well as farmers’ income, which is expected to be reduced by around 16% by 2050 [2]. Therefore, it is important to establish adaptation strategies to secure sustainable agricultural production and mitigate the effect of climate change [4]. Although the area of land used for agricultural purposes continues to decrease because of multiple issues such as the increasing urbanization, it accounts for more than 40% of total EU land, of which 60% is arable land [5]. Among arable crops, cereals are common. Their production is expected to grow to 341 million by 2030, mainly driven by a higher demand for food and feed and the proliferation of cereal-based industrial applications. In this regard, the forecast of warmer temperatures in northern Europe favors cereal production, while the contrary is expected in the south. Nowadays, EU farmers produce one eighth of the total global cereal output and favorable export prospects are expected for some cereals, particularly wheat [5]. Wheat provides 55% of carbohydrates and 20% of the calories globally consumed, and it is one of the most widely grown and consumed cereals in the world [6,7]. According to the Food and Agriculture Organization of the United Nations (FAO), 761 million tons of wheat were produced worldwide in 2020, with Europe being the second largest producer region after Asia (representing a production share of 34% and 46%, respectively) [8]. Different types of genetic diversity wheat crops have been developed for different consumption purposes based on criteria, such as colour and protein content, among others. About 95% of the world wheat production is common wheat (Triticum aestivum L.) and the remaining 5% is durum wheat (Triticum durum L.). The former is the most cultivated cereal species in the EU. Its cultivation represents more than 24% of the total cereal produced [4]. It is mainly used to produce flour for bread because of its greater capacity for fermentation. Bread is a food staple in most countries in Europe and its sales have been increasing annually since 2012. The average per capita consumption stands at 54.9 kg in 2020 in Europe [9]. On the contrary, durum wheat is mainly dedicated to pasta and couscous production [10].
The quality of wheat depends on multiple factors, such as the crop variety and agricultural management [11]. For years, breeders mainly focused on yield increases, with grain quality being a secondary objective [12]. Therefore, wheat cultivation has been characterized by an intensive production model aimed at maximizing crop yields and high economic returns [13]. Utilization of modern agricultural mechanized machinery, mineral fertilizers and other agrochemicals contributed to the higher wheat yields. In this regard, the application of high doses of fertilizers leads to the leaching of nutrients into ground and surface water, as well as emissions to the atmosphere, mainly in the form of NO2, NH3 and N2O [14], resulting in adverse impacts on the environment with losses of biodiversity and nutrient pollution of the aquatic environment [14]. In this regard, careful attention needs to be paid to effective fertilization protocols, mainly in humid Mediterranean areas [15]. In addition, in some EU countries, there are restrictions on the use of fertilizers, the application of which is strictly regulated [11].
Using crop rotations appears to be a superior option over monoculture; it has multiple benefits, such as improvements to soil structure and health, water and nutrient use efficiency, and it also alleviates pest and weed pressure [16]. All this results in higher grain yield and quality (e.g., protein content) [11,17,18] and provides significant savings in relation to fuel and agrochemicals costs [19]. Rahimizadeh et al. [17] reported beneficial effects of wheat cultivation under rotation with potato and maize silage as preceding crops. Regarding the former, increments up to 3.9 t/ha were identified in potato–wheat rotation systems vs. monoculture wheat systems. The incorporation of catch crops in the rotation systems is another promising strategy. Legumes are also traditional Mediterranean crops, as well as a good option for rotations with wheat [20,21,22]. Because of their inherent property of fixing a substantial amount of nitrogen from the air in symbiosis with rhizobia, the use of legumes decrease volatilization and leaching of this compound as well as make it available to non-fixing plants [23].
The design of efficient and sustainable crop rotations, from an environmental perspective, requires a comprehensive methodological tool to assess the environmental impacts directly caused by the cropping systems, as well as those arising because of the inputs used. The life cycle assessment (LCA) methodology has been widely applied to estimate the environmental impacts of agricultural systems, and established methodological developments make it an appropriate tool for estimating environmental impacts in a wide range of economic sectors [24,25,26,27,28,29,30,31,32,33]. There are two types of modelling approaches to consider when conducting an LCA, depending on the goal of the study: attributional LCA (ALCA) and consequential LCA (CLCA) [34,35,36,37,38]. ALCA has been predominant in life cycle thinking and describes the environmental impacts associated with physical input and output flows entering and exiting a product system; nevertheless, ALCA does not consider the effects that the system and its final flows may have on other related product systems. Conversely, CLCA defines how these flows might be modified in response to a decision or a change and thus identifies the corresponding environmental consequences [36,37,38].
The goal of this study was to investigate the environmental consequences of global warming on cultivating bread wheat (main crop) with alternate crops under rotation systems (rapeseed, maize and potato) using the CLCA approach and integrating the effects on land use change. The results were also compared with those from an ALCA perspective to identify differences in the environmental outcomes of each methodological choice, which can be especially relevant for informing policy makers and decision makers, such as farmers, of a specific agricultural strategy. Accordingly, in the CLCA approach, affected processes from the feedstocks yields in each rotation scenario were analyzed, including marginal feed wheat, soybean meal and palm oil (i.e., marginal crops for feed carbohydrate, fodder protein source and refined vegetable oil, respectively).

2. Materials and Methods

2.1. Goal and Scope Definition

The main goal of this study was to evaluate the direct and indirect global warming impact associated with the cultivation of winter wheat (Triticum aestivum L.) for bread production under different rotation strategies, including maize silage (Zea mays L.), oilseed rape (Brassica napus L.) and potato (Solanum tuberosum L.). To ensure that the variations in the emissions along the entire crop rotation are considered, full rotation cycles of 6 years were considered for each scenario and a cradle-to-farm gate approach is adopted.
As detailed above, the assessment was performed considering ALCA and CLCA approaches to identify differences on the main results and findings [36]. In an ALCA, all inputs and outputs of a production system are attributed to the functional unit by linking and/or partitioning the unit processes of the system according to a normative rule (e.g., allocation factors based on economic, mass or energy ratios between co-products). Therefore, the ALCA approach provides a retrospective assessment of impacts (status quo) and may mislead policy or procurement decisions. In a CLCA, activities in a product system are included to the extent that they are expected to change because of a change in demand and/or supply for the functional unit [36,37,38,39]. Thus, CLCA approach estimates the consequences of a decision by considering the market effects of a decision. Both approaches were considered in this study considering the corresponding criteria in both, as explained below.
The chosen functional unit as baseline was 1 kg of winter wheat (WW) grain. Unlike in other studies focused on animal feeding production where a cereal unit was selected as unit [40,41], the one chosen here gives an idea of productivity and efficiency and it is useful in agricultural systems since the goal is minimizing the impact per kg of product. In addition, since the farming systems are destined to the production of wheat for bread production, this unit gives an answer to the question: What is the rotation system that produces WW grain with the least environmental impact?
When considering a product-based unit, an allocation procedure is required in ALCA when more than one product exists. We chose economic allocation for isolating wheat. In the case of CLCA, allocation is avoided by system expansion.

2.2. Description of Cropping Systems

Galicia (NW Spain) is known for the quality of its bread, baked in the traditional way, and constitutes a basis of the Atlantic diet [42]. Although commercial wheat varieties have been traditionally used to produce bread, native Galician wheat varieties (Caveeiro and Callobre varieties) are gaining special interest in recent years since they have more starch and less gluten [31]. Both varieties of winter wheat (commercial and native) are sown in late summer or autumn and require a period of cold winter temperatures since they need moisture for germination. Although wheat is primarily used for human consumption, it is also an excellent feed grain for poultry and livestock, although only lower quality wheat is used for feed.
Winter wheat varieties (commercial and native) can be cultivated under a monoculture regime, although benefits have been reported for soil quality, cycling of nutrients and higher yields in crop-rotation systems [22]. In this study, commercial and native (Caveeiro) varieties were considered for assessment in crop-rotation systems.
Three different crop companion strategies are assessed in this paper, including potato and maize (traditional crops in the region) and rapeseed under different management regimes (conventional and organic, the latter only with the native variety). In the case of potato, the rotation system includes two consecutive years of wheat and one of potato (see Figure 1). For rotations with maize and oilseed rape, wheat and the alternate crop are alternatively cultivated. For all scenarios, agricultural activities developed in the field for a 6-year period have been computed.
Concerning the management of straw in the different rotations, when the native variety is cultivated, the totality of straw is left in the field and only the grain is harvested. Conversely, with the commercial variety, 85% of the straw is baled and collected for animal feeding, while the remaining 15% is left in the field. With oilseed rape and potatoes, only seeds and tubers, respectively, are harvested, while crop residues (straw and leaves) are left in the field as nutrient suppliers. In the case of maize, the main product is the maize silage; therefore, the whole maize plant is harvested although a small amount of straw is left on the field. The practice of leaving crop residues on the field affects the subsequent crops in the rotations by modifying nutrients’ turn-over and soil’s organic matter and mineral status. In addition, this practice can help to maintain and even improve soil properties and fertility throughout the rotation period [40].
The cropland under study has been under agriculture for over 20 years, producing arable crops, mainly winter wheat. The rotation systems were in Galicia, northwestern Spain, in the regions of Carral (43°15′20″ N, 8°21′18″ W), Laracha (43°14′54″ N, 8°35′4″ W) and Xinzo (42°3′47″ N, 7°43′33″ W). The data collected covers an area of 450 ha managed by 51 farmers and was divided in plots. Each plot was 6 × 14 m2 with repetitions separated by corridors to allow maneuvering. This area accounts for approximately 40% of the wheat grain produced in Galicia. Galicia is a region where the climate is oceanic with coastal, Mediterranean, inland and mountain variants. The average annual precipitation in the area is 750–1000 mm, mostly concentrated in the autumn and winter, thus making drainage almost never necessary in the plantations. The soil clay content is 4.9%, pH is 5 and the soil organic carbon content is around 55 t C·ha−1 in the upper 30 cm.
For each cropping system, the boundaries included the production of all inputs, such as machinery, mineral fertilizers and other agrochemicals (i.e., pesticides, insecticides, fungicides), seeds and diesel for operation of machinery in the field, and corresponding direct emissions (i.e., tailpipe emissions from diesel use and direct field emissions from fertilizers and other agrochemical application). The transportation of the different inputs to the systems were not accounted for in this analysis because their impacts were assumed negligible compared to fuel consumption during machinery operation [43,44]. Each rotation system begins after harvest of the previous crop and ends with the harvest of the last crop in the rotation system. In total, nine scenarios have been assessed and compared (see Table 1).
Three scenarios reflect the cultivation of the commercial WW variety (WWC) under conventional management and in rotation with potato (Pcm), maize (Mcm) and oilseed rape (OSRcm)—S1, S2 and S3, respectively. Three additional scenarios are based on the native variety of WW (WWN) under conventional management and in rotation with the three alternate crops (Pcm, Mcm and OSRcm)—scenarios S4, S5 and S6, respectively. Finally, the native variety of WW (WWN) is considered in combination with the three mentioned crops but under ecological management (Pem, Mem, OSRem)—scenarios S7, S8 and S9, respectively.
Thus, the crop rotations assessed were:
  • Wheat commercial and potato (WWC-Pcm);
  • Wheat native and potato (WWN-Pcm);
  • Wheat native and potato ecological (WWN-Pem);
  • Wheat commercial and maize (WWC-Mcm);
  • Wheat native and maize (WWN-Mcm);
  • Wheat native and maize ecological (WWN-Mem);
  • Wheat commercial and oilseed rape (WWC-OSRcm);
  • Wheat native and oilseed rape (WWN-OSRcm);
  • Wheat native and oilseed rape ecological (WWN-OSRem).
Figure A1, Figure A2 and Figure A3 in Appendix A depict the system boundaries, in which the agricultural activities performed in the field for each crop that constitute the rotation systems are shown. For each agricultural activity, the corresponding inventory data was collected as detailed below. A detailed description of each cropping system can be found in González-García et al. [45].

2.3. Life Cycle Inventory Analysis: Calculation, Assumptions, and Methods

The life cycle assessment of each crop rotation comprised raw materials extraction (e.g., fossil fuels and minerals), manufacture (e.g., seeds, mineral fertilizers, herbicides, insecticides, fungicides and agricultural machinery), use (tailpipe emissions and tyre abrasion emissions), maintenance and final disposal of machinery. Information concerning operation hours, diesel consumption, amount of agrochemicals applied and yields of products and by-products was directly supplied by farmers by means of surveys and interviews. Winter wheat grain was considered as the main product, while wheat straw, oilseed rape, maize silage and potato were regarded as co-products. Table A1 in Appendix A summarizes the technical requirements of the nine cropping systems over the 6-year rotation period. The estimation of machinery used (i.e., tractors, trailers and implements) in each agricultural activity was carried out with reference to Ecoinvent database® 3.9v [46], considering the weights, operation hours and lifetimes, with information supplied by the growers. Accordingly, the nine cropping systems differed in soil tillage (i.e., diesel requirements) and pest control methods (fertilizers and other agrochemical applications), among other issues.
Although the use of primary data is preferable, it was necessary to consider secondary data to complete the inventory tables. Secondary data were handled for the background system, which involves the activities required to produce all the inputs to the farming systems (i.e., diesel, machinery, agrochemicals), as well as to estimate the tailpipe emissions. The Ecoinvent® database 3.9v [46] was considered as the main secondary data source.
Both LCA approaches included in the inventory the on-field greenhouse gas emission due to the application of nitrogen-based fertilizers (in the case of both organic and mineral fertilizers). Direct and indirect (from nitrogen volatilization as NH3 and NOx and leaching) nitrous oxide (N2O) emissions from fertilizers were estimated according to the Intergovernmental Panel on Climate Change [47]. Direct emissions come from the application of synthetic mineral and organic fertilizers and the incorporation of crop residues. An emission factor of 0.010 kg N-N2O·kg−1 N synthetic and organic fertilizer (default value) was considered to estimate direct emissions. Indirect emissions are derived from two paths that are from N volatilization/deposition and nitrate leaching. Emission factors of 0.01 kg N-N2O·(kgN-NH3+kgN-NOx)−1 and 0.011 kg N-N2O·kgN−1 leached, were used for both paths, respectively. NO2 and NH3 emissions were calculated as proposed by the European Environmental Agency and European Monitoring and Evaluation Programme [48]. NO3 leaching was estimated in agreement with Faist Emmenegger et al. [49]. A detailed description of the procedure can be found in González-García et al. [45].
In addition, as this study deals with crop-rotation systems, the nutrients from the crop residues left in the field were considered for the calculation of nutrient inputs (N, P, K) for the next harvest. Although incorporating the straw back into the soil can reduce fertilizer requirements for the subsequent crop, farmers have not taken this into account. The rationale behind this procedure is that farmers maintained the mineral or organic fertilizer levels to preserve crops yields since they observed a reduction in yield by reducing the input of these nutrients in successive crops.
The effect of land use change was included within the boundaries of both LCA approaches, as detailed in Section 2.3.3.

2.3.1. Attributional Life Cycle Inventory

Figure A4 in Appendix A shows the ALCA system boundary of the cropping systems. As shown, the cropping systems yield more than one product. Table 2 details the number of products yielded by the various cropping systems. Economic allocation for sharing the impacts between co-products by considering the economic value of the products was applied to isolate wheat, which is the product of interest here and regardless of the revenue received from the alternate crops. Table A2 in Appendix A summarizes the allocation factors used. Market prices for the different co-products supplied by growers were used and remarkable differences were identified based on the cultivation regime and the WW variety. Commercial WW grain is sold at 0.18 EUR·kg−1. Straw is sold at 0.07 EUR·kg−1. Native WW grain sees a premium price of up to 0.40 and 0.48 EUR·kg−1 when cultivated under conventional and ecological regime, respectively. In this variety, there is not revenue from straw, since it is entirely left in the field. Concerning the rotation’s alternate crops, potatoes for food are sold at 0.16 EUR·kg−1 and 0.28 EUR·kg−1 when they are produced under conventional and organic management, respectively. No difference on the price is identified for potatoes used for animal feed (0.05 EUR·kg−1). Finally, maize silage and oilseed rape also present differences of price relative to the cultivation regime. Regarding the former, 0.05 EUR·kg−1 and 0.09 EUR·kg−1 are the market prices when the silage comes from conventional and organic management, respectively. Conventional and organic oilseed rape is sold at 0.20 EUR·kg−1 and 0.40 EUR·kg−1, respectively. All sale prices for the different agricultural products were supplied by the farmers.
Another multi-functionality issue encountered was the organic fertilizers which are used in organic scenarios (S7–S9) in ALCA. Poultry and cow manure derived from farming activities with other main products. According to the information supplied by farmers, 50% of manure is dedicated to satisfying the energy requirements of the poultry and dairy farms, while the remaining 50% is used for fertilization in organic farms, and economic revenue is received. A volume of 27 m3 of manure is sold for 250 EUR to the farmers (personal communication). In the poultry farm, broiler chicken is produced as the main product, together with manure and electricity. An economic allocation was assumed for sharing the impacts from the farming activities between the three co-products, considering 0.790 EUR·kg−1, 0.026 EUR·kg−1 and 0.120 EUR·kWh−1 as sale prices for meat, manure and electricity, respectively. Consequently, a factor of 1.0% was established for poultry manure, considering inventory data for the poultry farm from González-García et al. [50]. Accordingly, a global warming impact of 61 gCO2eq per kg of poultry manure was assumed. Concerning the dairy farm, milk, meat, manure and electricity are the co-products. An economic allocation approach was also established considering 3.5 EUR·kg−1 and 0.354 EUR·kg−1 for beef meat and milk, respectively. Thus, an allocation factor of 4.1% was assumed for the cow manure considering inventory data from Cortés et al. [51]. Therefore, a factor of 44 kgCO2eq per m3 of cow manure was assumed.

2.3.2. Consequential Life Cycle Inventory

Figure A5 in Appendix A shows the flowchart of the CLCA system boundary of the cropping systems, which are based on marginal data. CLCA reflects the potential environmental impact from a change in the demand for the main crop of the rotation. Therefore, demand for the functional unit affects the production of the alternate crops—rapeseed, maize silage or potato production—which, in turn, must be market-balanced. For extra rapeseed, maize silage or potato production, the market for feed must balance in terms of a change in the content of carbohydrate and protein. Given that the marginal source of protein feed is soybean meal, and that it is co-produced with vegetable oil, the vegetable oil market will have to balance (see [52]). Consequential modelling comprises the consideration of the marginal sources of energy and protein fodder, refined vegetable oil and electricity that are affected by additional demand for the functional unit, so that each cropping scenario affects world markets for a range of products. Regarding the alternate crops under production in our study, they displace the marginal products yielding the same function. The marginal source of vegetable oil is palm oil (affected by rapeseed production) and the marginal sources of protein feed and carbohydrate feed are soybean meal and feed wheat, respectively [53], which are affected by maize silage and potato production (and indirectly by rapeseed production). The consequential modelling requires the estimation of the quantities of marginal feedstocks needed to balance the supply changes resulting from each cropping system. To do so, information is needed concerning the energy, protein and oil content of the alternate and marginal crops that are displaced, which is summarized in Table 3. To balance these supply chains, a set of equations is simultaneously solved per cropping scenario, as detailed in [52]. The results for the commodities per cropping system (1 ha cultivation for 6 years) are summarized in Table 4. Regarding the global warming impact associated with the production of soybean meal, feed wheat and palm oil, the values reported by Schmidt [54] were used (373 kgCO2eq·t−1 DM, 640 kgCO2eq·t−1 DM and 2,470 kgCO2eq·t−1 oil, respectively for soybean meal, feed wheat and palm oil) albeit also including indirect land use change within their background systems, as detailed below (see Section 2.3.3).
In the organic-management scenarios (S7–S9), the upstream burdens of manure production were excluded because manure is a dependent by-product, i.e., its volume of production depends on demand for the determining product (i.e., meat) and not by demand for manure or wheat. Conversely, the avoided waste management of manure was computed by means of electricity production. As in other conventional farms, manure is digested in an anaerobic digester to produce biogas and partially satisfy electricity requirements. However, the use of manure in fertilization affects the production of marginal electricity and the electricity requirements that had previously been met with this animal waste. Instead of adopting the average Spanish electricity mix, which requires multiple fossil sources, we have adopted a marginal mix, which is consistent with the practice of CLCA [53]. In our case, electricity production on a natural gas combined cycle was assumed as the marginal electricity source, considering the corresponding growing rates in the period 2015–2019 in comparison with other electricity sources [55,56]. To estimate the electricity requirements, the following conversion ratios were assumed: 9.94 kWh·m−3 of methane; 159 L methane·kg−1 vs. and 490 kg VS·t−1 for poultry manure; 219 L methane·kg−1 vs. and 106 kg VS·m−3 for cow manure [57].

2.3.3. Direct and Indirect Land Use Change Effect

Approximately 9% of global carbon emissions derive from land use changes; nevertheless, these are not usually addressed in LCA studies [58], and there is even no consensus on how to account for soil carbon change in agricultural systems [41]. Land use change refers to a change in the use or management of land by humans, which may lead to a change in land cover [41]. Often, it is divided into two types of land use changes caused by land occupation: direct land use change (dLUC) and indirect land use change (iLUC) [38]. The former occurs when a new activity occurs on an area of land, and it can be observed and measured. Conversely, the latter occurs elsewhere as an unintended consequence of land use decisions; thus, it cannot be directly observed or measured. Concerning iLUC, there is a broad consensus in the scientific community that the current iLUC estimations are highly uncertain. The iLUC model reported by [58] was followed in detail for the iLUC estimation in this paper. The seven steps were considered as follows, for consequential and attributional modelling. Firstly, the land requirement per rotation system—that is, 6 ha·yr, (step 1)—was considered. The rotation systems are in Galicia (NW Spain), where the potential net primary production (NPP0) is 7 t C·ha−1·yr−1 (steps 2 and 3 of the model). It is necessary to identify the potential use of the occupied land since it determines which market for land is used. In our study, it is cropland already in use, i.e., the market for arable land (step 4). Next, the productivity factor was estimated by dividing the NPP0 by the global average productivity corresponding to the potential use; that is, 6.11 t C·ha−1·yr−1. Accordingly, for our systems, the productivity factor was 1.15 pw ha·yr·ha−1·yr−1 (step 5). The actual occupied area (ha·yr) is converted into units of productivity weighted hectare years (pw ha·year); that is, 6.87 pw ha·yr per rotation (step 6). Finally, the greenhouse gas (GHG) emissions were estimated for both attributional and consequential LCA, considering the iLUC GHG emissions per productivity-weighted hectare-year (pw ha−1·yr−1) for arable land reported by Schmidt et al. [58] that are 1.26 and 0.042 t CO2·pw ha−1·yr−1, respectively, for CLCA and ALCA (step 7). The values 8.66 and 0.289 t CO2 per rotation for CLCA and ALCA, respectively, were estimated for our cropping systems and included in the inventories. Concerning the marginal crops, iLUC was estimated following the mentioned procedure and considering the corresponding agricultural and processing yields reported by [54] for soybean meal, feed wheat and palm oil. Accordingly, 0.581 tCO2eq·t−1 DM, 0.198 tCO2eq·t−1 DM and 0.383 tCO2eq·t−1 oil were estimated for soybean meal, feed wheat and palm oil, respectively.
Regarding dLUC, no land use change emissions were considered as the land has been under annual cropland over the last 20 years, but changes in soil organic carbon due to the incorporation of straw were included. Table 2 details the amount of straw that remains in the field per cropping system. In this study, we assumed a conversion rate of 16% of crop straw to mineral-associated stable soil organic carbon (SOC) fraction [59] and a carbon content of straw of 49% of its dry matter [53]. These values were included as negative values in the corresponding inventories.

3. Results and Discussion

The global warming profile for each rotation system was evaluated from an ALCA and a CLCA approach. Thus, the crop rotation systems with the best and the worst global warming impact were identified, and a detailed assessment was conducted with the aim of identifying the activities or processes more responsible for those GHG emissions. As justified above, the profiles were reported per kg of WW grain to identify the rotation system preferred from a climate change perspective; that is, the one that produces WW grain with the least GW score. Table 5 shows the characterized results in terms of GW to produce one kg of WW grain under different rotation systems and considering ALCA and CLCA approaches. According to this table, the climate change impacts considerably change with the LCA perspective considered, as does the order of preferred production systems.
It is important to note that the goal of ALCA differs from that of CLCA; while the former is to assess the environmental burden of a product, assuming a status-quo situation, the latter is to assess the environmental consequences of a change in demand.

3.1. Outcomes from ALCA

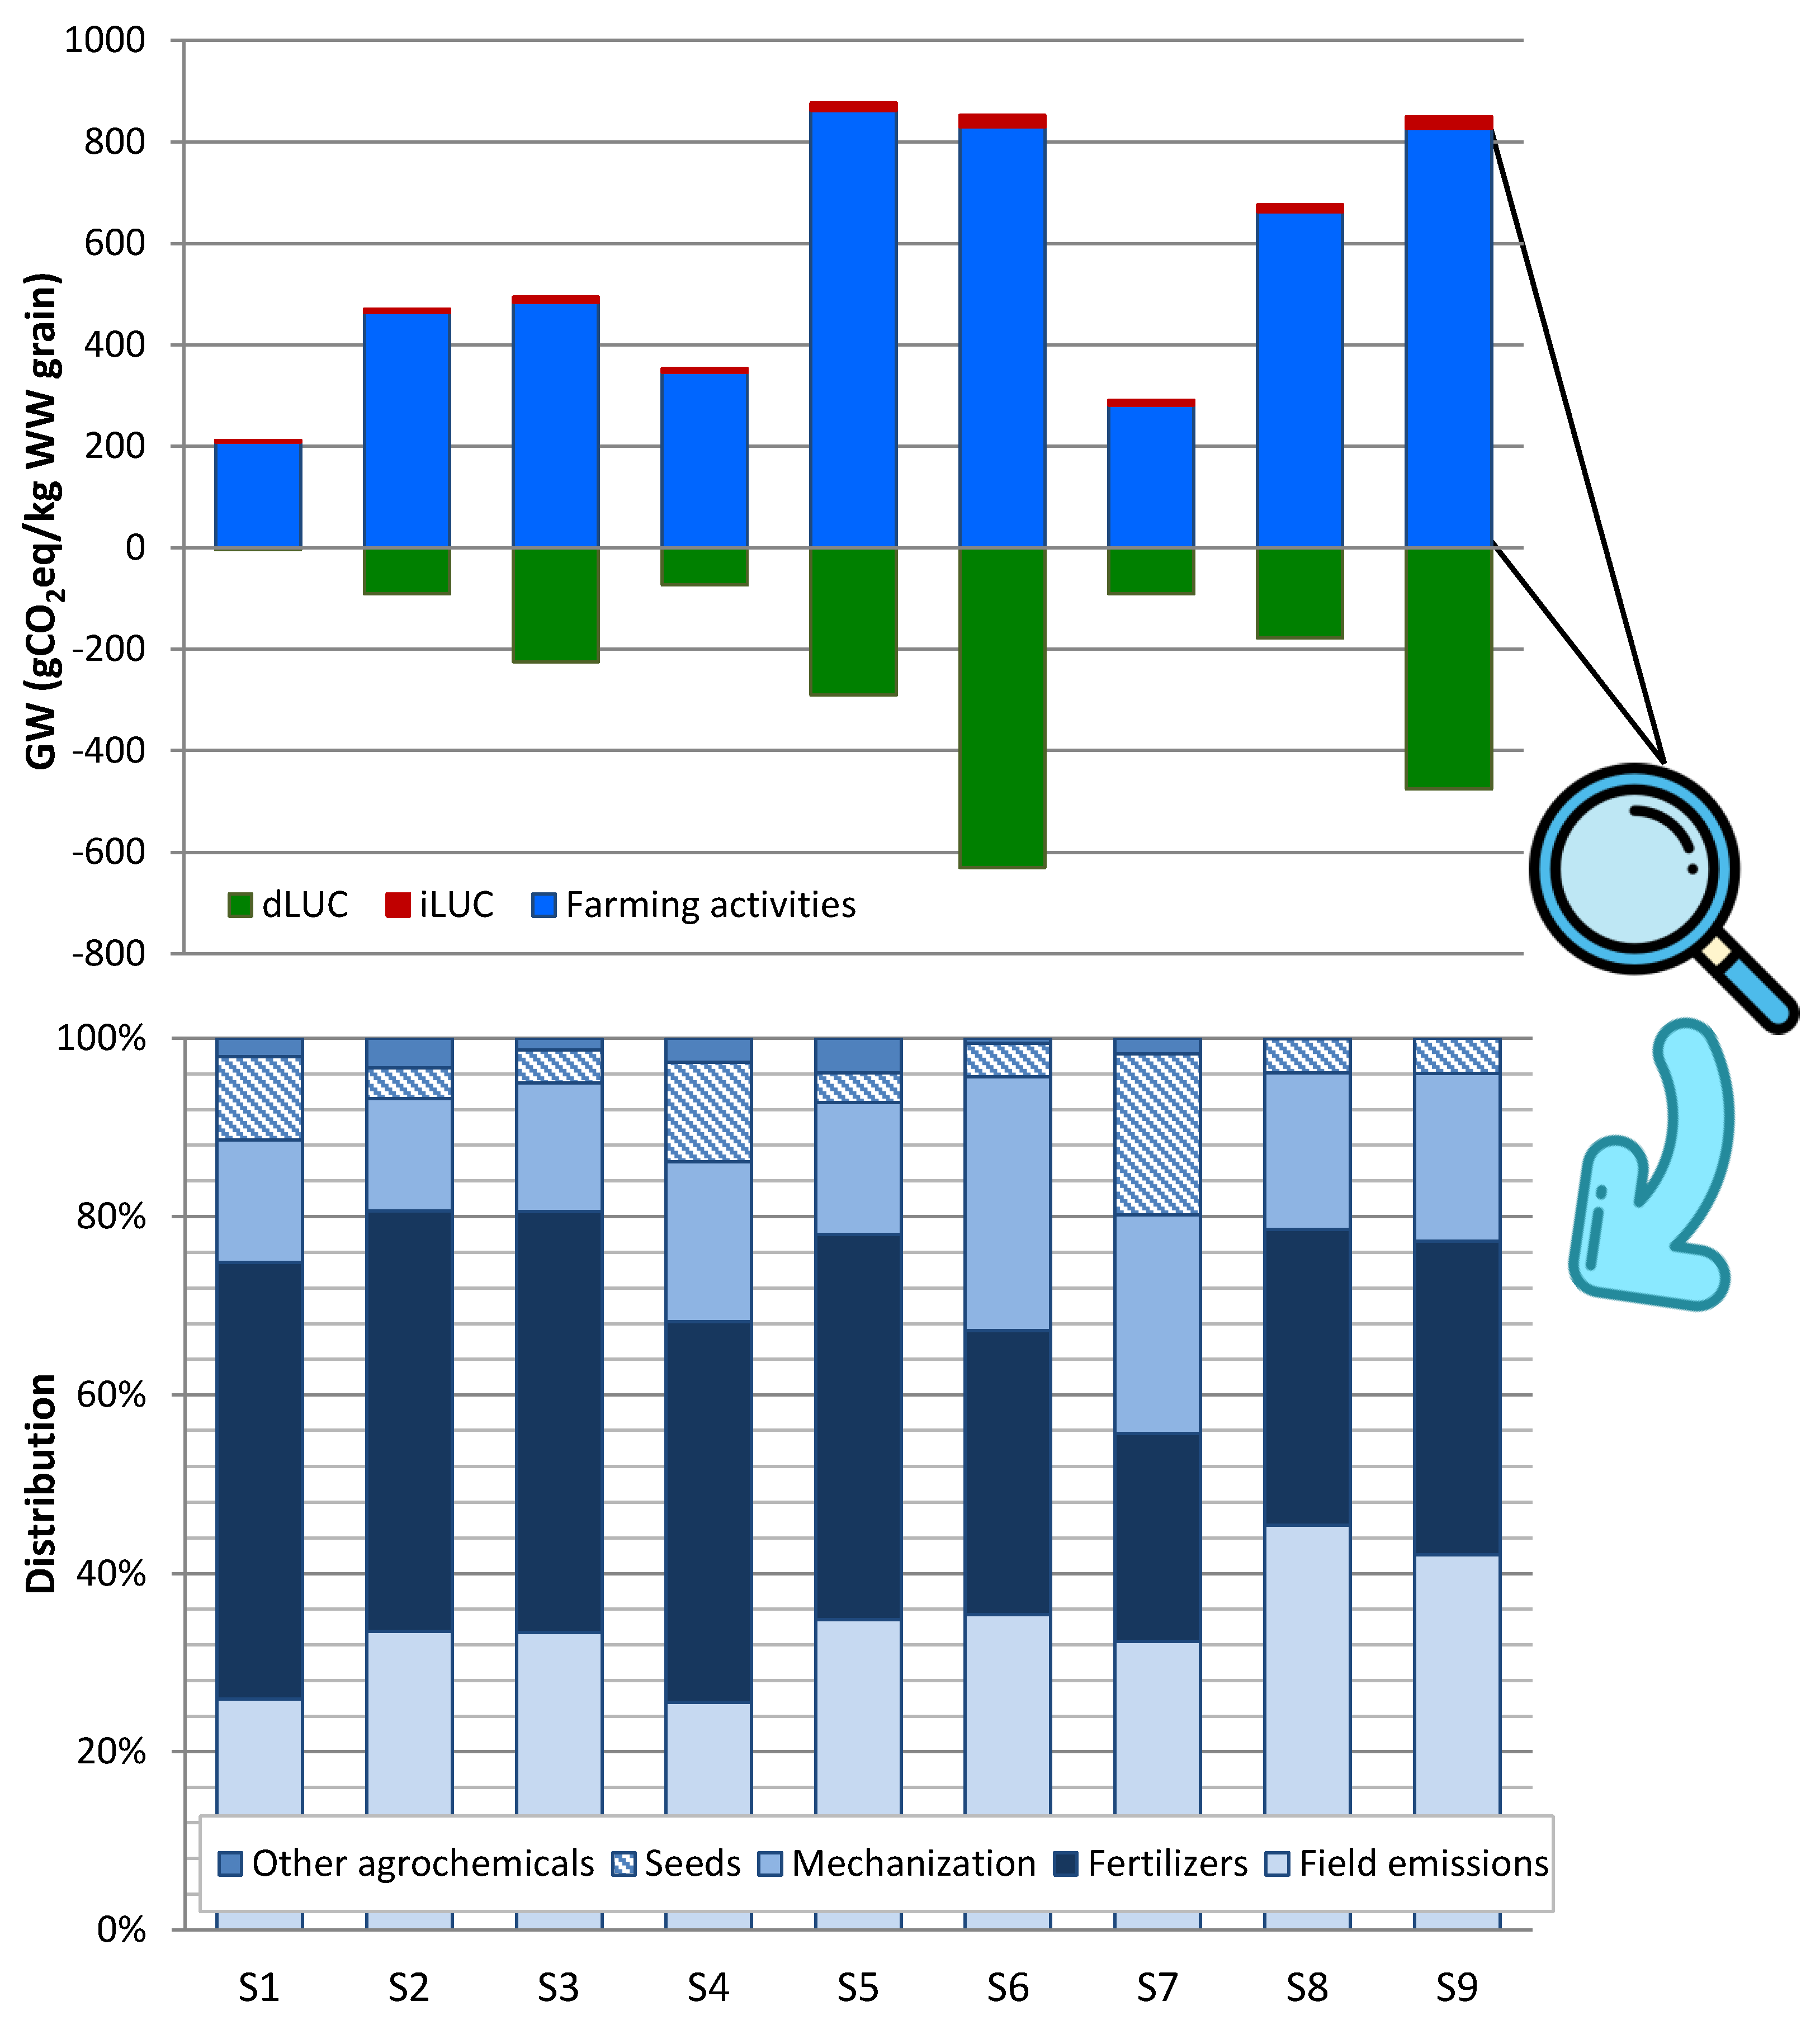
Figure 2 shows the contribution of different parameters involved in the global warming impact of the different scenarios estimated via an ALCA approach. The environmental hotspots are associated with the farming activities developed in the field that require specific inputs such as agrochemicals (mainly mineral fertilizers) and diesel. This parameter is clearly the main contributor to GHG emissions, regardless of the scenario.
Figure 2 shows that there are two farming activities with the highest GHG emission levels: field emissions (26–45% of total depending on the scenario) and fertilizer production (23–49%). Field emissions include on-site emissions derived from the application of fertilizers, N2O being the main responsible gas. There are other emissions into the environment resulting from the application of agrochemicals but not contributing to GW, such as nitrogen oxides and ammonia into air and nitrate and phosphate into water. Concerning fertilizer production, it includes the production of mineral and organic fertilizer (the latter only in ecological scenarios, i.e., S6–S9). It is important to highlight that the organic fertilizers (poultry and cow manure) have been assumed to be partly responsible for the environmental burdens derived from their background production systems (see the adopted economic allocation procedure in Section 2.3.1). The contribution to GHG emission from organic fertilizers in S8 and S9 is extensive mainly because of the large amount of manure used.
Regarding mechanized activities, this contributing factor includes all agricultural operations performed on the field from field establishment to crop harvesting and thus the corresponding diesel requirements and tail-pipe emissions. This factor is responsible for 13–29% of GW, mainly due to the production of diesel, and harvesting is the main hotspot in all scenarios (moldboard ploughing and ground milling are also relevant in those scenarios where they are performed because of the large demand of diesel due to extensive operation hours). The effect on GW from seed production is relevant in the scenarios including potato as alternate crop (i.e., S1, S4 and S7) because a large amount of seeds is required per ha, as well as potato being a highly mechanized crop. Finally, the effect of the production of other required agrochemicals (i.e., pesticides, insecticides and fungicides) is insignificant or even negligible in the ecological scenarios, where they are only required in the cultivation of potato and maize (see Figure A3 in the Appendix A) but in lower amounts than in their conventional counterparts.
The effect over the GW from iLUC is negligible in all scenarios. The iLUC score was estimated as 289 kgCO2·ha−1 for a period of 6 years in an ALCA approach. After the application of the allocation factors corresponding to the WW grain per scenario (see Table A2 in the Appendix A), the iLUC effect is insignificant.
dLUC includes the increment on the soil organic content (environmental credit) because of returning straw into the field after harvesting. After applying the economic allocation factor, S1 is the scenario with the lowest biomass return rate (1.16 t straw DM per ha) and thus, the effect of dLUC in GW is negligible. Conversely, S6 with 27.9 t straw DM per ha returned into field, presents the largest environmental credit counteracting the effect of the mentioned contributing parameters.

3.2. Outcomes from CLCA

The global warming profile entirely changes between the ALCA and the CLCA approach. Figure 3 depicts the distribution of GHG emissions per scenario between the involved parameters. The effect of the farming activities is also relevant but to a lesser extent than in ALCA, since their effect is in some scenarios surpassed by other parameters, such as those related to the marginal processes (mostly in ecological scenarios, S7–S9), the avoided conventional manure management (in S7–S9) and iLUC. Therefore, the importance of the displaced processes (marginal electricity and commodities) and avoided burdens is shown to be significant in this approach, which is often higher than the impact from the agricultural activities themselves. Thus, the results in CLCA considerably depend on the contribution from the marginal products, which in some cases are the most important contributing factor (e.g., in ecological scenarios).
In assessing, in more detail, the distribution of impacts from farming activities, two factors are identified as environmental hotspots: field emissions (i.e., N2O) and production of mineral fertilizers, mostly in ecological scenarios and conventional scenarios, respectively. The ecological scenarios (S7–S9) do not show a direct effect from organic fertilizer production (since they are free from upstream environmental burdens when estimated with the CLCA approach but in consideration of the avoided burdens from conventional manure management, i.e., avoided electricity production from biogas obtained by anaerobic digestion of manure), but the mechanized activities play a key role (and as detailed above, harvesting is the main responsible process regardless of the scenario).
In ecological scenarios, the production of marginal electricity is the environmental hotspot, which is required to compensate the manure that is partially destined for fertilizing activities.
Regarding the displaced commodities (feed carbohydrate, feed protein and vegetable oil), their effect over the profile varies with the scenarios. In some cropping systems, they constitute an environmental credit (S2, S5 and S8) mainly due to the avoided production of feed wheat (23.5 t DM, 22.5 t DM and 18.7 t DM, respectively) and to a lesser extent the avoided production of palm oil (0.90 t, 0.94 t and 0.79 t, respectively). Nevertheless, in other scenarios, such as S3, S6 and S9, they constitute an environmental hotspot. The reason behind these results is linked to the displacement of marginal fodder because of the co-production of potatoes, maize silage and rapeseed oil as detailed in Table 4.
Conversely, dLUC and iLUC must be analyzed in detail. As in the ALCA approach, dLUC is an environmental credit in most scenarios, due to the large amounts of WW straw returned into field. For that reason, the effect is negligible in S1. Concerning iLUC, this parameter plays a key role over the profile, as opposed to that estimated via ALCA. In the CLCA approach, iLUC was estimated as 8,661 kgCO2·ha−1 for a period of 6 years. Bearing in mind the WW grain yields per rotation system, iLUC ranges from 0.394 kgCO2·kgWW grain−1 in S1 to 1.44 kgCO2·kgWW grain−1 in S9; these values are considerably higher than those estimated via the ALCA approach (ranging from 3.5 to 23.6 gCO2·kgWW grain−1, depending on the scenario).

3.3. Selection of the Best Cropping System from a Climate Change Perspective

This study demonstrates how the conclusions, hotspots and decision-support to farmer and consumers can vary depending on the LCA approach adopted. According to our results, and as expected, there are discrepancies in the GW scores between both methodological approaches (ALCA and CLCA) and thus in the choice of the best cropping system from a climate change perspective, i.e., the one that produces WW grain with the lowest GW impact.
The GW scores are generally higher in CLCA: from 1.3 to 14.5 times higher in S2 and S6, respectively, for CLCA relative to ALCA, except in S5 and S7 where the score is slightly lower and in S8, where the global warming value is even negative for CLCA in comparison with ALCA (−1.86 and 0.498 kgCO2eq·kg−1 WW grain, for CLCA and ALCA, respectively, in the latter). Regarding the hotspots, although farming activities occupy a leading position in terms of GHG emission, their effect is more significant over the global profile in ALCA than in CLCA (although in terms of GHG emission per kg of WW grain, farming activities are from 2 to 4 times higher in CLCA than in ALCA, depending on the scenario). The allocation of environmental burdens from contributing parameters in ALCA and the system expansion approach in CLCA are the factors explaining the differences in the results.
Concerning the selection of the cropping system that produces WW grain with the lowest associated GHG emission level, S7, which involves the production of the Galician WW variety in combination with potato under ecological management, is the preferred scenario when an ALCA approach is considered (0.200 kgCO2eq·kg−1 WW grain), followed by S1 (0.208 kgCO2eq·kg−1 WW grain), where a commercial wheat variety is combined with potato under conventional management. Conversely, S5, where the Galician variety is cultivated under rotation with maize and conventional management, is the worst choice (0.586 kgCO2eq·kg−1 WW grain), followed by S8 (crop rotation of Galician variety with maize under ecological management, 0.498 kgCO2eq·kg−1 WW grain) (see Table 5).
The selection ranking notoriously changes (and even reverts) when the CLCA approach is considered. In this case, S8 is the preferred scenario (−1.86 kgCO2eq·kg−1 WW grain), followed by S7 (native wheat variety with potato under ecological management, 0.175 kgCO2eq·kg−1 WW grain), while S6 (native variety combined with oilseed rape under conventional management, 3.24 kgCO2eq·kg−1 WW grain) is the worst choice. The reason behind these results is mainly the different delimitation of system boundaries, among other methodological factors. Ecological scenarios, such as S7, S8 and S9, report a climate change profile that is penalized by the marginal electricity production. Moreover, indirect LUC effect is also penalized by the CLCA approach. In addition, ecological scenarios report the lowest crop yields, which directly involve highest impacts when the results are quantified per kg of product. Nevertheless, on the contrary, these scenarios involve environmental credits because of the avoided burdens of conventional manure management because of its use as fertilizer.
If an average value between the results of the two approaches was used to rank the crop rotations, the best and the worst crop rotations would be in line with those identified in the CLCA approach. Thus, S8 would be the best crop rotation (−0.681 kgCO2eq·kg−1 WW grain) to produce WW grain from a climate change perspective, and S6 the worst (1.73 kgCO2eq·kg−1 WW grain).
Considering that CLCA models the changes that are induced by a decision in a consequential manner and that ALCA models the share of global impacts that is attributed to the product under analysis [36,38,60], the delimitation of system boundaries is different in both approaches. In CLCA, the system boundaries are extended to include those processes that are affected by the decision in question, while in ALCA, the overall environmental impact of a specific product system is included in the system boundary [36]. Accordingly, differences in the results between both modelling approaches are expected. In our case study, these differences are due to the recovery of nutrients from manure in ecological systems (S7–S9), thereby avoiding the burdens of conventional manure management, as well as the inclusion of marginal feedstocks and electricity in CLCA and the use of average data and the partition of burdens between co-products in ALCA.
It can be concluded that the choice of the modelling framework leads to very different outcomes and conclusions, which is especially relevant for informing policy makers and other decision makers. It is therefore important to interpret the environmental results carefully—in our case, the carbon footprint of the farming systems under analysis—in line with the choices made.
Further research would be welcomed on (i) identifying the modelling parameters of the LCA approaches that better explain differences in results, (ii) further exploring their salient features and (iii) providing advances from current LCA practice that would support the reach of a much-needed consensus for identifying robust decision-support strategies.
However, despite their discrepancies and the fact that the modeled impacts are very sensitive to the approach taken, the importance of LCA and carbon footprinting for agricultural policy support is growing [60,61]. Therefore, the lack of scientific consensus on the treatment of critical methodological choices highlights the need for increased harmonization in LCA to improve the robustness and reproducibility of the results generated. In this regard, LCA practitioners, scientists and decision-makers need to address this issue urgently so that actions aimed at real climate change mitigation can be identified and implemented.

4. Conclusions

Based on an ALCA approach, the GHG emissions associated with the production of winter wheat grain under rotation with alternate crops (potato, maize silage and rapeseed) are considerably lower than those corresponding to the assessment made with a CLCA approach. In addition, the choice of the best rotation system yielding wheat grain with the lowest carbon footprint is therefore contradictory between the two approaches since the ranking of preferences changes considerably.
CLCA results for the analyzed rotation systems showed that producing co-products and using animal manure as fertilizer does not necessarily reduce the environmental impact of the target product (i.e., winter wheat grain). In fact, one ecological scenario (i.e., S9) is among those with the worst environmental profiles (after S6, S3 and S4). A similar trend can be observed when the ALCA approach is applied, albeit with exceptions since an ecological scenario reported the best environmental preference (Galician wheat variety combined with potato under an organic regime). Conversely, the cultivation of the Galician native variety combined with maize under an ecological regime (S8) stood out as the best choice under a CLCA approach, followed far behind by the rotation systems with potato (S7) and with maize but under a conventional regime (S5).
The identification of the marginal technology chosen for electricity production has a pronounced influence on the global warming impact and could lead to opposing results (i.e., the effect of the chosen marginal technology can considerably influence the GHG emissions, whether renewable or not). Accordingly, it is a factor to which results are sensitive.
Furthermore, it can be highlighted that assumptions required to perform a CLCA, such as definition of the other marginal products (e.g., fodders) have a large impact on results. Thus, results of a CLCA seem to be relatively more variable compared to results of the ALCA, but not necessarily more uncertain [38,53]. The burden sharing between co-products in ALCA also involves an uncertainty level since discrepancies can arise with the selection of the allocation procedure (economic, mass or energy).
Thus, the assumptions made affect the results considerably and have a direct effect on the final conclusions.
Although there is an extensive literature on both methodological approaches [34,36,38,53,58,60], there is neither a consensus on what they represent nor an overview of all their differences, nor have their main characteristics been studied in depth. Therefore, when selecting the modelling approach, the scope of the analysis (description of product-specific environmental impacts or environmental consequences of changes in product demand), the quality of the data (marginal or average data) and the timing should be considered, as they may lead to different conclusions and interpretations of the life cycle assessment results. Decisions that are expected to result in an improvement of the environmental impact of a system cannot be based on incomplete assessments of the effects resulting from these decisions. In this sense, it is important to ensure consistency between the objective and scope of the study and the modeling approach adopted, choosing the appropriate approach to answer the research question at hand. In this regard, comprehensive assessments that include market-mediated effects can be important when competing modeling approaches may lead to opposing decisions. These challenges are relevant not only for agricultural products and commodities, but also for products in general.

Author Contributions

All authors contributed to the study conception and design. Material preparation and data collection were performed by S.G.-G. and F.A. Data analysis, conceptualization, investigation and methodology were performed by S.G.-G. and M.B. The first draft of the manuscript was written by S.G.-G. and M.B. performed a detailed supervision of the manuscript. All authors commented on previous versions of the manuscript. All authors have read and agreed to the published version of the manuscript.

Funding

This research has been partially supported by the project Enhancing diversity in Mediterranean cereal farming systems (CerealMed), funded by PRIMA Programme and FEDER/Ministry of Science and Innovation—Spanish National Research Agency (PCI2020-111978), and by the project Transition to sustainable agri-food sector bundling life cycle assessment and ecosystem services approaches (ALISE), funded by the Spanish National Research Agency (TED2021-130309B-I00). S.G-G. belongs to the Galician Competitive Research Groups (GRC) ED431C-2021/37, co-funded by Xunta de Galicia and FEDER (EU). S.G-G. thanks the Spanish Ministry of Education and Professional Training (Gran reference CAS19/00037) for financing the research stay where this study was partially developed.

Institutional Review Board Statement

Not applicable.

Informed Consent Statement

Not applicable.

Data Availability Statement

Not applicable.

Conflicts of Interest

The authors declare no conflict of interest.

Appendix A

Figure A1. System description of the commercial winter wheat cultivation (WWC) in a conventional management regime and under a rotation crop system with (a) potato (Pcm), (b) maize (Mcm) and (c) oilseed rape (OSRcm).
Sustainability 15 04941 g0a1aSustainability 15 04941 g0a1b
Figure A2. System description of the native winter wheat cultivation (WWN) in a conventional management regime and under a rotation crop system with (a) potato (Pcm), (b) maize (Mcm) and (c) oilseed rape (OSRcm).
Sustainability 15 04941 g0a2aSustainability 15 04941 g0a2b
Figure A3. System description of the native winter wheat cultivation (WWN) in an ecological management regime and under a rotation crop system with (a) potato (Pem), (b) maize (Mem) and (c) oilseed rape (OSRem).
Sustainability 15 04941 g0a3aSustainability 15 04941 g0a3b
Figure A4. Flowchart and system boundaries for the attributional LCA of rotation systems with allocation. Black box is only included as co-product in commercial winter wheat production. Dashed black line delimits each agricultural system. Grey box delimits the boundaries of processes directly included in farming activities; A—Allocation factor.
Sustainability 15 04941 g0a4
Figure A5. Flowchart and system boundaries for the consequential LCA of rotation systems with system expansion. Black box is only included as co-product in commercial winter wheat production. Dashed black line delimits each agricultural system. Red boxes correspond to displaced processes. Green box corresponds to an avoided process. Grey box delimits the boundaries of processes directly included in farming activities.
Sustainability 15 04941 g0a5
Table A1. Agricultural inputs used in the 6-year crop-rotation systems per hectare.
S1S2S3S4S5S6S7S8S9
kg Nmineral·ha−16236774984415403623.12 a2.34 a2.34 a
kg Norganic·ha−1------------348642480
kg Pmineral·ha−1528612338288432158------
kg Porganic·ha−1------------139242177
kg Kmineral·ha−1672828338432648158125 b----
kg Korganic·ha−1------------176400299
kg Diesel·ha−1364393300320360267331388299
kg Herbicides c·ha−17.526.005.777.225.785.542.972.59--
kg Insecticides c·ha−10.190.410.000.190.41--0.920.69--
kg Fungicides c·ha−15.850.980.386.951.350.7510.350.60--
kg Seeds·ha−1350069061233005404623300540462
a Foliar fertilizer; b Authorized for ecological management; c Active ingredient.
Table A2. Overview of economic allocation factors (in %) in attributional LCA.
Co-ProductsS1S2S3S4S5S6S7S8S9
WW grain273652304259323249
WW straw467------------
Potatoes—food68----68----66----
Potatoes—feed2----2----1----
Maize silage--58----58----68--
Oilseeds----41----41----51

References

  1. Mäkinen, H.; Kaseva, J.; Trnka, M.; Balek, J.; Kersebaum, K.; Nendel, C.; Gobin, A.; Olesen, J.; Bindi, M.; Ferrise, R.; et al. Sensitivity of European wheat to extreme weather. Field Crop. Res. 2018, 222, 209–217. [Google Scholar] [CrossRef]
  2. European Environment Agency. Climate Change Adaptation in the Agriculture Sector in Europe 1994–2019; EEA Report No. 04/2019; Publications Office of the European Union: Luxembourg, 2019; ISBN 978 92 9480 072-5. [Google Scholar] [CrossRef]
  3. Mrabet, R.; Savé, R.; Toreti, A.; Caiola, N.; Chentouf, M.; Llasat, M.C.; Mohamed, A.A.A.; Santeramo, F.G.; Sanz-Cobena, A.; Tsikliras, A. Food. In Climate and Environmental Change in the Mediterranean Basin—Current Situation and Risks for the Future; First Mediterranean Assessment Report; Cramer, W., Guiot, J., Marini, K., Eds.; Union for the Mediterranean, Plan Bleu, UNEP/MAP: Marseille, France, 2020; 26p. [Google Scholar]
  4. Wang, C.; Li, X.; Gong, T.; Zhang, H. Life cycle assessment of wheat-maize rotation system emphasizing high crop yield and high resource use efficiency in Quzhou County. Clean. Prod. 2014, 68, 56–63. [Google Scholar] [CrossRef]
  5. European Commission. EU Agricultural Outlook for the Agricultural Markets and Income 2017–2030. 2017. Available online: https://ec.europa.eu/info/sites/info/files/food-farming-fisheries/farming/documents/agricultural-outlook-2017-30_en.pdf (accessed on 20 August 2022).
  6. Khoshnevisan, B.; Rafiee, S.; Omid, M.; Yousefi, M.; Movahedj, M. Modeling of energy consumption and GHG (greenhouse gas) emissions in wheat production in Esfahan province of Iran using artificial neural networks. Energy 2013, 52, 333–338. [Google Scholar] [CrossRef]
  7. Erenstein, O.; Jaleta, M.; Mottaleb, K.A.; Sonder, K.; Donovan, J.; Braun, H.-J. Global Trends in Wheat Production, Consumption and Trade. In Wheat Improvement; Springer International Publishing: Cham, Switzerland, 2022; pp. 47–66. [Google Scholar] [CrossRef]
  8. FAO. FAOSTAT Statistical Database [WWW Document]. 2022. Available online: https://www.fao.org/faostat/es/#data (accessed on 15 September 2022).
  9. Statista. 2020. Available online: https://www.statista.com/outlook/40050100/102/bread/europe (accessed on 10 January 2021).
  10. Taylor, R.D. Outlook of the U.S. and World Wheat Industries; Agribusiness & Applied Economics: Fargo, ND, USA, 2017. [Google Scholar]
  11. Hellemans, T.; Landschoot, S.; Dewitte, K.; Van Bockstaele, F.; Vermeir, P.; Eeckhout, M.; Haesaert, G. Impact of crop husbandry practices and environmental conditions on wheat composition and quality: A review. J. Agric. Food Chem. 2018, 66, 2491–2509. [Google Scholar] [CrossRef] [PubMed]
  12. Holka, M.; Jankowiak, J.; Bienkowski, J.F.; Dabrowicz, R. Life Cycle Assessment (LCA) of winter wheat in an intensive crop production system un Wielkopolska region (Poland). Appl. Ecol. Environ. Res. 2015, 14, 535–545. [Google Scholar] [CrossRef]
  13. Muhammed, S.E.; Coleman, K.; Wu, L.; Bell, V.A.; Davies, J.A.C.; Quinton, J.N.; Carnell, E.J.; Tomlinson, S.J.; Dore, A.J.; Dragosits, U.; et al. Impact of two centuries of intensive agriculture on soil carbon, nitrogen and phosphorus cycling in the UK. Sci. Total Environ. 2018, 634, 1486–1504. [Google Scholar] [CrossRef]
  14. Rose, M.; Pahlmann, I.; Kage, H. Modified crop rotations for a sustainable intensification? A case study in a high-yielding environment with recurrent nitrogen surplus. Eur. J. Agron. 2023, 142, 126644. [Google Scholar] [CrossRef]
  15. Blandino, M.; Visioli, G.; Marando, S.; Marti, A.; Reyneri, A. Impact of late-season N fertilisation strategies on the gluten content and composition of high protein wheat grown under humid Mediterranean conditions. J. Cereal Sci. 2020, 94, 102995. [Google Scholar] [CrossRef]
  16. EIP-AGRI. Sustainable and Resilient Farming. Inspiration from Agro-Ecology; EIP-AGRI: Brussels, Belgium, 2020. [Google Scholar]
  17. Rahimizadeh, M.; Kashani, A.; Zare-Feizabadi, A.; Koocheki, A.; Nassiri Mahallati, M. Nitrogen Use Efficiency of Wheat as Affected by Preceding Crop, Application Rate of Nitrogen. Aust. J. Crop Sci. 2010, 4, 363–368. [Google Scholar]
  18. Riedell, W.E.; Pikul, J.L.; Jaradat, A.A.; Schumacher, T.E. Crop rotation and nitrogen input effects on soil fertility, maize mineral nutrition, yield, and seed composition. Agron. J. 2009, 101, 870–879. [Google Scholar] [CrossRef] [Green Version]
  19. Preissel, S.; Reckling, M.; Bachinger, J.; Zander, P. Introducing legumes into European cropping systems: Farm-level economic effects. In Legumes in Cropping Systems; CABI: Wallingford, UK, 2017; pp. 209–225. [Google Scholar] [CrossRef]
  20. Köpke, U.; Nemecek, T. Ecological services of faba bean. Field Crop. Res. 2010, 115, 217–233. [Google Scholar] [CrossRef]
  21. Nemecek, T.; von Richthofen, J.-S.; Dubois, G.; Casta, P.; Charles, R.; Pahl, H. Environmental impacts of introducing grain legumes into European crop rotations. Eur. J. Agron. 2008, 28, 380–393. [Google Scholar] [CrossRef]
  22. Nemecek, T.; Hayer, F.; Bonnin, E.; Carrouée, B.; Schneider, A.; Vivier, C. Designing eco-efficient crop rotations using life cycle assessment of crop combinations. Eur. J. Agron. 2015, 65, 40–51. [Google Scholar] [CrossRef]
  23. Amossé, C.; Jeuffroy, M.-H.; David, C. Relay intercropping of legume cover crops in organic winter wheat: Effects on performance and resource availability. Field Crop. Res. 2013, 145, 78–87. [Google Scholar] [CrossRef]
  24. Câmara-Salim, I.; Almeida-García, F.; González-García, S.; Romero-Rodríguez, A.; Ruíz-Nogueiras, B.; Pereira-Lorenzo, S.; Feijoo, G.; Moreira, M.T. Life cycle assessment of autochthonous varieties of wheat and artisanal bread production in Galicia, Spain. Sci. Total Environ. 2020, 713, 136720. [Google Scholar] [CrossRef]
  25. Noya, I.; González-García, S.; Bacenetti, J.; Arroja, L.; Moreira, M.T. Comparative life cycle assessment of three representative feed cereals production in the Po Valley (Italy). J. Clean. Prod. 2015, 99, 250–265. [Google Scholar] [CrossRef]
  26. Noya, I.; González-García, S.; Bacenetti, J.; Fiala, M.; Moreira, M.T. Environmental impacts of the cultivation-phase associated with agricultural crops for feed production. J. Clean. Prod. 2018, 172, 3721–3733. [Google Scholar] [CrossRef]
  27. González-García, S.; Bacenetti, J.; Negri, M.; Fiala, M.; Arroja, L. Comparative environmental performance of three different annual energy crops for biogas production in Northern Italy. J. Clean. Prod. 2013, 43, 71–83. [Google Scholar] [CrossRef]
  28. Costa, M.P.; Chadwick, D.; Saget, S.; Rees, R.M.; Williams, M.; Styles, D. Representing crop rotations in life cycle assessment: A review of legume LCA studies. Int. J. Life Cycle Assess. 2020, 25, 1942–1956. [Google Scholar] [CrossRef]
  29. González-García, S.; Baucells, F.; Feijoo, G.; Moreira, M.T. Environmental performance of sorghum, barley and oat silage production for livestock feed using life cycle assessment. Resour. Conserv. Recycl. 2016, 111, 28–41. [Google Scholar] [CrossRef]
  30. Nemecek, T.; Huguenin-Elie, O.; Dubois, D.; Gaillard, G.; Schaller, B.; Chervet, A. Life cycle assessment of Swiss farming systems: II. Extensive and intensive production. Agric. Syst. 2011, 104, 233–245. [Google Scholar] [CrossRef]
  31. Salim, I.; González-García, S.; Feijoo, G.; Moreira, M.T. Assessing the environmental sustainability of glucose from wheat as a fermentation feedstock. J. Environ. Manag. 2019, 247, 323–332. [Google Scholar] [CrossRef] [PubMed]
  32. Virtanen, Y.; Kurppa, S.; Saarinen, M.; Katajajuuri, J.-M.; Usva, K.; Mäenpää, I.; Mäkelä, J.; Grönroos, J.; Nissinen, A. Carbon footprint of food—Approaches from national input–output statistics and a LCA of a food portion. J. Clean. Prod. 2011, 19, 1849–1856. [Google Scholar] [CrossRef]
  33. Zhang, F.; Cai, Y.; Tan, Q.; Engel, B.A.; Wang, X. An optimal modeling approach for reducing carbon footprint in agricultural water-energy-food nexus system. J. Clean. Prod. 2021, 316, 128325. [Google Scholar] [CrossRef]
  34. Agarski, B.; Vukelic, D.; Hadzistevic, M.; Micunovic, M.I.; Budak, I. Attributional versus consequential life cycle assessment modelling in metalworking production system. Mašinstvo 2019, 1–2, 37–42. [Google Scholar]
  35. Soimakallio, S.; Cowie, A.; Brandão, M.; Finnveden, G.; Ekvall, T.; Erlandsson, M.; Koponen, K.; Karlsson, P.-E. Attributional Life Cycle Assessment: Is a Land-Use Baseline Necessary? Int. J. Life Cycle Assess. 2015, 20, 1364–1375. [Google Scholar] [CrossRef]
  36. Schaubroeck, T.; Schaubroeck, S.; Heijungs, R.; Zamagni, A.; Brandão, M.; Benetto, E. 2021. Attributional & Consequential Life Cycle Assessment: Definitions, Conceptual Characteristics and Modelling Restrictions. Sustainability 2021, 13, 7386. [Google Scholar]
  37. Thomassen, M.A.; Dalgaard, R.; Heijungs, R.; de Boer, I. Attributional and consequential LCA of milk production. Int. J. Life Cycle Assess. 2008, 13, 339–349. [Google Scholar] [CrossRef] [Green Version]
  38. Brandão, M.; Heijungs, R.; Cowie, A.L. On quantifying sources of uncertainty in the carbon footprint of biofuels: Crop/feedstock, LCA modelling approach, land-use change, and GHG metrics. Biofuel Res. J. 2022, 34, 1608–1616. [Google Scholar] [CrossRef]
  39. Sonnemann, G.; Vigon, B. (Eds.) Global Guidance Principles for Life Cycle Assessment Databases. In UNEP SETAC Life Cycle Initiative; UNEP: Nairobi, Kenya, 2011; Available online: http://www.unep.fr/shared/publications/pdf/DTIx1410xPA-GlobalGuidancePrinciplesforLCA.pdf (accessed on 15 January 2021).
  40. Brankatschk, G.; Finkbeiner, M. Application of the Cereal Unit in a new allocation procedure for agricultural life cycle assessments. J. Clean. Prod. 2014, 73, 72–79. [Google Scholar] [CrossRef]
  41. Goglio, P.; Smith, W.N.; Grant, B.B.; Desjardins, R.L.; McConkey, B.G.; Campbell, C.A.; Nemecek, T. Accounting for soil carbon changes in agricultural life cycle assessment (LCA): A review. J. Clean. Prod. 2015, 104, 23–39. [Google Scholar] [CrossRef]
  42. Esteve-Llorens, X.; Moreira, M.T.; Feijoo, G.; González-García, S. Linking environmental sustainability and nutritional quality of the Atlantic diet recommendations and real consumption habits in Galicia (NW Spain). Sci. Total Environ. 2019, 683, 71–79. [Google Scholar] [CrossRef]
  43. Ankathi, S.K.; Long, D.S.; Gollany, H.T.; Das, P.; Shonnard, D. Life cycle assessment of oilseed crops produced in rotation with dryland cereals in the inland Pacific Northwest. Int. J. Life Cycle Assess. 2019, 24, 627–641. [Google Scholar] [CrossRef]
  44. Handler, R.M.; Shonnard, D.R.; Lautala, P.; Abbas, D.; Srivastava, A. Environmental impacts of roundwood supply chain options in Michigan: Life-cycle assessment of harvest and transport stages. J. Clean. Prod. 2014, 76, 64–73. [Google Scholar] [CrossRef]
  45. González-García, S.; Almeida, F.; Moreira, M.T.; Brandão, M. Evaluating the environmental profiles of winter wheat rotation systems under different management strategies. Sci. Total Environ. 2021, 770, 145270. [Google Scholar] [CrossRef]
  46. Wernet, G.; Bauer, C.; Steubing, B.; Reinhard, J.; Moreno-Ruiz, E.; Weidema, B. The ecoinvent database version 3 (part I): Overview and methodology. Int. J. Life Cycle Assess. 2016, 21, 1218–1230. [Google Scholar] [CrossRef]
  47. IPCC—The Intergovernmental Panel on Climate Change. N2O Emissions from Managed Soils, and CO2 Emissions from Lime and Urea Application Chapter 11. In 2019 Refinement to the 2006 IPCC Guidelines for National Greenhouse Gas Inventories; Agriculture, Forestry and Other Land Use; IPCC: Geneva, Switzerland, 2019; Volume 4. [Google Scholar]
  48. EEA—European Environment Agency. EMEP/EEA Air Pollutant Emission Inventory Guidebook 2019; Hutchings, N., Webb, J., Amon, B., Eds.; EEA: Copenhagen, Denmark, 2019. [Google Scholar]
  49. Faist Emmenegger, M.; Reinhard, J.; Zah, R. Sustainability Quick Check for Biofuels—Intermediate Background Report; Ziep, T., Weichbrodt, R., Wohlgemuth, V., Roches, A., Knuchel, R.F., Gaillard, G., Eds.; Agroscope Reckenholz-Tänikon: Dübendorf, Switzerland, 2009. [Google Scholar]
  50. González-García, S.; Gómez-Fernández, Z.; Días, A.C.; Feijoo, G.; Moreira, M.T.; Arroja, L. Life Cycle Assessment of broiler chicken production: A Portuguese case study. J. Clean. Prod. 2014, 74, 125–134. [Google Scholar] [CrossRef]
  51. Cortes, A.; Feijoo, G.; Fernández, M.; Moreira, M.T. Pursuing the route to eco-efficiency in dairy production: The case of Galician area. J. Clean. Prod. 2020, 285, 124861. [Google Scholar] [CrossRef]
  52. Schmidt, J.H.; Weidema, B.P. Shift in the Marginal Supply of Vegetable Oil. Int. J. Life Cycle Assess. 2008, 13, 235–239. [Google Scholar] [CrossRef]
  53. Brandão, M. Food, Feed, Fuel, Timber or Carbon Sink? Towards Sustainable Land-Use Systems—A consequential Life Cycle Approach. Ph.D. Thesis, Centre for Environmental Strategy, Faculty of Engineering and Physical Sciences, University of Surrey, Guildford, UK, 2012; p. 241. [Google Scholar]
  54. Schmidt, J. Life Cycle Assessment of Rapessed Oil and Palm Oil. Department of Development and Planning. Ph.D. Thesis, University of Aalborg, Aalborg, Denmark, 2007; p. 362. [Google Scholar]
  55. Spanish Electricty Network. The Spanish Electricity System. Preliminary Report 2018 Committed to Intelligent Energy. Red Electrica de España. Available online: https://www.ree.es/sites/default/files/11_PUBLICACIONES/Documentos/InformesSistemaElectrico/2019/Avance_ISE_2018_en.pdf (accessed on 20 August 2020).
  56. Spanish Electricty Network. 2020. Available online: https://www.ree.es/ (accessed on 20 August 2020).
  57. Rodríguez-Verde, I.; Regueiro, L.; Lema, J.M.; Carballa, M. Blending based optimisation and pretreatment strategies to enhance anaerobic digestion of poultry manure. Waste Manag. 2018, 71, 521–531. [Google Scholar] [CrossRef]
  58. Schmidt, J.H.; Weidema, B.P.; Brandão, M. A Framework for Modelling Indirect Land Use Changes in Life Cycle Assessment. J. Clean. Prod. 2015, 99, 230–238. [Google Scholar] [CrossRef]
  59. Fang, Y.; Singh, B.P.; Cowie, A.; Wang, W.; Arachchi, M.H.; Wang, H.; Tavakkoli, E. Balancing nutrient stoichiometry facilitates the fate of wheat residue carbon in physically defined soil organic matter fractions. Geoderma 2019, 354, 113883. [Google Scholar] [CrossRef]
  60. Brandão, M.; Azzi, E.; Novaes, R.M.L.; Cowie, A. The modelling approach determines the carbon footprint of biofuels: The role of LCA in informing decision makers in government and industry. Clean. Environ. Syst. 2021, 2, 100027. [Google Scholar] [CrossRef]
  61. Sala, S.; Amadei, A.M.; Beylot, A.; Ardente, F. The evolution of life cycle assessment in European policies over three decades. Int. J. Life Cycle Assess. 2021, 26, 2295–2314. [Google Scholar] [CrossRef]
Figure 1. Layout of the 6-year crop rotation systems under study represented in the scenarios (S1–S9), regardless of conventional or ecological management.
Sustainability 15 04941 g001aSustainability 15 04941 g001b
Figure 2. Global warming (GW) profile for each scenario under ALCA approach and distribution of burdens derived from farming activities.
Sustainability 15 04941 g002
Figure 3. Global warming (GW) profile for each scenario under CLCA approach and distribution of burdens derived from farming activities.
Sustainability 15 04941 g003
Table 1. Crop rotations assessed under different regimes (conventional (cm)and ecological (em)) and wheat seed varieties (commercial and native). Note that ecological management is always modelled with the native wheat variety. Abbreviations: Si—Scenario i; N/A—non available.
Wheat VarietyPotato (P)Maize (M)Oilseed Rape (OSR)
Management
Conventional (cm)Ecological (em)Conventional (cm)Ecological (em)Conventional (cm)Ecological (em)
Commercial (C)S1N/AS2N/AS3N/A
Native (N)S4S7S5S8S6S9
Table 2. Yield of co-products and straw returned into field per rotation system.
S1S2S3S4S5S6S7S8S9
Co-products
t WW grain ξ·ha−122.0015.6015.0011.208.107.5010.006.606.00
t WW straw ω·ha−17.485.305.10------------
t Potato β (food)·ha−163.00----63.00----36.00----
t Potato β (feed)·ha−17.00----7.00----4.00----
t Maize silage Ф·ha−1--90.00----90.00----75.00--
t Oilseeds α·ha−1----10.50----10.50----7.50
Straw returned into field
t straw DM·ha−11.1613.5722.399.4719.5927.949.7912.8220.26
ξ 12% moisture; ω 12% moisture; β 80% moisture; Ф 70% moisture; α 9% moisture; Acronyms: Si—Scenario i; DM—dry matter; WW—winter wheat.
Table 3. Content of energy, protein and vegetable oil for the main and marginal crops. Data from [40,41].
Carbohydrate (GJ)Protein (kg)Vegetable Oil (t)
Feed wheat (per tDM)16.23750
Soybean meal (per t DM)15.483630
Palm oil (per t oil)2.2919.001.00
Wheat straw (per tDM)4.0629.500
Potato (per tDM)3.141140
Maize silage (t DM)11.258.500
Rapeseed oil (per t oil)16.334651.00
DM—dry matter.
Table 4. Marginal products affected by an increase in the production of feed from wheat straw, potato, maize silage and oilseed rape in the rotation systems (1 ha cultivation for 6 years).
Rotation SystemsSoybean Meal (tDM)Feed Wheat (tDM)Palm Oil (t Refined)
S1−5.060.301.18
S23.88−23.46−0.90
S35.44−0.422.74
S4−4.811.721.12
S54.06−22.45−0.94
S65.29−1.402.79
S7−2.750.980.64
S83.38−18.71−0.79
S93.76−0.991.98
DM—dry matter.
Table 5. Characterized results for global warming of the cropping systems using attributional LCA with economic allocation and consequential LCA with system expansion (kgCO2eq·kg−1 WW grain). Acronym: Si—Scenario i.
S1S2S3S4S5S6S7S8S9
ALCA0.2080.3800.2700.2800.5860.2220.2000.4980.374
Rank274593186
CLCA1.160.4902.021.910.3913.240.175−1.861.45
Rank548739216
Average0.6840.4351.151.100.4891.730.188−0.6810.912
Rank538749216
Disclaimer/Publisher’s Note: The statements, opinions and data contained in all publications are solely those of the individual author(s) and contributor(s) and not of MDPI and/or the editor(s). MDPI and/or the editor(s) disclaim responsibility for any injury to people or property resulting from any ideas, methods, instructions or products referred to in the content.

