
Probability-Based City-Scale Risk Assessment of Passengers Trapped in Elevators under Earthquakes


Abstract
1. Introduction
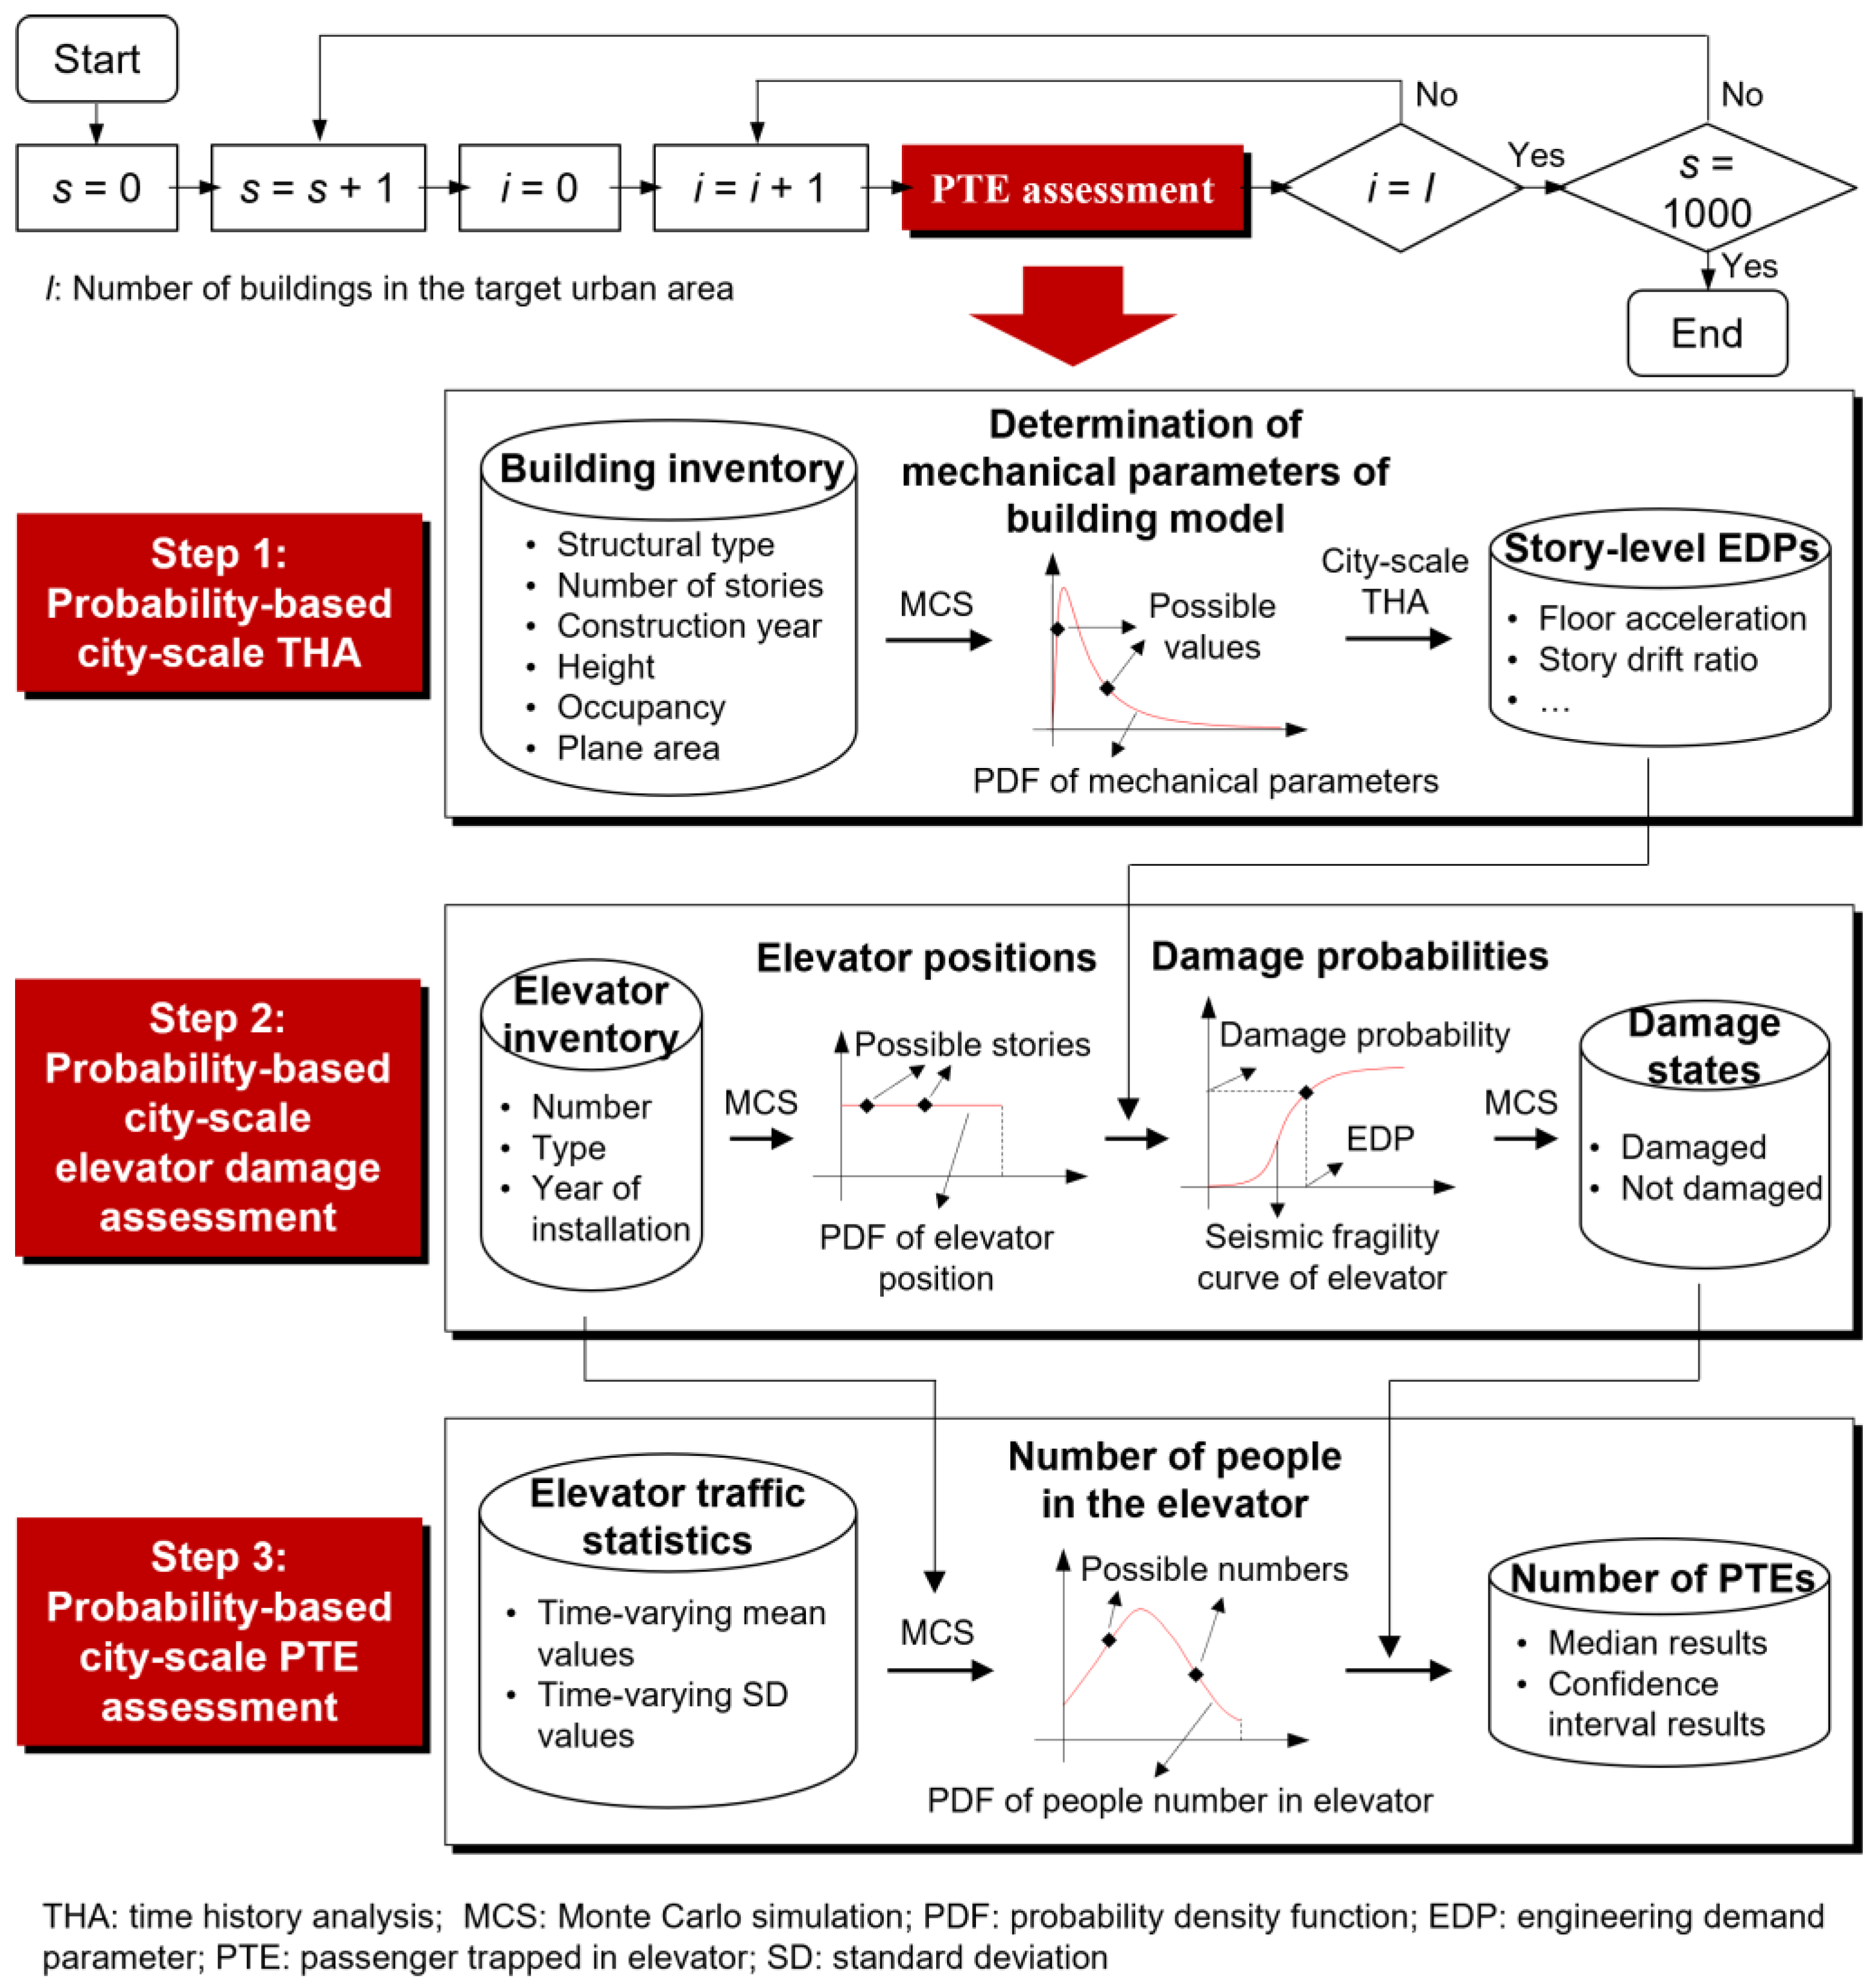
2. Workflow
- Step 1: Probability-based city-scale THA
- Step 2: Probability-based city-scale elevator damage assessment
- Step 3: Probability-based city-scale elevator PTE assessment
3. Methodologies
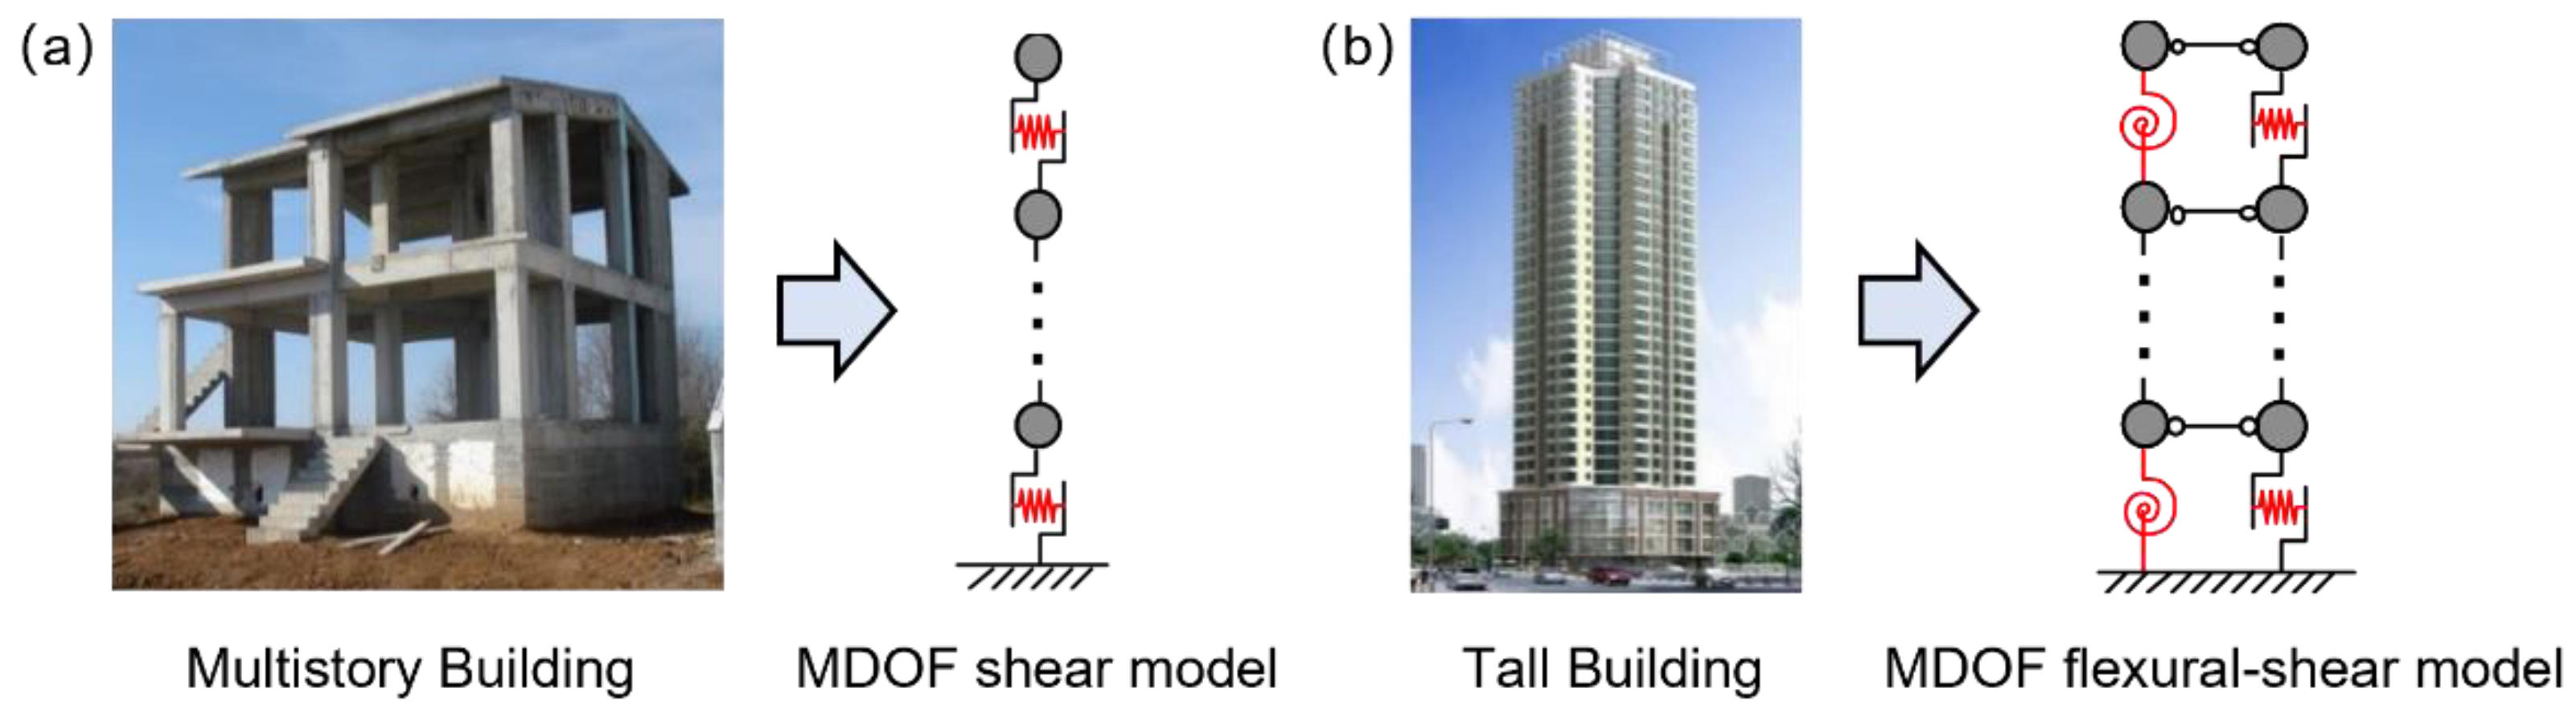
3.1. Probability-Based City-Scale THA
- (1)
- In each realization, the first two order periods of the MDOF flexural–shear model are calculated based on the building height using empirical formulas. Then, the bending-to-shear stiffness ratio can be obtained. Consequently, the structure’s elastic bending and shear stiffness values can be calculated, respectively.
- (2)
- The design capacity of the shear and bending springs on each story is obtained by the mode-superposition response spectrum method. Subsequently, the distribution features of the yield and peak overstrength parameters, namely Ωy and Ωp, respectively, are determined, based on which the Ωy and Ωp values are sampled stochastically in each realization. Consequently, the yield and peak points of the force–displacement skeleton curves of the shear and bending springs can be identified.
- (3)
- The hysteresis parameters of the structure are determined.
- (4)
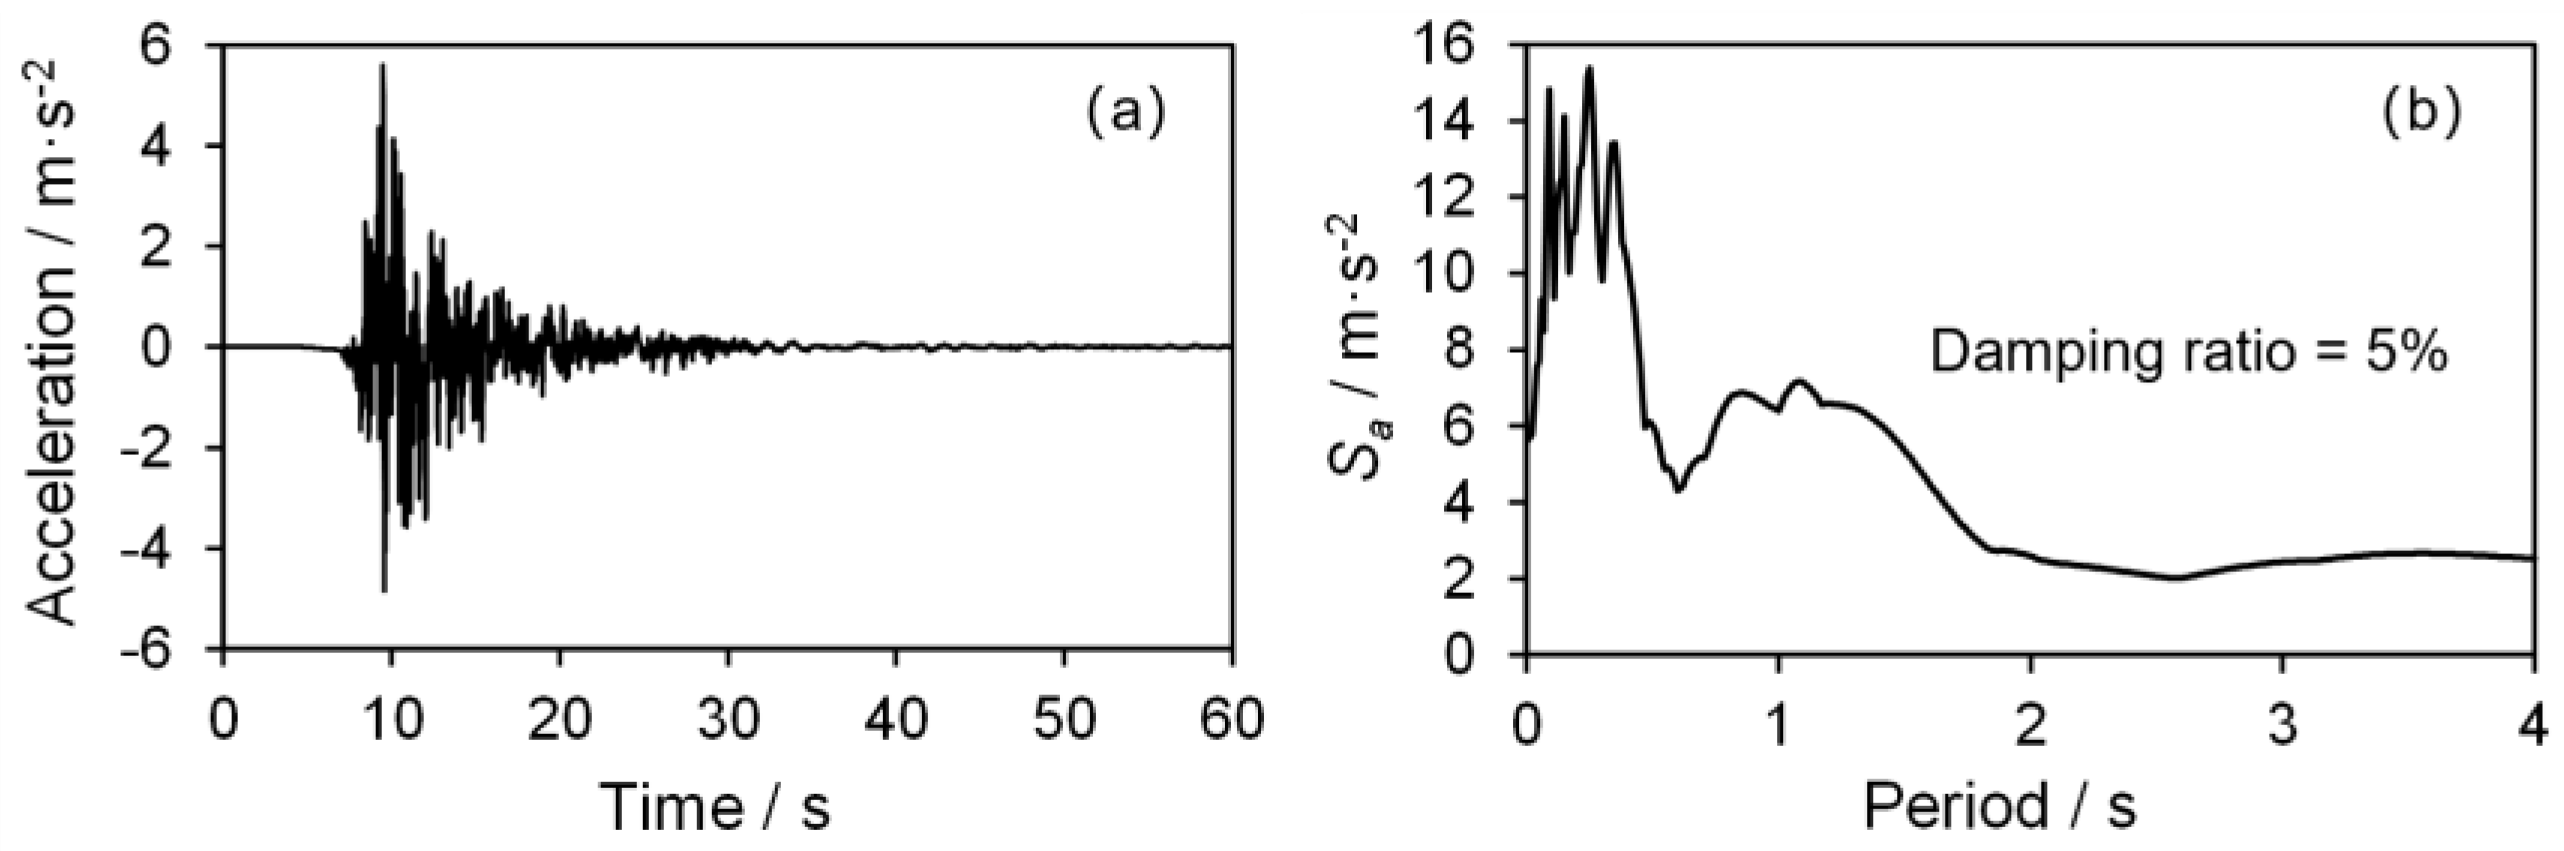
- A nonlinear THA of the MDOF flexural-shear model is performed using the central difference method to obtain the seismic response of the structure.
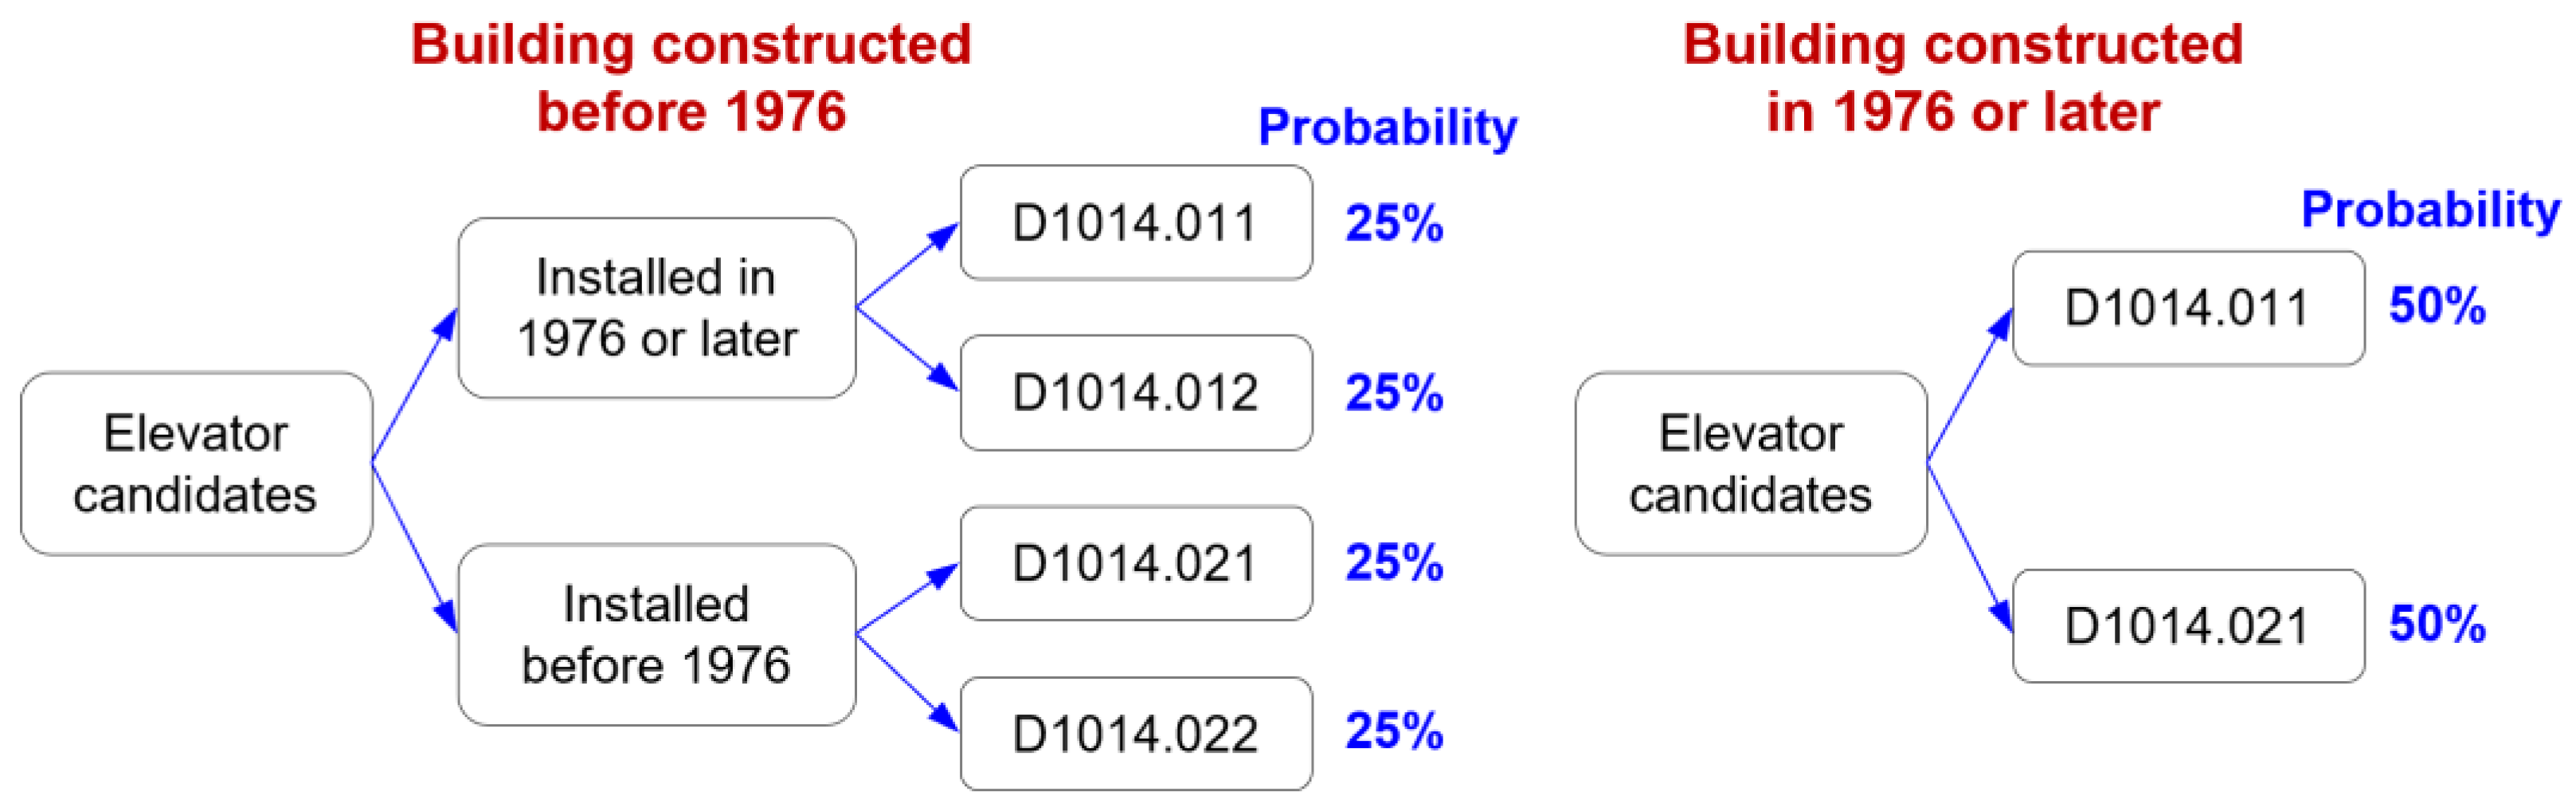
3.2. Probability-Based City-Scale Elevator Damage Assessment
3.2.1. Elevator Inventory
3.2.2. Elevator Position
3.2.3. Damage Probability and Damage State
3.3. Probability-Based City-Scale PTE Assessment
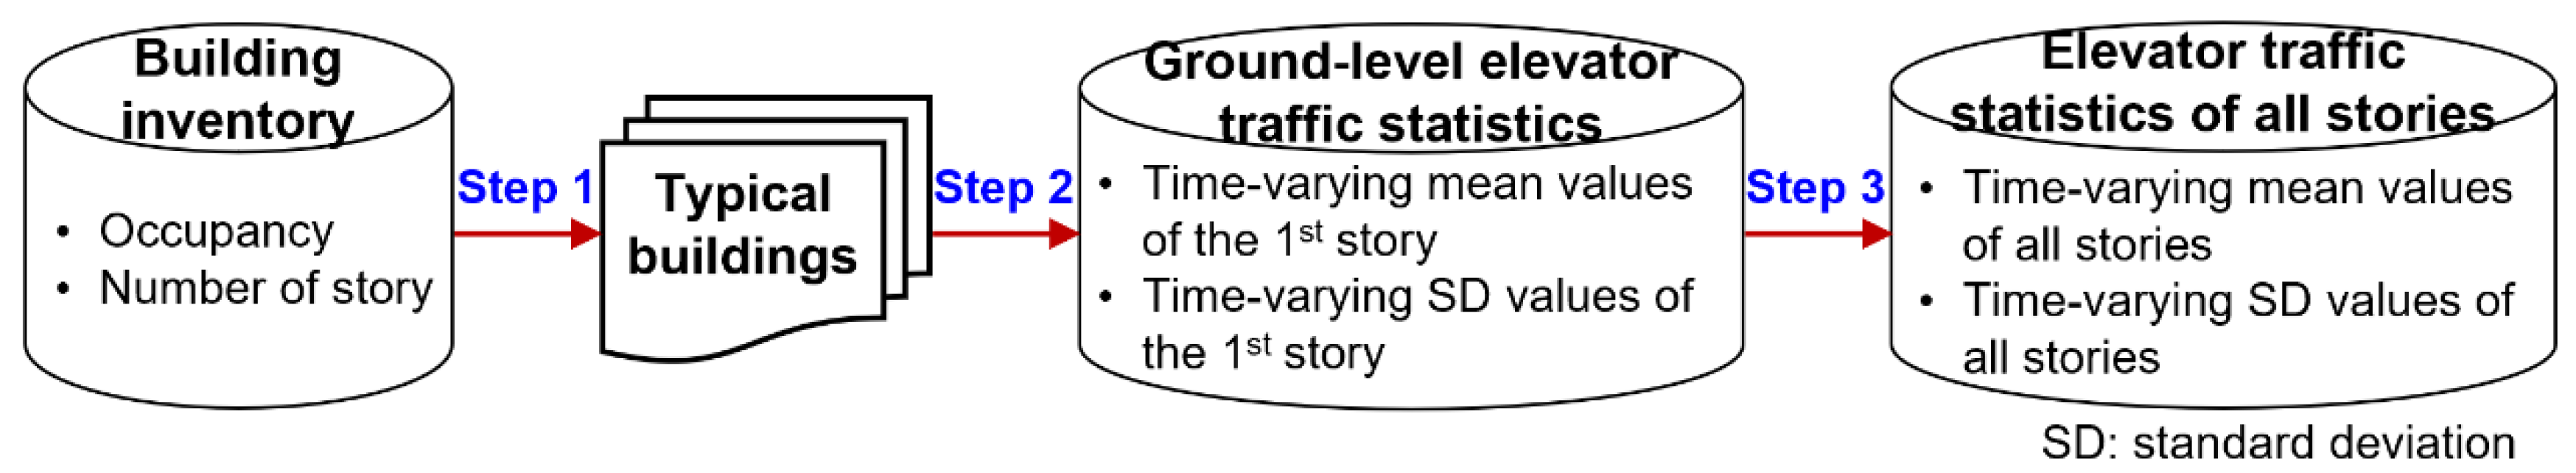
3.3.1. Elevator Traffic Statistics
- Step 1: Typical building selection
- Step 2: Estimation of ground-level elevator traffic statistics
- Step 3: Estimation of elevator traffic statistics on all stories
3.3.2. Number of Elevator Passengers
3.3.3. Number of PTEs
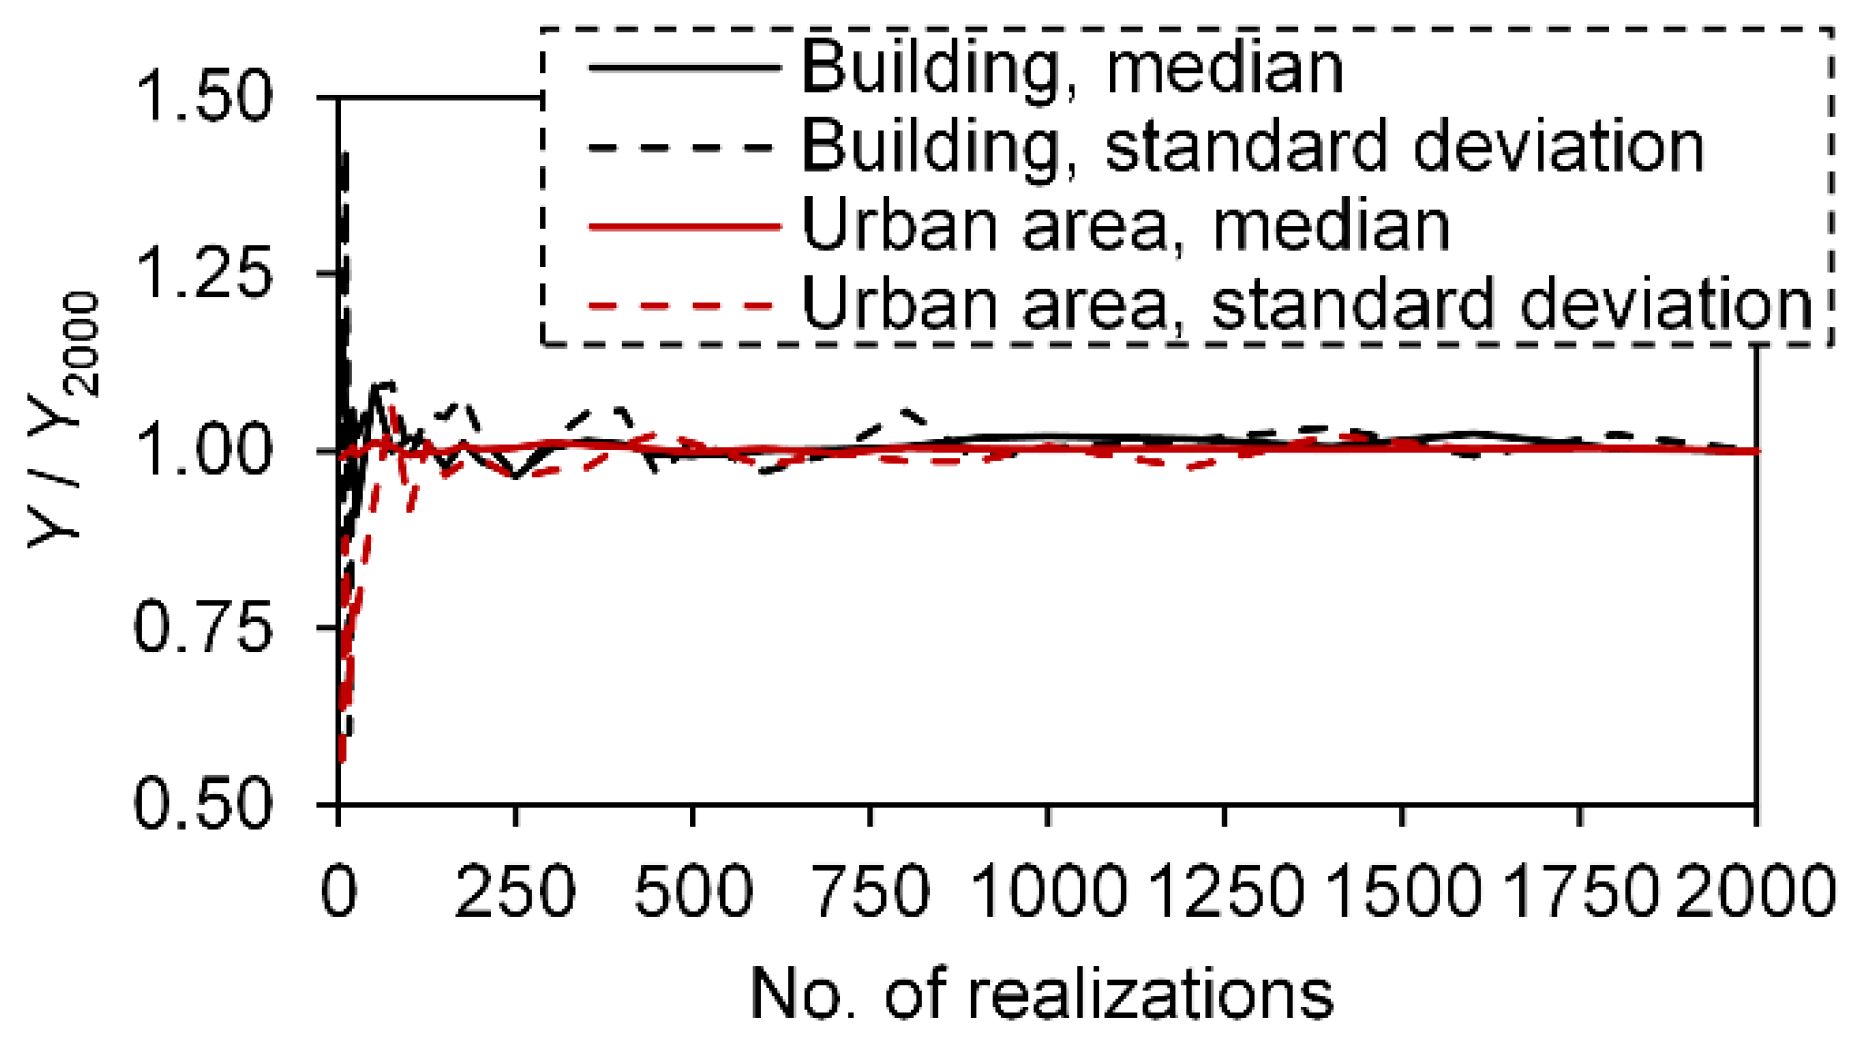
3.4. Number of Realizations
4. Case Study
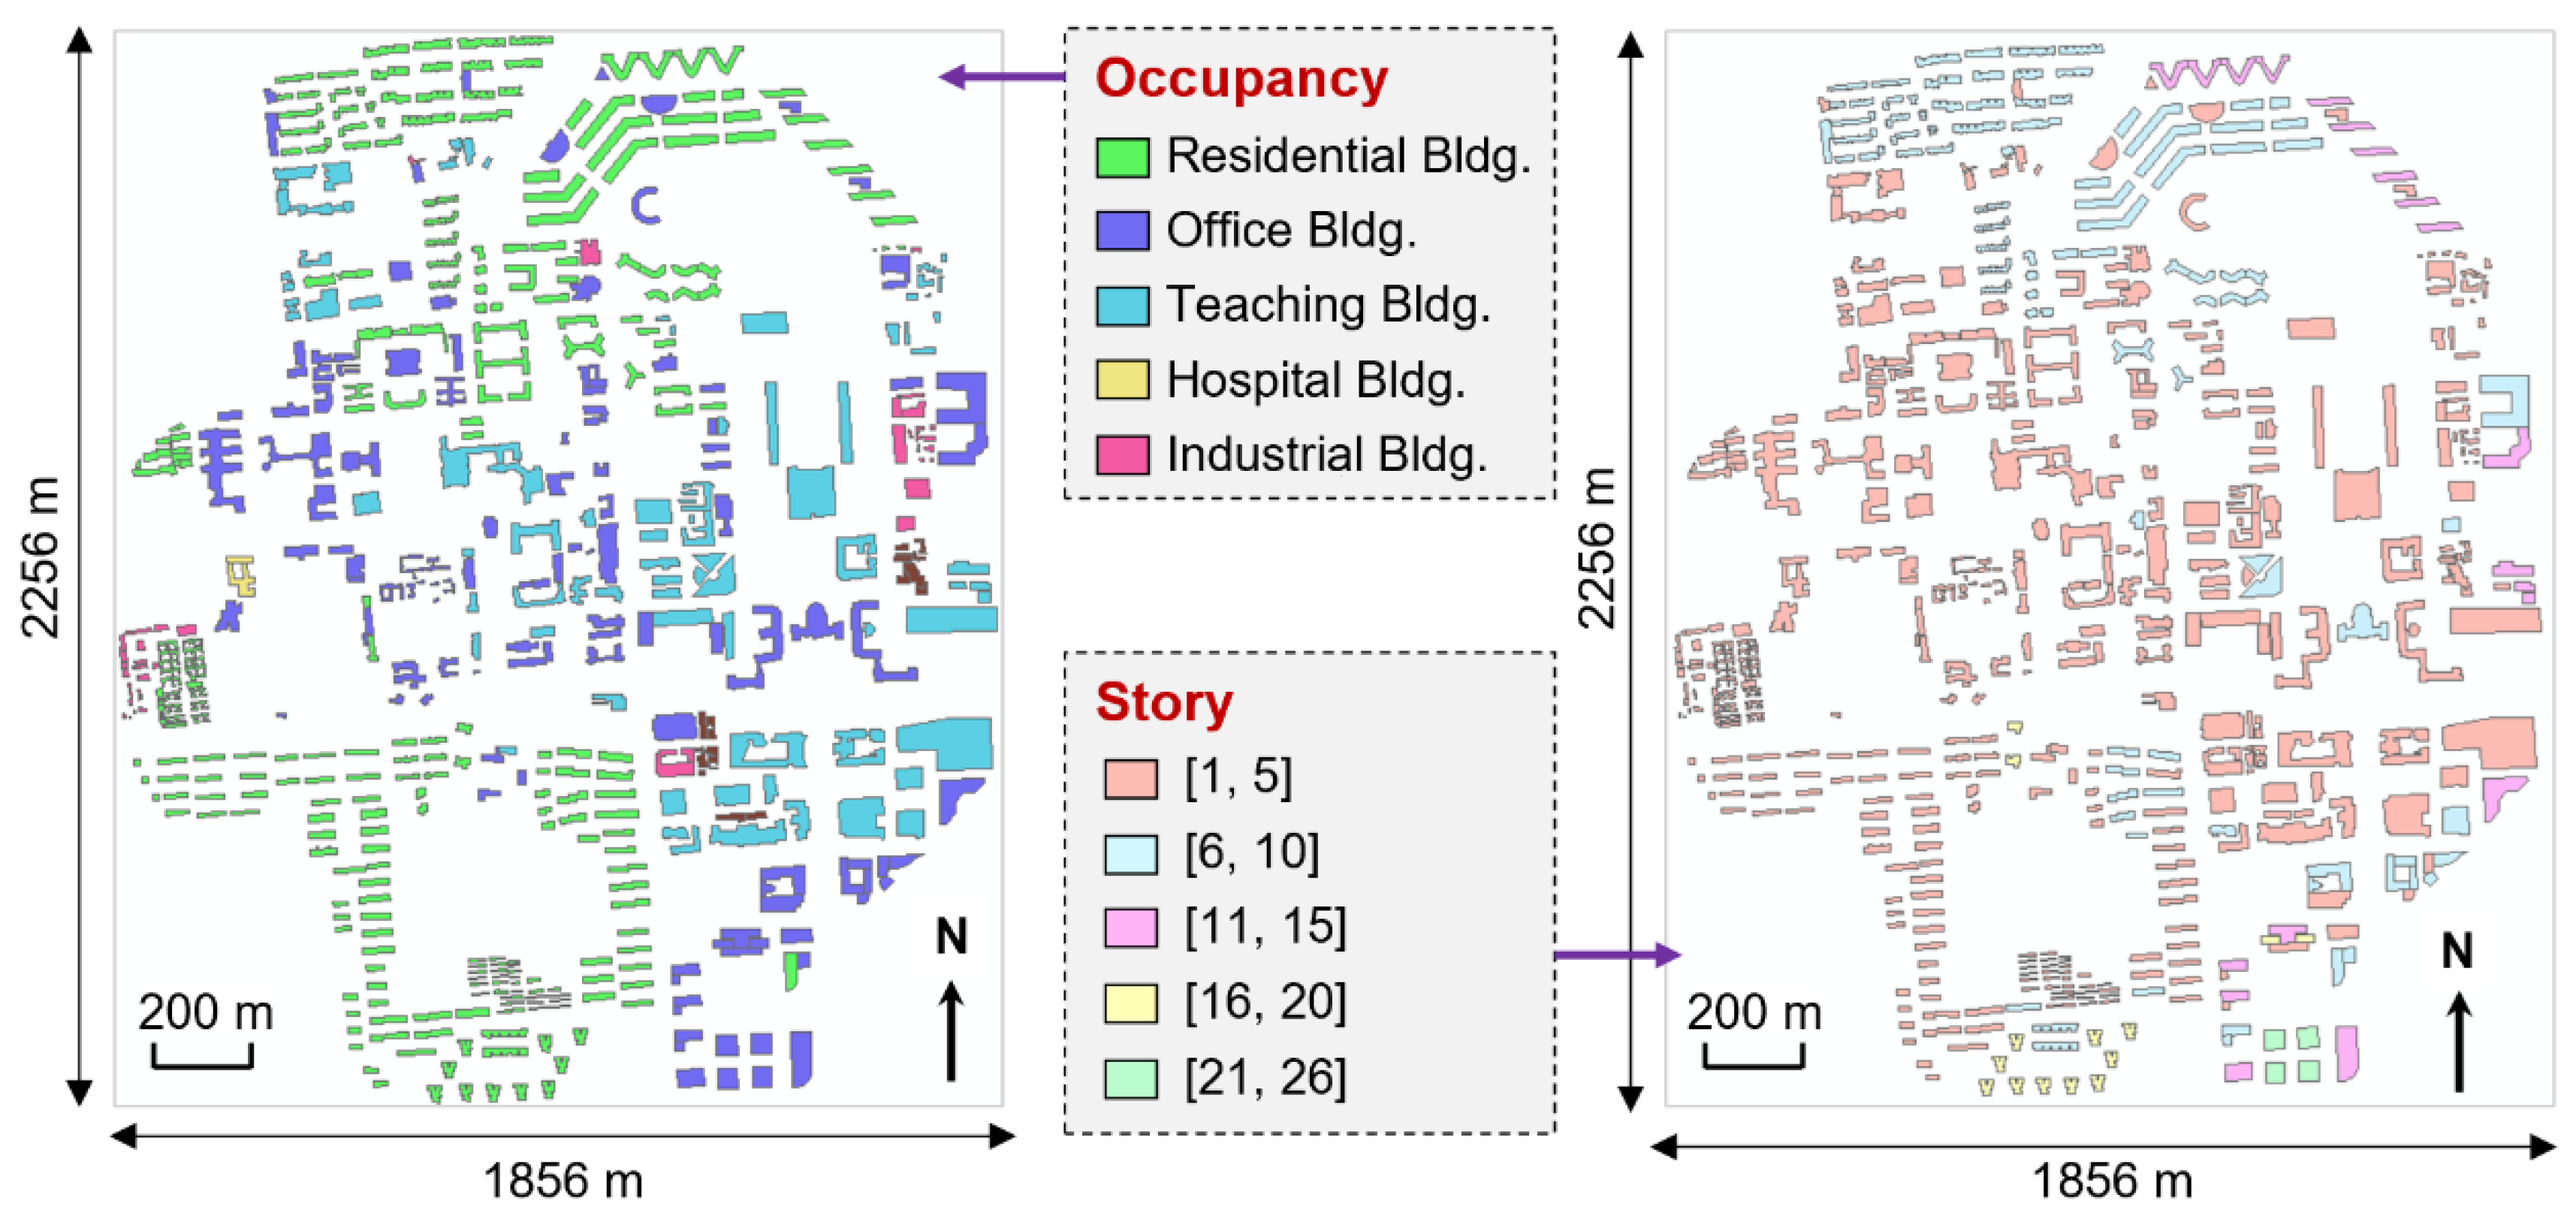
4.1. Study Area
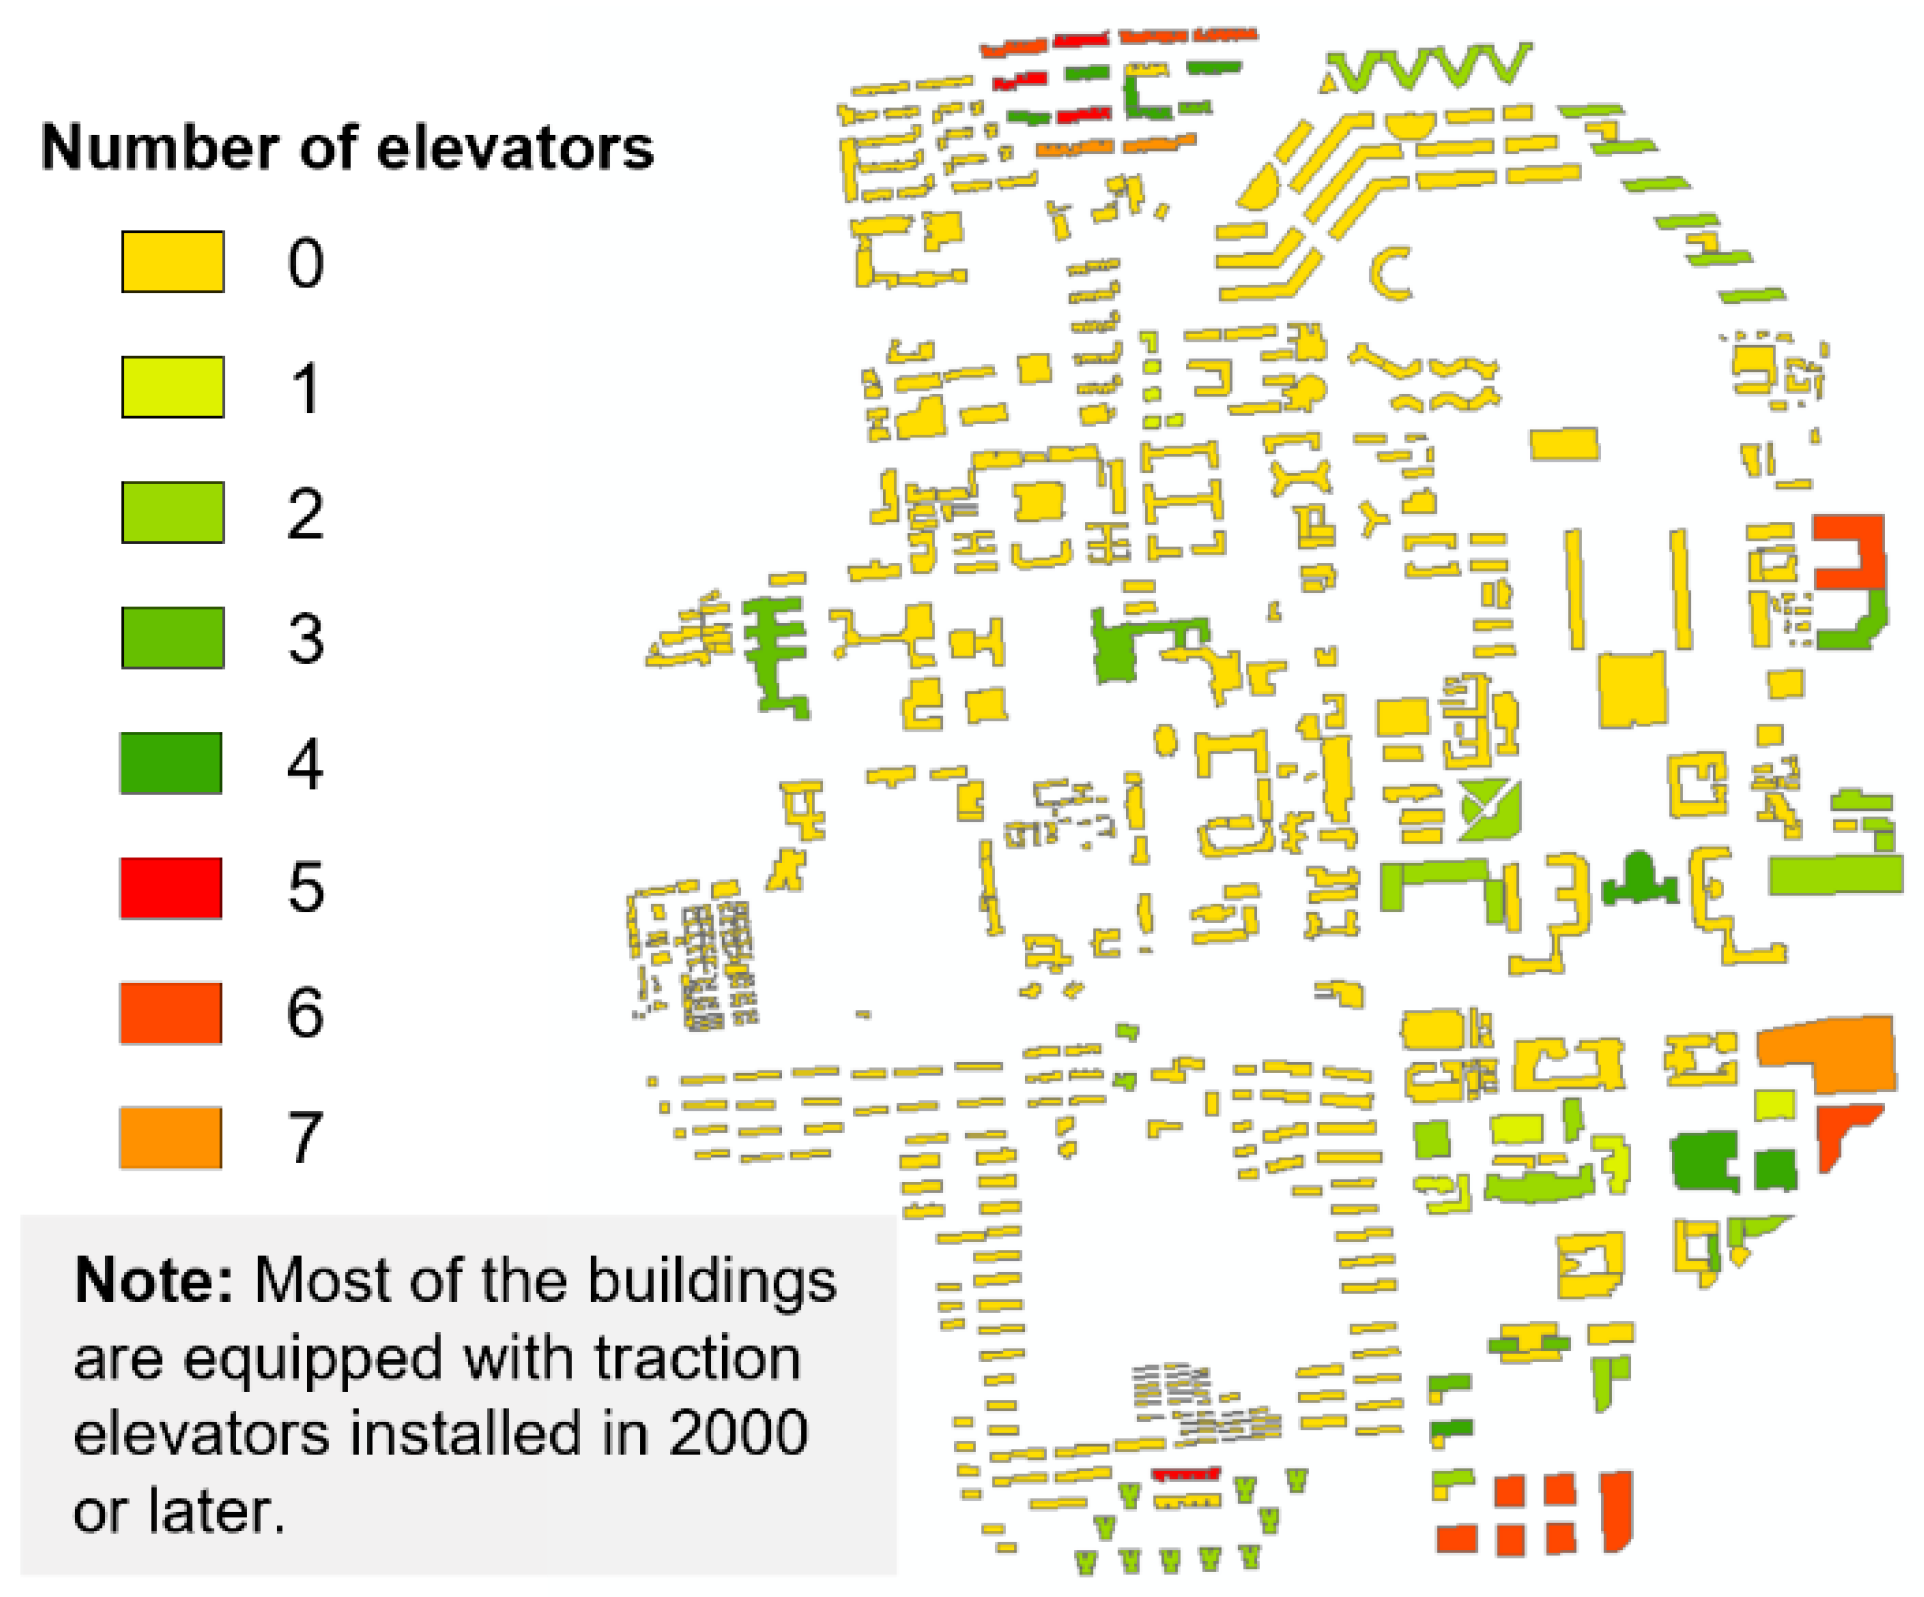
4.2. Elevator Inventory Data
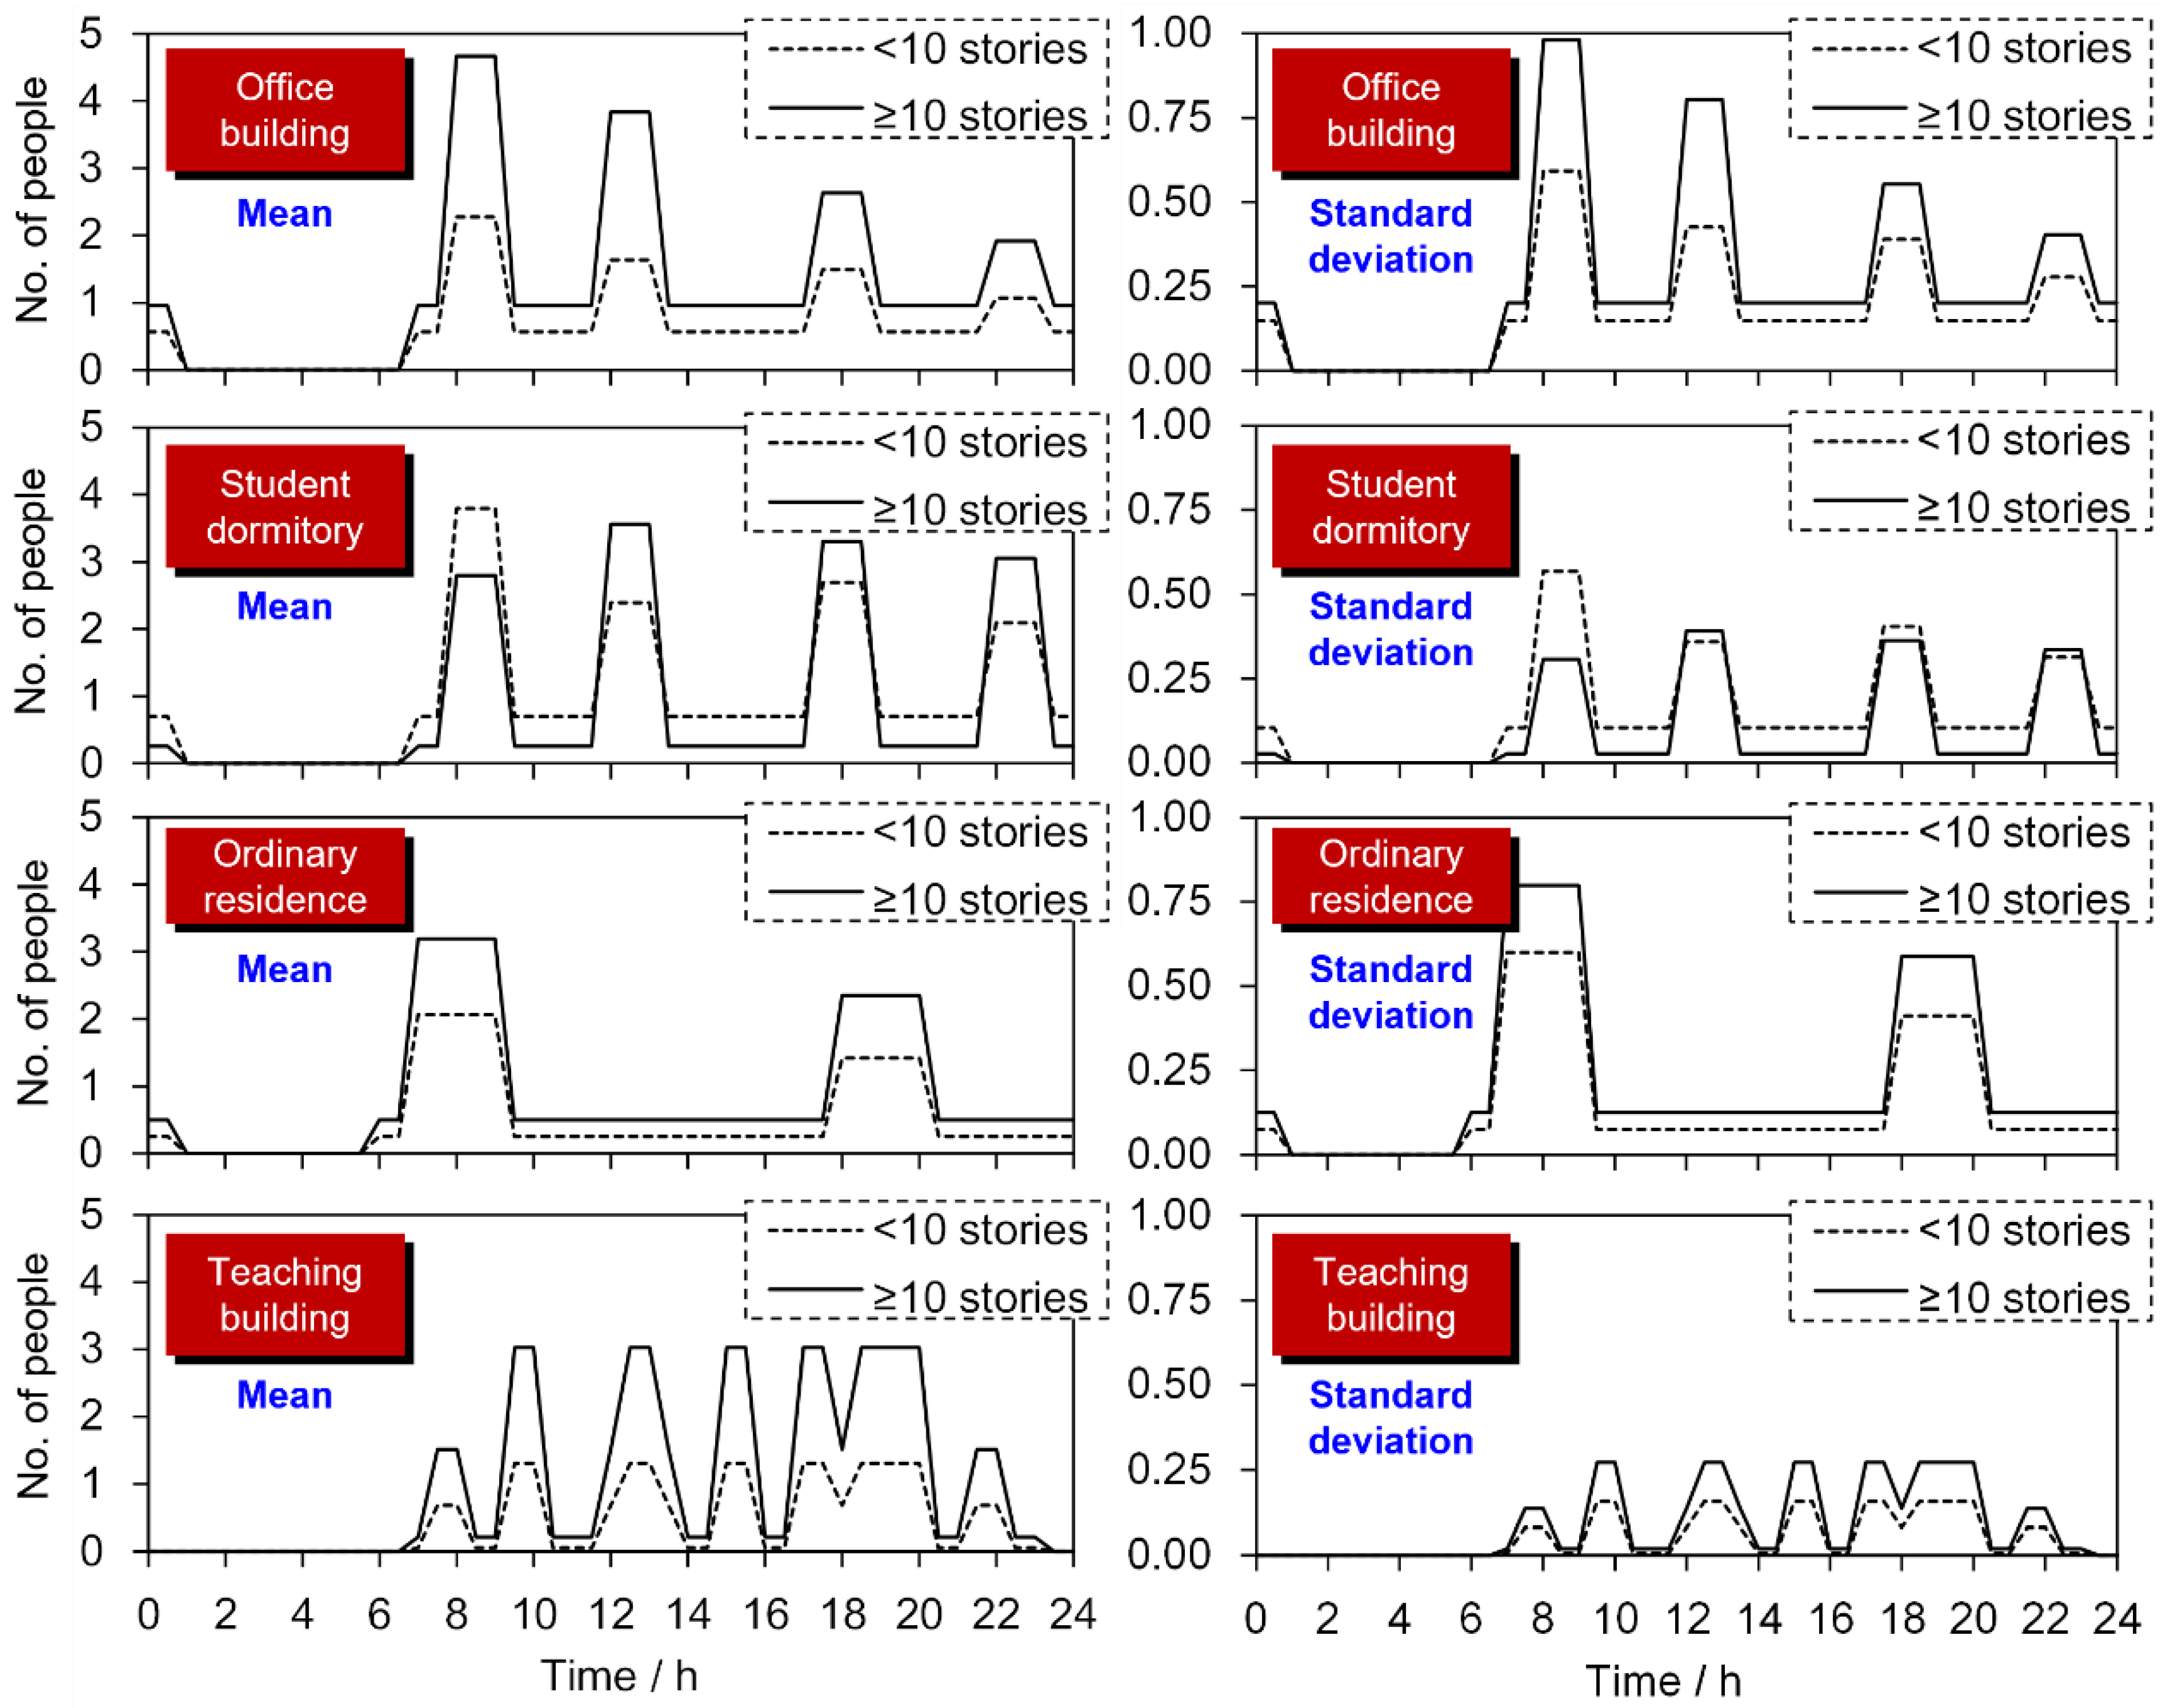
4.3. Elevator Traffic Data
4.4. Scenario-Based Assessment
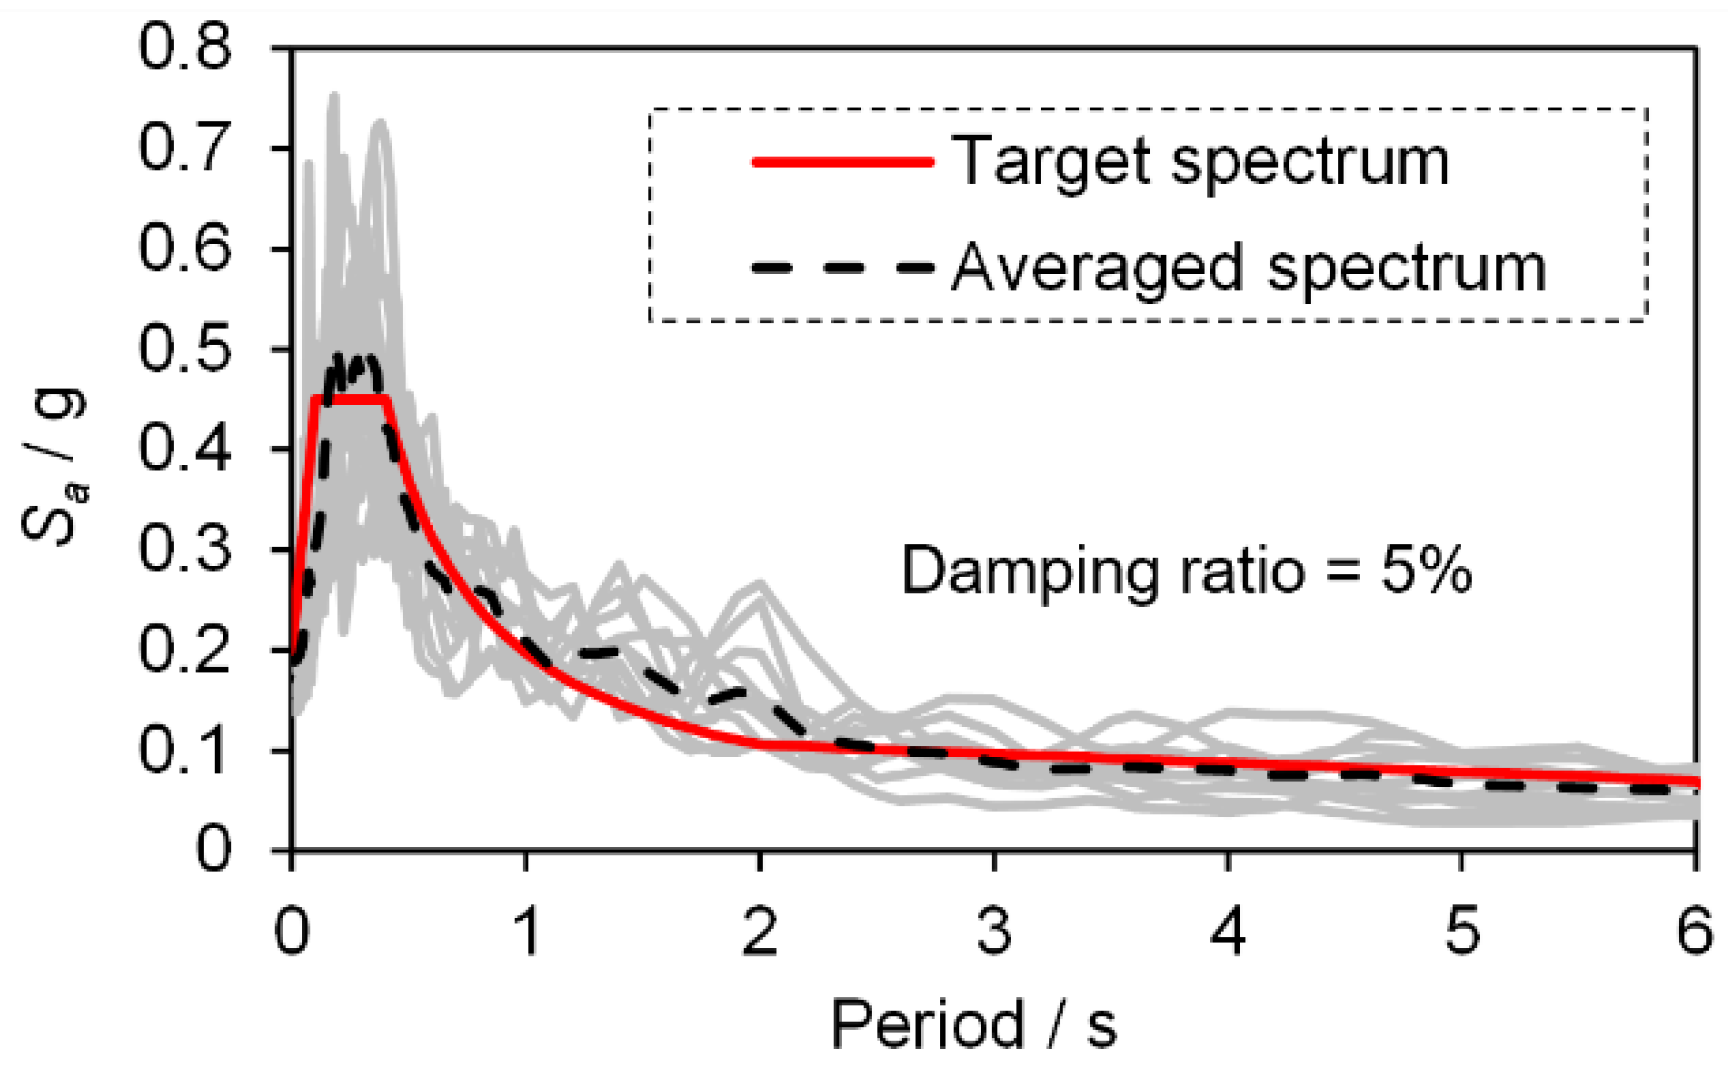
4.5. Intensity-Based Assessment
5. Discussions
- (a)
- For a specific urban area, a certain functional connection typically exists between different buildings, which implies that a correlation exists among the probability distributions of NEP in different buildings. It is currently challenging to identify this type of correlation at a city scale. Therefore, this study does not consider the impact of such correlation problems but assumes that the random variable of NEP is independent of each other for different buildings.
- (b)
- In addition, a linear function was used to describe the distribution pattern of elevator passengers at different stories of the same building, which is an idealized assumption. Different stories of a building may exhibit different occupancies. For example, the bottom floors of a high-rise building may be used for commercial activities, whereas the remaining floors are for residential purposes. The spatial variations in building occupancy will significantly affect the distribution pattern of elevator passengers on different stories [26].
- (c)
- Furthermore, the elevator traffic data of a specific building may be affected by the weather and season. Long-term observation of elevator traffic is crucial to the accurate prediction of city-scale PTE risks.
6. Conclusions
- (1)
- In the proposed method, city-scale THA is performed to simulate the seismic response of a building complex, and the Monte Carlo method is applied to generate probability-based results by considering the uncertainty of multiple factors (i.e., the mechanical properties of buildings and elevators, the elevator story position, and the spatiotemporal characteristics of elevator traffic) affecting the PTE risk level.
- (2)
- The proposed method can be used to perform both scenario- and intensity-based assessments of earthquake-induced PTE risks, thereby having the potential to provide support for applications such as virtual rescue drills and earthquake emergency plans.
- (3)
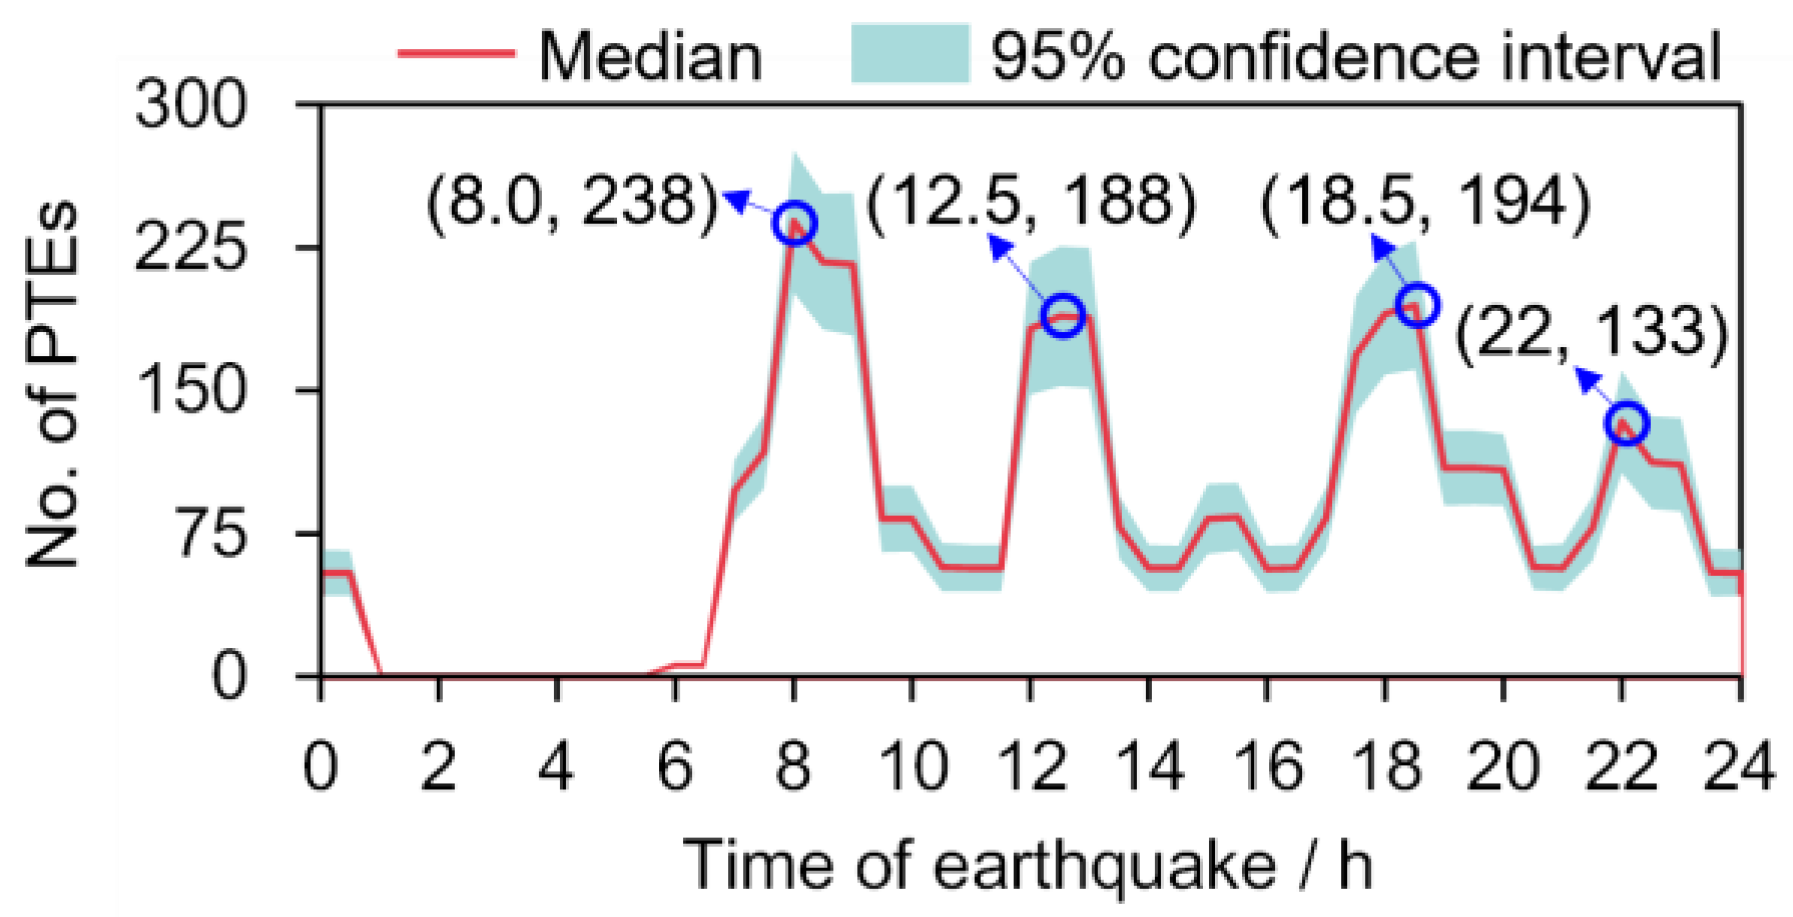
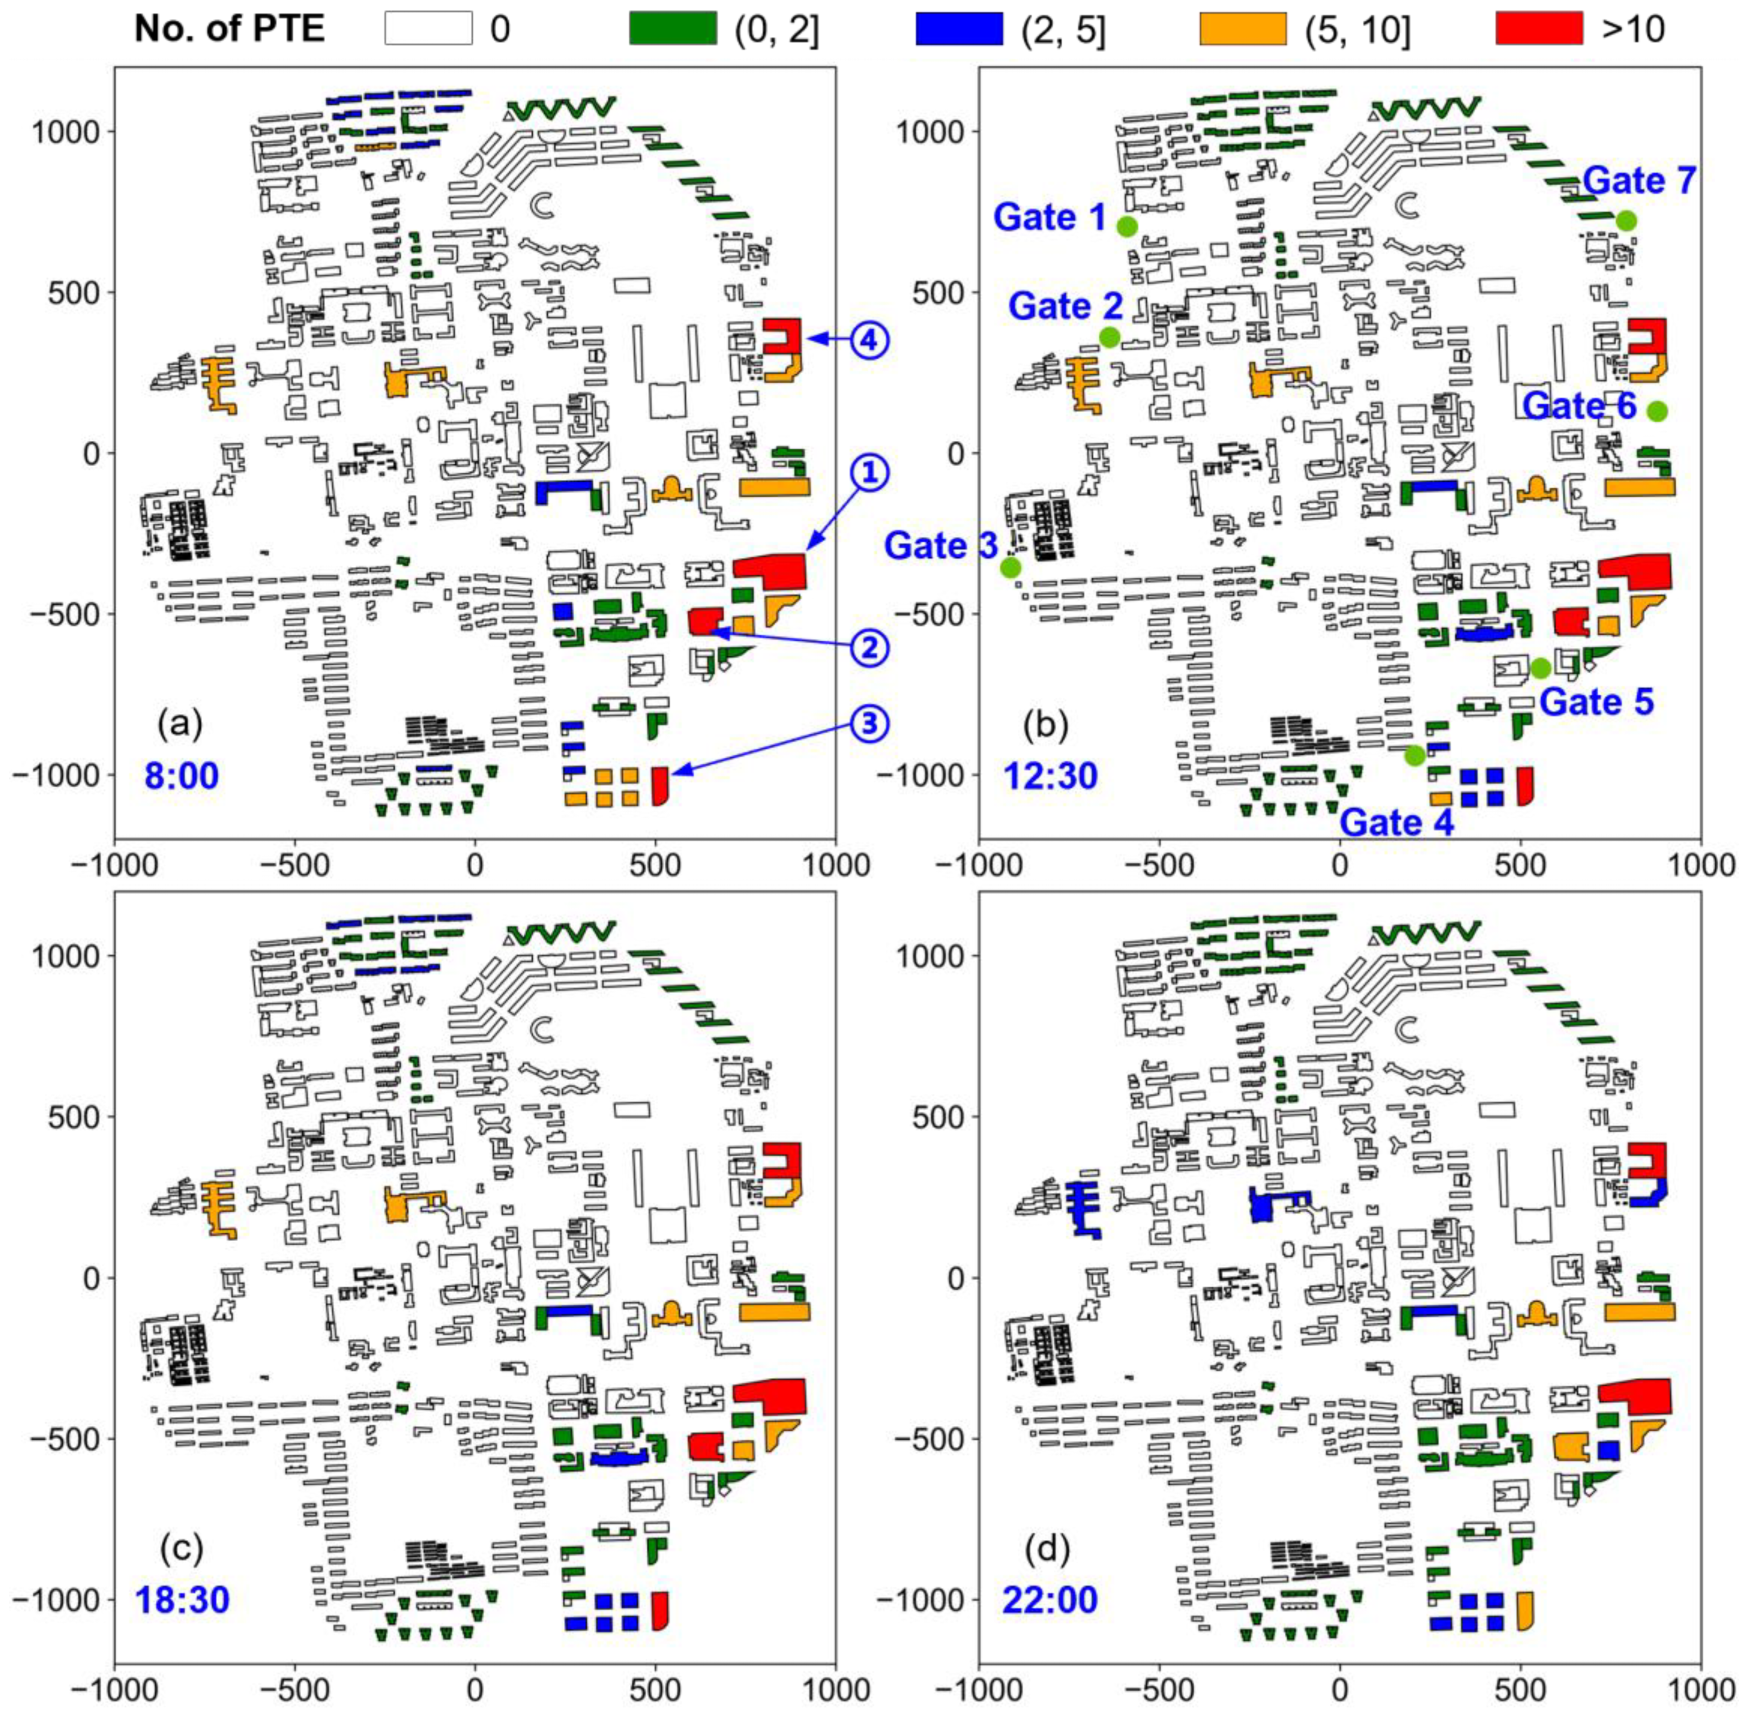
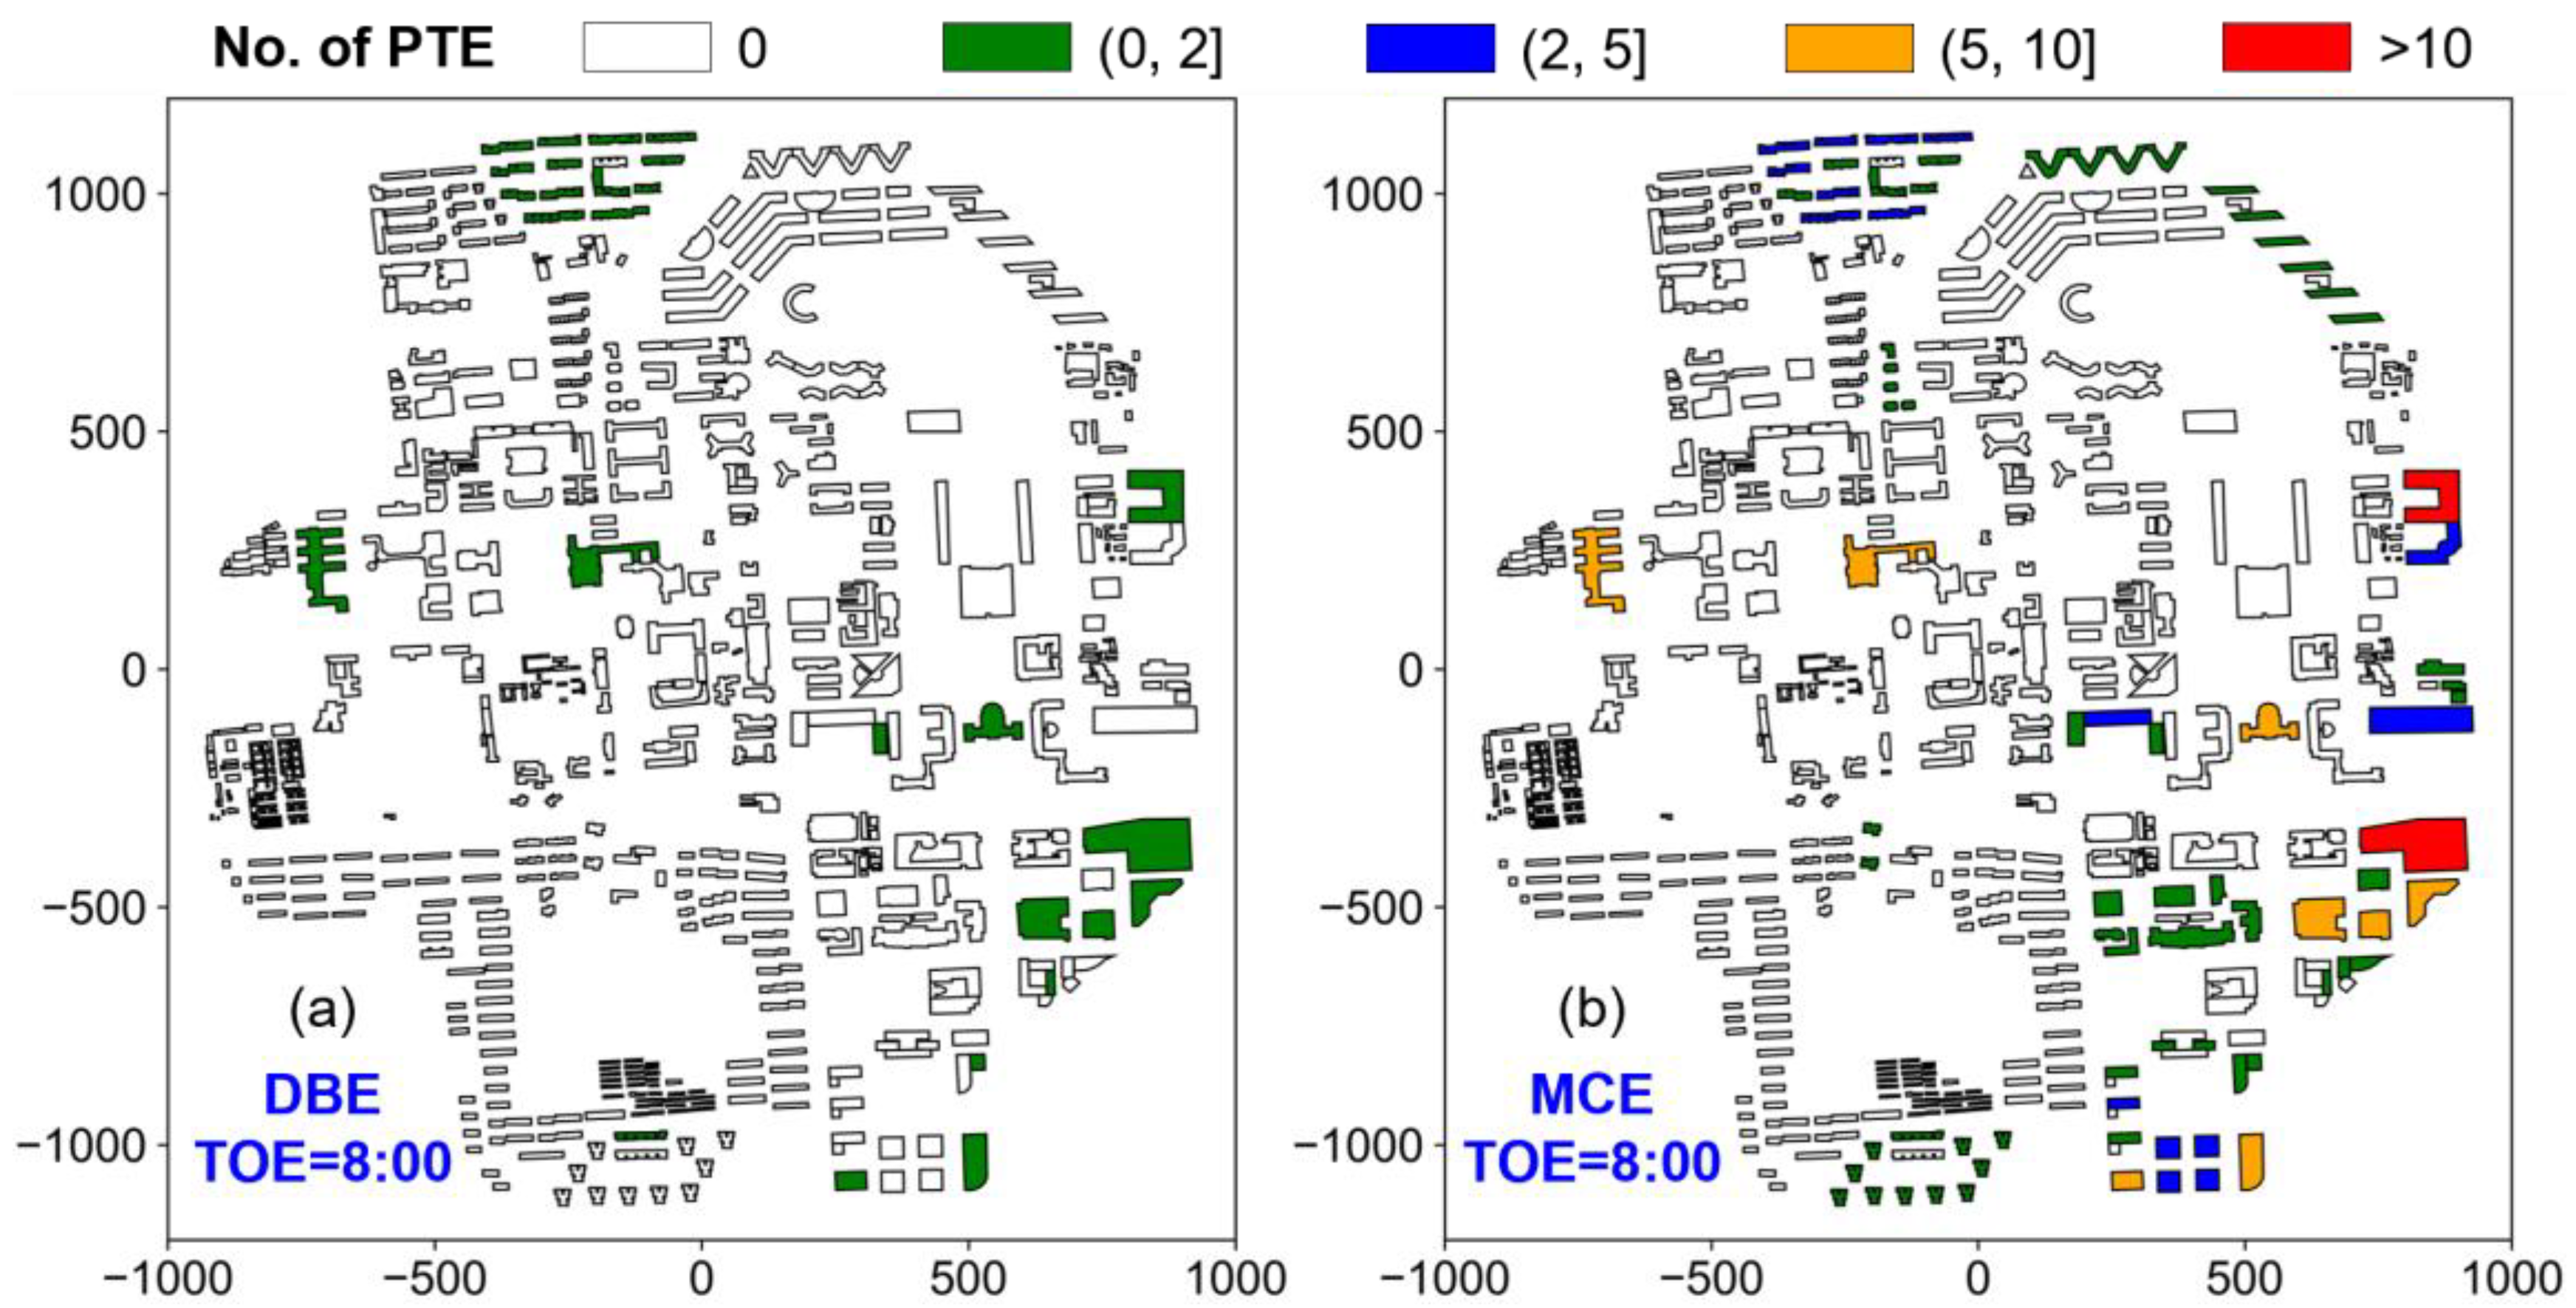
- The spatiotemporal nature of elevator traffic significantly affects the PTE risk in a building complex. In the case study of the Tsinghua University campus, the number of PTEs when an earthquake occurs during the off-peak hours of elevator traffic is approximately a quarter of that when the earthquake occurs at the morning peak time; the office building exhibits the highest PTE risk among the campus buildings; and the high-risk buildings are mainly located in the east and southeast regions of the campus under the MCE.
- (4)
- The maximum number of PTEs on the Tsinghua University campus under the MCE reaches 195, approximately five times that under the DBE. Gate 1 is identified as the optimal entrance for post-earthquake rescues under the DBE, while Gate 5 is the best choice under the MCE.
- (5)
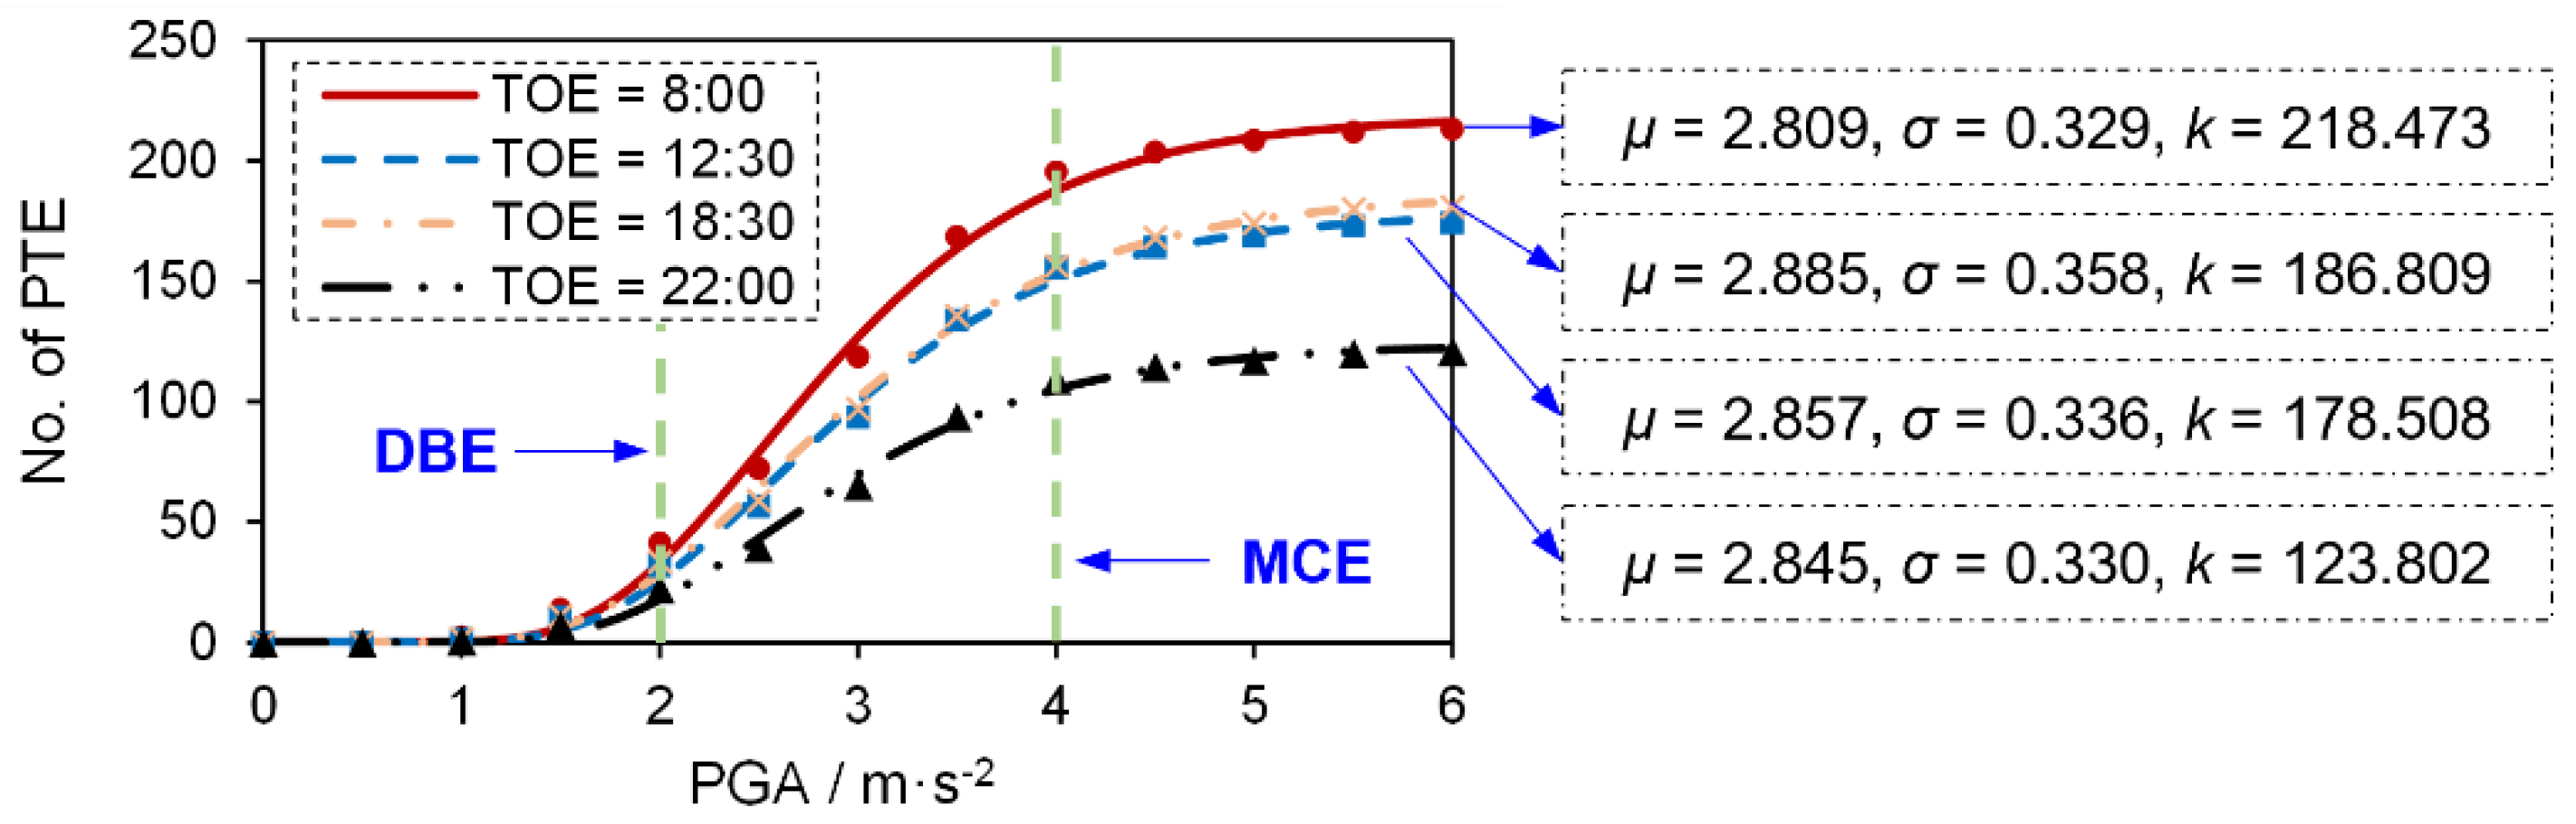
- The fragility curves depicting the quantitative relationship between the number of PTEs in an urban area and the earthquake intensity enable a comprehensive understanding of the PTE risk in the target area under different earthquake intensities, thus promoting targeted earthquake emergency preparations.
- (6)
- The proposed method fills a gap in the research on earthquake-induced PTE risk at a city scale and provides a practical assessment workflow with acceptable labor and time costs. Additionally, compared to the data-driven solution, the workflow is a physics-driven method that has no geographical limitations.
Author Contributions
Funding
Data Availability Statement
Acknowledgments
Conflicts of Interest
Appendix A

| ID | Name | ID | Name |
|---|---|---|---|
| 1 | RSN9_BORREGO_B-ELC000.AT2 | 7 | RSN67_SFERN_ISD014.AT2 |
| 2 | RSN28_PARKF_C12050.AT2 | 8 | RSN76_SFERN_MA3130.AT2 |
| 3 | RSN40_BORREGO_A-SON033.AT2 | 9 | RSN84_SFERN_SDC000.AT2 |
| 4 | RSN51_SFERN_PVE065.AT2 | 10 | RSN86_SFERN_SON033.AT2 |
| 5 | RSN54_SFERN_BSF135.AT2 | 11 | RSN93_SFERN_WND143.AT2 |
| 6 | RSN55_SFERN_BVP090.AT2 |
References
- Zhang, X.; Zubair, M.U. Extending the useful life of elevators through appropriate maintenance strategies. J. Build. Eng. 2022, 51, 104347. [Google Scholar] [CrossRef]
- Schiff, A.J. The Whittier Narrows, California Earthquake of October 1, 1987—Response of Elevators. Earthq. Spectra 1988, 4, 367–375. [Google Scholar] [CrossRef]
- Gates, W.E.; McGavin, G. Lessons learned from the 1994 Northridge earthquake on the vulnerability of nonstructural systems. In Proceedings of the Seminar on Seismic Design, Retrofit, and Performance of Nonstructural Components, San Francisco, CA, USA, 22–23 January 1998; Applied Technology Council: Redwood City, CA, USA, 1998; pp. 93–106. [Google Scholar]
- Yao, G.C. Seismic performance of passenger elevators in Taiwan. Earthq. Eng. Eng. Seismol. 2001, 3, 17–26. [Google Scholar]
- Wan, H. Seismic Model Test and Numerical Simulation of Elevator Counterweight System. Master’s Thesis, Dalian University of Technology, Dalian, China, 2016. (In Chinese). [Google Scholar]
- Hirata, N.; Kimura, R. The Earthquake in Ōsaka-Fu Hokubu on 18 June 2018 and its Ensuing Disaster. J. Disaster Res. 2018, 13, 813–816. [Google Scholar] [CrossRef]
- Minagawa, K. Report on Seismic Damage of Lifts and Escalators by Large Earthquakes in Japan. Transp. Syst. Build. 2020, 3, 154. [Google Scholar] [CrossRef]
- Porter, K. Fragility of Hydraulic Elevators for Use in Performance-Based Earthquake Engineering. Earthq. Spectra 2007, 23, 459–469. [Google Scholar] [CrossRef]
- Porter, K. Seismic fragility of traction elevators. Earthq. Eng. Struct. Dyn. 2015, 45, 819–833. [Google Scholar] [CrossRef]
- Wang, X.; Hutchinson, T.C.; Astroza, R.; Conte, J.P.; Restrepo, J.I.; Hoehler, M.S.; Ribeiro, W. Shake table testing of an elevator system in a full-scale five-story building. Earthq. Eng. Struct. Dyn. 2016, 46, 391–407. [Google Scholar] [CrossRef] [PubMed]
- Nguyen, T.X.; Miura, N.; Sone, A. Analysis and control of vibration of ropes in a high-rise elevator under earthquake excitation. Earthq. Eng. Eng. Vib. 2019, 18, 447–460. [Google Scholar] [CrossRef]
- Han, Q.H.; Zhang, X.L.; Lu, Y. Seismic fragility analysis of elevator counterweight system based on incremental dynamic analysis. Earthq. Eng. Eng. Dyn. 2022, 42, 53–62. (In Chinese) [Google Scholar] [CrossRef]
- Watanabe, S.; Yumura, T.; Funai, N.; Hayashi, Y.; Minewaki, S.; Kibayashi, M. Dynamic Analysis for Elevators Installed in Mid-Story Seismic Isolated Buildings. J. Environ. Eng. 2007, 2, 436–447. [Google Scholar] [CrossRef]
- Rossetto, T.; Gehl, P.; Minas, S.; Galasso, C.; Duffour, P.; Douglas, J.; Cook, O. FRACAS: A capacity spectrum approach for seismic fragility assessment including record-to-record variability. Eng. Struct. 2016, 125, 337–348. [Google Scholar] [CrossRef]
- Lu, X.; Gu, D.; Xu, Z.; Xiong, C.; Tian, Y. CIM-Powered Multi-Hazard Simulation Framework Covering both Individual Buildings and Urban Areas. Sustainability 2020, 12, 5059. [Google Scholar] [CrossRef]
- Lu, X.; Han, B.; Hori, M.; Xiong, C.; Xu, Z. A coarse-grained parallel approach for seismic damage simulations of urban areas based on refined models and GPU/CPU cooperative computing. Adv. Eng. Softw. 2014, 70, 90–103. [Google Scholar] [CrossRef]
- Lu, X.Z.; Guan, H. Earthquake Disaster Simulation of Civil Infrastructures: From Tall Buildings to Urban Areas, 2nd ed.; Springer: Singapore, 2021. [Google Scholar]
- Barney, G.; Al-Sharif, L. Elevator Traffic Handbook; Routledge: Virginia, UK, 2015. [Google Scholar] [CrossRef]
- Metropolis, N.; Ulam, S. The Monte Carlo method. J. Am. Stat. Assoc. 1949, 44, 335–341. [Google Scholar] [CrossRef] [PubMed]
- Ministry of Housing and Urban-Rural Development of the People’s Republic of China (MOHURD). Chinese Code for Seismic Design of Buildings (GB 50011-2016); China Architecture Publishing and Media CO., Ltd.: Beijing, China, 2016. (In Chinese) [Google Scholar]
- Federal Emergency Management Agency (FEMA). Multi-Hazard Loss Estimation Methodology HAZUS-MH 2.1 Advanced Engineering Building Module (AEBM) Technical and User’s Manual; Technical Report FEMA-P58; FEMA: Washington, DC, USA, 2012. [Google Scholar]
- Jiang, H.; Bu, H.; He, L. A new method for function-loss based seismic resilience assessment of buildings. Eng. Struct. 2022, 266, 114613. [Google Scholar] [CrossRef]
- Fu, C.H. A Study on Long-period Acceleration Response Spectrum of Ground Motion Affected by Basin Structure of Beijing. Ph.D. Thesis, China Earthquake Administration, Beijing, China, 2012. (In Chinese). [Google Scholar]
- Ancheta, T.D.; Darragh, R.B.; Stewart, J.P.; Seyhan, E.; Silva, W.J.; Chiou, B.S.-J.; Wooddell, K.E.; Graves, R.W.; Kottke, A.R.; Boore, D.M.; et al. NGA-West2 Database. Earthq. Spectra 2014, 30, 989–1005. [Google Scholar] [CrossRef]
- Xu, Z.; Lu, X.Z.; Guan, H.; Chen, C.; Ren, A.Z. A virtual reality based fire training simulator with smoke hazard assessment capacity. Adv. Eng. Softw. 2014, 68, 1–8. [Google Scholar] [CrossRef]
- So, A.; Al-Sharif, L. Calculation of the elevator round-trip time under destination group control using offline batch allocations and real-time allocations. J. Build. Eng. 2019, 22, 549–561. [Google Scholar] [CrossRef]


| Buildings Lower than 10 Stories | Buildings with 10 Stories or More | ||||
|---|---|---|---|---|---|
| Name | Occupancy | Stories | Name | Occupancy | Stories |
| Mengminwei S&T Bldg. | Office building | 8 | Innovation Mansion | Office building | 13 |
| Medical Science Bldg. | Office building | 3 | SP Bldg. B | Office building | 26 |
| Bldg. 29 | Student dormitory | 6 | Zijing Student Apt. No.14 | Student dormitory | 15 |
| Bldg. 21 | Student dormitory | 6 | Zijing Student Apt. No.23 | Student dormitory | 12 |
| Heqingyuan No.12 | Ordinary residence | 9 | Tall Bldg. No.1 | Ordinary residence | 17 |
| Heqingyuan No.1 | Ordinary residence | 7 | Lanqiying No.8 | Ordinary residence | 20 |
| 6th Teaching Bldg. Zone A | Teaching building | 6 | 6th Teaching Bldg. Zone B | Teaching building | 10 |
| Precision Instruments Dept. | Teaching building | 4 | Liuqing Bldg. | Teaching building | 11 |
Disclaimer/Publisher’s Note: The statements, opinions and data contained in all publications are solely those of the individual author(s) and contributor(s) and not of MDPI and/or the editor(s). MDPI and/or the editor(s) disclaim responsibility for any injury to people or property resulting from any ideas, methods, instructions or products referred to in the content. |
© 2023 by the authors. Licensee MDPI, Basel, Switzerland. This article is an open access article distributed under the terms and conditions of the Creative Commons Attribution (CC BY) license (https://creativecommons.org/licenses/by/4.0/).
Share and Cite
Gu, D.; Wang, Y.; Lu, X.; Xu, Z. Probability-Based City-Scale Risk Assessment of Passengers Trapped in Elevators under Earthquakes. Sustainability 2023, 15, 4829. https://doi.org/10.3390/su15064829
Gu D, Wang Y, Lu X, Xu Z. Probability-Based City-Scale Risk Assessment of Passengers Trapped in Elevators under Earthquakes. Sustainability. 2023; 15(6):4829. https://doi.org/10.3390/su15064829
Chicago/Turabian StyleGu, Donglian, Yixing Wang, Xinzheng Lu, and Zhen Xu. 2023. "Probability-Based City-Scale Risk Assessment of Passengers Trapped in Elevators under Earthquakes" Sustainability 15, no. 6: 4829. https://doi.org/10.3390/su15064829
APA StyleGu, D., Wang, Y., Lu, X., & Xu, Z. (2023). Probability-Based City-Scale Risk Assessment of Passengers Trapped in Elevators under Earthquakes. Sustainability, 15(6), 4829. https://doi.org/10.3390/su15064829