Article

Research on the Impact of the EU’s Carbon Border Adjustment Mechanism: Based on the GTAP Model

1
School of Economics and Management, Tsinghua University, Beijing 100084, China
2
Faculty of Natural, Mathematical & Engineering Sciences, King’s College London, London WC2R 2LS, UK
3
School of Economics and Management, North China University of Technology, Beijing 100084, China
*
Author to whom correspondence should be addressed.
Sustainability 2023, 15(6), 4761; https://doi.org/10.3390/su15064761
Submission received: 7 December 2022 / Revised: 20 January 2023 / Accepted: 22 February 2023 / Published: 7 March 2023

Abstract

:
There is now widespread agreement that the world community must actively combat climate change and advance green and low-carbon development. In order to deal with the issue of carbon leakage caused by the rising cost of industrial production as a result of policies to reduce greenhouse gas (GHG) emissions, the EU intends to implement the Carbon Border Adjustment Mechanism (CBAM) in its entirety starting in 2026, the pilot phase of which will begin in 2023. This shows the progressive emergence of a new international trade system driven by “climate change actions”, “carbon peaking”, and “carbon neutrality”, which will have a broad and far-reaching impact on China’s foreign trade industry. As more industries are being covered by the EU’s CBAM, it will exert a negative impact on the social welfare and export of China, the largest trading partner of the EU, even though the existing mechanism has only limited economic impact on China’s energy industry. This paper presents policy proposals to actively address the issues and effects of the EU’s “carbon tariff” by methodically analyzing the EU CBAM’s operation process and, via the development of models, determining the mechanism’s influence on social welfare, carbon emissions, and China’s exports.

1. Introduction

The Paris Agreement was signed by 195 countries at the 21st Conference of the Parties (or “COP21”) to the United Nations Framework Convention on Climate Change (UNFCCC) at the end of 2015, when 59 countries, accounting for 54% of the global carbon emissions, committed to zero carbon emissions by the middle of this century, including the European Union, Japan, South Korea, Canada, the United Kingdom, the United States (by 2050) and China (by 2060) [1]. Following that, the Organization for Economic Cooperation and Development (OECD) and the International Energy Agency (IEA) jointly released the report on the plan of Intended National Determined Contributions (INDC), demonstrating that the international community had come to an agreement on reducing carbon emissions [2]. The agreement has currently incorporated a total of 146 parties, including all developed countries and 75% of developing countries, who have submitted their own contribution plans, these parties are endeavored to keep the range of global temperature change below 2 °C, and formulate specific emissions reduction approaches based on their national conditions respectively [3]. The overarching goal is to lower the parties’ cumulative growth in carbon emissions from 2010 to 2030 by one–third when compared to that from 1990 to 2010, and it is estimated that the global total carbon emissions will be reduced by approximately 4 to 6 billion tons by 2030 [4].
The academic community concurs that a national-level carbon emissions trading system will be an effective way to lower GHG emissions. The “Coase Theorem” in economics is where the concept of carbon trading came from. The new institutional economics approach states that when the transaction cost is not zero, the defined property rights can be exchanged and traded in the free market; since the property rights are clear, market participants will, through market means, allocate resources to where the output is the highest while the cost is the lowest, so as to achieve the best use of resources [5]. The Kyoto Protocol, which was signed in Tokyo, Japan, in December 1997, originally presented the concept of carbon trading by focusing on six greenhouse gases and suggesting that CO2 emission rights could be traded like ordinary commodities [6]. However, due to differences in economic growth, international competitiveness of industries, input-output efficiency, carbon reduction governance costs, difficulty in policy implementation, etc. [7], and the absence of universally accepted international standards for the carbon emissions trading system, countries have decided to pursue various paths towards low-carbon development and emissions reduction [8]. Therefore, all countries’ efforts are required to establish the global carbon emission policy system, demonstrating the principle of “common but differentiated responsibilities” on the basis of fairness, so that it can be further widely accepted by all countries globally to maximize the impact of carbon reduction [9].
The European Commission announced the European Green Deal in December 2019, proposing the goal of achieving “carbon neutrality” by 2050. This has encouraged the continuous advancement in emissions reduction technologies across the EU member countries, the cost of emissions reduction also increased accordingly, though, making the cost of manufacturing rise all the time [10]. Meanwhile, the total annual quota of the EU industrial sector was further quickly reduced as Phase IV of the EU Emissions Trading System started, and the quota price continued to rise. The EU claims that “carbon leakage” has occurred as a result of the fact that other emitters of the Paris Agreement (especially China) are allowed to increase their emissions until 2030, making the EU lack advantages in competition with other high-carbon emitting countries. Therefore, the EU Commission President Ursula von der Leyen has initiated, since taking office in 2019, the implementation of the Carbon Border Adjustment Mechanism (CBAM) as a part of the European Green Deal, further exploring approaches to levying tariffs or taking other price adjustment measures on the embodied GHG emissions of imported goods [11]. The European Parliament voted to adopt the CBAM resolution [12] on 10 March 2021, while the European Council passed the CBAM proposal on 15 March 2022, and the European Parliament and the Council reached a political agreement on 13 December 2022. Next, the European Parliament and the Council will need to formally adopt the new Regulation before it can enter into force [13].
The two-phase implementation of CBAM will firstly cover two years of the transitional period (2023–2025), requiring only importers to report quarterly on the quantity of their imported products and carbon emissions information; the second phase of full implementation of CBAM will be starting from 2026, according to which carbon tariffs will be formally levied on imported steel, aluminum, power, fertilizer, and cement-related products [14]. The mechanism was created with the primary goal of preventing “carbon leakage” from happening, and the reason why it has been a big concern for the EU is twofold. Firstly, not many countries are currently implementing carbon emissions pricing mechanisms or planning to do so. Secondly, with the exception of the EU-ETS that is currently in use in Europe, the carbon emissions pricing mechanisms applied in other nations are neither sufficiently mature nor consistent with one another [15].
In 2020, China overtook the United States to become the largest trading partner of the EU, and the total trade between the two sides increased by 4.9% to USD 649.5 billion; the EU imported EUR 383.5 billion worth of goods from China, a year-on-year increase of 5.6% [16]. The EU-China Investment Agreement was officially signed at the end of 2020, and the EU-China Landmark Geographical Indications Agreement came into effect in March 2021, marking the first large-scale mutual recognition of each other’s geographical indications between China and Europe. All of these reflect the huge development potential in bilateral trade. The embodied carbon emissions generated out of the export trade have always been a big concern, as foreign trade has been an important pillar for the rapid growth of China’s economy. On the one hand, China’s export trade, given its size, has created huge economic value and employment opportunities move, and on the other hand, the huge amounts of energy and resource consumption and carbon emissions thereof have kept posing challenges to China’s economic sustainability [17]. Therefore, this paper adopts the GTAP model to simulate the impacts of the CBAM on social welfare, carbon emissions, and the national overall economy in China, as well as the interactive effects on the major countries in the world.
This study has a number of theoretical contributions and implications in the field. First, we investigate the impact of EU CBAM implemented on electricity export costs in the US, Russia, and China, which provides evidence for the theoretical study of CBAM in multiple countries. Second, we analyze that improving social welfare in the EU leads to increased carbon emissions from CBAM, and this research finding presents a novel research perspective on the intersection of social welfare theory and carbon border adjustment theory. Third, we analyze the changes in Chinese commodities such as oil when China’s industrial products are affected by CBAM, which provides a referential basis for China to formulate relevant industrial policies.

2. Literature Review

It is clear from the current research findings that the introduction of the carbon border adjustment mechanism, or CBAM, will present China’s economy with a number of difficulties. The GTAP is the most commonly used model to study the EU CBAM. Therefore, this paper first studies the theoretical mechanism of CBAM and then explores the comprehensive impact of EU CBAM on China’s economy by applying the GTAP model. As a result, appropriate policy suggestions are made for China to deal with the CBAM.

2.1. CBAM Nature Research

The Carbon Border Adjustment Mechanism (CBAM) is mainly constituted by the carbon border adjustment tax and the carbon border market. Article 6 of the Paris Agreement advocates the establishment of a global carbon market cooperation mechanism to strengthen the coordinated emissions reduction efforts made by all nations. The Clean Development Mechanism (CDM), established by the Kyoto Protocol, is comparable to the CBAM [18]. However, the imposition of carbon tariffs does not comply with the United Nations Framework Convention on Climate Change (UNFCCC), in which Article 3 Principle 5 move states that “the Parties should cooperate to promote a supportive and open international economic system that would lead to sustainable economic growth and development in all Parties, particularly developing country Parties, thus enabling them better to address the problems of climate change. Measures taken to combat climate change, including unilateral ones, should not constitute a means of arbitrary or unjustifiable discrimination or a disguised restriction on international trade” [19]. As a result, the EU prefers to implement the CBAM to increase its overall adaptability with the World Trade Organization (WTO) rules.
Additionally, the CBAM states that only carbon emissions from the primary production process, excluding those from the manufacture of fuel power and other raw materials, are included in the computation of a product’s carbon content [20]. When measuring a specific parameter using “actual carbon content” and “default carbon content”, priority is given to the actual carbon emission value of the produced goods (exporters take the initiative to declare to the EU). The actual values are based on the actual carbon emissions generated by the production of goods, and the products are classified into simple and complex products [21]. If it is impossible to measure the real carbon emissions, the default emission intensity will be adopted, which is based on the average emission intensity of taxable goods in the exporting country, and the “amplification coefficient” will be adjusted upward. If the exporting nation cannot provide accurate carbon emission data, it shall be calculated in accordance with the highest 10% of the emission intensity in the same industry in the EU.
In addition, the CBAM mandates in its regulations that importers need to purchase certificates equivalent to the carbon content of their imported goods from the governments of EU member states, with each CBAM certificate corresponding to imported goods with one ton of carbon emissions (in euro/ton of CO2 emissions), and no declaration or carbon tariffs are needed for imported goods worth less than EUR 150. The European Commission will decide the cost of the carbon import certificate by comparing it to that of the EU Emissions Trading System (EU ETS). Normally, weekly auctions on the EU-ETS platform determine the market price of carbon emission rights. The price of the carbon import certificate adopts the average value of the closing price of the EU-ETS platform in the previous week. For calendar weeks without auctions, the average price of the preceding auction trading week shall be applied [22]. Moreover, the European Commission will require that the number of CBAM certificates held under the accounts of importers at the end of each quarter should not be less than 80% of the default value set at the beginning of the year, in order to prevent importers from purchasing CBAM certificates concentratedly.

2.2. CBAM Impact Research

CBAM, as a supplement to the European Emissions Trading System (EU-ETS), is the core tool of EU climate policies, primarily consisting of the following aspects. As price takers, importers are required to purchase ETS-related subsidies in specific markets; the tax base is linked to exporters’ emissions, including indirect carbon emissions of electricity-related energy consumed in the production process; compensation for the carbon content of products will be arranged, deducting the carbon tax paid by the exporters in their countries already; and free allowance allocation will be gradually abolished and replaced by CBAM in ten years [23]. The proposal of CBAM will replace the current free allocation system, and it is anticipated that around USD 32 billion of revenue will be generated annually to support low-carbon innovation and international climate financing and to fund low-carbon innovation and global climate action [24].
The carbon border adjustment mechanism can reduce carbon leakage [25,26], according to the ex-ante model. The CBAM will, however, have a considerable impact on trade as well as the climate if it is applied to the imported goods of trading partners within the EU [27]. Hufbauer et al. believed that the countries most affected by CBAM included Russia, China, Türkiye, the United Kingdom, Ukraine, South Korea, and India [28]. Jakob M. found that with the implementation of the Paris Agreement, the net imports and exports of embodied CO2 emissions from most developed economies had little changed, while the domestic “production emissions” and “consumption emissions” of developed countries in the EU and Asia had declined significantly. Both types of emissions in the United States under the NDC scenario have increased on the contrary in contrast to the BAU scenario [29]. Furthermore, empirical studies have found that some developing countries would suffer huge losses due to the decline in total exports [30]. Big nations, including China, the United States, and Russia, may jointly boycott the EU CBAM system, particularly those nations that place greater duties on imported goods [31].
China’s exports will be affected by the EU CBAM to some extent [32], necessitating ongoing changes to the nation’s economic and energy usage structure. Due to China’s unique industrial and energy mix, there is still plenty of obstacles during this rapid transformation. The implementation of CBAM will increase the production costs of energy-related industries in the short term [33,34], bringing about a negative impact on China’s export trade [35]. In addition, if the carbon border adjustment tax is set improperly and unreasonably, CBAM might be seen as a trade protection measure taken by the EU [36]. More specifically, the impact of the CBAM on China’s economy largely depends on its design mechanism; in other words, it will be conducive to the business development of Chinese enterprises, if the carbon quota purchased by these companies can cope with the impact of CBAM. Therefore, China should constantly follow up and respond positively to the implementation of CBAM [37], thus realizing carbon neutrality and low-carbon transformation of industries as soon as possible [38].

2.3. Methodology of CBAM Impact Research

Bednar Friedl B. et al. built a multi-sector and multi-region global computable general equilibrium (CGE) model, which has been adopted to study the impact of CBAM, and it is found through a calculation that the implementation of the CBAM would significantly lower the carbon leakage rate of the steel industry, but with a small impact on emissions reduction of mineral products, e.g., cement [39]. Overland and Sabyrbekov found that the CBAM had a significant impact on the cost efficiency of China’s exported commodities, and China should set a higher carbon price to mitigate the impact of the EU mechanism; if China’s carbon price exceeded RMB 60 yuan/ton, the impact of the EU CBAM on the cost efficiency of various industries would be greatly decreased. [40]. In a modeling analysis on cost efficiency using data envelopment analysis (DEA), Shaozhou Qi et al., (2022) discovered that if China’s carbon price did not change in the short term, it would reduce the production cost-effectiveness of Chinese iron and steel enterprises. With the massive import of Chinese steel, the cost-effectiveness of production in Europe would then be greatly reduced. On the contrary, if China’s carbon price is raised, Chinese steel businesses will be better prepared to withstand the negative effects of the CBAM. On the other hand, if China’s carbon price is increased in the long run, combined with the impact of the CBAM on China’s steel production, the cost efficiency will be further reduced. If CO2 emissions are kept to a minimum, energy consumption regulation can effectively reduce the overall effect of CO2 emissions [41].

3. Theoretical Mechanism

Based on the Hahn–Westskog model, the optimization problem decision of the price taker with the smaller market power in the two types of firms is shown in Formula (1):
c F ( Q ) = min X F i F c i ( x i ) i F x i Q
in which Q represents the edge permissible variable, and X F : = ( x i ) i F the allocation permission among edge members.
Additionally, given the influence of the trading behavior on price, the shadow price parameter is introduced and the optimal problem is shown in Formula (2):
min { c i ( x i ) + p ( x i e i ) }
when p will be affected by the emission x they select, and then the following is obtained:
p = p x i = 1 i F 1 c ( x i )
in which p = c F ( Q ) is the envelope term. In addition, c i ( x i ) = p is true for all i F .
Enterprises will sell some of their energy goods on the domestic market and some on the international one, with the latter being subject to the border carbon tax. It is assumed that for Company i in Industry j, the price of its energy product is p j and the part in the international market is subject to an additional carbon tax of e j . The size of the carbon tax e j for Industry j depends on the difference between the carbon price in the domestic market and that in the international one for that product. If the cost function of the company i is assumed to be c x i , d , x i , f , where x i , d and x i , f denote respectively the domestic and international energy product output of the company, then the optimization problem of the price taker is demonstrated in Formula (4):
C F ( Q i , d , Q i , f ) = min x d , x f i f c ( x i , d , x i , f )   subject   to   i f x i , d Q d ,   i f x i , f Q f
in which Q d and Q f represent the remaining carbon licenses, fitting Q d = i I e i , d i s x i , d , Q f = i I e i , f i s x i , f , and are determined by the strategists (S) in Phase One, so the optimization problem can be expressed as below:
min x d , x f i f c ( x i , d , x i , f ) + p j ( x i , d e i , d ) + ( p j + e j ) ( x i , f e i , f )
According to the envelope theorem and the implicit function theorem, and assuming that the border carbon tax e j is exogenous, the impact of strategists in Industry j on the price of energy products in equilibrium can be obtained, as stated in Formula (6):
p j = p j x i , d = 1 i F 1 2 c ( x i , d , x i , f ) / x i , d 2
In equilibrium, decision-making model of price taker in set F is shown in Formula (7):
c ( x i , d , x f ) x i , d = p j c ( x i , d , x f ) x i , f = p j + e j
The decisions of strategists in set S are as below:
c ( x i , d , x f ) x i , d = p j + p j ( x i , d e i , d ) c ( x i , d , x f ) x i , f = p j + e j + p j ( x i , f e i , f )
More specifically, the energy products for export can be further expanded. Based on the carbon emission composition of the existing energy products in the major industries, the heterogeneous carbon taxes can be estimated, which may be levied on different industries when exporting products. At the enterprise level, export/GDP data at the regional-industrial level can be used to show the dependence of different enterprises on export energy products. Furthermore, businesses that depend more on exports are more likely to accept the effects of CBAM and turn to the domestic market after estimating the MAC curve of carbon emission marginal cost, which tends to affect the strategic behavior of some large enterprises in the energy product trading market. Various scenarios can be calculated respectively, such as zero border carbon tax, low border carbon tax, high border carbon tax, etc., and the equilibrium price of energy products and enterprise trading behavior under these scenarios can be compared then, thus estimating the actual impact of CBAM implementation on China’s energy product market.

4. Research Methods and Results

4.1. Research Methods

The 10th edition of the Global Trade Analysis Project-Energy-Environmental (GTAP-E) model is used in this paper’s study. The GTAP model was a multi-region, multi-sector computable general equilibrium (CGE) model created under the guidance of Professor Hertel (1993) from Purdue University in the United States, and the model follows the Armington hypothesis in the context of bilateral trade. The GTAP 10E involves 141 countries and regions as well as 65 industrial sectors, as one of the multi-sector CGE models with a complete model system and a basic data system. It boasts distinctive advantages in the quantitative simulation of data, being a superset of the social accounting matrix (SAM) [42]. In order to study global concerns, the World Bank (WB), International Monetary Fund (IMF), and other organizations have adopted the GTAP model, which is widely utilized in domains, such as international economic development, international trade, and others [43]. The GTAP 10E database is used in the research process to explore the impact of the CBAM on China’s social welfare, carbon emissions, and the overall economy.

4.2. Scenarios Setting

In this study, two scenarios—the baseline scenario and the simulation scenario—are set, respectively. The baseline scenario forecasts the socio-economic indicators of various countries by 2030, assuming that the EU does implement the carbon border adjustment mechanism and then predicts the changes in social welfare, carbon emissions, and electricity exports to the EU in China, Russia, the United States, the EU, and other countries by 2030.
The price of ICE European carbon emission rights was EUR 82.37 euro/ton as of 20 June 2022, and the average transaction price of China’s carbon emission trading market was RMB 60 yuan/ton, covering the thermal power industry only. Five possible tax rates were set at RMB 200 yuan, RMB 220 yuan, RMB 260 yuan, RMB 280 yuan, and RMB 300 yuan (per ton of CO2) respectively, in the carbon tax rate simulation study in China. Among other European countries, the Netherlands and Ireland currently charge EUR 14.59 and EUR 15 per ton of CO2 respectively, whereas Poland charges EUR 5.4 and the Czech Republic EUR 17.6276 [44]. Since electricity is an important category in carbon emission, although China does not currently export electricity to the EU, nevertheless, with the EU energy crisis triggered by the Russia-Ukraine war and the upgrading of energy storage technology, there is a great possibility that China will export electricity products to the EU in the future [45]. In order to study the impact of CBAM on China and the main trading partners of the EU, this paper assumes that China will export electricity to the EU and use a recursive methodology to project the entire value of power products exported from China to the EU by 2030.
Since the EU has not disclosed any specific implementation plan for the CBAM, this move, based on how carbon tax rates are set in other countries, this study assumes that the CBAM is about the direct increase in tariff rate, and the implementation objects are China, Russia, and the United States. On the value of each unit of such imported goods, an electricity product tax is to be imposed. The specific scenario settings of tax rate are shown in Table 1:
Since the EU CBAM has not yet established specific tax rates and some developing nations’ carbon tax markets are not yet fully developed, the actual effects of carbon taxes cannot be predicted because the carbon prices in those nations are lower than those in the EU and there is greater carbon leakage. The study simulated the impact of low, medium, and high tax rates on the economic performance of various countries. The carbon content of different export products varies, and so does the sensitivity of each industry to the tax rate, and it is feasible to indirectly estimate the expected impact of the EU CBAM in the future based on the simulation results.
Meanwhile, it is vital to estimate the figures about the GDP, population, capital, skilled workers, and unskilled workers of China, the EU, India, the US, and other countries and regions of the world. The paper recurses the data of GTAP 10E from 2014 to 2030, by using the data from the UN, IMF, etc. The specific changes are shown in Figure 1.

4.3. Simulation Results

4.3.1. Changes in the EU’s Source of Electricity

Under the assumption that China, the US, and Russia export electricity to the EU (baseline scenario), the changes in electricity exports of each country under different carbon tax rates are obtained through the simulation. The results show that when the tax rate of USD 0.2 dollar/dollar (import amount) is implemented for the CBAM, the electricity exports from China, Russia, and the United States to the EU decrease by 1.0853%, 1.0832%, and 1.0849% respectively, compared with the baseline scenario, while the EU’s own electricity production and power exports from other nations to the EU increase by 0.034% and 0.035%, respectively. This shows that the implementation of CBAM will reduce the electricity exports of relevant countries to the EU. In order to maintain the electricity balance, the EU will turn to other countries and regions in the world to import electricity and increase its own electricity production. The main reason for this phenomenon is that the implementation of CBAM directly affects the cost of electricity import, and electricity has a high degree of sustainability, which leads to a decrease in the total electricity exports of China, the US, and Russia to the EU.
Meanwhile, the higher the carbon border adjustment tax rate, the lower the total electricity exports from China, Russia, and the US to the EU would be. When the CBAM with a tax rate of 0.5 dollar/dollar is implemented, compared with the baseline scenario, the electricity exports from China, Russia, and the US to the EU decreased by 2.71%, 2.70%, and 2.71%, respectively, while the EU’s own electricity production and the electricity exports from other countries to the EU increase by 0.085% and 0.087% respectively. The specific simulation results are illustrated in Figure 2.

4.3.2. Changes in Social Welfare

The social welfare of the nation is the sum of the utilities of the entire population, assuming that everyone has the same suggested linear utility function. The simulation results show that the social welfare of the US decreased by USD 1.89 billion, while those in China, Russia, the EU, and the rest of the world increased by USD 0.79 billion, USD 1.05 billion, USD 0.96 billion, and USD 0.65 billion respectively, compared with the baseline scenario, when the tax rate of 0.2 dollar/dollar is implemented for the CBAM. This is mostly caused by the decline in US social welfare as a result of the fall in the US electricity exports to the EU. In contrast, the rise in electricity production within the EU and that in electricity exports from the rest of the world to the EU have led to an improvement in social welfare in the EU and the rest of the world.
Despite a decline in electricity exports from both China and Russia to the EU, both countries’ manufacturing and oil and gas products continue to be at low cost and in high demand as social welfare in the EU and the rest of the world rises. This has led to an increase in China and Russia’s overall exports as well as a corresponding rise in social welfare in both countries.
At the same time, as the carbon border adjustment tax rate gradually increases, the impact of CBAM on the social welfare of each country shows a boundary-decreasing effect. If the EU implements a CBAM rate of USD 0.5 dollar/dollar, the social welfare of the US decreases by USD 4.7338 billion, while those of China, Russia, the EU, and all other countries increase by USD 1.9879 billion, USD 2.6434 billion, USD 2.4031 billion, and USD 1.646 billion respectively. The specific simulation results are shown in Figure 3:

4.3.3. Changes in Carbon Emissions

The simulation results show that the introduction of CBAM significantly lowers CO2 emissions in Russia (−0.0037%), and also has a weak influence on the emissions in China (−0.0003%) and the US (−0.0002%) at a lower carbon tax (USD 0.2 dollar/dollar). However, CO2 emissions increase in the EU (+0.0008%) and other countries (0.0002%) due to the ongoing “carbon emissions transfer”.
CO2 emissions in Russia (−0.0092%), China (−0.0007%), and the United States (−0.0005%) decrease in the scenario with a higher carbon tariff (50%), while those in the EU (+0.002%) and the rest of the world (0.0004%) all increase accordingly. The increase in CO2 emissions in the EU offsets the reduction effect in China and the US, causing an adverse impact on the overall carbon reduction effects around the world.
Because China, Russia, and the US are exporting less electricity to the EU, they are producing less electricity at home and consequently, emitting less carbon into the atmosphere. In order to compensate for the decrease in electricity exports from the three countries to the EU, the EU’s electricity production is enhanced, thus increasing the EU’s carbon emissions. Carbon emissions in the rest of the world increase because of few electricity exports from China, Russia, and the US to the EU, and those from the rest of the world will increase as a result, marginally raising the carbon emissions. The specific simulation results are demonstrated in Figure 4:

4.3.4. Changes in the Exports of Other Commodities from China to the EU

The simulation findings suggest that China’s exports of coal and other industrial products to the EU increase, while those of oil and gas fall. More specifically, when the EU imposes a tax rate of USD 0.5 dollar/dollar for the CBAM, China’s exports to the EU increase by 0.0059% and 0.0006% for coal and other industrial products, and decrease by 0.0009% and 0.0062% for oil and natural gas respectively. This is due to the fact that the EU’s increased power generation raises the demand for coal, thus boosting coal exports from China. The increased coal consumption, on the other hand, reduces the demand for oil and gas products, which results in a fall in China’s oil and gas exports. In contrast, the EU’s improved social welfare raises the demand for other industrial manufacturing products from China, increasing, in turn, China’s exports of these products to the EU. The specific simulation results are shown in Figure 5:

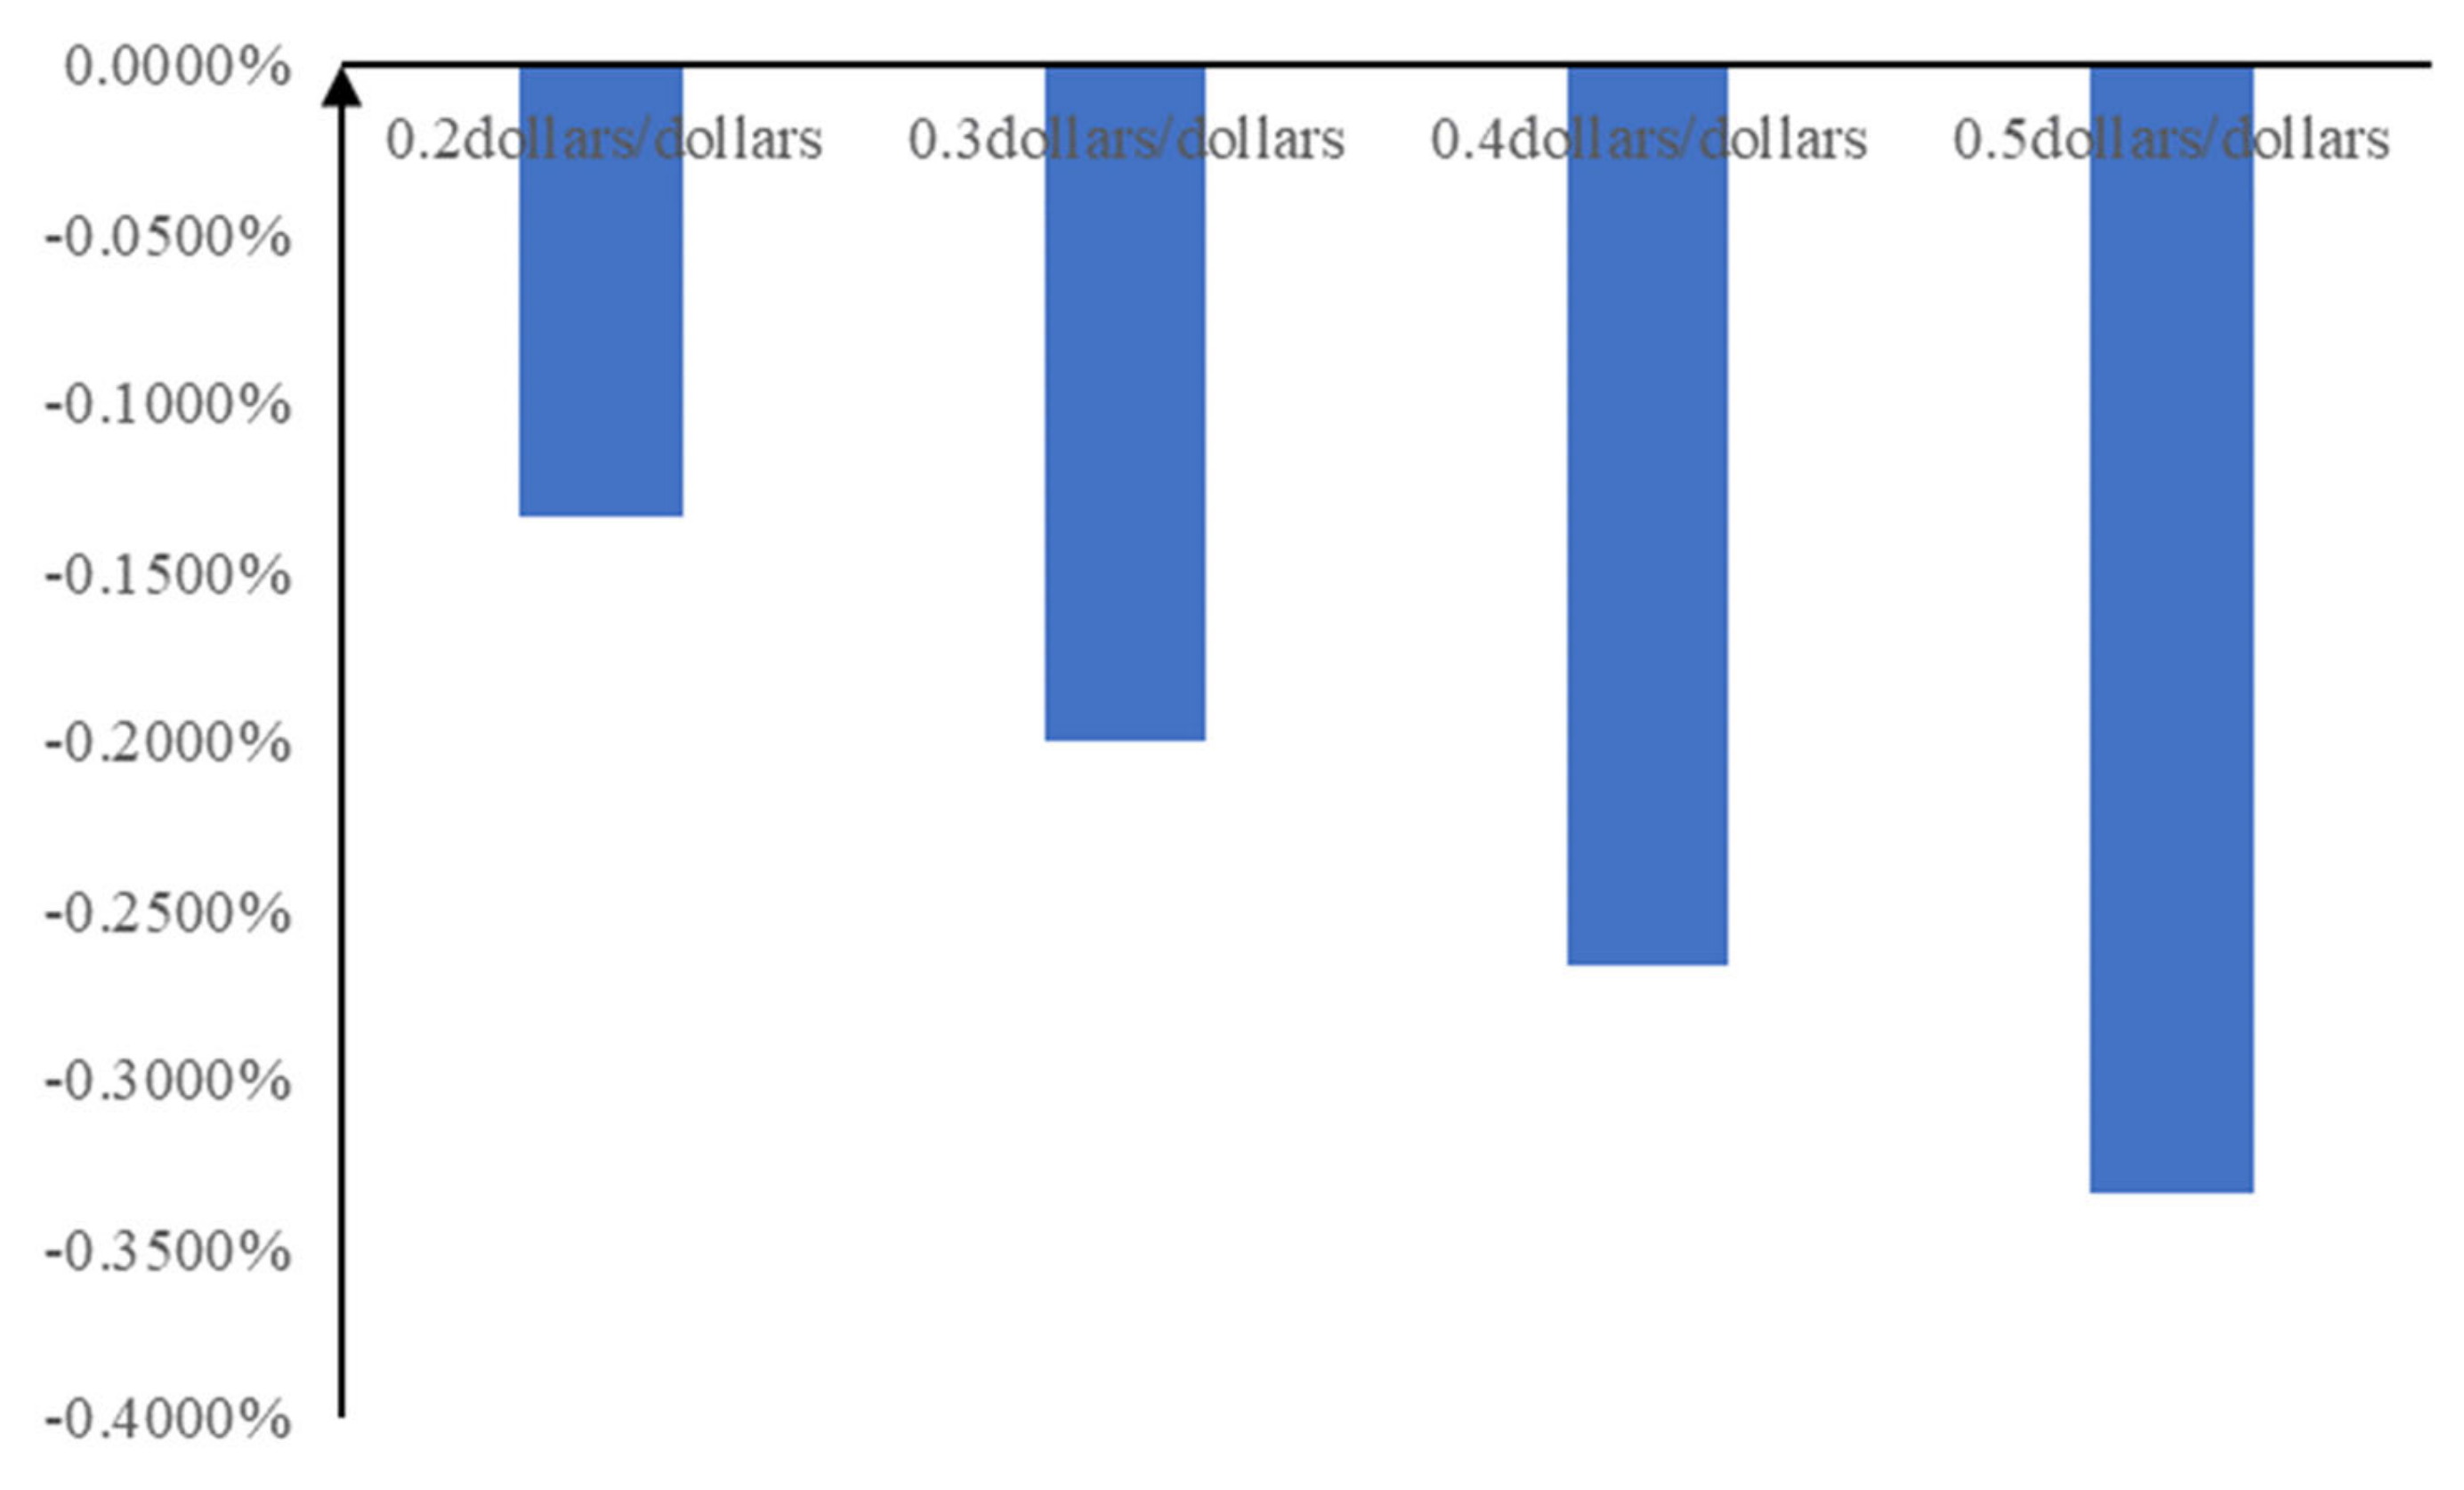
4.3.5. Changes in China’s Exports

The simulation results show that the adoption of CBAM in the EU will result in an increase in China’s exports of coal and other industrial goods, and a corresponding decrease in its exports of oil and gas. In particular, when the EU implements a tax rate of USD 0.5 dollar/dollar, China’s exports of coal and other industrial products increase by 0.0013% and 0.0002% respectively, while those of oil and natural gas decrease by 0.0002% and 0.0025% respectively. The specific simulation results are shown in Figure 6 and Figure 7:
In summary, according to the simulation results, under the assumption that China and other trading partners export electricity to the EU, the implementation of the EU Carbon Border Adjustment Mechanism (CBAM) will significantly reduce the total electricity exports of China, the US, and Russia to the EU. CBAM may improve the EU’s own social welfare, but it will also increase the EU’s carbon emissions, which will have adverse effects on long-term emission reduction. Besides, on the energy front, China’s exports of coal and other industrial products will increase due to the EU’s implementation of the CBAM, but its oil and gas exports will decrease.

5. Conclusions and Policy Recommendations

This paper seeks to examine the impact of the Carbon Border Adjustment Mechanism (CBAM) introduced by the EU on the Chinese economy, as well as other major countries like the U.S. and Russia. The marginal abatement cost (MAC) method was adopted to measure the changes in the cost needed to increase the unit emission reduction along with the total emission reduction. At the same time, the CGE model and GTAP 10E data were used to simulate the impact of the EU implementation of the CBAM on social welfare and carbon emissions in other nations as well as on China’s total exports.
The simulation results show that the adoption of CBAM in the EU would have a negative impact on social welfare in the US, but a positive one in China, Russia, the EU, and the rest of the world. At the same time, CBAM would reduce carbon emissions in China, Russia, and the US, but increase those in the EU and other countries, negatively affecting the EU’s efforts to achieve carbon neutrality. In addition, the EU CBAM would also have an effect on China’s exports, especially the electricity sector which might be most seriously hit. The EU and the rest of the world will correspondingly enhance their electricity generation capacity and thus social welfare at the same time, but carbon emissions will also increase as a result.
These findings are crucial for Chinese policymakers and can serve as a reference for regulators in other countries to make reasonable policy decisions. While ensuring that the carbon emissions targets are met, the detrimental effects of CBAM on the entire economy can be reduced.
In the context of globalization, the impact of CBAM will be more extensive and far-reaching. Although the CBAM currently involves only some imported goods (of high-carbon industries), it may cover other typical imports or possibly the entire trading system in the future. The EU is a global leader in fields relating to energy, the environment, and carbon emissions, and many of its academic studies, policies, laws, and regulations have been recognized by the United Nations at the global level, worthy of study and reference by governments of all other countries. Therefore, the following policy recommendations are provided in this paper to address the above issues:
(1) Encourage relevant government agencies and enterprises to study the policies and regulations of CBAM as early as possible, track the implementation process continuously, and conduct a comprehensive assessment of the effects of carbon tariffs on import and export trade. Adopt a long-term development strategy under the “Carbon peak and carbon neutrality” objectives, introduce and innovate cooperatively the carbon reduction technologies, optimize and upgrade the export product structure of high-carbon industries, and increase the export of low-carbon products, so as to promote the transformation of the energy industry. Meanwhile, companies are urged to actively seek global markets move, diversify their trade partners, reduce export dependence on the EU market, and ultimately accomplish low-carbon yet profitable development.
(2) Create an emission accounting system for products by adopting the worldwide carbon footprint accounting technique. Improve the monitoring, reporting, and verification of carbon emissions data of export companies based on their production and operation status, accurately record the carbon footprint and corresponding carbon emissions of the whole life cycle of products, and thereby gradually realize the carbon reduction target, forming an integrated system management mode involving carbon review, carbon accounting, carbon disclosure, and carbon trading.
(3) Improve China’s carbon tax market and system, develop a reasonable pricing mechanism, and expand the scope of industries for carbon emissions trading (gradually expanding from the electricity industry to high-carbon industries such as steel, cement, electrolytic aluminum, etc.). Implement the paid allocation of carbon emission quota, raise the cost of carbon emissions in high-carbon industries, enhance enterprises’ awareness of carbon price, narrow the gaps between domestic and international carbon price moves, and keep as much of the revenue from carbon tax as possible within the nation. At the same time, set up a dynamic adjustment mechanism for the domestic and international carbon price difference to adjust the carbon price of major industries in China, based on the development stage and technology level of these sectors as well as the trend of the EU (and international) carbon price. This will prevent the imposition of harsh “carbon tariffs” on specific businesses. For small and medium-sized enterprises that are not included in the carbon emissions trading system for the time being, it is necessary to develop corresponding guiding policies to support their emissions reduction efforts while minimizing the risks that they will be subject to carbon tariffs when exporting goods.
(4) Conduct in-depth academic dialogues and policy discussions with the EU, and strive to reach an agreement on certain critical areas, including the creation of a mutually recognized third-party inspection agency, exemption from carbon tariffs, mutual recognition of carbon pricing mechanism, incentive mechanism for excess emissions reduction, determination of paid carbon costs, Clean Development Mechanism (CDM), international Verified Carbon Standard (VCS), and China Certified Emission Reduction (CCER), etc. At the same time, adopt or borrow the advanced and mature concepts and practices from the EU to develop China’s own carbon border adjustment mechanism, providing legal protection for domestic industries in the game of future carbon taxation with the EU, and reducing the negative effects of CBAM after its full implementation, so as to collectively contribute to a new age of international emissions reduction initiatives and low-carbon development.
(5) Encourage all industries to upgrade their technology and work to cut carbon emissions, so that their energy use efficiency and carbon emissions level can achieve the world-class standard, minimizing the CBAM’s impact on China. Establish special funds to provide low-cost financing to high-carbon emission sectors for their technological innovation and energy-saving equipment upgrade. Assign related agencies to supervise the use of the funds to ensure that they are attached to specific purposes and ensure that the repayment period can be extended when necessary.
There are also certain limitations to this study. First, the CBAM has just been approved by legislation, and the empirical analysis herein is based on model assumptions rather than real data simulations, so it may differ, to some extent, from the actual situation. Second, the implementation of CBAM could result in butterfly effects, and its impact factors on the economic data of various countries are quite complicated and difficult to be estimated accurately. Third, the government encounters a series of problems when making policies in terms of rationality, actionability, and continuity, with many uncertainties while attempting to balance the interests of all parties.

Author Contributions

Conceptualization, A.L.S., X.H. and T.Z.; methodology, A.L.S. and X.H.; formal analysis, A.L.S. and A.W.; data curation, A.L.S. and A.W.; writing—original draft preparation, A.L.S. and A.W.; writing—review and editing, T.Z. and X.H. All authors have read and agreed to the published version of the manuscript.

Funding

This research is supported by the General social science project of Beijing Municipal Commission of Education (110052972027/131).

Institutional Review Board Statement

Not applicable.

Informed Consent Statement

Not applicable.

Data Availability Statement

Not applicable.

Conflicts of Interest

The authors declare no conflict of interest.

References

  1. Parry, I.; Black, S.; Roaf, J. Proposal for an International Carbon Price Floor among Large Emitters; IMF Staff Climate Note 2021/001; International Monetary Fund: Washington, DC, USA, 2021. [Google Scholar]
  2. Yu, X.; Zhan, X. Review of global carbon emission responsibility division principle. Sci. Technol. Ind. 2016, 16, 137–143. [Google Scholar]
  3. Oliveira-martins, J.; Burniaux, J.M.; Martin, J.P. Trade and the effectiveness of unilateral CO2 abatement policies: Evidence from green. OECD Econ. Stud. 1992, 19, 123. [Google Scholar]
  4. Shin, S. Developing country’s perspective on COP3 development (Kyoto Protocol). Energy Policy 1998, 26, 519–526. [Google Scholar] [CrossRef]
  5. Mody, M. The Economics of Organization: The Transaction Cost Approach. Am. J. Sociol. 1981, 87, 548–577. [Google Scholar]
  6. Qin, A.; Hou, X. Current situation and development trend of the global carbon emissions market mechanism. China Ship Surv. 2021, 77–81. [Google Scholar] [CrossRef]
  7. Xie, Z. The carbon peaking schedule of various industries should not be “one-size-fits-all”. China Energy News, 27 March 2021. [Google Scholar]
  8. Parry, I.; Peter, D.; Cory, H.; Martin, K.; Kyung, K.; Florian, M.; James, R.; Christophe, W. What Role for Borden Carbon Adjustment? International Monetary Fund: Washington, DC, USA, 2021. [Google Scholar]
  9. Ringius, L.; Torvanger, A.; Underdal, A. Burden sharing and fairness principles in international climate policy. Int. Environ. Agreem. 2002, 2, 1–22. [Google Scholar]
  10. Zhuang, G.; Zhu, X. European Green Deal: Contents, Influences, and Implications. Int. Econ. Rev. 2021, 157 (Suppl. 1), 8+116–133. [Google Scholar]
  11. Parry, I.; Simon, B.; Karlygash, Z. Carbon Taxes or Emissions Trading Systems? Instrument Choice and Design; International Monetary Fund: Washington, DC, USA, 2022. [Google Scholar]
  12. Li, Y. Carbon tariffs are coming! The European Parliament passes the “Carbon Border Adjustment Mechanism” Proposal, Posing Challenges to Many Industries [EB/OL]. Available online: https://news.cnstock.com/news,bwkx-2021034671469.htm (accessed on 13 March 2021).
  13. Liu, X. Analysis of the WTO compliance of the EU Carbon Border Adjustment Mechanism. J. Shanghai Univ. Int. Bus. Econ. 2022, 29, 5–22+37. [Google Scholar] [CrossRef]
  14. Sato, S. EU’s Carbon Border Adjustment Mechanism: Will It Achieve Its Objective(s)? J. World Trade 2022, 56, 383. [Google Scholar]
  15. Ni, S.; Ma, Y. EU’s Carbon Border Adjustment Mechanism and its impact on China. Mod. SOE Res. 2022, 86–89. [Google Scholar]
  16. Li, J. Eurostat: China Becomes the Largest Trading Partner of the EU in 2020 [EB/OL]. Available online: http://www.gov.cn/xinwen/2021-02/16/content_5587302.htm (accessed on 16 February 2021).
  17. Gu, A.; He, J.; Zhou, L. The impact of foreign trade development on China’s carbon emissions under the new normal of economy. China Environ. Sci. 2020, 40, 2295–2303. [Google Scholar]
  18. UNFCCC (United Nations Framework Convention on Climate Change). Kyoto Protocol to the United to the United Nations Framework Convention on Climate Change [EB/OL]. Available online: https://unfccc.int/documents/2409 (accessed on 29 March 2020).
  19. United Nations. United Nations Framework Convention on Climate Change [EB/OL]. Available online: https://unfccc.int/resource/docs/convkp/conveng.pdf (accessed on 28 June 1996).
  20. Mehling, M.A.; Van Asselt, H.; Das, K.; Droege, S.; Verkuijl, C. Designing Border Carbon Adjustments for Enhanced Climate Action. Am. J. Int. Law 2017, 113, 433–481. [Google Scholar] [CrossRef] [Green Version]
  21. Nevalainen, A. EU’s Carbon Border Adjustment Mechanism—Its Purpose and Effects on Carbon Leakage. Bachelor’s Thesis, Aalto University School of Business, Helsinki, Finland, 2021. [Google Scholar]
  22. Yan, Q.; Yang, L. Research on the impact of the EU Carbon Border Adjustment Mechanism (CBAM) on foreign trade and relevant countermeasures—Taking Wuxi City, Jiangsu Province as an example. J. Commer. Econ. 2022, 2095, 161–164. [Google Scholar]
  23. Bellora, C.; Fontagné, L. EU in Search of a WTO-Compatible Carbon Border Adjustment Mechanism; Working Papers 2022-01; CEPII Research Center: Paris, France, 2022. [Google Scholar]
  24. Mörsdorf, G. A simple fix for carbon leakage? Assessing the environmental effectiveness of the EU carbon border adjustment. Energy Policy 2022, 161, 112596. [Google Scholar] [CrossRef]
  25. Caron, J. Estimating carbon leakage and the efficiency of border adjustments in general equilibrium—Does sectoral aggregation matter? Energy Econ. 2012, 34, S111–S126. [Google Scholar] [CrossRef]
  26. Branger, F.; Quirion, P. Would border carbon adjustments prevent carbon leakage and heavy industry competitiveness losses? Insights from a meta-analysis of recent economic studies. Ecol. Econ. 2014, 99, 29–39. [Google Scholar] [CrossRef] [Green Version]
  27. Palacková, E. Saving face and facing climate change: Are border adjustments a viable option to stop carbon leakage? Eur. View 2019, 18, 149–155. [Google Scholar] [CrossRef]
  28. Hufbauer, G.C.; Kim, J. Can EU Carbon Border Adjustment Measures Propel WTO Climate Talks? Policy Briefs PB21-23; Peterson Institute for International Economics: Washington, DC, USA, 2021. [Google Scholar]
  29. Jakob, M. Why carbon leakage matters and what can be done against it. One Earth 2021, 4, 609–614. [Google Scholar] [CrossRef]
  30. Perdana, S.; Vielle, M. Making the EU Carbon Border Adjustment Mechanism Acceptable and Climate Friendly for Least Developed Countries. Energy Policy 2022, 170, 113245. [Google Scholar] [CrossRef]
  31. Lim, B.; Hong, K.; Yoon, J.; Chang, J.I.; Cheong, I. Pitfalls of the EU’s carbon border adjustment mechanism. Energies 2021, 14, 7303. [Google Scholar] [CrossRef]
  32. Chen, X.; Zuo, P. Impact of EU’s carbon border adjustment mechanism and relevant countermeasures. Energy 2022, 7, 49–52. [Google Scholar]
  33. Liu, B.; Zhao, F. Impact of EU’s carbon border adjustment mechanism on China’s exports and relevant countermeasures. J. Tsinghua Univ. 2021, 36, 185–194. [Google Scholar]
  34. Xu, Q. Impact of EU’s carbon border adjustment tax on China and its strategic choice. Reform Econ. Syst. 2022, 3, 157–163. [Google Scholar]
  35. Zhong, J.; Pei, J. Beggar thy neighbor? On the competitiveness and welfare impacts of the EU’s proposed carbon border adjustment mechanism. Energy Policy 2022, 162, 112802. [Google Scholar] [CrossRef]
  36. Zhang, H.; Zhang, H. Carbon leakage, border carbon tax adjustment and their impact on China’s export trade. Public Financ. Res. 2013, 1, 33–36. [Google Scholar]
  37. Wu, L.; Zhou, Y.; Qian, H. Global actions under the Paris agreement: Tracing the carbon leakage flow and pursuing countermeasures. Energy Econ. 2022, 106, 105804. [Google Scholar] [CrossRef]
  38. Zhang, Y. Analysis of China’s energy efficiency and influencing factors under carbon peaking and carbon neutrality goals. J. Clean. Prod. 2022, 370, 133604. [Google Scholar] [CrossRef]
  39. Bednar-Friedl, B.; Schinko, T.; Steininger, K.W. The relevance of process emissions for carbon leakage: A comparison of unilateral climate policy options with and without border carbon adjustment. Energy Econ. 2012, 34, S168–S180. [Google Scholar] [CrossRef]
  40. Overland, I.; Sabyrbekov, R. Know your opponent: Which countries might fight the European carbon border adjustment mechanism? Energy Policy 2022, 169, 113–175. [Google Scholar] [CrossRef]
  41. Qi, S.; Xu, Z.; Yang, Z. China’s carbon allowance allocation strategy for the steel industry under the EU carbon border adjustment mechanism. Resour. Sci. 2022, 44, 274–286. [Google Scholar]
  42. Guo, Q.; Chen, W. Analysis of the economic effects of China-US trade frictions based on the dynamic CGE model. World Econ. Study 2019, 8, 103–117+136. [Google Scholar]
  43. Li, M.; Guan, J.; Li, C. Research on the impact of additional tariffs on China’s agricultural products trade under the background of China-US trade frictions and relevant countermeasures—Based on the GTAP Model. Trade Fair Econ. 2022, 14, 156–158. [Google Scholar]
  44. Cai, D.; Chen, J. Comparison and enlightenment of carbon tax policies of EU member states. Res. Explor. 2012, 4, 32–36. [Google Scholar]
  45. Li, X. Focus on the Expected Impact of the EU’s Carbon Tariffs to Tackle the Uncertainties Ahead [EB/OL]. Available online: yicai.com.http://www.tanpaifang.com/tanshui/2022/0815/89392_3.html (accessed on 15 August 2022).
Figure 1. Changes of Elements in Countries and Regions around the World from 2014 to 2030.
Sustainability 15 04761 g001
Figure 2. Changes in the EU’s Source of Electricity.
Sustainability 15 04761 g002
Figure 3. Changes in Social Welfare in China, Russia, the US, the EU and the Rest of the World by 2030.
Sustainability 15 04761 g003
Figure 4. Changes in Carbon Emissions in China, Russia, the US, the EU and the Rest of the World by 2030.
Sustainability 15 04761 g004
Figure 5. Changes in Other Commodities Exports from China to the EU by 2030.
Sustainability 15 04761 g005
Figure 6. Changes in China’s Exports of Electricity (currently none) by 2030.
Sustainability 15 04761 g006
Figure 7. Changes in China’s Exports of Other Commodities by 2030.
Sustainability 15 04761 g007
Table 1. The CBAM Simulation Scenario Setting.
ScenarioBaseline ScenarioScenario 1Scenario 2Scenario 3Scenario 4
Tax rate00.2 dollar/dollar0.3 dollar/dollar0.4 dollar/dollar0.5 dollar/dollar
Disclaimer/Publisher’s Note: The statements, opinions and data contained in all publications are solely those of the individual author(s) and contributor(s) and not of MDPI and/or the editor(s). MDPI and/or the editor(s) disclaim responsibility for any injury to people or property resulting from any ideas, methods, instructions or products referred to in the content.

