Article

Changes in Microfine Particle Migration of Ionic Rare Earth Ores during Leaching

1
Faculty of Materials Metallurgy and Chemistry, Jiangxi University of Science and Technology, Ganzhou 341000, China
2
Ganjiang Innovation Academy, Chinese Academy of Sciences, Ganzhou 341000, China
3
Jiangxi Province Key Laboratory of Cleaner Production of Rare Earths, Ganzhou 341000, China
*
Author to whom correspondence should be addressed.
Sustainability 2023, 15(4), 3867; https://doi.org/10.3390/su15043867
Submission received: 19 December 2022 / Revised: 12 February 2023 / Accepted: 12 February 2023 / Published: 20 February 2023
(This article belongs to the Special Issue Agricultural and Natural Ecosystems Restoration after Disturbances)

Abstract

:
The hydration mechanism between the leaching agent and ore surface during the leaching process of ionic rare earth ore is complicated, and the inter-particle bridge cementation is prone to fracture due to the existence of multiple forces and dispersion during ion adsorption and exchange, resulting in migration and rearrangement of microfine particles, and precipitation at the pore throat, producing blockage phenomenon and affecting the leaching efficiency of ionic rare earths. In order to reveal the migration law of microfine particles during in situ leaching of ionic rare earth ores and to find suitable regulation methods, this paper investigates the effects of leaching agent mass concentration, viscosity, flow rate, hydraulic gradient, ore body height, and ore body water content on the migration of microfine particles. We compared ionic rare earth ores as raw ores and rare earth ores with particle sizes ranging from 0.075 to 0.09 mm using the laboratory column leaching method. The results showed that the migration of microfine particles during ionic rare earth ore leaching was an important factor affecting leaching efficiency. Under the action of external forces, the microfine particles tended to migrate with the leaching agent during the leaching process.

1. Introduction

Rare earths, despite the name, are not in fact rare in reserves on Earth, but rather are very rich, even more so than the reserves of commonly seen elements, such as copper, zinc, tin, etc. [1]. Due to the limitations of science in the eighteenth century, it was difficult to purify rare earths during the smelting process, and people could only make some impure, earth-like oxides at that time, which caused rare earth elements to be rare in the perceived range and gave them their name [2].
“Rare earth elements” is the collective name for the 17 metallic elements including the 15 lanthanides in the periodic table with atomic numbers ranging from 57 to 71, as well as scandium and yttrium, which have similar chemical properties. They belong to group III B of the periodic table and usually present a positive trivalent form. However, scandium is sometimes not included in the rare earth elements because of its weak symbiosis with other elements in nature and because scandium’s properties differ significantly from those of the other rare earth elements [3].
As a rare earth mineral resource unique to China, ionic rare earth ores are a globally scarce mineral species. The mineralization conditions of ionic rare earth ores are very complex, and one of the following three conditions is indispensable: First, the original rock must contain rare earth minerals. Second, the rare earths must be hosted on weatherable rare earth minerals. Third, the rocks must be in a warm and humid area and be subject to biological, physical, and chemical interactions. In addition to this, the geological conditions of mineralization of ionic rare earth deposits are influenced by various factors such as rock conditions, tectonic conditions, and epigenetic conditions [4,5]. Compared to other types of rare earth ores, such as cerium fluorocarbon (65–75 wt.% REO), monazite (55–65 wt.% REO), and yttrium phosphate (25–60 wt.% REO), ionic rare earth ores have a very low rare earth content of 0.05–0.2 wt.% REO [6,7]. However, ionic rare earth ores are characterized by easy mining, low processing costs, and low radioactive element content, which greatly reduces their recovery costs.
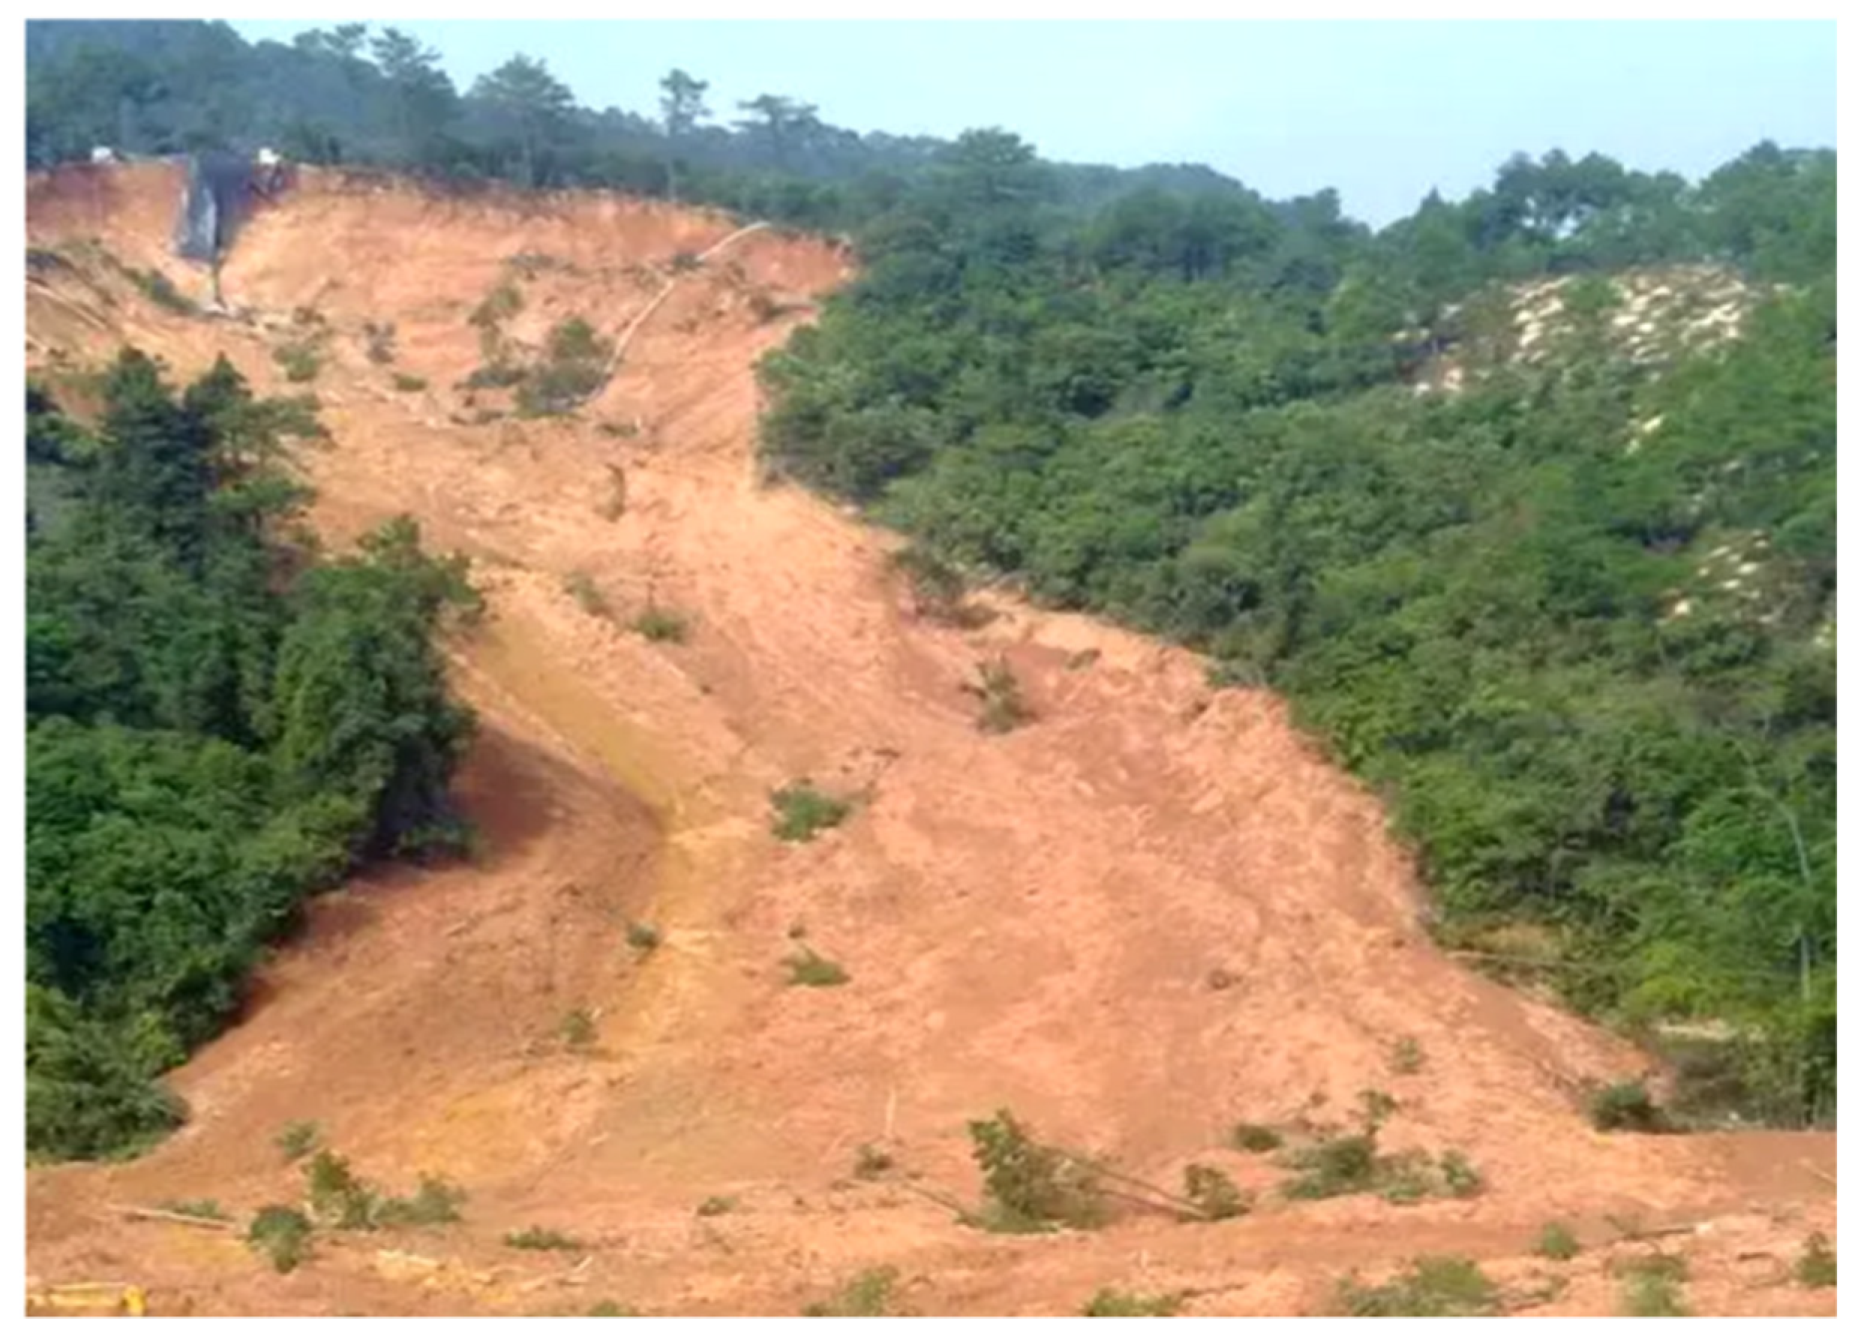
During in situ leaching mining of rare earths, property losses and casualties caused by geological disasters often occur [8]. The cited article points out that in situ leaching process may bring about some geological disasters, including landslides, collapses, mud rock flows, etc. Figure 1 shows a test stope of a rare earth mine in southern Jiangxi, which is managed by Ganzhou Rare Earth Mining Company. Landslides have occurred on remote mountain tops; e.g., Figure 2 shows rare earth ore being mined in an area of southern Jiangxi, which is contracted by a private boss. The landslide surface extends from the foot of the mountain to the top of the mountain. Once a landslide or collapse occurs at the front edge of a slope, the rear edge will continuously slide or collapse along the landslide surface due to continuous liquid injection and rainfall, and the final result is a large-scale landslide. These landslides can peel off the clay layer from mountain surface. The clay layer, formed over thousands of years, is the life bed of vegetation. Once it is damaged, it will be difficult for vegetation to recover in a short time, and so mountains in rare earth mining areas become like scars. Therefore, landslides seriously damage the environment, making it difficult to restore vegetation, and making it difficult to recover some rare earth resources.
There are many factors that cause landslides or collapses in in situ leaching, including natural factors and human factors [9]. Humans cannot control nature, but they can restrain themselves. The main controllable human factor is injection intensity [10,11]. There is a basic experience in mining areas: if the strength of the liquid injection is large, it very easily causes landslides; if the strength of the liquid injection is small, the mountain is very stable, and even cracks cannot be seen. After visiting rare earth mines in the south of Jiangxi Province, it was found that the mine owner, in order to maximize benefits, allowed more ore to flow out of mountain. Based on the principle of high-intensity liquid injection, supplemented by experience, when a crack is found somewhere in mountain, the amount of liquid injection should be reduced as soon as possible [12,13]. Therefore, it is of great significance to propose a calculation model for liquid injection strength to change the technical status quo of in situ leaching process based on experience and realize standardized mining [14,15].
The stability of a landslide is closely related to its permeability coefficient. The authors of [16,17] elaborated the relationship between the change in permeability coefficient and stability of landslide mass: for a landslide ore body with poor permeability, a change in permeability coefficient has no obvious impact on the stability of the landslide mass; For a landslide mass with good water permeability, a change in permeability coefficient has an obvious influence on the stability of the landslide mass. It can be seen that permeability change is an important factor causing landslides. Therefore, in order to ensure safety and stability of the slope in the mining process and to eliminate the waste of rare earth resources, this paper conducts an in-depth study on laws of permeability change during the leaching process of ionic rare earth ores, which provides a certain basis for slope stability in rare earth mining and mining process of rare earth ores.

2. Materials and Methods

2.1. Test Scheme Design

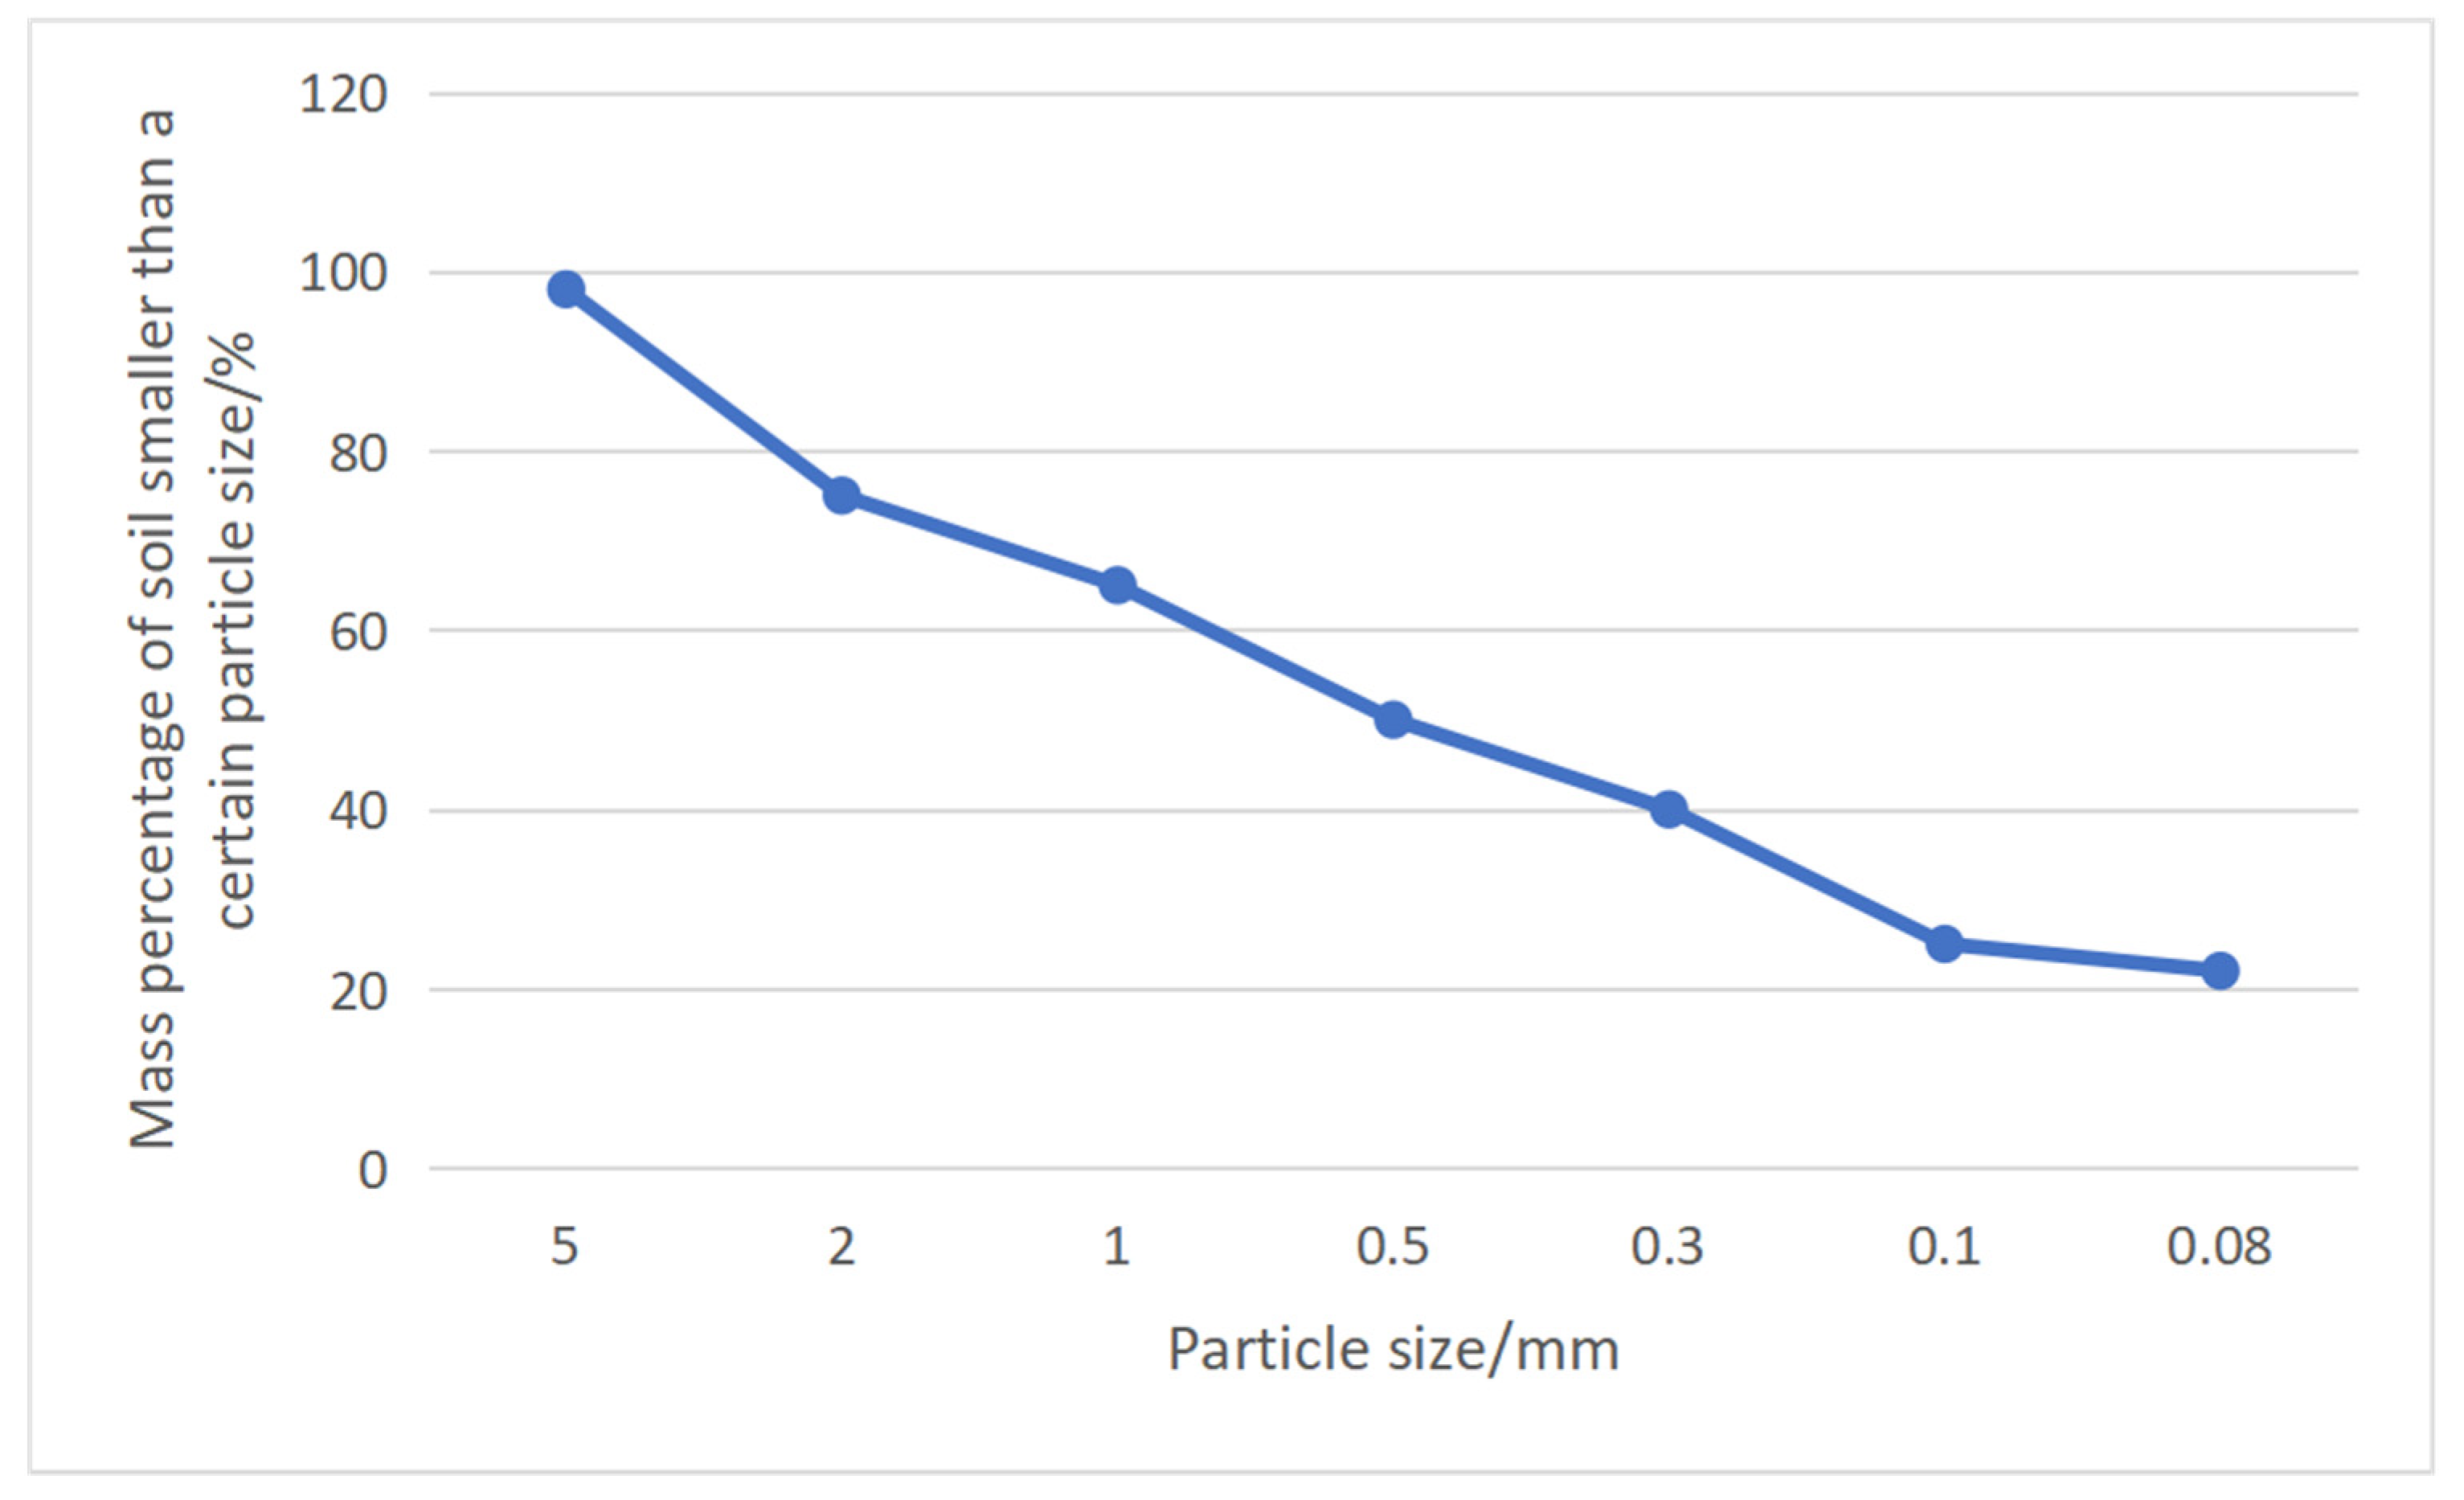
There are two kinds of permeability tests of ionic rare earth: the indoor test and the outdoor test. Although outdoor test data is more accurate, it is time-consuming and labor-intensive to collect. The indoor test was adopted in this paper because it can be used to control test conditions for regular research. In order to simulate an in situ leaching process, the indoor column leaching test was adopted in this paper. The screening test and specific gravity test were carried out for ionic rare earth first. The test results are shown in Table 1, and the grading curve of ionic rare earth is shown in Figure 3. According to screening test data, it was determined that ionic rare earth in the mining area is silty sand, which is well graded and has a wide difference in particle size. The soil classification method in the specification promulgated by the Ministry of Construction is that soil with particle size d > 0.075 mm and mass more than 1/2 of the total mass belongs to coarse-grained soil, and so the infiltration coefficient was determined by an indoor column immersion test with constant water head.
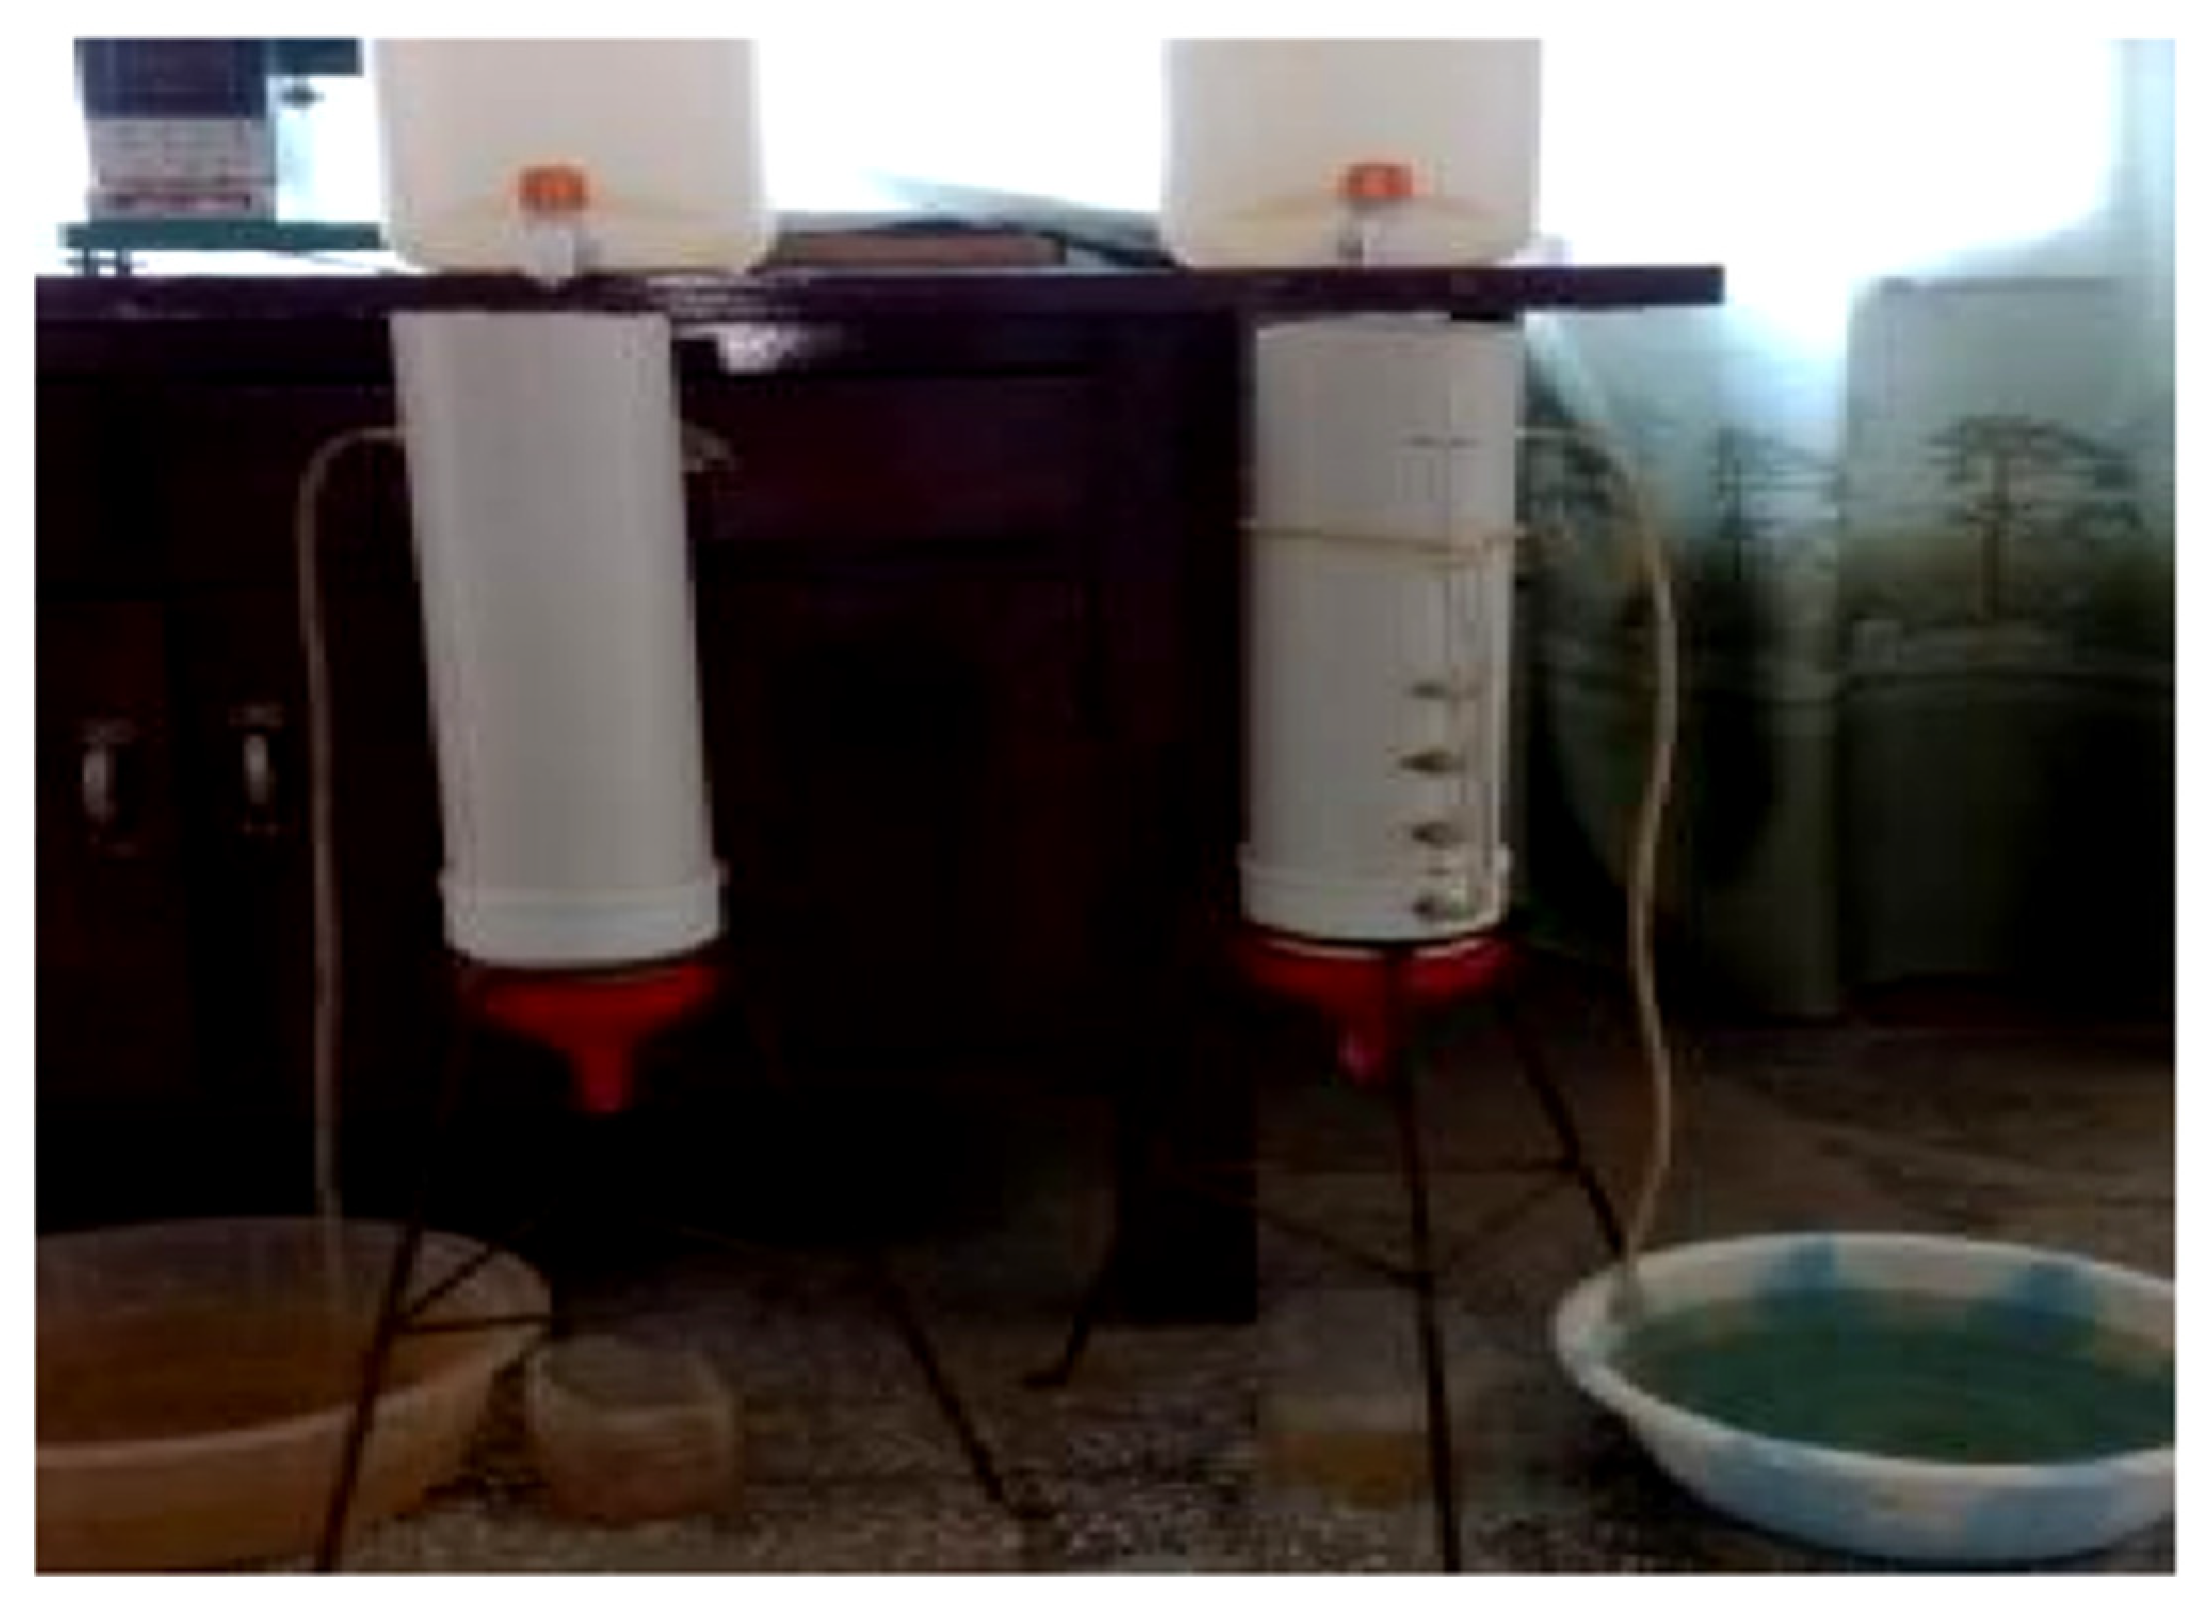
The test device was mainly composed of a cylindrical PVC pipe with a diameter of 110 mm, a base plate, and a water supply device. A round opening cover was connected at the bottom with threads to place the bottom plate. A small hole with a hole diameter of 2 mm was drilled on the bottom plate. Filter paper was placed on the bottom plate. In order to avoid corrosion of metal by ammonium sulfate solution, the bottom plate was made of plastic. The experimental device was designed as shown in Figure 4 and Figure 5.

2.2. Design of Each Test Link

The whole test process was divided into five stages: preparation before test, sample preparation, water infiltration, ammonium sulfate solution infiltration, and grading analysis after test.
(1)
Design of hydraulic gradient
The hydraulic gradient is the head loss along the direction of flow on the unit infiltration pathway. Groundwater in the process of movement to overcome frictional resistance displays continuous consumption of mechanical energy, resulting in head loss. Along the flow direction head loss is the largest and the head value falls fastest. the head line is always a falling curve, and the curvature of a point on the head line is the hydraulic gradient of the point. The hydraulic gradient can also be the head loss per unit permeability pathway along the direction of groundwater flow [15,16]. In geotechnics or hydraulics, the permeability coefficient, subduction damage, etc., are very closely related to the hydraulic gradient. In order to make the test results obvious and comparative, hydraulic gradients were set as 1.25, 2, and 3. The constant head seepage test method was adopted in the test, that is, the entire test head remained unchanged, and the hydraulic gradient of the entire sample was controlled by controlling the height of the upper water column. The hydraulic gradient of the sample is:
i = Δ h L
In Formula (1), Δ h is the head height, the difference between head at top of sample h 1 and head at bottom of sample h 2 , and L is seepage path. Taking the bottom of the sample as a datum plane, the water head at the top of the sample is h 2 , which is equal to a water column height of H + L . According to Bernoulli’s theorem [17], water head at the bottom of the sample is:
h 2 = v 2 2 g + p r w + z
In Formula (2), ν is the velocity of flow, g is acceleration of gravity, p is water pressure, r w is gravity of water, and z is elevation of datum plane. The liquid seepage in the sample is very slow, so the head term caused by speed can be ignored [18], namely:
h 2 = p r w + z
In Formula (3), because the bottom of the sample contacts atmospheric pressure, p = 0, and the test is based on the bottom of the sample, that is, z = 0, so bottom water head h 2 = /0. Therefore, the water column height of the sample:
H = ( i 1 ) L
According to Formula (4), the height of the overflow port and the top of the sample under different hydraulic gradients is 4 cm, 16 cm and 32 cm, respectively.
(2)
Preparation of ammonium sulfate solution
In this paper, an indoor column leaching simulation test was adopted. The solution injected during the in situ leaching process is 3% thiamine solution, and 3% ammonium sulfate solution was considered to be used in the test [19]. The 3% ammonium sulfate solution means that the mass percentage concentration of the ammonium sulfate solution is 3%, and mass percentage concentration = (solute mass/solution mass) × 100%. Therefore, 100 g of 3% ammonium sulfate solution contains 3 g of sulfuric acid crystals and 97 g of water [20]. When preparing the solution, first, the ammonium sulfate and water required for preparing the solution were weighed, then ammonium sulfate was added into water and stirred evenly, and then stood still for use.
(3)
Sample preparation
As micro-particle migration test requires high accuracy and uniformity of sample. The sample was prepared by layers and components [21]. After the soil mass to be filled was mixed evenly, the sample was divided into six layers for weighing and filling, and the loss of micro-particles was minimized during the sample filling process [22]. Before loading the soil after each time, it was necessary to scratch the surface of the previously compacted soil, so as to avoid the soil layer boundary of the sample. In order to control the void ratio of sample at 0.8, a density formula was used to calculate the mass of soil required for loading the sample. The required mass formula of soil mass is:
m = ρ V = ( 1 + w ) d s 1 + e V
where, V is volume of sample, and the formula is:
V = π ( d 2 ) 2 h
It can be seen from Formula 6 that if the relative density d s of the soil mass is known, the inner diameter d of the PVC pipe is measured with a vernier caliper, the void ratio e is known, and sample height h is known, then the required mass of soil mass with this water content can be calculated by controlling soil water content w. Therefore, the required soil particles and water in soil can be calculated. The required soil particle mass formula is:
m s = m 1 + w
The formula for calculating water mass in soil is:
m w = m m s
(4)
Instantaneous replacement of ammonium sulfate solution
In order to simulate the in situ leaching process, the seepage test of soil samples was divided into two stages. In the first stage, clean water was injected into the soil sample. After the sample formed stable seepage of clean water, the second stage was begun. The ammonium sulfate solution was injected into the sample. The water at the top of the sample was instantly replaced with ammonium sulfate solution. However, directly injecting ammonium sulfate solution after the water is discharged will damage the internal structure of the sample. Therefore, in order to reduce the impact of fluid replacement on the sample structure, a certain amount of water solution was first taken from the water column at the top of the sample with a beaker, then calculated high-concentration ammonium sulfate solution was slowly injected along the edge of the PVC pipe. The concentration was then diluted as required for the test in water column, completing instantaneous replacement.
(5)
Effect of microparticle migration and ion adsorption and exchange reactions on the permeability of the sample collected in the experimental data
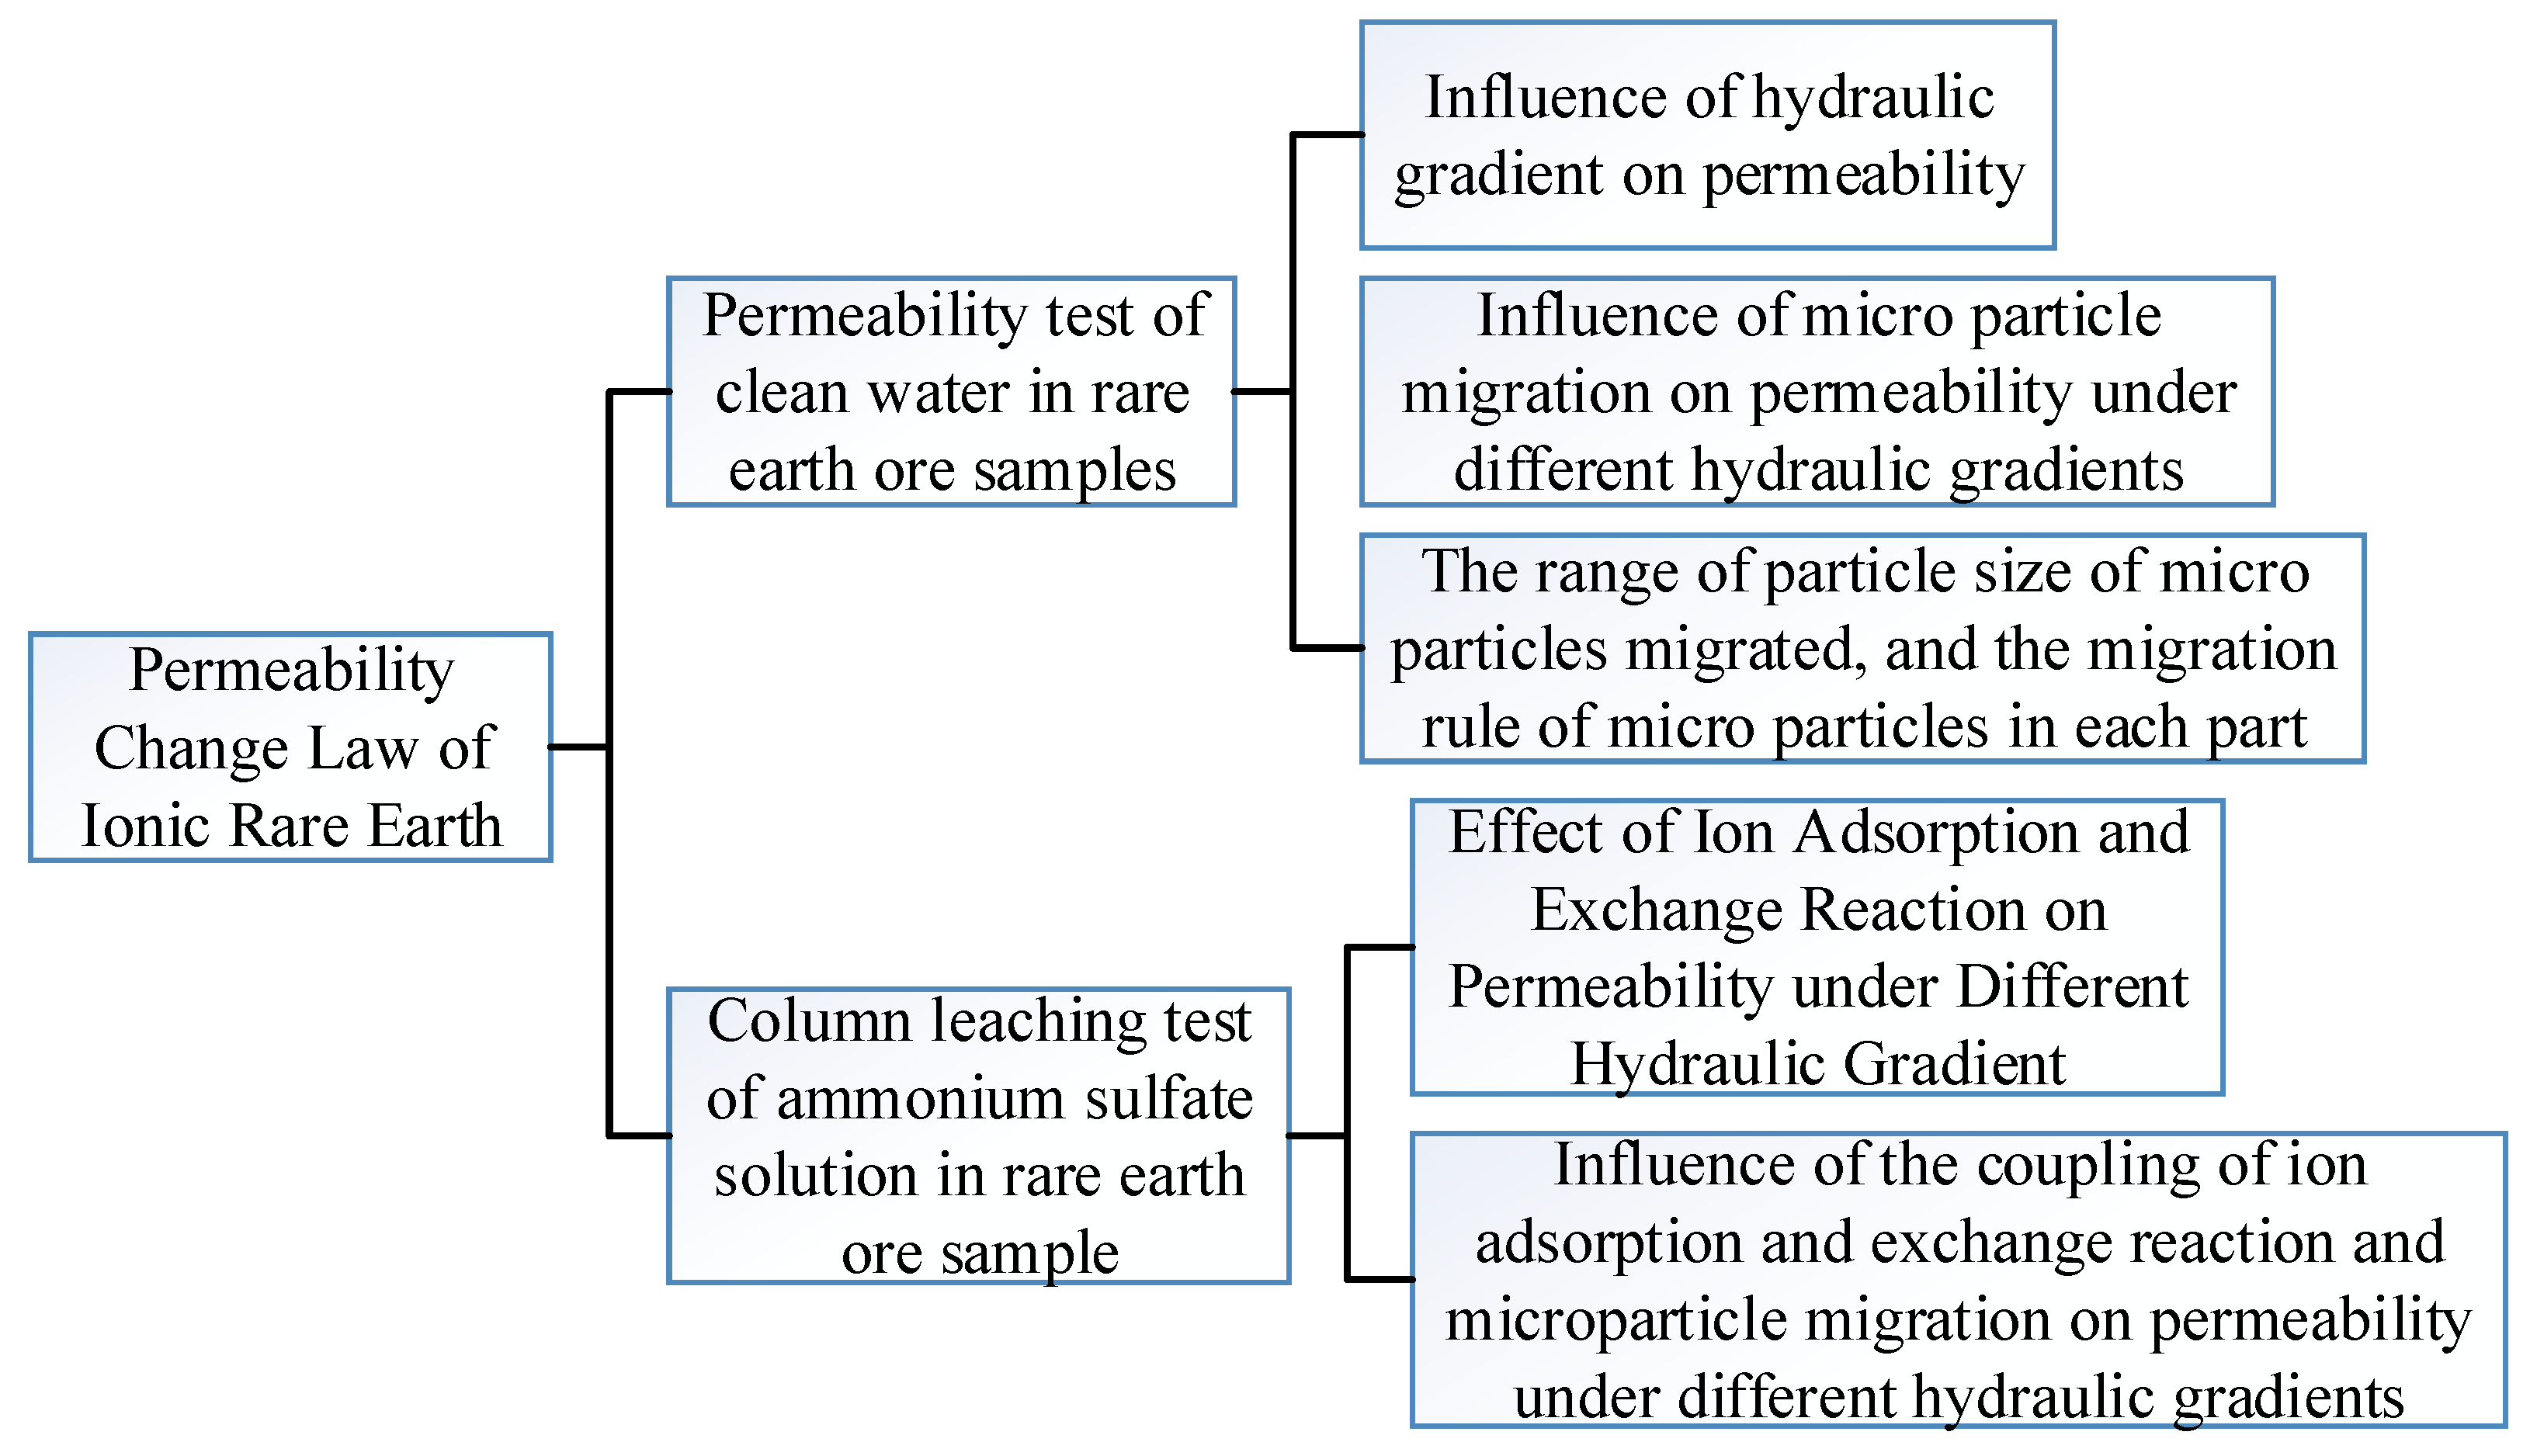
In the clear water injection stage, the percolation flow and head height directly reflect the permeability changes under the effect of homogeneity and microparticle migration in each part of the sample. In the ammonium sulfate solution injection stage, the permeation flow directly reflects the permeability changes under the action of ion adsorption and exchange reactions; therefore, the permeation flow volume 2 and head height h are the most important permeation parameters. Water was injected into the PVC pipe so that the water level was fixed at the waterline. When water started to flow out from the bottom of the sample, the time and the percolation flow rate were recorded. Readings were recorded every 3 min for 2 to 4 h of flow. After 2 to 4 h, a set of readings was recorded approximately every 2 h. Each set of readings was measured 6 times, which is 5 min/per seepage flow measurement. The measurement time was 30 min. The average value of the 6 measurements was taken. Observations were terminated when the average difference in flow over the past 24 h did not exceed 1%, which is considered stable seepage flow. While measuring the seepage flow, the head height of the pressure tube was observed. The soil is free-draining and the effect of head lag was not considered. Research contents are shown in Figure 6.

3. Results

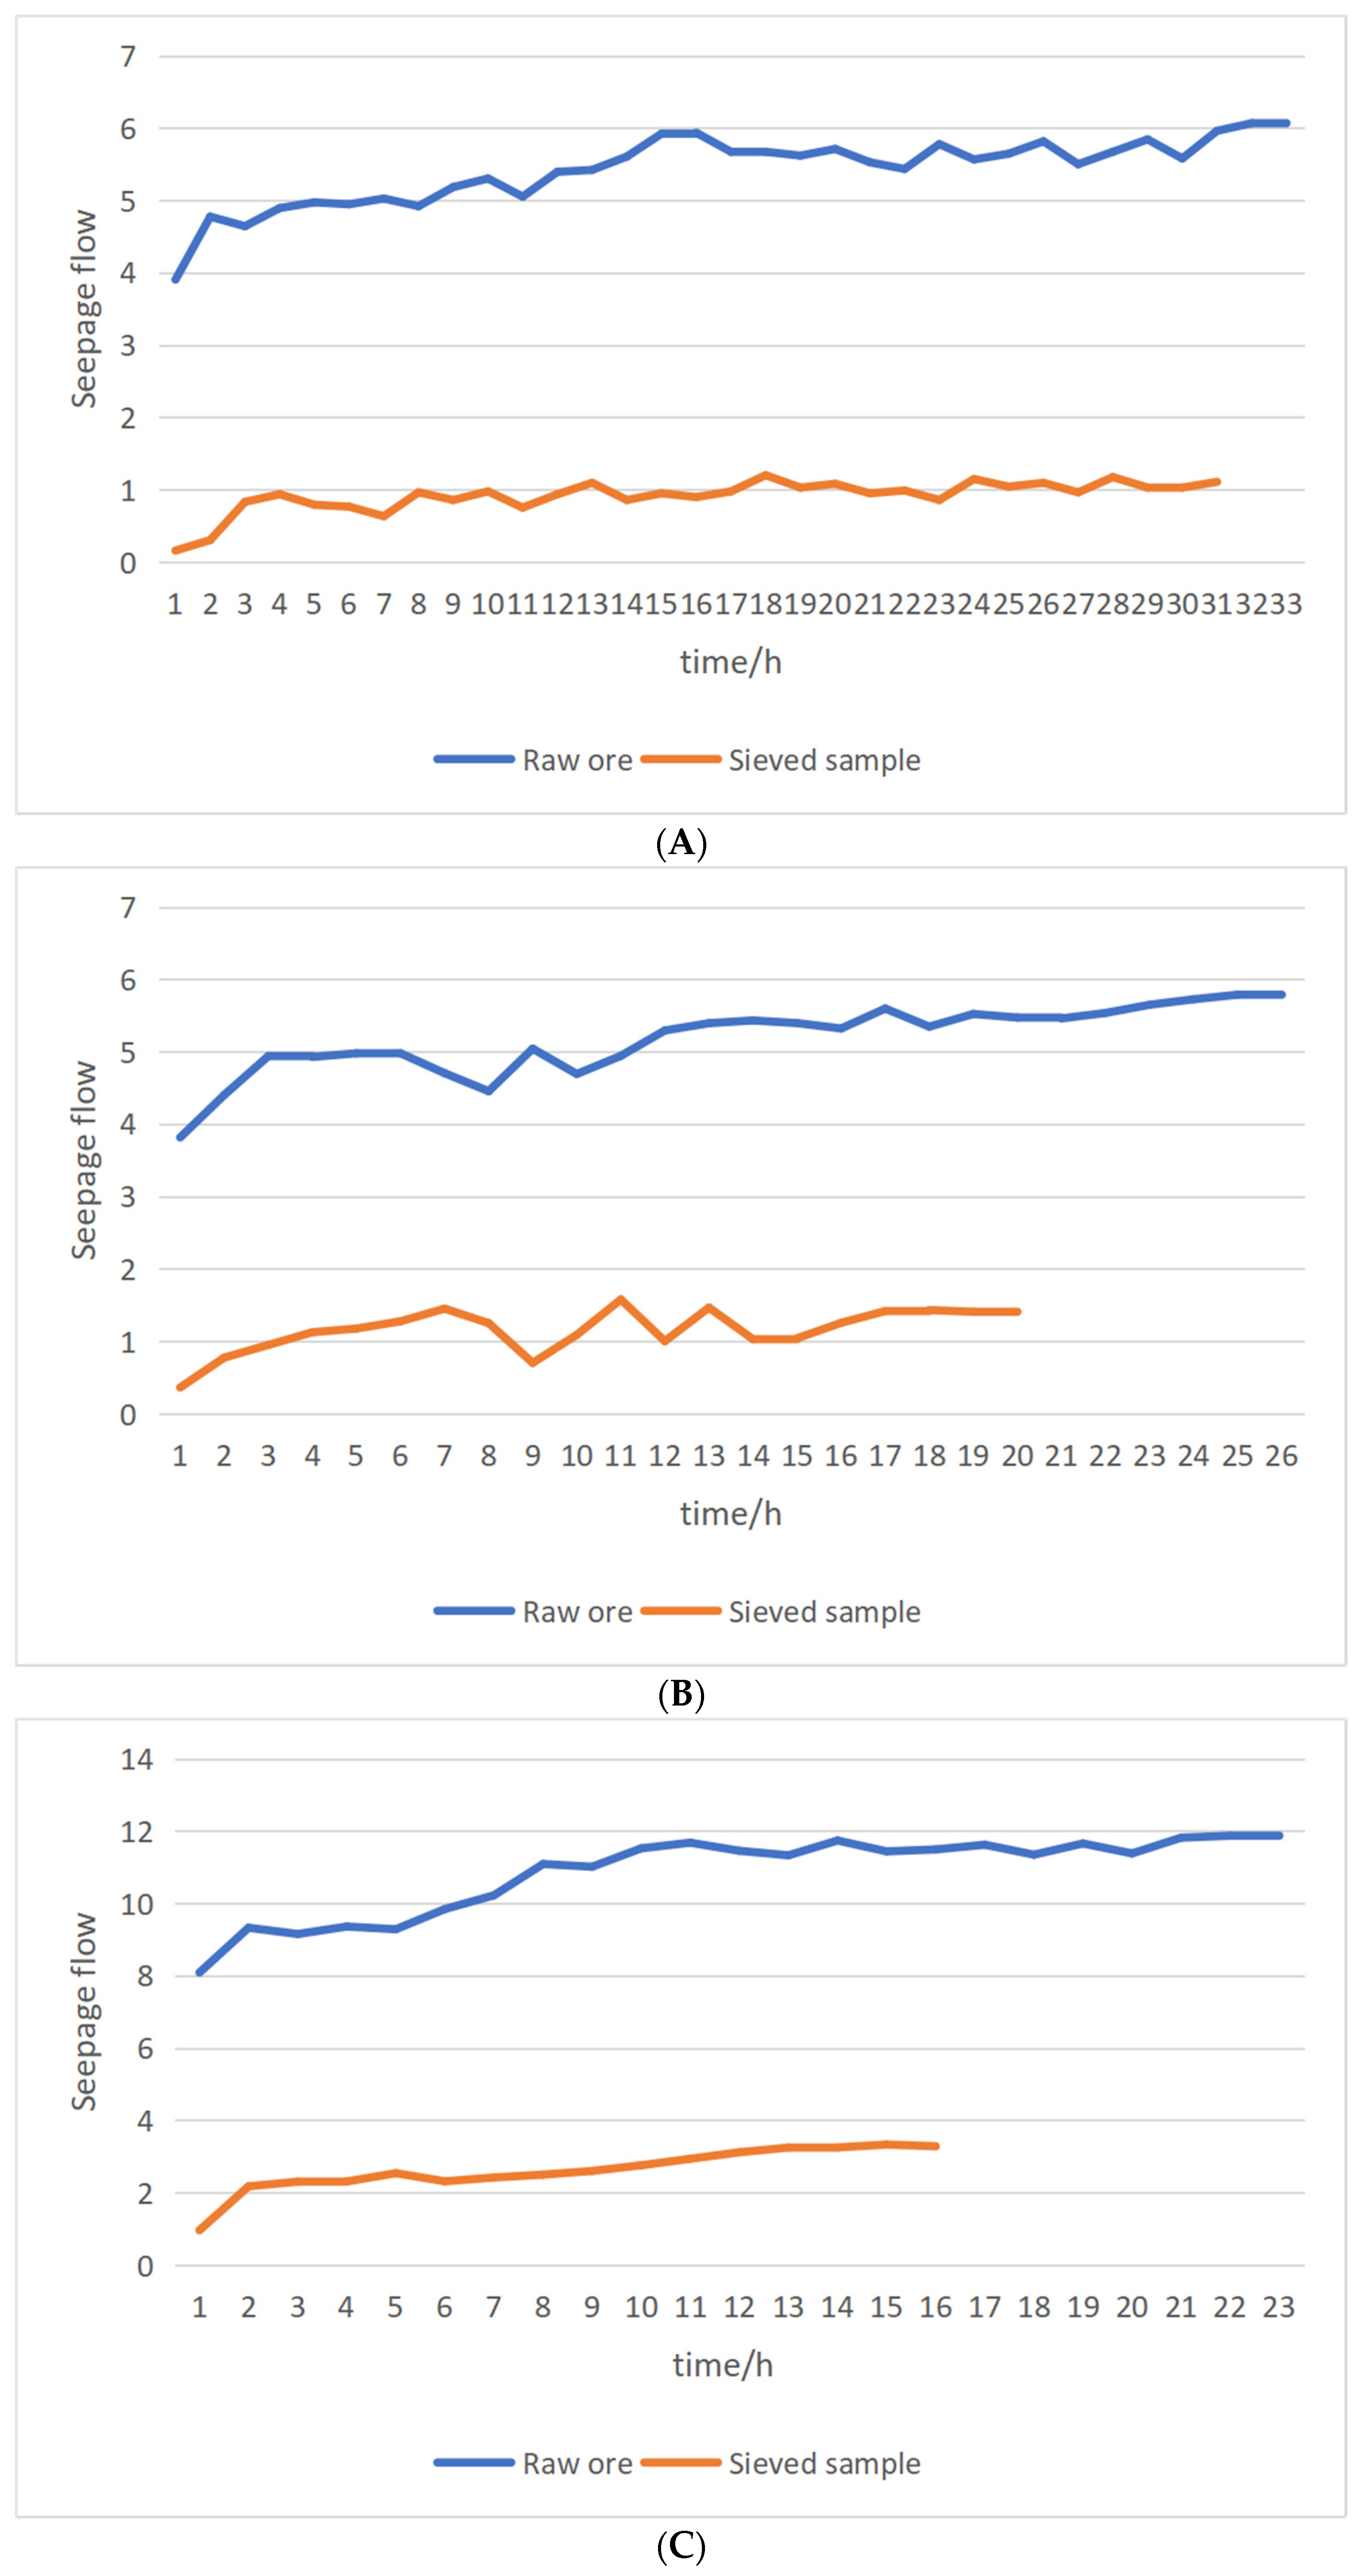
Figure 7 shows the curve of flow of raw ore and the screened sample with time during the water injection stage. It can be seen that the trend of seepage flow of raw ore and the screened sample is basically the same when water is injected. The trend can be divided into three stages: fast rising stage, slow rising stage, and stable stage. Although the trend is the same, the stability time and flow change amplitude are different. Since this test studies the process of water and solution forming stable seepage in soil samples, the relationship between flow rate and time is used to reflect the change of flow field during the water injection stage [23]. It is assumed that if any two points j and j + 1 meet the condition of ( q j + 1 q j )/ q j < 1% within 24 h, then stable seepage has been formed in soil samples. The flow rate variation amplitude is defined as the difference between flow rate when the flow field is stable and the flow rate at initial time 11:
Δ q = q s q i
In Equation (9), q s and q i are flow when the flow field is stable and flow at initial time, respectively, in g/min.
The flow rate per minute measured in the test was plotted using the pole average method to obtain the flow rate versus time curve, and the above method was used to obtain Table 2. The data in Table 2 were analyzed from two aspects: stability time of flow field and flow change amplitude. As for stabilization time, it can be seen that when the hydraulic gradient was 1.25, the time needed for raw ore to reach seepage stability was 332 h, and the time needed for the screened sample to reach seepage stability was 311 h. The time needed for raw ore to reach seepage stability was about 20 h longer. When the hydraulic gradient was 2, the time needed for raw ore to reach seepage stability was 197.5 h, and the time needed for the screened sample to reach seepage stability was 121.5 h. The time needed for raw ore to reach seepage stability was about 50 h longer. When the hydraulic gradient was 3, the time needed for raw ore to reach seepage stability was 164 h, and the time needed for the screened sample to reach seepage stability was 92 h. The time needed for raw ore to reach seepage stability was about 70 h longer. With respect to the flow change range, it can be seen that the flow change range of raw ore was 2–4 times larger. The test data show that the soil sample grade has an important influence on its permeability coefficient. The greater the hydraulic gradient, the shorter the time needed to form a stable flow field. It took a longer time for raw ore to reach seepage stability.
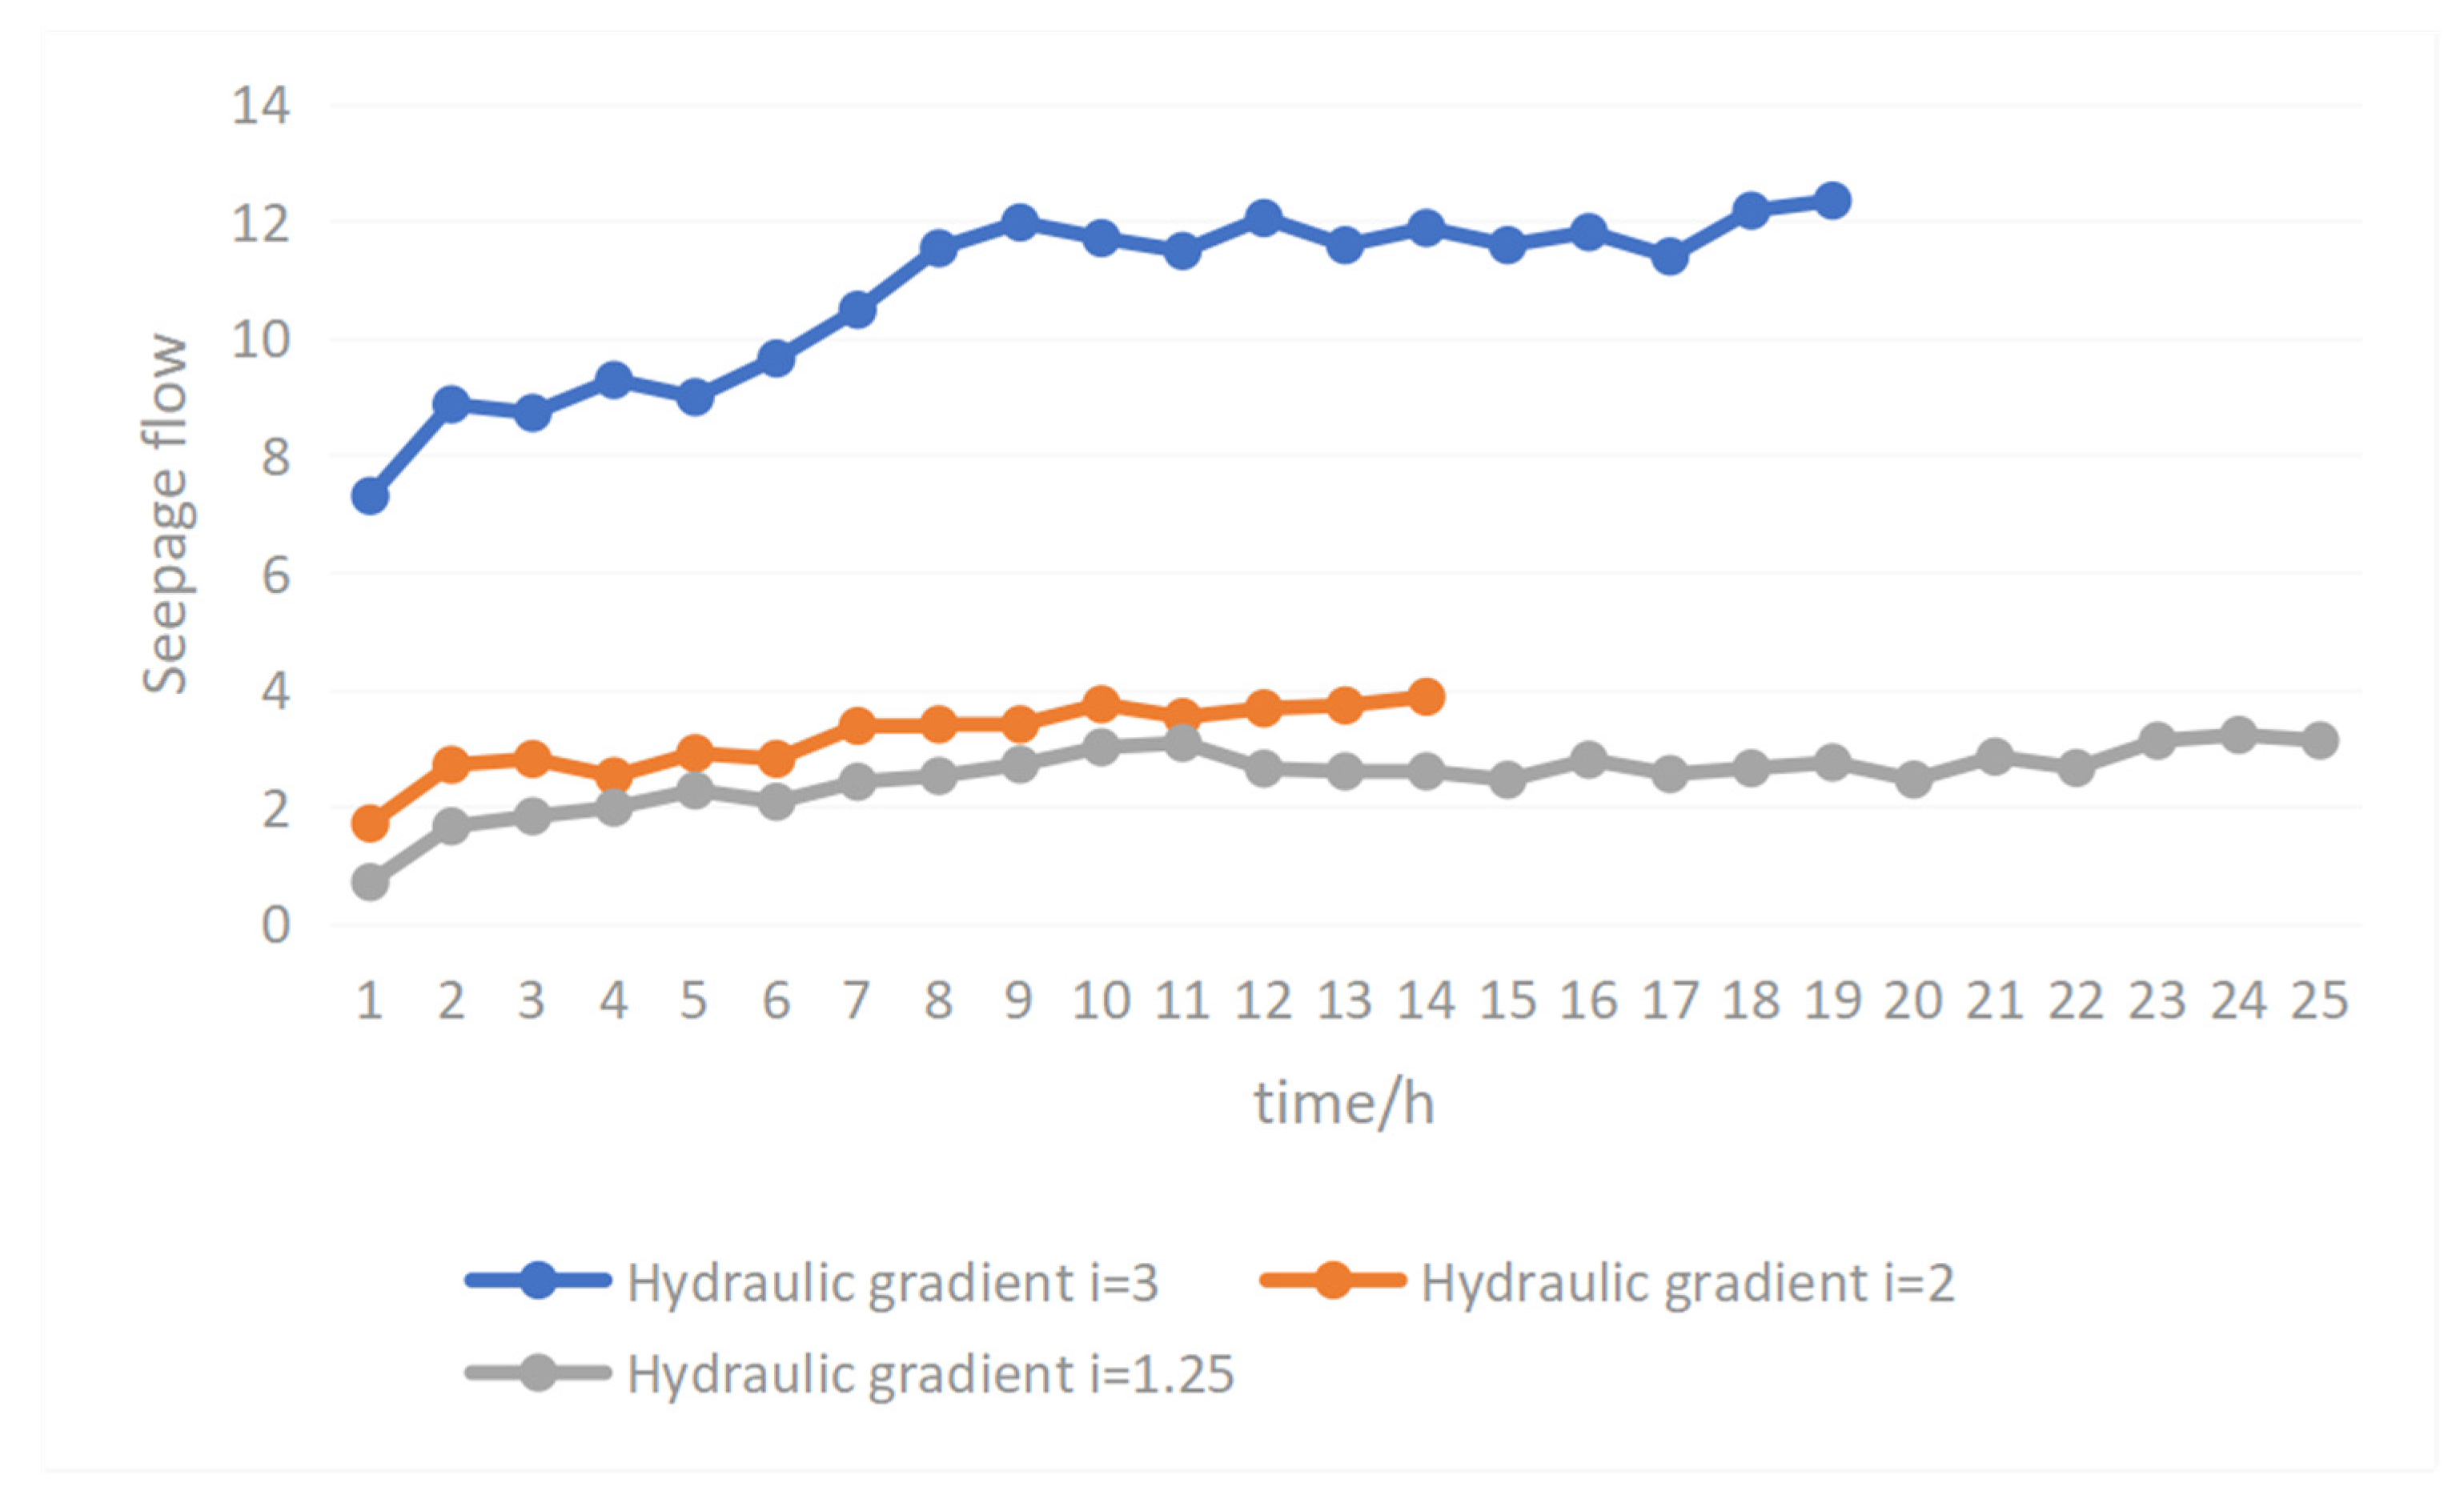
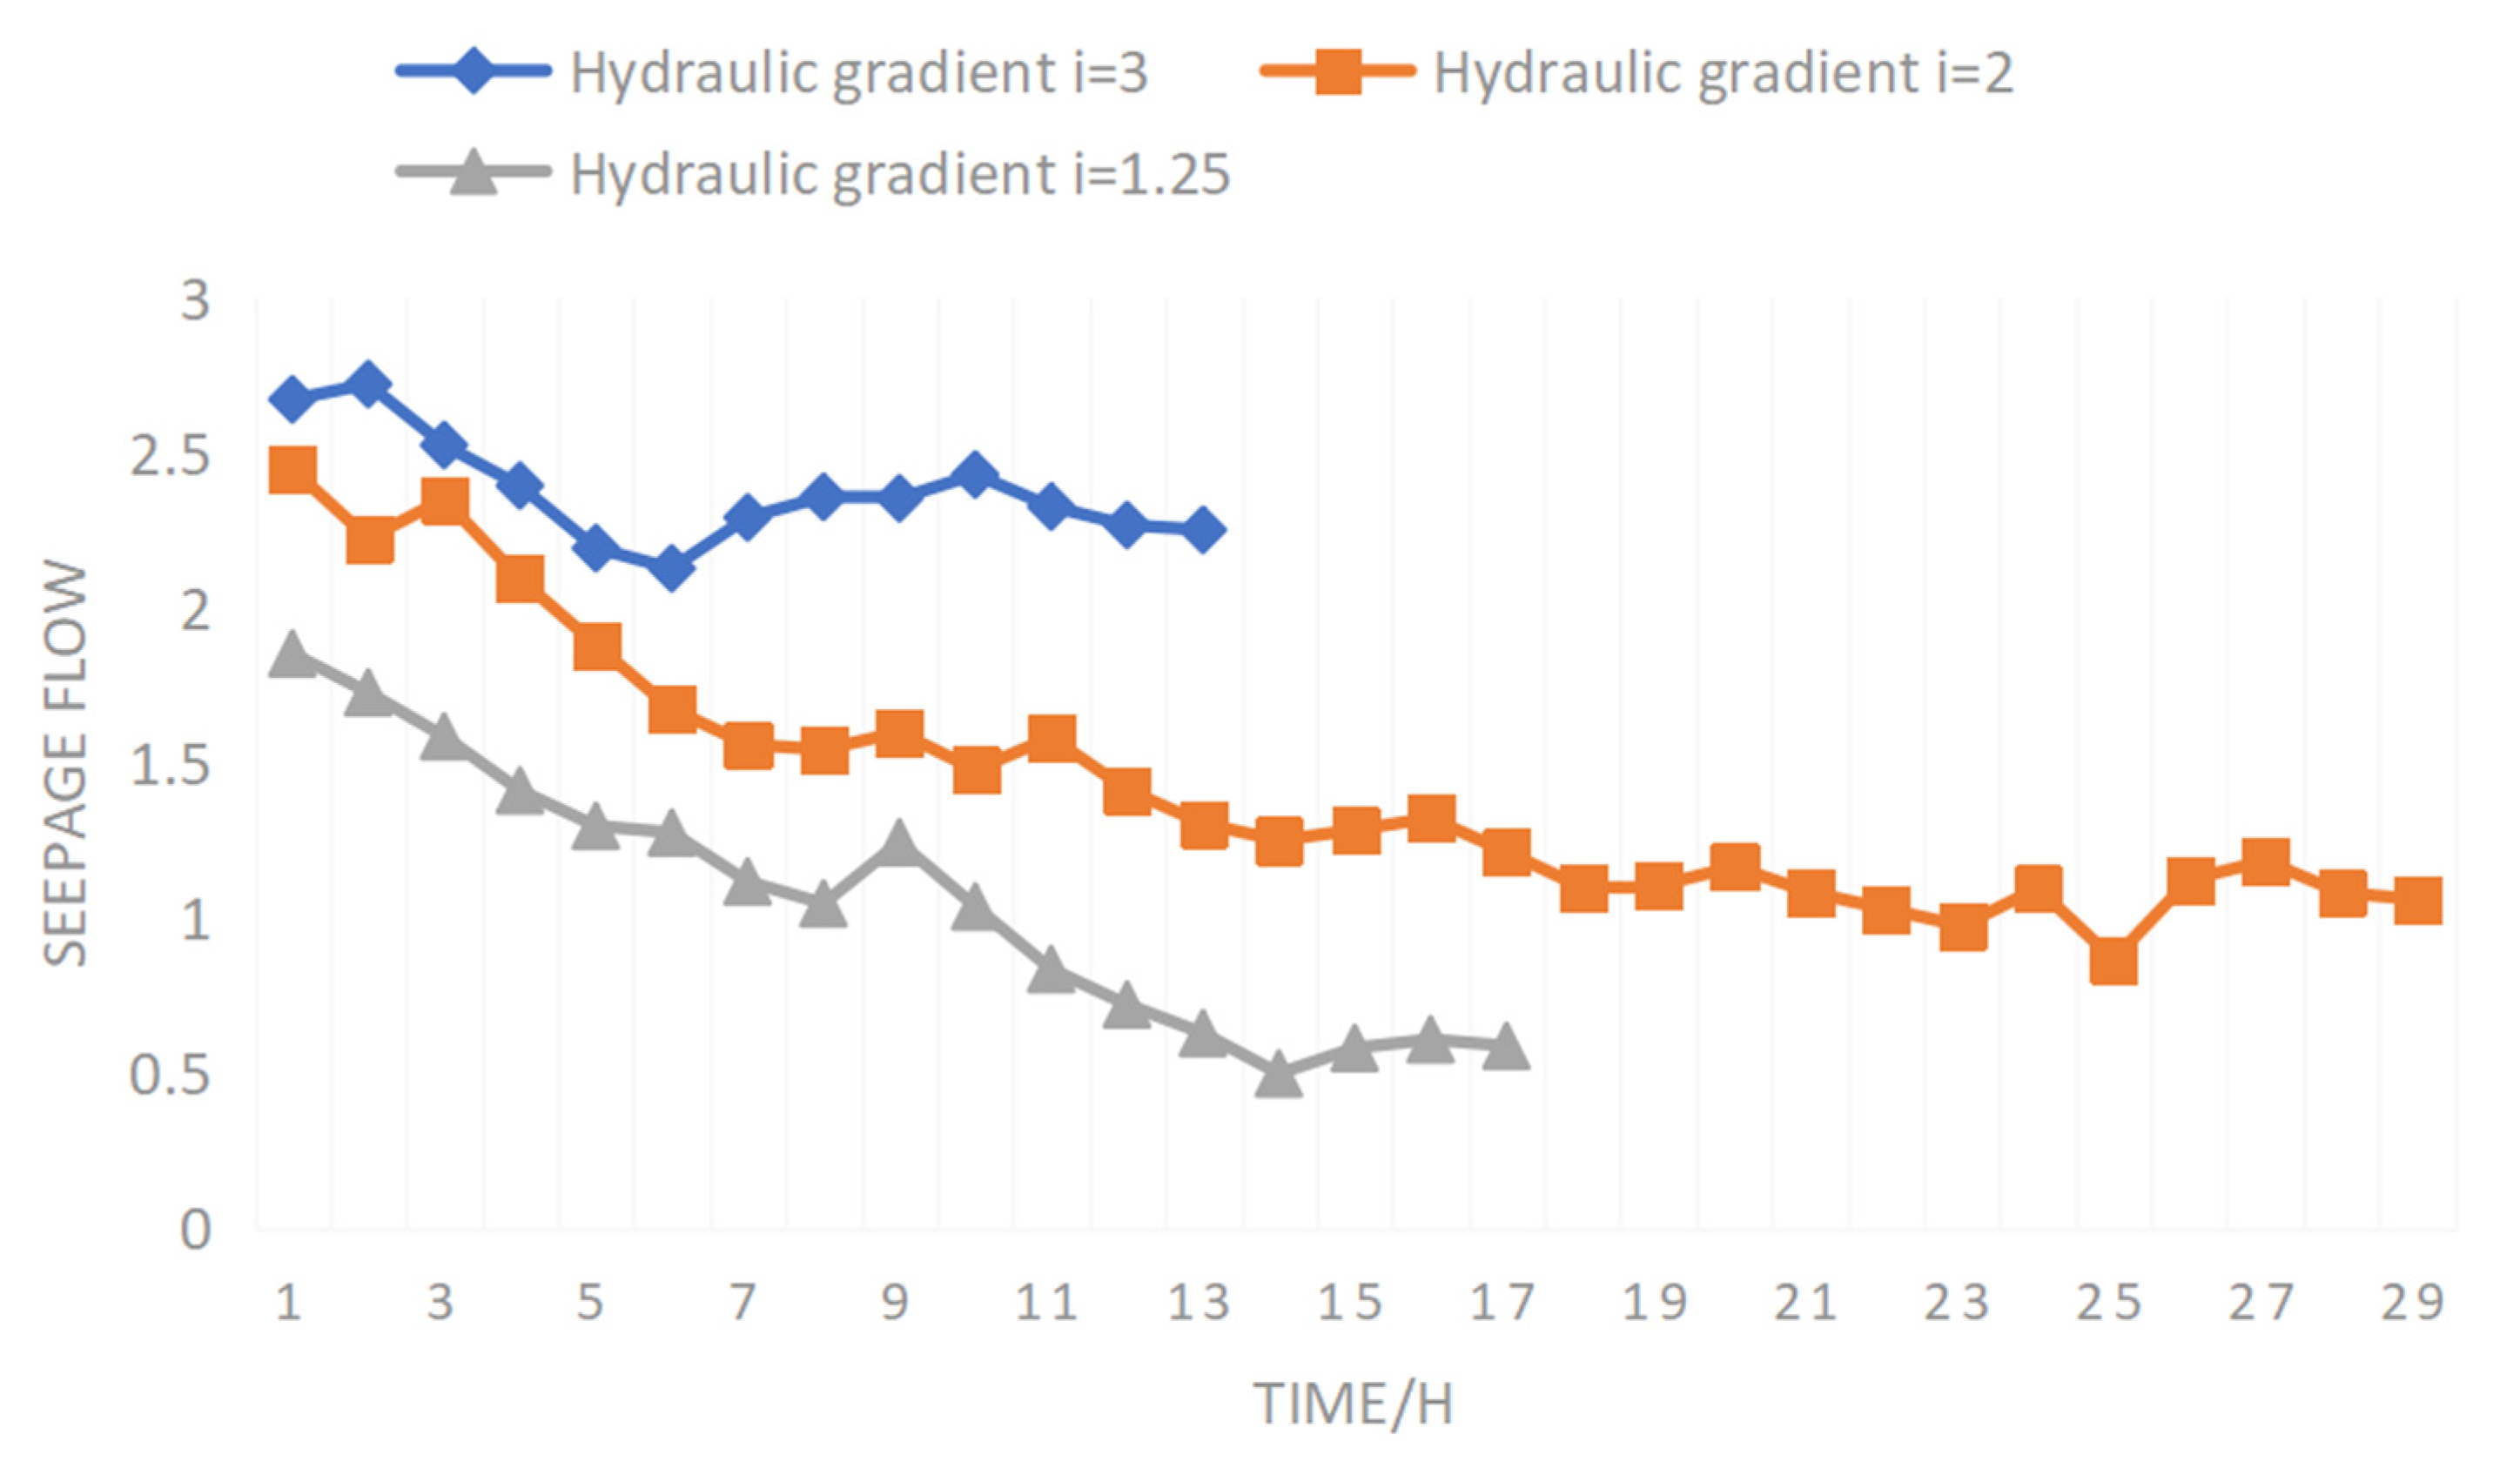
For the sieved sample with a particle size range of 0.075~0.09 mm, because the pore throat was small and the particle diameter was larger than the pore throat, micro-particles cannot migrate from pores and so there was no micro particle migration during the seepage process of water in the sieved sample. The influence of the hydraulic gradient on permeability was analyzed by comparing the variation in the seepage flow rate of the screened samples with time under different hydraulic gradient conditions. Figure 8 shows the change curve of seepage flow of the screened samples with different hydraulic gradients over time in the water injection stage.
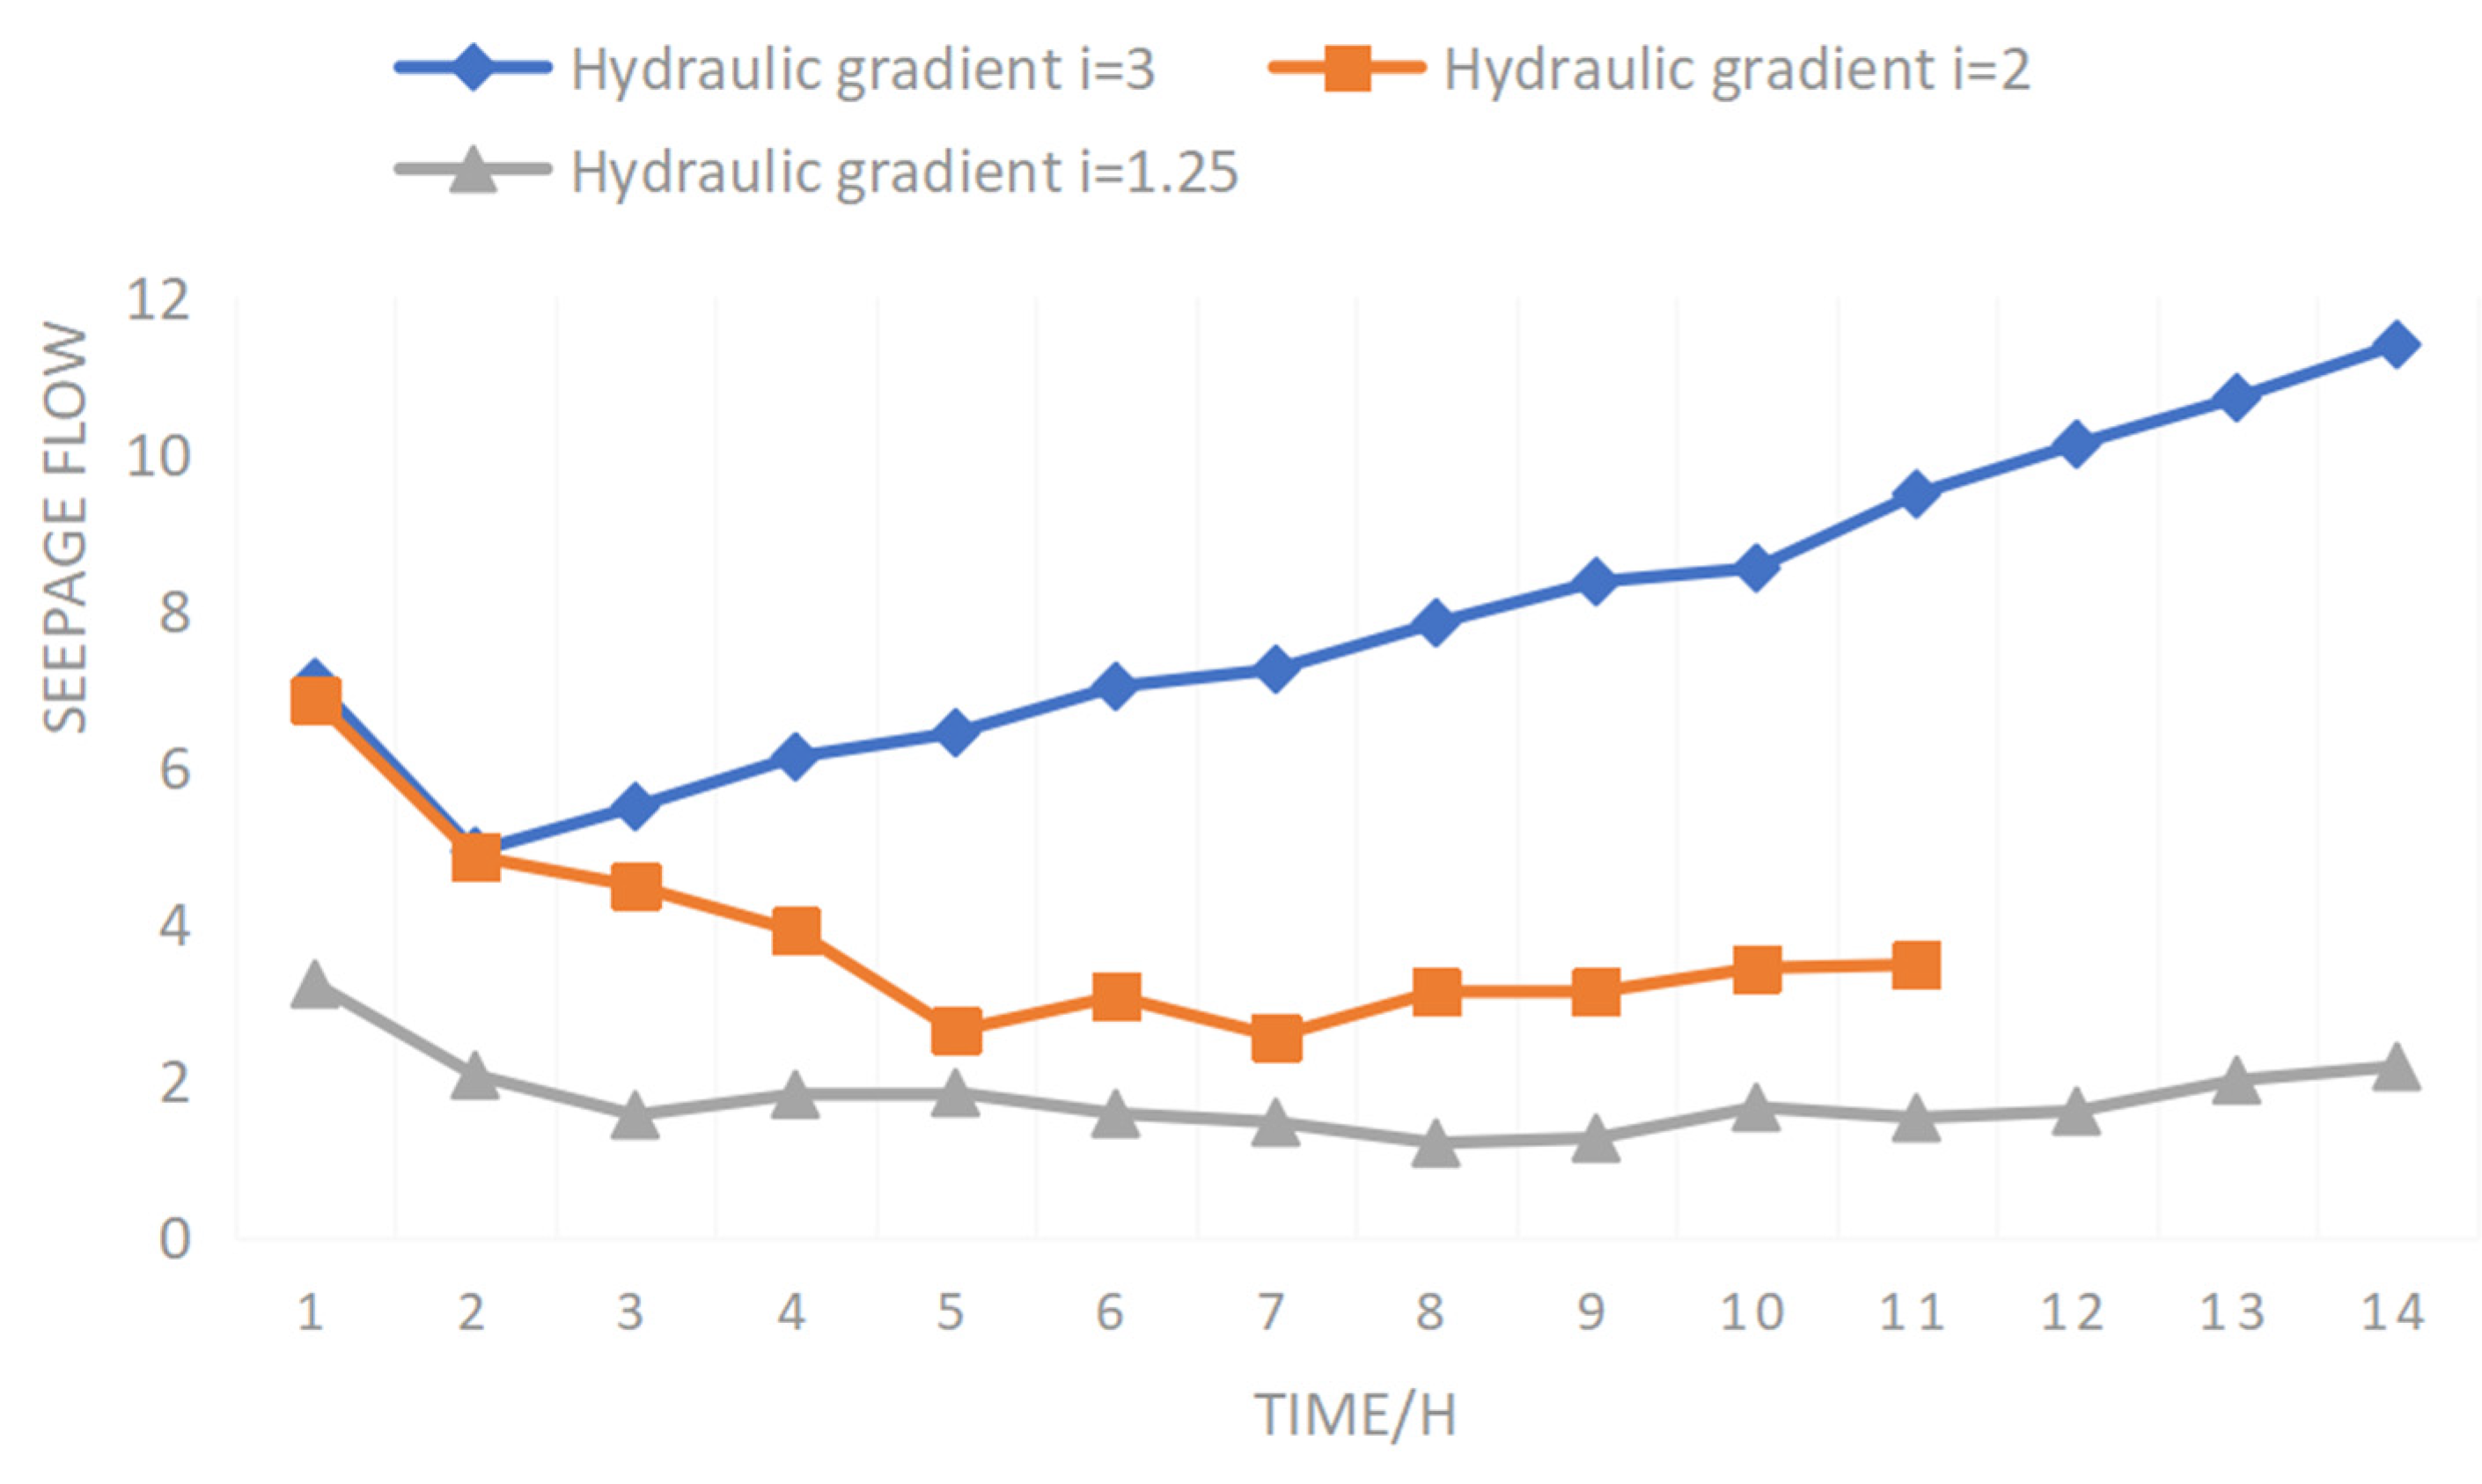
Figure 9 shows the change curve of raw ore seepage flow with time at different hydraulic gradients in the water injection stage. From the stability time analysis, it can be seen from Figure 9 that the smaller the hydraulic gradient, the longer the time needed to reach stability of seepage. The time needed for raw ore with a hydraulic gradient of 1.25 to reach seepage stability was about 130 h longer than that with a hydraulic gradient of 2, and about 170 h longer than that with a hydraulic gradient of 3. This is because the smaller the hydraulic gradient, the smaller the seepage velocity, and the slower the migration of micro-particles. The smaller seepage the flow, the more difficult it is to achieve stability, and so the stability time is longer. From the analysis of the increased range of flow, the change range of raw ore flow was 2.97 when the hydraulic gradient was 1.25, 3.03 when the hydraulic gradient was 2, and 7.93 when the hydraulic gradient was 3. With an increase in hydraulic gradient, the range of flow also increased. This is because the larger the hydraulic gradient, the greater the flow velocity, which can take away micro-particles with a larger particle size range, making migration of micro-particles more obvious. This has a greater impact on seepage flow, and so the flow rate increases.
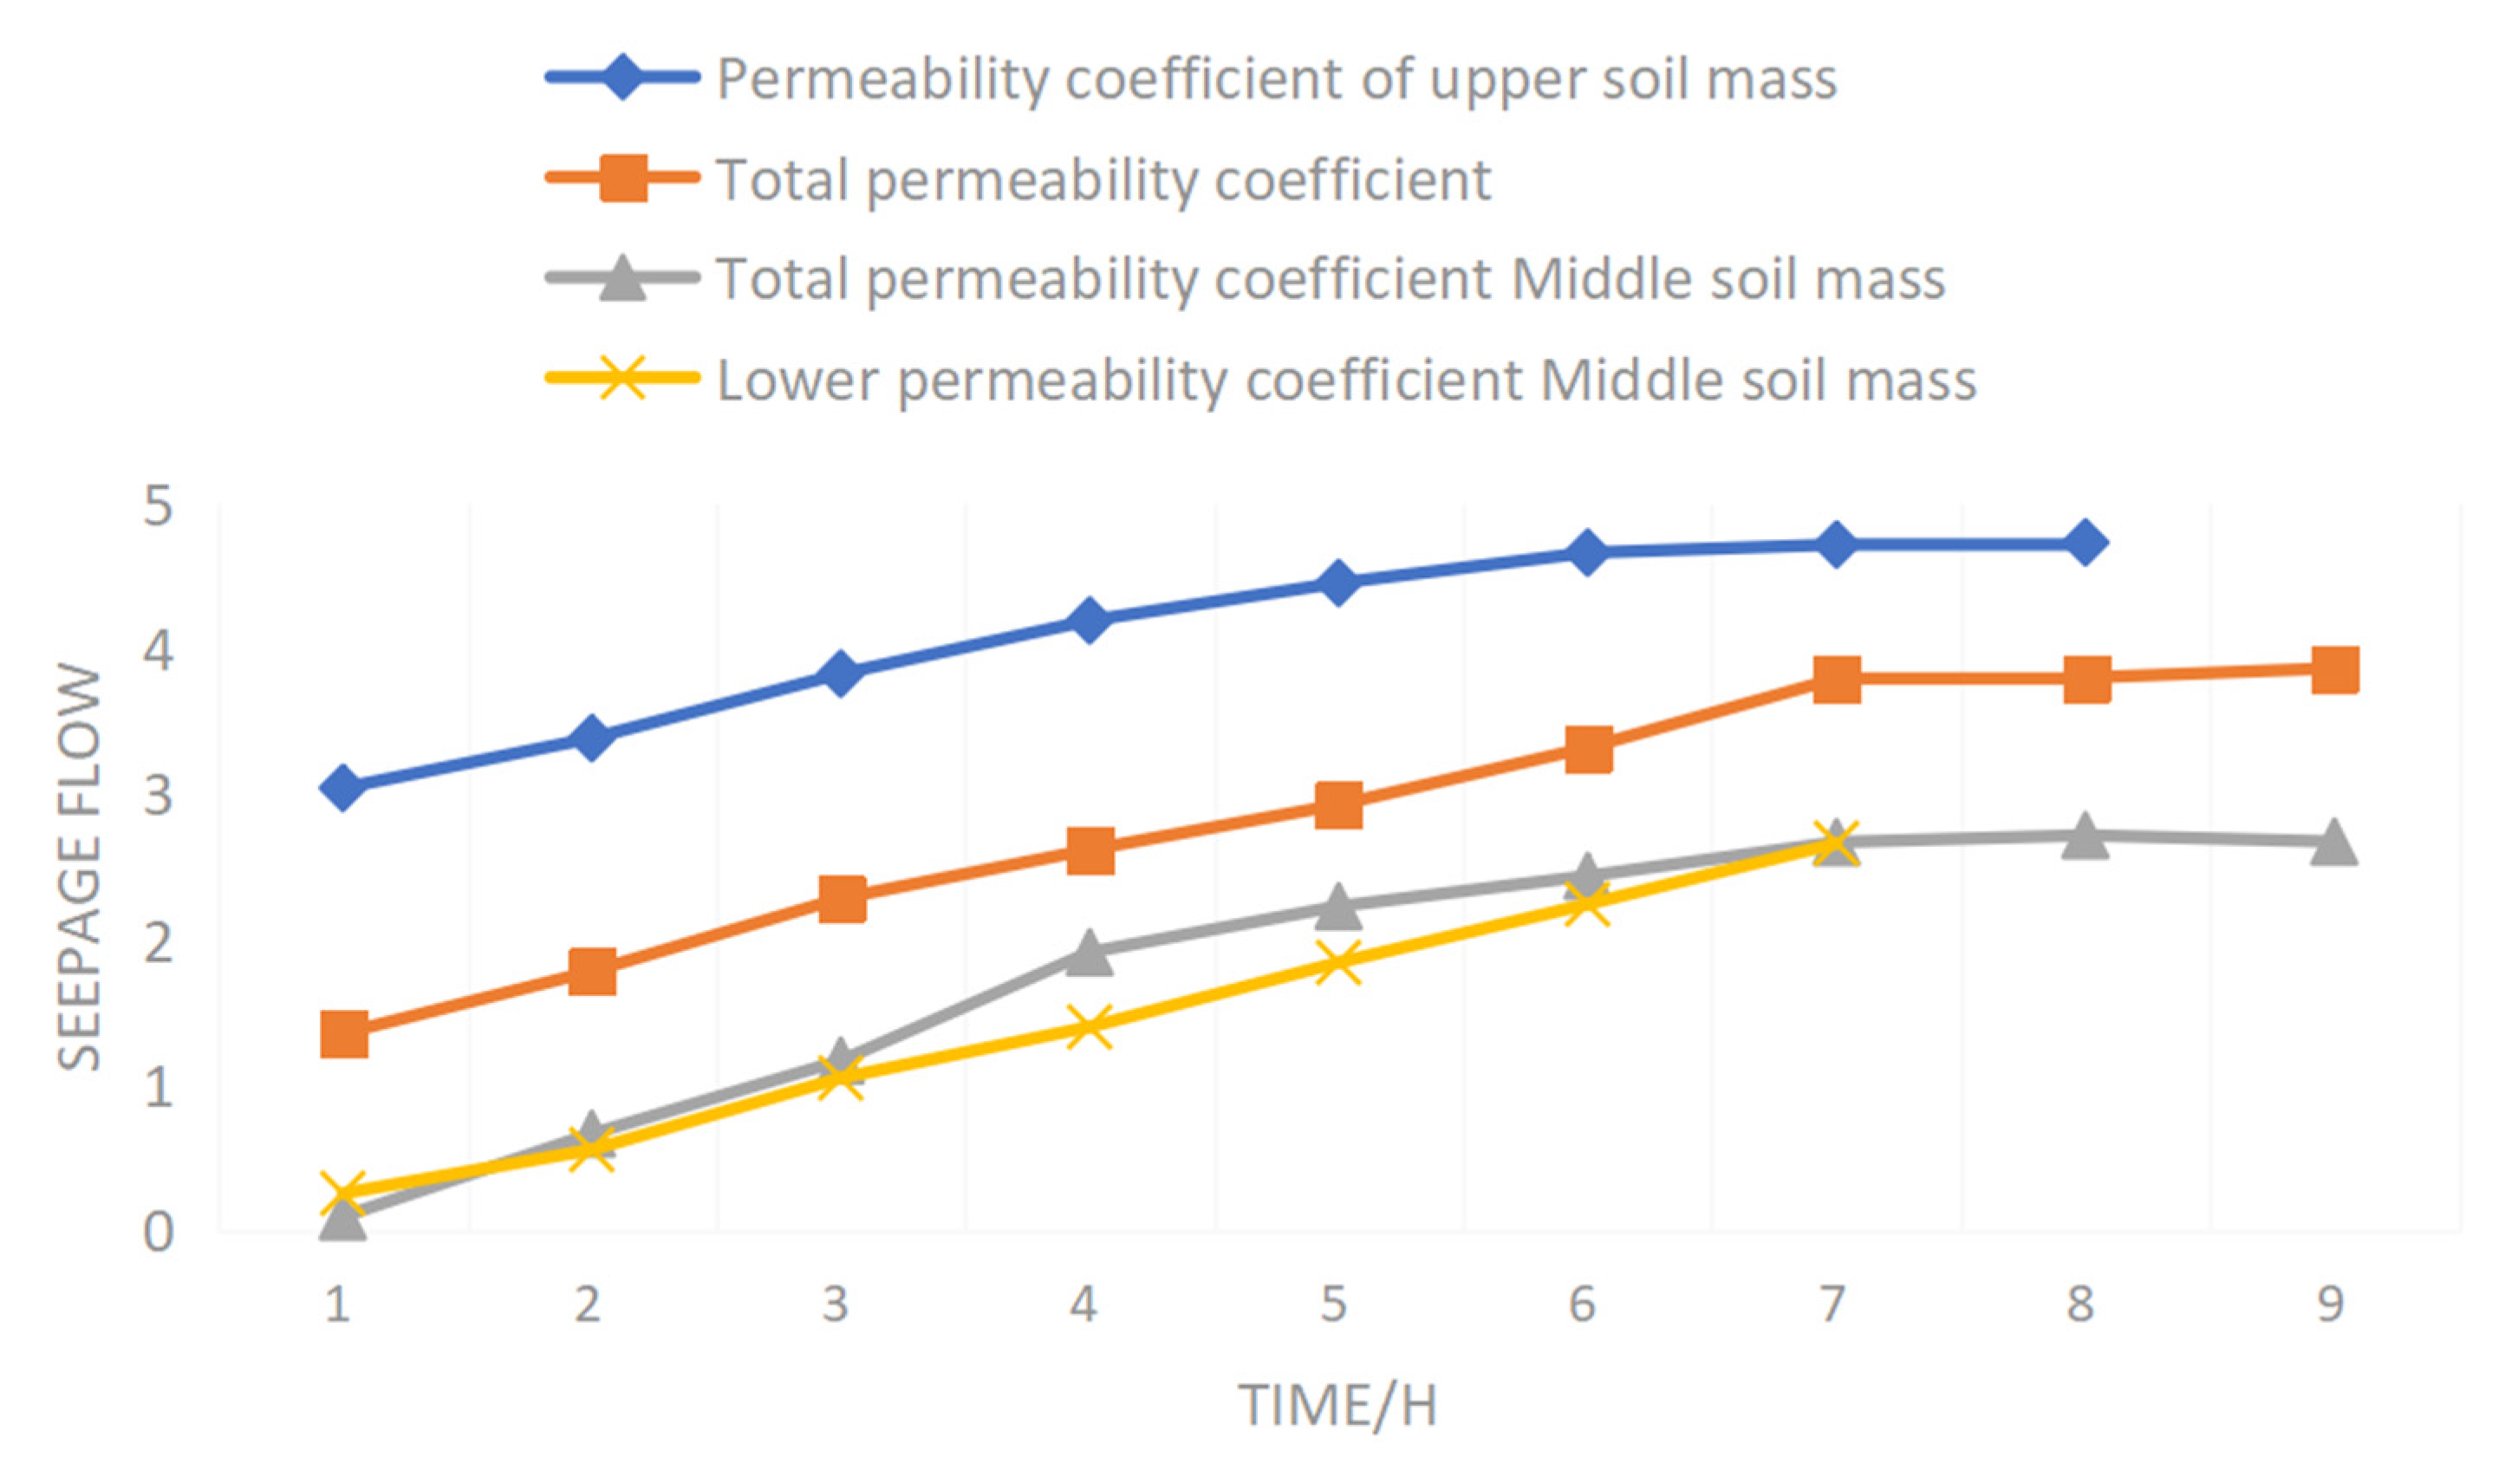
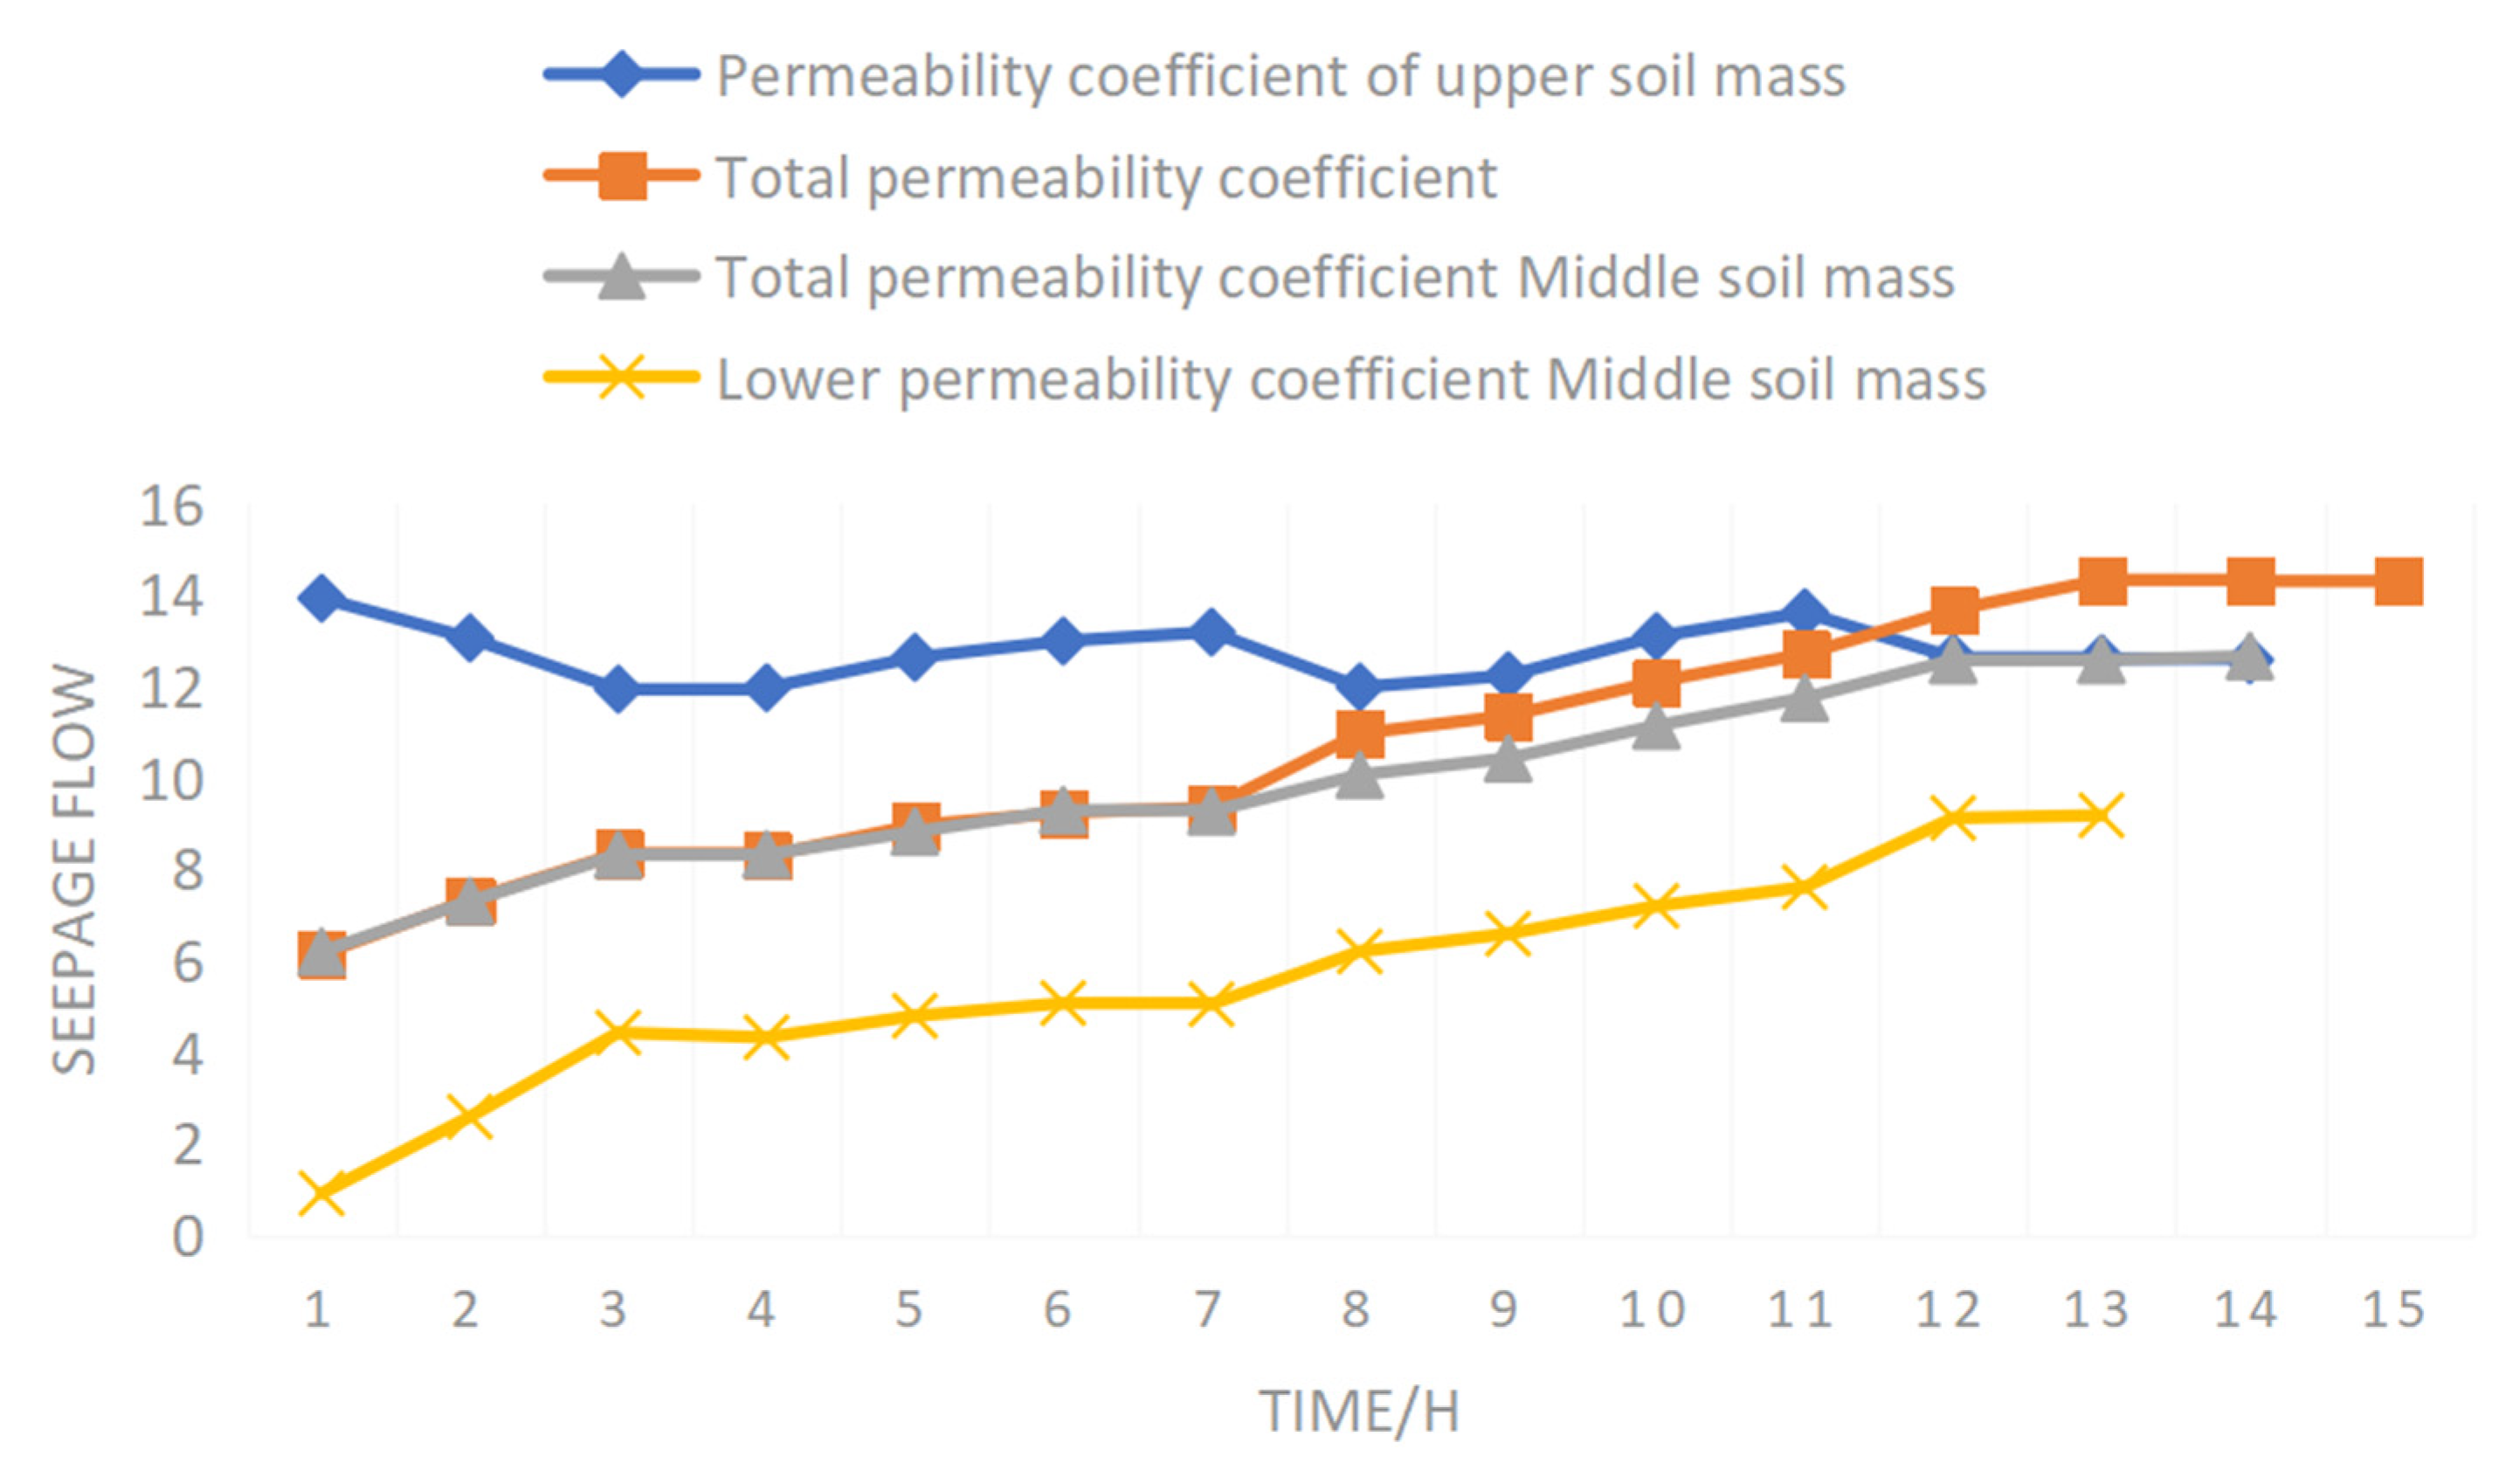
It can be seen from Figure 10 that the trend in permeability coefficient was consistent across the upper, middle, and lower parts of the soil mass. It increased gradually at first, and then tended to be stable. The permeability coefficient of the upper soil mass was greater than the middle and lower parts of the soil mass. The main reason is that there was no condition for the migration of micro-particles in the screened sample. There was no migration of micro-particles in any part of the sample, which had no impact on the change law of the permeability coefficient of each part. The trend of the permeability coefficient was consistent. The hydraulic gradient of the upper soil mass was larger than the middle and lower two parts, and the flow velocity was faster, so the permeability coefficient of the upper soil mass was greater than that of the middle and lower two parts. Figure 11 shows the change curve of the upper, middle and lower soil mass and total soil mass permeability coefficient with time when the hydraulic gradient was 1.25 during the clean water seepage process of raw ore.
It can be seen from Figure 11 that the trend in the permeability coefficient of the upper soil mass is obviously different from that of the middle and lower soil mass and total soil mass. The permeability coefficient of the upper soil mass increases rapidly to peak value at first, then decreases gradually, and finally tends to be stable. The permeability coefficient of the middle and lower soil mass and total soil mass increases rapidly at first, then increases slowly, and finally tends to be stable. The permeability coefficient of the upper soil mass is greater than the middle and lower parts of the soil mass, while the permeability coefficient of the middle soil mass is less than the lower soil mass. At the stage of flow stability, the permeability coefficient of the lower soil mass is greater.
The median particle size has an important influence on analyzing the migration characteristics of particles in porous media. As for median particle size, it can be seen from Figure 12 that the median particle size of soil mass before testing was 15.5 m, and the median particle size of the upper soil mass after testing was 20.4 μm. The median particle size of the middle soil mass after testing was 17.5 μm. After testing, the median particle size of the lower soil mass was 22.3 μm. It can be seen that the median particle size of each part of the soil mass after testing was larger. The median particle size of the lower soil mass was the largest, followed by the upper soil mass, and the median particle size of the middle soil mass was the smallest. The main reason is that, due to the short distance of micro-particle migration, micro-particle migration in the upper soil mass forms a micro-particle enrichment area in the upper soil mass, and only a small part migrates to middle soil mass, while the lower soil mass migrates to the bottom and seeps from the bottom due to micro-particle migration. The test data show that there is micro-particle migration in each part of the sample during testing, and micro-particle migration is more obvious in the lower soil mass, followed by the upper soil mass, and is less obvious in the middle soil mass.
Figure 13 shows the curve of permeability coefficients of the sieved samples according to solution stage with time. It can be seen from Figure 13 that, during the ore leaching process, the trend in the permeability coefficient of the screened sample can be divided into two stages: a slow reduction stage and a stable stage. The permeability coefficient of the screened sample decreased in a period of time after injection of sulfuric acid according to the solution. The main reason is that the permeability coefficient changed due to ion adsorption and exchange reaction. In sulfuric acid injection according to solution stage, rare earth particles have negative charges on the surface, which generates an electric field, and sulfuric acid is adsorbed according to root ions in the solution. The water film thickness increases, seepage pore diameter decreases, seepage path increases, and the permeability coefficient decreases. As root ions are more active than rare earth ions, when the adsorption amount of root ions reaches a certain value, an ion exchange reaction will occur, and trivalent rare earth ions will be resolved by exchange. The lower the ion valence, the greater the thickness of water film. When low valence rare earth ions are replaced by root ions, water film thickness will continue to increase, making the permeability coefficient continue to decrease. Because the particle size of screened samples is relatively uniform and similar, the change in permeability coefficient caused by micro-particle migration can be ignored, and so the permeability coefficient of the screened samples is gradually reduced.
Due to the relatively uniform and similar particle size of the screening samples, the pores in the soil body were relatively uniform. In the test, the screening sample pore ratio was 0.8, the soil body was dense, and the percolation pore size was small. At the same time, sulfuric acid infiltrated into the soil body, root ions were adsorbed in the bound water layer and exchanged with of rare earth ions, so that the thickness of the soil body bound water film increased and the percolation pore size decreased. At this time, there are two possible situations after the reduction in size of the bound water pore: one is that the solution can continue to flow after the reduction in size of the percolation pore, and the other is the reduction in the percolation pore size leads to the overlap of the bound water layer and blocks the pore.
For stability time, it can be seen from Table 3 that seepage stability time was 200 h when the hydraulic gradient was 1.25, 321.5 h when the hydraulic gradient was 2, and 149 h when the hydraulic gradient was 3. The data show that when the hydraulic gradient was 1.25 or 2, the time needed for seepage to reach stability increased with the increase in the hydraulic gradient. Ion adsorption and ion exchange reactions have obvious effects on the permeability coefficient. When the hydraulic gradient was 3, the seepage stability time decreased. This is because when the hydraulic gradient was 1.25 or 2, the flow velocity was small, the seepage force was small, and water molecules at the edge of the combined water layer were mainly subject to electrostatic attraction without flowing, so the solution could only flow through the first pore. At low flow velocity, with an increase in hydraulic gradient, the ion adsorption and exchange reactions were more obvious, the water film was thicker, the permeability coefficient was smaller, and it was more difficult for seepage to achieve stability. Therefore, the larger the hydraulic gradient, the longer the seepage stability time. When the hydraulic gradient was 3, the seepage velocity was large and the seepage force played a large role. The water molecules at the edge of the combined water layer flow under seepage force, so the solution could not only seep through the first type of pores, but also seep through some of the second types of pores. As the seepage pores of the sample section increased, the flow rate of the solution flowing through the sample section increased, the permeability coefficient increased, and the time needed for seepage to reach stability is short. Therefore, when the hydraulic gradient was 3, the seepage stability time was small. See Table 3.
Figure 14 shows the change curve of the permeability coefficient of raw ore with time according to solution stage of sulfuric acid injection. It can be seen from Figure 13 that during the ore leaching process, there is a difference between the permeability coefficient of raw ore and that of the screened samples. The permeability coefficient of raw ore can be divided into three stages: rapid reduction, slow rise, and steady seepage flow. When the hydraulic gradient was 3, the test had been conducted for 252 h, and the permeability coefficient of raw ore changed only in two stages: rapid reduction and continuous rise.
With respect to the change range of permeability coefficient, it can be seen from Table 4 that when the hydraulic gradient was 1.25, the change range of the permeability coefficient of raw ore was 2.22; when the hydraulic gradient was 2, the change range of the permeability coefficient of raw ore was 0.75; when the hydraulic gradient was 3, it was not stable within 252 h. The data show that with an increase in the hydraulic gradient, the change range of permeability coefficient decreased. When the hydraulic gradient was 3, seepage did not reach stability within 252 h, and the permeability coefficient increased. This is because with an increase in the hydraulic gradient, the seepage flow rate increased, migration capacity of micro-particles increased, and it was difficult for the micro-particle enrichment area to migrate due to the reduction in pore diameter. However, micro-particles at the bottom of the sample rushed out from the bottom of the sample under the action of dynamic water pressure, which increased the permeability coefficient. The increased permeability coefficient counteracted the reduction in permeability coefficient due to part of the ion adsorption and ion exchange reactions, and the change range of the permeability coefficient decreased. When the hydraulic gradient was 3, due to large seepage velocity, micro-particles with larger particle size range could be taken away, which made migration of micro-particles more obvious. The micro-particles with larger particle size continuously rushed out from the bottom of the sample, making the permeability coefficient always increase, and the sample did not become stable within 252 h.
See Table 5 for changes in stability time and permeability coefficient of flow field of raw ore and screened sample injected with sulfuric acid according to solution stage under different hydraulic gradients. Comparing seepage stability time of the screened sample with that of raw ore, it can be seen that when the hydraulic gradient was 1.25, the time needed for raw ore to reach seepage stability was 268 h, the time needed for the screened sample to reach seepage stability was 200 h, and the time needed for raw ore to reach seepage stability was about 70 h longer than the screened sample. When the hydraulic gradient was 2, the time needed for raw ore to reach flow field stability was 340.5 h, and the time needed for the screened sample to reach seepage stability was 321.5 h. The time needed for raw ore to reach seepage stability was about 20 h longer. When the hydraulic gradient was 3, raw ore did not become stable within 252 h, and the time needed for the screened sample to reach seepage stability was 149 h. The test data show that under different hydraulic gradient conditions, the time needed for raw ore to reach seepage stability was longer. This is because raw ore soil mass is uneven, and there are micro-particle enrichment areas and micro-particle loss areas. After the sulfuric acid solution was injected, the amount of root ions adsorbed in different areas is different, the rate of the ion exchange reaction is different, and the change speed of the permeability coefficient in different areas is different, so it is more difficult to achieve stability, that is, flow field stability time is longer.

4. Discussion

Ionic rare earth ore is an important strategic mineral resource that adsorbs on the surface of clay minerals such as erosite, illite, and kaolinite in the form of hydrated ions or hydroxyl hydrated ions and can exist stably [24]. Its complete allotment, low radioactivity ratio, high comprehensive utilization value, and use in the high-tech industry with a shortage of medium and heavy rare earth elements, mean it has now become the focus of widespread attention at home and abroad, and is now classified as a strategic key metal resource of restricted mining and protection type in China [25].
Ionic rare earth ores currently use the in situ leaching process, where ion exchange between the ore surface and leaching agent occurs and is accompanied by the breaking and regeneration of hydrogen bonds [26,27]. However, numerous studies have shown that ionic rare earth ores are prone to transport, stripping, and migration precipitation of microfine particles in the in situ leaching process [28,29]. The leaching process is complicated by the hydration mechanism between the leaching agent and the ore surface, and the inter-particle bridge bond is prone to breakage due to the presence of multiple forces and dispersion in the ion adsorption and exchange process [30,31], resulting in the migration and rearrangement of microfine particles. In the pore throat, the clogging phenomenon is produced by precipitation at the pore throat. As a result, the permeability and pore structure of the ore body are changed to some extent, which affects the leaching efficiency of rare earths. Therefore, it is important to carry out research on the migration law and optimal regulation of microfine particles in the ionic rare earth ore leaching process.
In this paper, we conducted percolation tests of water on rare earth ore samples and column leaching tests of sulfuric acid solution on ionic rare earth ore and sieved rare earth ore samples with particle size ranging from 0.075 mm to 0.09 mm. After water injection and stabilization, the sulfuric acid solution was injected. Based on the theory of Darcy’s law, the variation of permeability coefficient with time during the seepage process was studied, with the aim of providing some data references for the slope stability and rare earth mining process in rare earth mining. Meanwhile, based on the electric double layer theory, the mechanism and law of microparticle migration are explained theoretically, and the influence of ion adsorption and exchange reactions on permeability during the ore leaching process and its law are explained [32,33].

5. Conclusions

The migration of microfine particles in ionic rare earth ores is an important factor affecting leaching efficiency. The migration and rearrangement of microfine particles in the ore body under the action of various external forces and their precipitation at the pore throat produce blockages, and thus the permeability and pore structure of the ore body also change to some extent, which affects the leaching efficiency of rare earths. (1) The migration of particles leads to an increase in the stabilization time of seepage and the magnitude of seepage variation. With the increase in hydraulic gradient, the flow field stabilization time shortens and the amplitude of flow variation increases; the particle size range of migrating particles is from 0 to 29.3 μm; the migration distance of particles in the upper soil is shorter, and the particle enrichment zone is formed in this part. Under the action of dynamic water pressure, the lower soil particles were washed out of the bottom of the specimen, while the migration of central soil particles was not obvious. (2) Ion adsorption and ion exchange reactions reduce the permeability coefficient, and particle migration may lead to an increase or decrease in the permeability coefficient. These two effects exist simultaneously: when the hydraulic gradient is small, the main reason for the change in infiltration coefficient is the ion adsorption and ion exchange reactions; when the hydraulic gradient increases, the effect of particle transport on the change in infiltration coefficient increases.

Author Contributions

Y.D. (Yunchuan Deng), Y.W. and H.Y. was involved in conceptualization; S.K., Y.D. (Yang Deng) and J.Y. was involved in data curation; Y.D. (Yunchuan Deng) was involved in formal analysis; H.Y. and Y.W. were contributed to funding acquisition; Y.D. (Yunchuan Deng) was involved in proiect administration; S.K. was involved in supervision; Y.D. (Yunchuan Deng) was involved in writing-original draft. All authors have read and agreed to the published version of the manuscript.

Funding

This work was supported by the Key Research Program of the Chinese Academy of Sciences (No. ZDRW-CN-2021-3) and the Research Projects of Ganjiang Innovation Academy, Chinese Academy of Sciences (E055ZA01).

Institutional Review Board Statement

Not applicable.

Informed Consent Statement

Not applicable.

Data Availability Statement

The experimental data used to support the findings of this study are available from the corresponding author upon request.

Conflicts of Interest

The authors declared that they have no conflicts of interest regarding this work.

References

  1. Pereao, O.; Bode-Aluko, C.; Fatoba, O.; Laatikainen, K.; Petrik, L. Rare earth elements removal techniques from water/wastewater: A review. Desalin. Water Treat 2018, 130, 71–86. [Google Scholar] [CrossRef] [Green Version]
  2. Zhang, Y.; Zhang, B.; Yang, S.; Zhong, Z.; Zhou, H.; Luo, X. Enhancing the leaching effect of an ion-absorbed rare earth ore by ameliorating the seepage effect with sodium dodecyl sulfate surfactant. Int. J. Min. Sci. Technol. 2021, 31, 995–1002. [Google Scholar] [CrossRef]
  3. Yan, H.; Liang, T.; Liu, Q.; Qiu, T.; Ai, G. Compound leaching behavior and regularity of ionic rare earth ore. Powder Technol. 2018, 333, 106–114. [Google Scholar] [CrossRef]
  4. Long, P.; Wang, G.; Zhang, C.; Yang, Y.; Cao, X.; Shi, Z. Kinetics model for leaching of ion-adsorption type rare earth ores. J. Rare Earths 2020, 38, 1354–1360. [Google Scholar] [CrossRef]
  5. Yang, L.; Li, C.; Wang, D.; Li, F.; Liu, Y.; Zhou, X.; Liu, M.; Wang, X.; Li, Y. Leaching ion adsorption rare earth by aluminum sulfate for increasing efficiency and lowering the environmental impact. J. Rare Earths 2019, 37, 429–436. [Google Scholar] [CrossRef]
  6. Long, P.; Wang, G.-S.; Tian, J.; Hu, S.-L.; Luo, S.-H. Simulation of one-dimensional column leaching of weathered crust elution-deposited rare earth ore. Trans. Nonferrous Met. Soc. China 2019, 29, 625–633. [Google Scholar] [CrossRef]
  7. Qiu, T.; Yan, H.; Li, J.; Liu, Q.; Ai, G. Response surface method for optimization of leaching of a low-grade ionic rare earth ore. Powder Technol. 2018, 330, 330–338. [Google Scholar] [CrossRef]
  8. Luo, X.; Zhang, Y.; Zhou, H.; He, K.; Zhang, B.; Zhang, D.; Xiao, W. Pore structure characterization and seepage analysis of ionic rare earth orebodies based on computed tomography images. Int. J. Min. Sci. Technol. 2022, 32, 411–421. [Google Scholar] [CrossRef]
  9. Zhu, D.; Qiu, T.; Zhong, J.; Zeng, Q.; Fang, X. Molecular dynamics simulation of aluminum inhibited leaching during ion-adsorbed type rare earth ore leaching process. J. Rare Earths 2019, 37, 1334–1340. [Google Scholar] [CrossRef]
  10. Long, P.; Wang, G.S.; Zhang, S.; Hu, S.L.; Huang, Y. A mathematical model for column leaching of ion adsorption-type rare earth ores. Int. J. Miner. Metall. Mater. 2020, 27, 463–471. [Google Scholar] [CrossRef]
  11. Liu, Z.W.; Zhang, J.; Lu, C.B.; Wen, C.H.; Hu, F.J.; Yang, X.Y. Effect of rare earth ions on regular of nitride migration in soil. Ekoloji 2018, 27, 525–534. [Google Scholar]
  12. Zhou, F.; Liu, Q.; Feng, J.; Su, J.; Liu, X.; Chi, R. Role of initial moisture content on the leaching process of weathered crust elution-deposited rare earth ores. Sep. Purif. Technol. 2019, 217, 24–30. [Google Scholar] [CrossRef]
  13. Feng, J.; Zhou, F.; Chi, R.; Liu, X.; Xu, Y.; Liu, Q. Effect of a novel compound on leaching process of weathered crust elution-deposited rare earth ore. Miner. Eng. 2018, 129, 63–70. [Google Scholar] [CrossRef]
  14. Zhang, S.; Liu, X. Prediction of relations between leaching rate of rare earth mineral and the density of its mother liquid based on HGEP-PTS algorithm. Microelectron. Reliab. 2019, 93, 115–119. [Google Scholar] [CrossRef]
  15. Long, P.; Wang, G.; Zhang, C.; Huang, Y.; Luo, S. A two-parameter model for ion exchange process of ion-adsorption type rare earth ores. J. Rare Earths 2020, 38, 1251–1256. [Google Scholar] [CrossRef]
  16. Sun, R.; Zhang, Y.; Fan, K.; Shi, Y. Molecular simulation of adsorption properties of clay minerals in shale. J. Chem. Eng. 2015, 66, 2118–2122. [Google Scholar]
  17. Zhou, H.; Hu, J.; Zhang, Y.; Luo, X. Factors influencing chemical leaching of ionic rare earth ores and its regulation. Miner. Compr. Util. 2019, 146–151. [Google Scholar]
  18. Liang, Y.; Zhou, Y.; Lv, P. Experimental study on the influence of particle gradation on the migration of fine particles in the filter layer system. Water Resour. Hydropower Technol. 2020, 51, 152–158. [Google Scholar]
  19. Guo, M.; Wu, H.; Luo, Z. Biological and environmental analysis of ion adsorption rare earth ore Environmental analysis and management plan. Chin. J. Rare Earths 2021, 39, 218. [Google Scholar]
  20. Qin, L.; Wang, G.; Luo, Q.; Peng, C.; Qi, J.; Song, C. Calculation model of ionic rare earth ore leaching agent dosage. Chin. J. Nonferr. Met. 2019, 29, 1781. [Google Scholar]
  21. Peng, L.; Chen, B.; Zou, X.; Zou, Z.; Xiao, W.; Que, X. New scheme for rare earth allotment characteristics and type classification of ionic rare earth ores. Chin. J. Rare Earths 2021, 39, 624. [Google Scholar]
  22. Fuguo, L.; Guohua, G.; Li, H.; Yanfei, X.; Run, Y.; Kaizhong, L. Compound leaching of rare earth from the ion-adsorption type rare earth ore with magnesium sulfate and ascorbic acid. Hydrometallurgy 2018, 179, 25–35. [Google Scholar] [CrossRef]
  23. Bo, F.A.N.; Zhao, L.S.; Feng, Z.Y.; Liu, D.P.; Wei-Qiang, Y.I.N.; Long, Z.Q.; Huang, X.W. Leaching behaviors of calcium and magnesium in ion-adsorption rare earth tailings with magnesium sulfate. Trans. Nonferrous Met. Soc. China 2021, 31, 288–296. [Google Scholar]
  24. Wang, J.; Liang, Y.; Wang, G. The One-Dimensional Liquid Infiltration Characteristics of Ionized Rare Earth Based on Wireless Network Sensor Detection System. IEEE Sens. J. 2021, 21, 25362–25371. [Google Scholar] [CrossRef]
  25. Lai, F.; Huang, L.; Gao, G.; Yang, R.; Xiao, Y. Recovery of rare earths from ion-absorbed rare earths ore with MgSO4-ascorbic acid compound leaching agent. J. Rare Earths 2018, 36, 521–527. [Google Scholar] [CrossRef]
  26. Avdibegović, D.; Yagmurlu, B.; Dittrich, C.; Regadío, M.; Friedrich, B.; Binnemans, K. Combined multi-step precipitation and supported ionic liquid phase chromatography for the recovery of rare earths from leach solutions of bauxite residues. Hydrometallurgy 2018, 180, 229–235. [Google Scholar] [CrossRef]
  27. Brewer, A.; Dohnalkova, A.; Shutthanandan, V.; Kovarik, L.; Chang, E.; Sawvel, A.M.; Mason, H.E.; Reed, D.; Ye, C.; Hynes, W.F.; et al. Microbe encapsulation for selective rare-earth recovery from electronic waste leachates. Environ. Sci. Technol. 2019, 53, 13888–13897. [Google Scholar] [CrossRef]
  28. Hamza, M.F.; El-Aassy, I.E.; Guibal, E. Integrated treatment of tailing material for the selective recovery of uranium, rare earth elements and heavy metals. Miner. Eng. 2019, 133, 138–148. [Google Scholar] [CrossRef]
  29. Hanafi, M.M.; Azizi, P.; Akinbola, S.T.; Ismail, R.; Sahibin, A.R.; Wan Mohd Razi, I.; Ismail, A.F. Valorization of rare earth processing byproducts for agriculture usage. Sci. Rep. 2021, 11, 15234. [Google Scholar] [CrossRef]
  30. Tang, J.; Qiao, J.; Xue, Q.; Liu, F.; Fan, X.; Liu, S.; Huang, Y. Behavior and mechanism of different fraction lead leach with several typical sulfate lixiviants in the weathered crust elution-deposited rare earth ore. Environ. Sci. Pollut. Res. 2021, 28, 31885–31894. [Google Scholar] [CrossRef]
  31. Stoy, L.; Diaz, V.; Huang, C.H. Preferential recovery of rare-earth elements from coal fly ash using a recyclable ionic liquid. Environ. Sci. Technol. 2021, 55, 9209–9220. [Google Scholar] [CrossRef] [PubMed]
  32. Zhou, J.; Zhang, D.; Ren, W.; Zhang, W. Auto Color Correction of Underwater Images Utilizing Depth Information. IEEE Geosci. Remote Sens. Lett. 2022, 49, 1504805. [Google Scholar] [CrossRef]
  33. Wang, Z.; Zhang, Q.; Ong, Y.S.; Yao, S.; Liu, H.; Luo, J. Choose Appropriate Subproblems for Collaborative Modeling in Expensive Multiobjective Optimization. IEEE Trans. Cybern. 2023, 53, 483–496. [Google Scholar] [CrossRef] [PubMed]
Figure 1. Test stope of a rare earth mine in southern Jiangxi.
Sustainability 15 03867 g001
Figure 2. Landslide point of a rare earth mine in southern Jiangxi.
Sustainability 15 03867 g002
Figure 3. Grading curve of ionic rare earth.
Sustainability 15 03867 g003
Figure 4. Schematic diagram of test device.
Sustainability 15 03867 g004
Figure 5. Indoor column immersion test.
Sustainability 15 03867 g005
Figure 6. Research contents.
Sustainability 15 03867 g006
Figure 7. Time varying curve of flow of raw ore and screened sample in the water injection stage. (A) Hydraulic gradient i = 125, (B) Hydraulic gradient i = 2, (C) Hydraulic gradient i = 3.
Sustainability 15 03867 g007
Figure 8. Time varying curve of seepage flow of sieved samples with different hydraulic gradients during water injection.
Sustainability 15 03867 g008
Figure 9. Time varying curve of raw ore seepage flow.
Sustainability 15 03867 g009
Figure 10. Time varying curve of total permeability coefficient.
Sustainability 15 03867 g010
Figure 11. Time varying curve of total permeability coefficient of raw ore and upper, middle and lower permeability coefficients at water injection stage.
Sustainability 15 03867 g011
Figure 12. Particle size distribution curve of soil below 0.075 mm in each part of sample before and after test.
Sustainability 15 03867 g012
Figure 13. Curve of permeability coefficient of sieved samples in ammonium sulfate solution injection phase changing with time.
Sustainability 15 03867 g013
Figure 14. Curve of permeability coefficient of raw ore with time in ammonium sulfate solution injection stage.
Sustainability 15 03867 g014
Table 1. Physical indices of ionic rare earth.
Relative Density dsParticle Composition/%
>5 mm1~5 mm0.25~1 mm0.075~0.25 mm<0.075 mm
2.682.3%31.2%26.5%18.6%21.6%
Table 2. Stability time and flow change of raw ore and sieved sample in clean water injection stage.
Hydraulic GradientSample TypeStabilization Time/h Initial   Flow   q i /(10−1 g/min) Stable   Flow   q s /(10−1 g/min) Flow   Variation   Amplitude   Δ q /(10−1 g/min)
1.25Raw ore3323.36.052.99
Sieved sample3110.51.470.99
2Raw ore197.55.356.63.01
Sieved sample121.51.62.771.33
3Raw ore1645.3513.17.95
Sieved sample921.754.492.76
Table 3. Stability time and permeability coefficient of sieved samples at ammonium sulfate solution injection stage.
Hydraulic GradientStabilization Time/h Initial   Permeability   Coefficient   K i / 10 5 cm/s Stable   Permeability   Coefficient   K s / 10 5 cm/s Change   Amplitude   of   Permeability   Coefficient   Δ K / 10 5 cm/s
1.2520021.50.71
2321.52.91.870.85
31492.62.550.25
Table 4. Stabilization time and permeability coefficient of raw ore in ammonium sulfate solution injection stage.
Hydraulic GradientStabilization Time/h Initial   Permeability   Coefficient   K i /10−5 cm/s Stable   Permeability   Coefficient   K s /10−5 cm/s Change   Amplitude   of   Permeability   Coefficient   Δ K /10−5 cm/s
1.252688.886.82.22
2340.56.655.880.75
3No stability within 252 h8.63--
Note: - indicates that seepage stability is not reached.
Table 5. Stability time and permeability coefficient of raw ore and sieved sample in ammonium sulfate solution injection stage.
Hydraulic GradientSample TypeStabilization Time/h Initial   Flow   K i /(10−5 g/min) Stable   Flow   K s /(10−5 g/min) Flow   Variation   Amplitude   Δ K /(10−5 g/min)
1.25Raw ore2688.886.82.22
Sieved sample20021.80.75
2Raw ore340.56.655.880.75
Sieved sample321.52.91.860.81
3Raw oreNo stability within 252 h8.63--
Sieved sample1492.62.550.25
Note: - indicates that seepage stability is not reached.
Disclaimer/Publisher’s Note: The statements, opinions and data contained in all publications are solely those of the individual author(s) and contributor(s) and not of MDPI and/or the editor(s). MDPI and/or the editor(s) disclaim responsibility for any injury to people or property resulting from any ideas, methods, instructions or products referred to in the content.