Article

Effects of Different Land Use Types on Soil Surface Temperature in the Heihe River Basin

1
Key Laboratory for Aerosol-Cloud-Precipitation of China Meteorological Administration, Nanjing University of Information Science and Technology, Nanjing 210044, China
2
Precision Regional Earth Modeling and Information Center, Nanjing University of Information Science and Technology, Nanjing 210044, China
3
Nanjing Xinda Institute of Safety and Emergency Management, Nanjing 210044, China
*
Author to whom correspondence should be addressed.
Sustainability 2023, 15(4), 3859; https://doi.org/10.3390/su15043859
Submission received: 24 October 2022 / Revised: 8 February 2023 / Accepted: 8 February 2023 / Published: 20 February 2023
(This article belongs to the Special Issue Climate Change, Land Use Change and Water Resources)

Abstract

:
The micrometeorological elements, radiation budget, and surface energy distribution at four sites with land cover types of vegetable, orchard, maize, and desert in the Heihe River basin (HRB) from June 2012 to September 2012 are compared to investigate the differences in the land–atmosphere interaction between different surface types and the biophysical effects of land use and land cover change on surface temperature. The desert site has the highest soil surface temperature during both daytime and nighttime. The strongest cooling effects of maize, orchard, and vegetable are −20.43, −19.35, and −16.42 K, respectively, during daytime, and the average cooling effects are −1.38, −2.52, and −0.93 K, respectively, at nighttime. The differences in the surface cooling effects of the non-desert sites relative to the desert are attributed to the differences in albedo and incoming shortwave radiation, emissivity and incoming longwave radiation, sensible heat flux, latent heat flux, and soil surface heat flux, according to the direct decomposed temperature metric theory. The radiation terms have negative feedbacks on the cooling effects in the non-desert sites. Latent heat flux plays a key role in the differences in the surface temperature among the four sites during both daytime and nighttime, and the soil surface heat flux is also a main factor at night.

1. Introduction

Human activities affect more than 80% of the land surface on the earth [1]. Urbanization, industrialization, forest degradation, and land desertification have certain impacts on the local climate, ecosystem, and environmental process [2]. The Chinese government has launched several projects aimed at converting farmlands to forests and mitigating land desertification to improve the balance of the local ecosystem and the environment [3]. Land-use-land-cover change (LULCC) affects climate mainly through biochemical and biophysical effects [4,5,6,7,8,9]. The biochemical effects of LULCC are mainly reflected in its carbon sequestration potential, which depend on different conversion types of LULCC. For example, the reduction of carbon sinks caused by the conversion of forest to farmland is much higher than that from grassland to farmland [10]. In addition, LULCC can also affect the energy distribution and water cycle between the surface and the atmosphere through biophysical effects, that is, by influencing surface parameters such as surface albedo, evapotranspiration (ET), roughness, and leaf index, thereby affecting the regional and even global climate [11,12]. The biophysical effects on local climate can be much larger than the cooling effect resulted from the uptake of CO2 [13,14,15].
The biophysical effects of LULCC on temperature have been widely investigated in the past few decades. He et al. [16] analyzed temperature records from a grass–shrub transition zone in the Northern Chihuahuan Desert and showed that the nighttime air temperature observed in the shrubland is 2 K higher than in the grassland during winter. Climate model simulations have shown that the conversion of natural forests to croplands in the United States has a cooling effect and the cooling is greater for the daily maximum temperature than for the daily minimum temperature, resulting in a reduced diurnal temperature range [17]. Lee et al. [11] showed that deforestation generally warms the surface in tropical areas but cools it in boreal regions. Peng et al. [3] used satellite measurements of soil surface temperatures from planted forests and adjacent grasslands or croplands in China to understand how afforestation affects soil surface temperature. Their results showed that afforestation reduced the surface temperature by about 1.1 °C (±0.5 °C) in the daytime and increased the surface temperature by about 0.2 °C (±0.5 °C) in the nighttime.
Changes in albedo directly affect the amount of absorbed solar energy [9]. The albedo effect dominates the biophysical effects of deforestation in the boreal zone, especially during winter because of the snow cover [18,19,20]. In tropical regions, the change in ET dominates [19,21,22]. The changes in surface roughness also have important implications for the energy redistribution process [20,23,24,25,26]. Unlike the biochemical effects, the biophysical effects are dependent on regional climate conditions [12,27]. Although there are many related studies, the sign and magnitude of the exchange of surface energy and water vapor still remain largely uncertain [10].
The use of satellite data with high resolution, continuous observation time, and wide range coverage, combined with the “space-for-time approach,” is a common way to quantify the biophysical effects of LULCC [11,28]. However, the lack of sensible heat flux and soil surface heat flux measurements precludes a detailed investigation of the biophysical effects. Using sensitive experiments based on climate models is another method [9,29,30]. However, the approximation in the parameterization of the land surface processes in the climate models often cause great uncertainties in the sign, magnitude, and spatial distribution characteristics of the biophysical effects in the model output [12,31]. One method to solve this problem is to verify the model and parameterization schemes using the in situ observational data. Adjacent sites have similar background climate, therefore, the local differences of surface temperature and other surface properties between adjacent sites could be attributed to the land cover change [17,27,32,33]. In order to understand the impacts of LULCC on regional climate, it is very important to study the differences in surface temperature caused by the transformation of different land types [10,25,34,35,36] and then provide a reliable basis for improving the land surface parameterization scheme in climate models [37,38,39].
The Heihe River basin (HRB) is located in the arid regions of northwestern China that features severe water shortages and a vulnerable environment, and it is sensitive to climate change and anthropogenic disturbance, such as desertification, afforestation, and irrigation [40,41,42,43]. In northwestern China, the land desertification situation is still very serious. Moreover, rapid urbanization, industrialization, and agricultural development have led to complicated instances of LULCC. Therefore, it is important to study the biophysical effects of LULCC in this region. Considering the above aspects, this study compares the micrometeorological elements, radiation budget, and surface energy distribution between four sites with different land cover types in the HRB. Moreover, the mechanisms of biophysical effects of LULCC on surface temperature are discussed. This paper aims to provide a useful basis for improving the land surface parameterization scheme in climate models and for future land cover management strategies and mitigation warming policies.

2. Data and Methods

2.1. Observation Sites and Data

Heihe Watershed Allied Telemetry Experimental Research (HiWATER) was designed as a comprehensive eco-hydrological experiment to improve the observability of hydrological and ecological processes, to build a world-class watershed observing system, and to enhance the applicability of remote sensing in integrated eco-hydrological studies and water recourse management at the basin scale [44]. The first thematic experiment launched in HiWATER was the MultiScale Observation Experiment on Evapotranspiration over heterogeneous land surfaces 2012 (HiWATER-MUSOEXE), which deployed a flux observation matrix in the middle reach of the Heihe River Basin between May and September in 2012 [45]. The HiWATER-MUSOEXE consisted of two nested matrices: a large experimental area (30 km × 30 km) and a kernel experimental area (5.5 km × 5.5 km) [44,45,46]. Overall, there were 22 eddy covariance systems and 21 automatic weather stations in this experiment. The detailed results for this experiment can be found in the research conducted by Xu et al. [45], Li et al. [44], and Liu et al. [46]. The HiWATER-MUSOEXE provides valuable data for us to investigate the biophysical effects of LULCC on soil surface temperature.
This paper selects four adjacent stations with different land cover types to study temperature differences and associated forcing factors using the observation data from June 2012 to September 2012. The four sites are referred to as Site 1, Site 14, Site 17, and Shenshawo site (Figure 1). The four sites are among the 21 HiWATER-MUSOEXE sites and are selected according to their approximate location (latitude and longitude), approximate altitude, and different land cover types. The corresponding land cover type of Site 14 (100.3° E, 38.8° N) is maize with an altitude of 1570.23 m. The corresponding land cover type of the Shenshawo station (100.49° E, 38.7° N) is desert with an altitude of 1594.00 m. The corresponding land cover type of Site 17 (100.36° E, 38.8° N) is orchard with an altitude of 1559.63 m. The corresponding land cover type of Site 1 (100.35° E, 38.89° N) is vegetable with an altitude of 1552.75 m.
Both the eddy covariance system and automatic weather station were installed to observe sensible heat flux (H), latent heat flux (LE), and meteorological elements in each site. The air temperature and humidity were measured at a height of 5 m at Sites 1, 14, and 17 and at heights of 5 m and 10 m in the Shenshawo site. The wind speed and direction were measured at a height of 10 m in Site 1, 14, and 17, and at heights of 5 m and 10 m in Shenshawo site. For consistency, the air temperature and humidity measured at the height of 5 m and wind speed measured at the height of 10 m were selected in this study. Soil temperature profile (0, 2, 4, 10, 20, 40, 60, 100 cm), soil moisture profile (2, 4, 10, 20, 40, 60, 100 cm), and soil heat flux (6 cm, three plates) were also used in this study. Two soil heat flux plates were buried under the bare soil between the plants and one plate was buried under the plant in Sites 1, 14, and 17. Shenshawo station, which is on bare land, also had three plates to measure the soil heat flux. In addition to the variables above, the automatic weather station measured the surface upward/downward shortwave and longwave radiation fluxes at a height of 6 m. Sensible and latent heat fluxes were measured by the eddy-covariance system at 4.6 m in Site 14 and Shenshawo, at 7 m in Site 17, and at 3.8 m in Site 1. The sampling frequency of the turbulent data was 10 Hz, and necessary corrections and quality controls of the turbulent fluxes, such as eliminating spikes, coordinating rotation, sonic temperature correction, WPL correction (correction for density fluctuations), test of stationary, and integral turbulent characteristics, were applied to the obtained 30-min average fluxes. The micrometeorological elements observed by the automatic weather station at 10-min intervals were averaged to data at half-hour intervals. The detailed instrument information are shown in Table 1.

2.2. Analysis Methodology

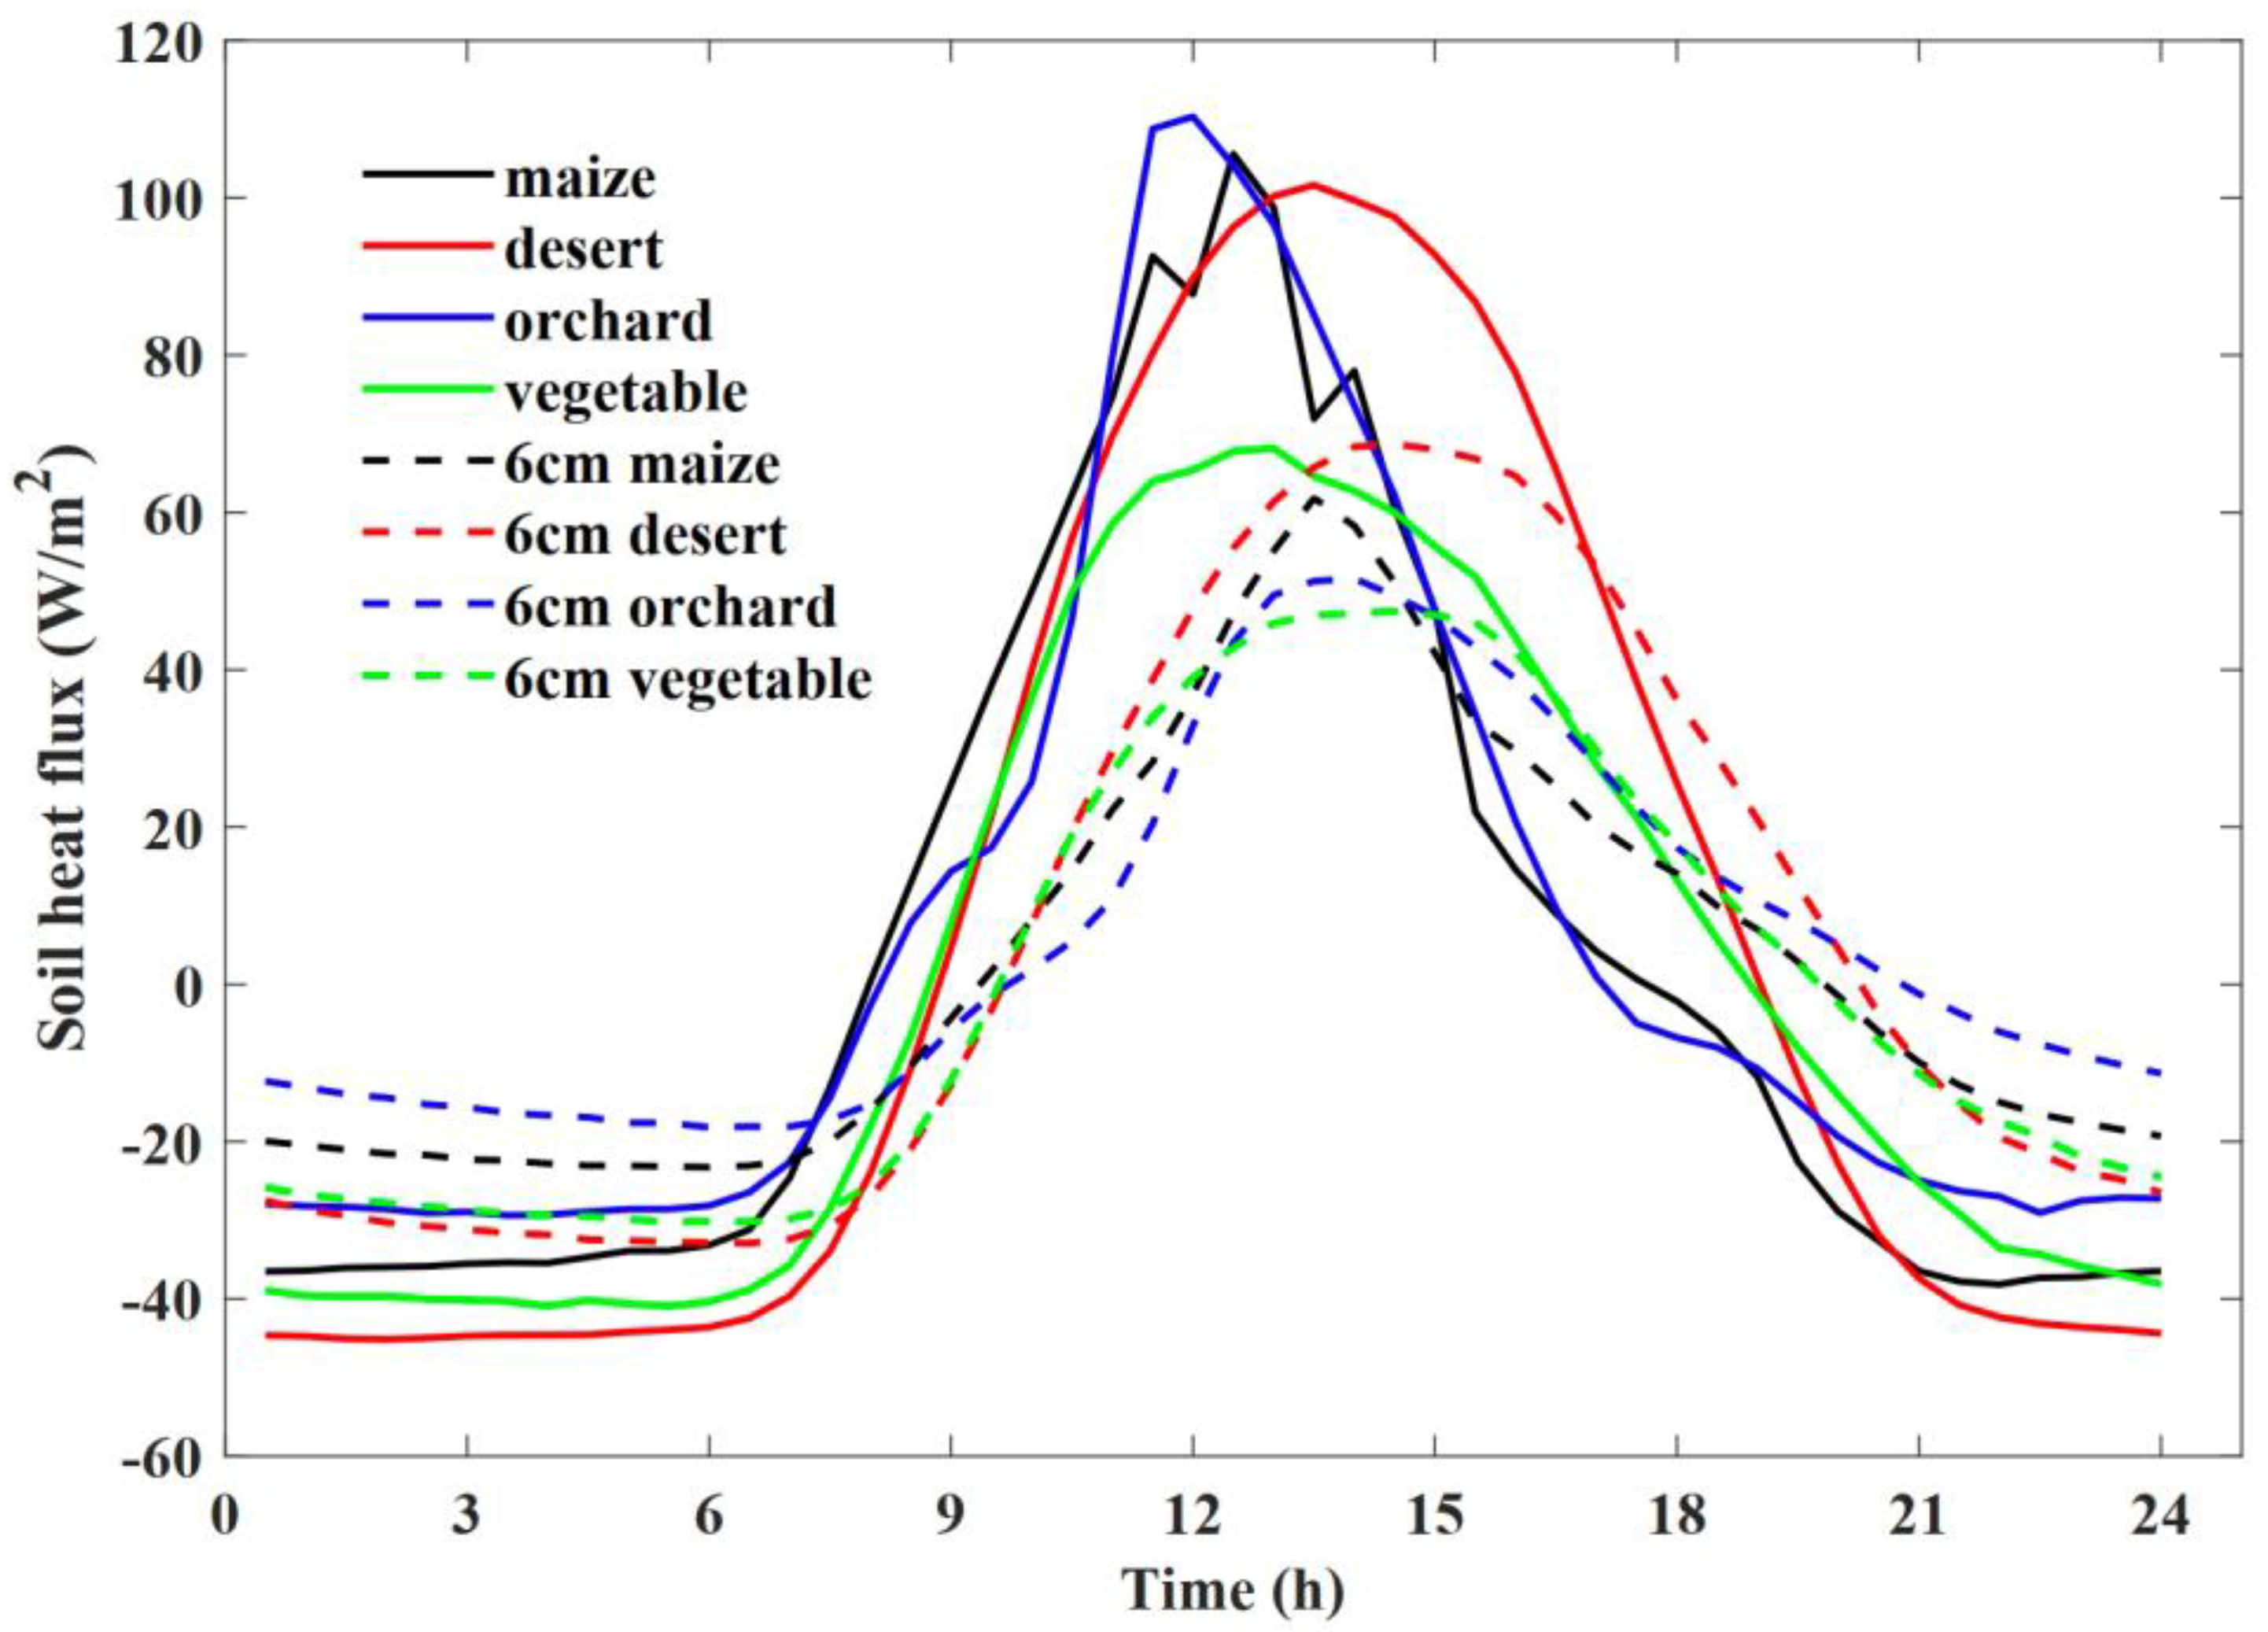
2.2.1. Soil Surface Heat Flux

The soil surface heat flux is an important component of the surface energy balance. The soil heat flux plates are buried at a depth of 0.06 m in this study, and the heat storage between the plate and the surface is one of the main causes of the surface energy imbalance [47,48]. Therefore, obtaining the soil surface heat flux has great significance. The soil thermal diffusion equation is:
ρ s c s T t = G z
where t is time (s), T is soil temperature (K), z is the soil depth (m, positive downward), G is the soil heat flux (Wm−2), and   ρ s c s is the soil heat capacity (J m−3 K−1), which can be calculated as:
ρ s c s = ρ d c d 1 θ s a t + ρ w c w θ
where ρ d c d is dry soil heat capacity (J m−3 K−1), which is determined according to soil observation data, θ s a t is the soil porosity, ρ w c w is the heat capacity of liquid water (4.2 × 10⁶ J m−3 K−1), and θ is the soil volumetric water content (m3 m−3). Integrate Equation (1) and discretize:
G 0 = G 6 + S s o i l = G 6 + ρ s c s t z = 6 z = 0 T z i , t + t T z i , t ] z
where G 0 is the soil surface heat flux, S s o i l represents the heat storage from the plate at a depth of 6 cm from the surface of the ground, and T z i , t is the soil temperature at the depths of 2 cm, 4 cm, and 6 cm at different times. The soil temperature and moisture at a depth of 6 cm is interpolated from the data at 10 cm and 4 cm due to a lack of observation at the 6-cm depth.

2.2.2. Surface Energy Balance Equation

The surface energy budget can be expressed as:
R n = H + L E + G 0 + R e
where H is sensible heat flux, L E is the latent heat flux, G 0 is the soil surface heat flux, and R e is the residual energy that is associated with the photosynthesis and respiration of plants as well as vegetation and soil thermal storage, etc. [49]. R n is net radiation, which can be calculated by:
R n = S 1 α + L ε σ T s 4 1 ε L
where α is the surface albedo, S is the incoming shortwave radiation, L is the incoming longwave radiation, ε is the surface emissivity, σ is the Stephen-Boltzmann constant, and Ts is the surface temperature.
According to the Taylor expansion and omitting the higher order terms:
T s 4 T s 4 + 4 T s 3 T s T s
Without considering the residual term R e , the surface temperature perturbation can be mathematically expressed as:
T s 1 4 T s 3   T s 4 T s 4 = 1 4 ε σ T s 3   ε σ T s 4 ε σ T s 4 = 1 4 ε σ T s 3 S 1 α + ε L L E H G 0
where T s and T s represent the surface temperature of different land cover types and denotes the differences in a variable between different land cover types. Equation (7) is a direct decomposed temperature metric theory. The changes in the soil surface temperature among the different sites are attributed to the differences in albedo and incoming shortwave radiation, emissivity and incoming longwave radiation, sensible heat flux, latent heat flux, and soil surface heat flux.

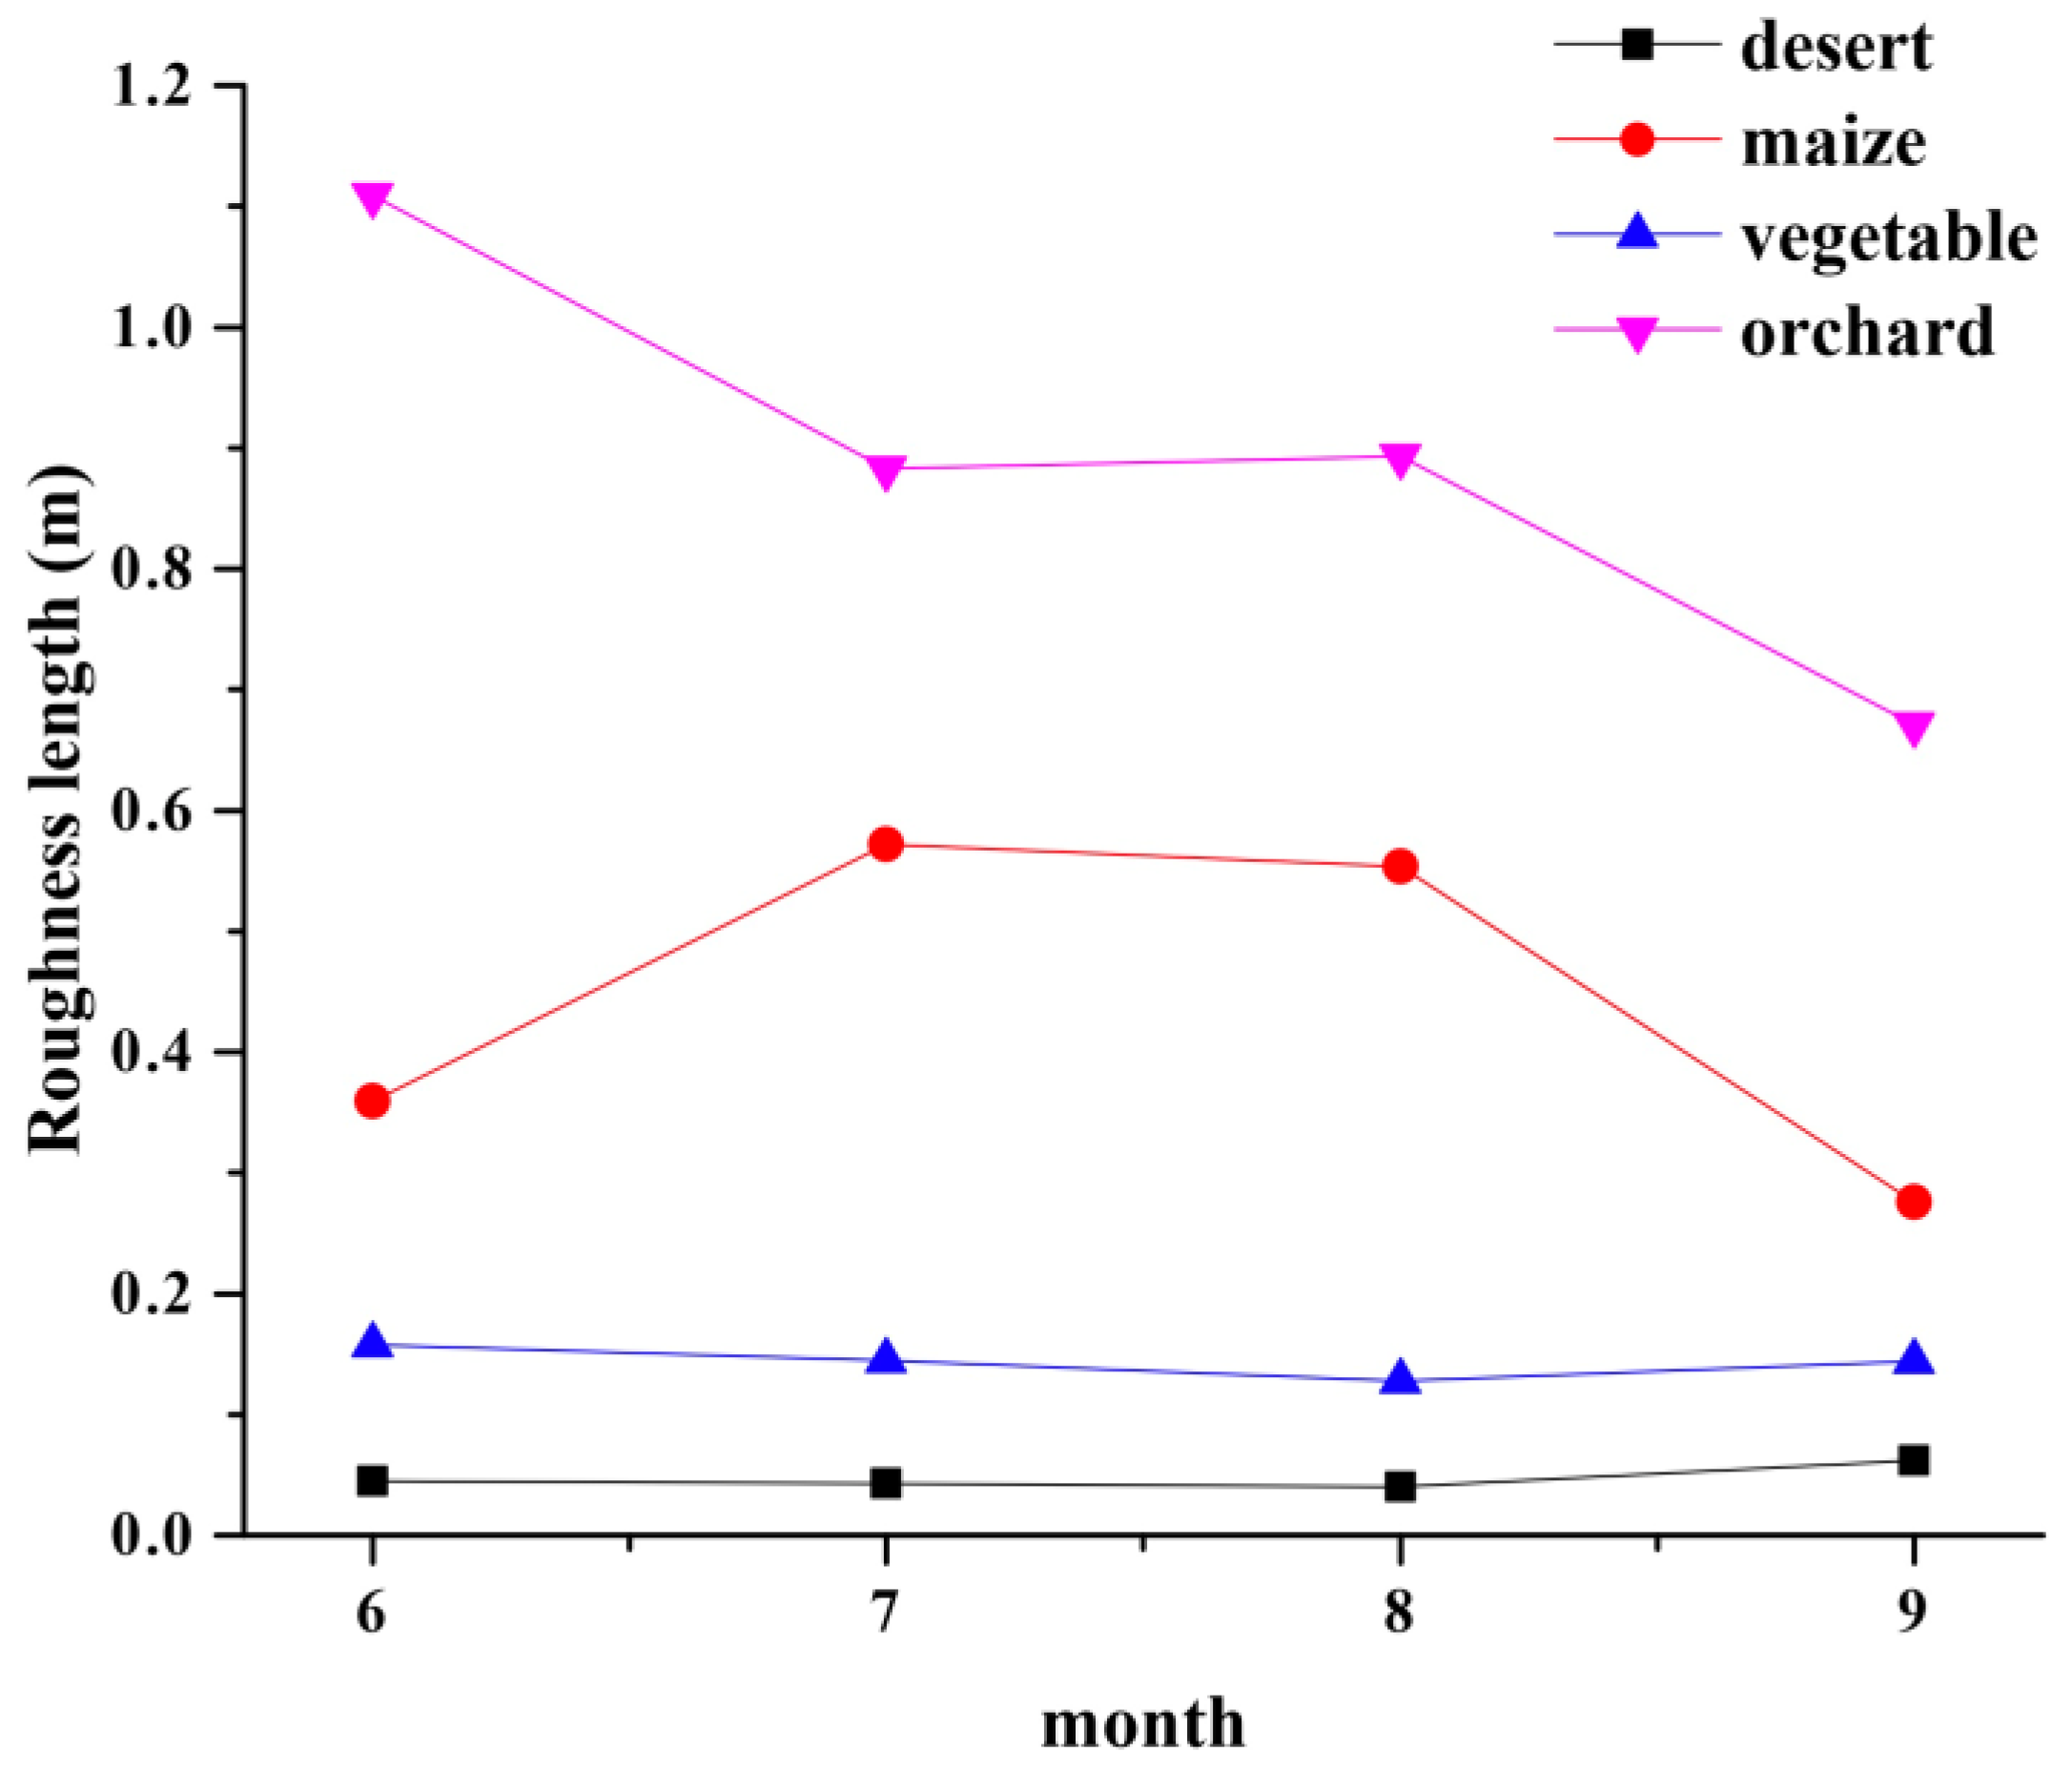
2.2.3. Aerodynamic Roughness Length

Aerodynamic roughness length is an important parameter to study the surface properties of different underlying surfaces. According to the Monin–Obubhov similarity theory, the vertical wind profile in the surface layer can be expressed as:
k u u = l n z z 0 ψ m 𝜁
where u is the horizontal wind speed (m/s) at the height of z (m) from the ground, u is the friction velocity (m/s), k is the von Karman constant (the empirical value is 0.4), z 0 is the aerodynamic roughness length, and ψ M 𝜁 is the stability correction function, which becomes 0 under neutral conditions. The stability parameter is 𝜁 = z L , where L is the Monin–Obukhov length.
We used the independent method [50,51] to calculate z 0 . The relationship between the dimensionless wind velocity k u u and stability parameter 𝜁 is identified in the log–log coordinate to determine the value of k u u under neutral conditions ( 𝜁 = 0 ). Then, the value of z 0 can be obtained according to the wind profile equation under neutral conditions:
k u u = l n z z 0

3. Results

3.1. Differences in the Micrometeorological Elements

Figure 2 shows the diurnal variation of the soil temperatures at the four sites in seven layers. For all the sites, the soil temperatures at shallow depths increased after sunrise and reached the maximum in the afternoon and then gradually decreased. The minimum values of the shallow soil temperature occurred at 08:00 LST, and the maximum values occurred in the afternoon. Only the soil layers close to the surface (e.g., 2 cm, 4 cm, and 10 cm) had obvious diurnal variations. Moreover, the variations in the soil temperature in deep layers lagged behind those in the shallow soil. This is because the shallow soil temperature is directly warmed through absorption of the solar radiation and cooled through emission of longwave radiation. In contrast, the deep soil temperatures mainly rely on the heat transfer between different soil layers. The shallow soil layers obtain and transfer heat to the deeper layers during daytime, and the heat transfer from deeper layers to the surface layer occurs during nighttime.
Comparing the soil temperatures at the four sites, the soil temperatures in the desert site were the highest and the shallow layer (2 cm) had the largest diurnal soil temperature range of 14.56 K, while at the vegetable site, the soil temperature was the lowest and its diurnal soil temperature range was also the lowest with 4.59 K.
Besides the soil temperature, other micrometeorological elements also showed significant differences between the four sites, as shown in Figure 3. The desert site had the highest surface temperature during both daytime and nighttime, and the diurnal surface temperature range was 30.86 K, which was the maximum among the four sites. The diurnal surface temperature ranges were 14.78, 14.25, and 11.84 K for the vegetable, orchard, and maize sites, respectively. The vegetable site had higher daytime and nighttime surface temperatures than those of the orchard and maize sites. The maize site had a higher surface temperature than that of the orchard site, except during 13:00–17:00 LST. Moreover, the differences in the surface temperature between the four sites during daytime were greater than those in the nighttime. The mechanisms of the differences of the surface temperature between different land cover types will be discussed in Section 3.3. The diurnal variations in the near-surface air temperature at the four sites were consistent with those of the soil surface temperature (Figure 3b). While the diurnal surface temperature range was larger than the diurnal air temperature range, the variation in the air temperature lagged than that of the soil surface temperature. The underlying reason is because land surfaces are directly affected by solar and longwave radiation, while the near-surface air temperature mainly responds to the soil surface temperature.
Relative humidity is also an important meteorological element, which affects the occurrence and intensity of precipitation and processes such as radiation and energy exchange. As shown in Figure 3c, the daily variations in the relative humidity were opposite to those in the air temperature and surface temperature. Daily maximum relative humidity occurred at around 07:00 in the morning, and the minimum value occurred at about 16:00 in the afternoon. The smallest relative humidity was at the desert site, which had the highest surface and air temperatures, and the largest relative humidity was at the orchard site, which had the lowest surface temperature. Since the adjacent four sites can be considered to share the same background climate, the differences observed between the four sites can be attributed to land cover change. It can be seen from Figure 2 and Figure 3 that different land use types impose significantly different effects on surface temperature and other micrometeorological elements such as air temperature, soil temperature, and relative humidity.

3.2. Differences in Surface Energy Budget

3.2.1. Surface Radiation Energy

Surface radiation can affect the local surface temperature. Figure 4 displays the diurnal variations in the four components of surface radiation energy, including the downward shortwave radiation (DSR), upward shortwave radiation (USR), downward longwave radiation (DLR), and upward longwave radiation (ULR). It can be seen that the maximum values of DSR at the four stations were around 800 W m−2 and the DSR were similar at the four sites due to the same climate background. The USR depends on the surface albedo. The desert site had the highest albedo and the orchard site had the lowest albedo (Figure 5). The albedo difference between the desert and orchard sites was 0.056 at 14:00, when the DSR were the strongest. The differences in albedo between the vegetable and maize sites were negligible. The maximum daily USR were 141.39, 123.87, 120.97, and 103.89 W m−2 at the desert, vegetable, maize, and orchard sites, respectively, which is consistent with the differences between their albedos. The desert site received the least DLR, while the other three land cover types had a similar magnitude. This is because the desert site had less water vapor and cloud cover, which caused a decrease the DLR. The ULR mainly depends on the surface temperature. The maximum daily ULR were 557.34, 473.61, 460.22, and 461.58 W m−2 at the desert, vegetable, maize, and orchard sites, respectively.

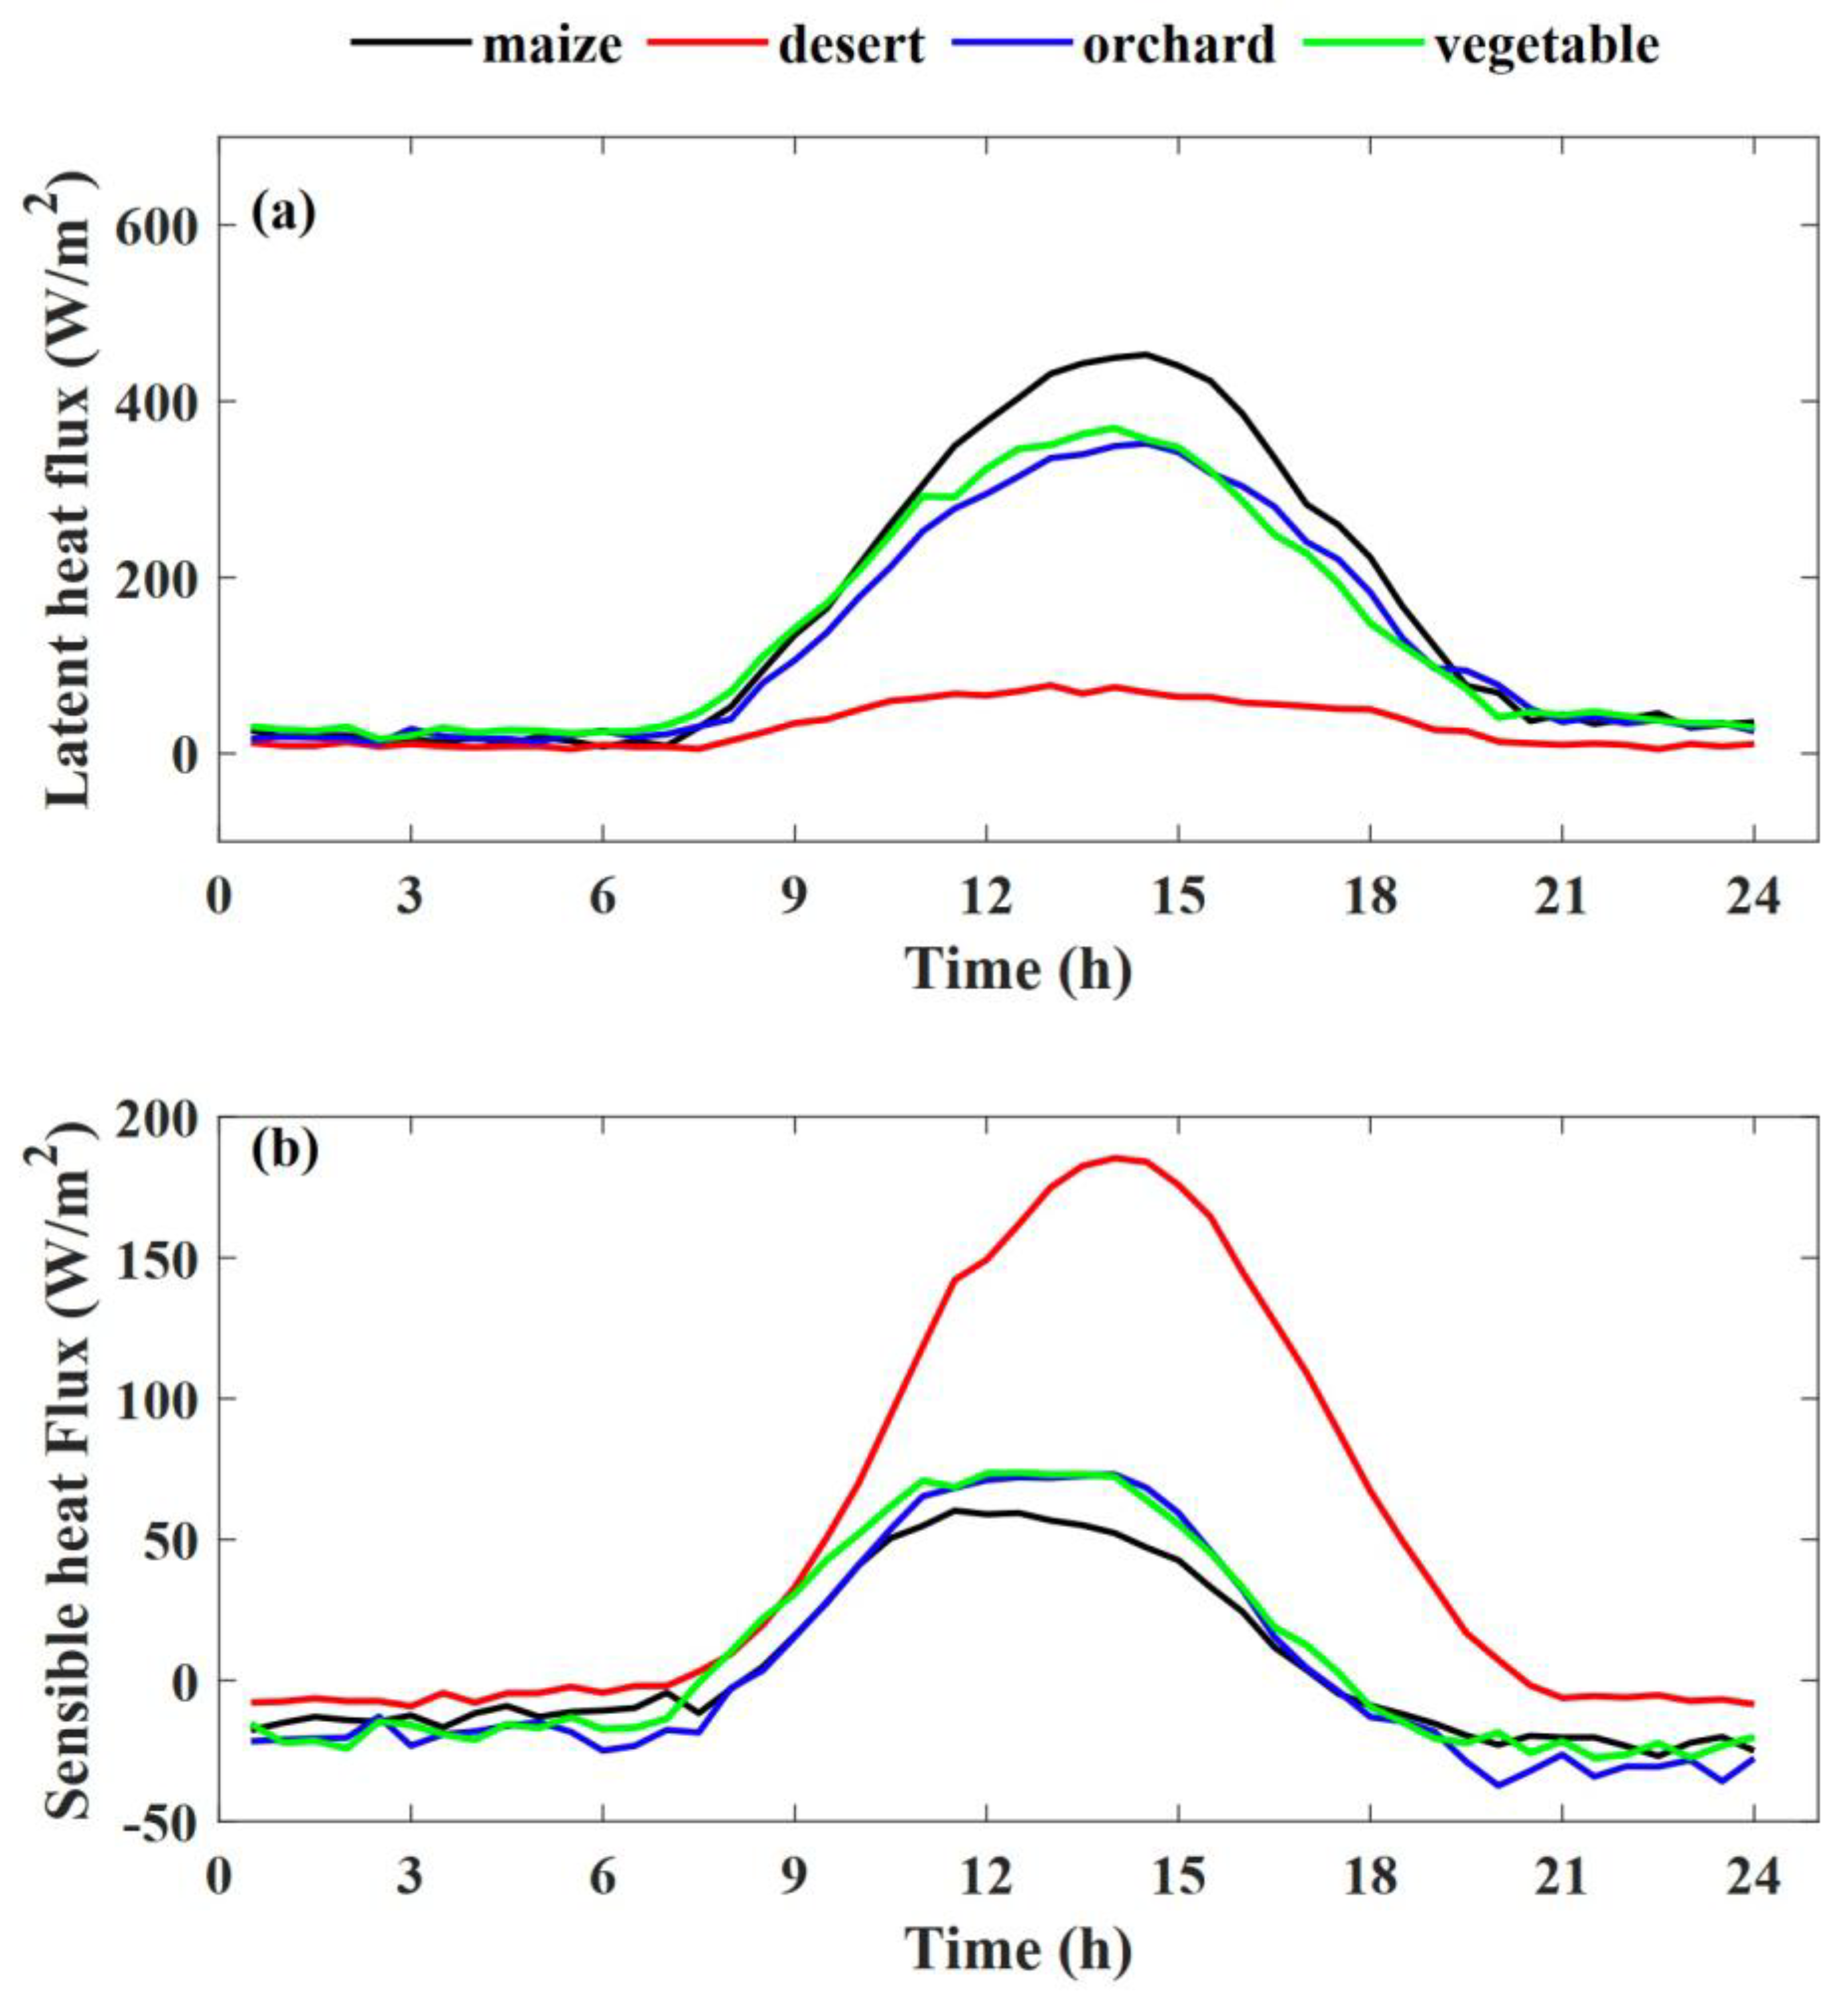
3.2.2. Land Surface Fluxes

Soil surface heat flux plays a critical role in explaining the soil surface temperature differences between different land cover types [16,52]. The soil surface heat flux is obtained using the soil heat flux at a depth of 6 cm and the soil temperature profile in this study. The soil heat fluxes at depths of 6 cm and the soil surface heat fluxes were positive during daytime and negative during nighttime at the four sites (Figure 6). A positive value means that the heat transferred from the surface to the deep soil and vice versa. The soil heat fluxes at 6-cm depth were weaker and lagged more behind the soil surface heat fluxes during both daytime and nighttime due to the soil heat storage. During daytime, part of the soil surface heat flux heat the soil while transferring heat to the deep layers. During nighttime, the heat stored in the soil during the daytime is released at night, which enhances the upward heat flux transferred from deep layers. The soil surface heat flux in the desert site was strongest in the afternoon. The maximum values over the orchard and maize sites exceeded 100 W m−2, which were larger than that of the desert site. The vegetable site had the smallest daily maximum soil surface heat flux of 68.29 W m−2. The nighttime soil surface heat fluxes were −44.54, −40.17, −35.26, and −28.74 W m−2 at the desert, vegetable, maize, and orchard sites, respectively.
The distribution of the available energy between the sensible heat flux and latent heat flux has significant effects on the temperature and moisture within the planetary boundary layer [53,54,55]. The diurnal variations in the latent heat flux and sensible heat flux at the four sites showed that both were positive during daytime and the maximum values occurred at around 14:00 (Figure 7). The nighttime latent heat fluxes were much less than that during daytime and the sensible heat fluxes were negative at night. The desert is a special underlying surface with little soil moisture, air humidity, and vegetation fraction. Therefore, the latent heat flux in the desert site approximated 0 Wm−2, even during daytime (Figure 7a). On the contrary, the sensible heat flux in the desert site was the highest among the four sites and the maximum value was 185.3 W m−2. The maximum values of latent heat flux were 452.89, 369.45, and 352.06 Wm−2 in the maize, vegetable, and orchard sites, respectively. The maximum values of sensible heat flux were 73.11, 73.68, and 60.25 W m−2 in the orchard, vegetable, and maize sites, respectively. The differences in the latent heat flux and the sensible heat flux between the orchard and vegetable sites were negligible. The maize site had the largest latent heat flux and the smallest sensible heat flux, which was completely opposite with that of the desert site.
Surface roughness affects the turbulent exchange between the surface and atmosphere. It can be seen from Figure 8 that different land types have different surface roughness. The desert site without any vegetation had the smallest roughness (0.04 m), which created the weakest turbulent flux (the sum of latent and sensible heat flux was the least). The height of the vegetable site was lowest among the non-desert sites and the roughness was also lower than those of the maize and orchard sites. The roughness length of the maize site was larger than those of the vegetable and desert sites, promoting a stronger turbulent flux in the maize site than the vegetable and desert sites. However, the orchard site had larger roughness length and weaker turbulent flux than the maize site. This is because the distribution of the available energy to sensible heat and latent heat fluxes depends on not only the roughness length, but also the available energy and the Bowen ratio (the ratio of sensible heat flux and latent heat flux). The orchard site had weaker upward shortwave radiation and stronger downward longwave radiation than the maize site. Therefore, the net radiation was stronger in the orchard site than the maize site. Moreover, the soil surface heat flux had negligible differences between these two sites. The orchard site should have more available energy than the maize site without considering the residual energy Re, which is opposite with the results. Therefore, we speculate that the larger residual energy makes the orchard site have less available energy than the maize site. The Bowen ratio of the maize, vegetable, and orchard sites were relatively small and the available energy distributed to the latent heat flux were more efficient.

3.3. Radiative and Non-Radiative Effects on the Differences of Surface Temperature

Northwestern China is located in the arid and semi-arid regions, where the vegetation fraction is low. Studying the effects of land use types on local surface temperature is significant for revealing the importance of selection of the plant types for formulating policies of land cover management and mitigation warming. Herein, we used the direct decomposed temperature metric theory (Equation (7)) to investigate the mechanism of the effects of land cover type on surface temperature. The desert site had the highest surface temperature, and non-desert sites had cooling effects relative to the desert, as shown in Figure 9a. The strongest cooling effects of maize, orchard, and vegetable were −20.43, −19.35, and −16.42 K during daytime, and the average cooling effects were −1.38, −2.52, and −0.93 K at nighttime. There were significant differences in the cooling effects in the non-desert sites on the surface temperature relative to the desert site, and the differences can be attributed to the differences in albedo and incoming shortwave radiation, emissivity and incoming longwave radiation, sensible heat flux, latent heat flux, and soil surface heat flux at the four sites according to Equation (7). These biophysical effects can be divided into radiative (Figure 9e,f) and non-radiative effects (Figure 9b–d).
The differences in the net shortwave radiation between the non-desert sites and the desert site ( 1 α S ) were positive (Figure 9e). According to Equation (7), the positive 1 α S promotes the positive T s , therefore, the net shortwave radiation term in the HRB regions had warming effects, which is opposite with the negative values of T s (Figure 9a). The product of the downward longwave radiation and emissivity term ( ε L ) is similar with   1 α S . Therefore, the non-desert sites had warming effects relative to the desert through the radiative effects.
The latent heat flux differences ( L E ) and sensible heat flux differences ( H ) were positive and negative, respectively. Moreover, both the L E and H were more significant during daytime. The differences in soil heat flux ( G 0 ) were mainly negative during daytime except for the orchard and maize sites before 13:00 and were positive during nighttime. The positive values of the non-radiative terms promoted the negative T s . In other words, the latent heat flux term had a cooling effect on the surface temperature at the non-desert sites and the cooling effects were stronger during daytime. The sensible heat flux term had a warming effect and was also stronger during daytime. The soil surface heat flux term mainly had warming effects in the afternoon and cooling effects at night.
For the three non-desert sites, Figure 9a shows that the cooling effects in the vegetable site was the weakest among these three sites. The G 0 of the vegetable site was larger than other two sites between 15:00 and 21:00 and promoted stronger cooling effects. However, the smaller L E at the vegetable site made weaker cooling effects and offset the effects of G 0 . During other times, the vegetable site had smaller G 0 and thus, weaker cooling effects of vegetable. The maize site had the strongest cooling effects (as high as 20 K) among the three sites in the afternoon and the orchard site had the strongest cooling effects during other times. The L E of the maize site were largest and can be up to 410 Wm−2, which promoted strong cooling effects. Moreover, both the 1 α S and ε L of the maize site were the smallest, which also promoted the cooling effects of the maize site. The large differences in sensible heat flux and soil surface heat flux between the maize and desert sites had warming effects at the maize site. The strongest cooling effects of the orchard site during nighttime were mainly due to the largest G 0 among these three sites. Therefore, the soil surface heat flux is an important influencing factor during the nighttime.
The daytime (09:00–21:00) and nighttime (00:00–09:00 and 21:00–24:00) average values of the biophysical effects in Equation (7) ( 1 4 ε σ T s 3 L E , 1 4 ε σ T s 3 H , 1 4 ε σ T s 3 G 0 , 1 4 ε σ T s 3 S 1 α and 1 4 ε σ T s 3 ε L ) are shown in Figure 10. Both the shortwave and longwave radiation terms had warming effects at the non-desert sites. The latent heat flux term and sensible heat flux term had cooling and warming effects, respectively, which were stronger during daytime. The soil heat flux term had warming and cooling effects during daytime and nighttime, respectively. The non-desert sites had cooling effects relative to the desert site, therefore, the warming (cooling) effects of above biophysical terms had negative (positive) feedbacks on the cooling effects of the non-desert sites. The variation in the latent heat flux at these sites was the main factor causing the differences of their surface temperatures during the daytime. Although the differences in latent heat flux at night was smaller than in daytime, it was still an important driving factor for the nighttime cooling effects at the non-desert sites together with the soil surface heat flux. Therefore, the highest surface temperature of the desert relative to the non-desert sites was mainly caused by the weakest latent heat flux during both daytime and nighttime, and the strongest soil surface heat flux was at night.

4. Discussion

The micrometeorological elements, radiation budget, and surface energy distribution at the four sites with land cover types of vegetable, orchard, maize, and desert in the HRB from June 2012 to September 2012 were compared to investigate the differences in the land–atmosphere interaction between different surface types and the biophysical effects of LULCC on surface temperature. The four land use types at the selected sites had significantly different effects on surface temperature, air temperature, soil temperature, and relative humidity. Compared with the desert site, the non-desert sites had average surface cooling effects of −17.8 K and −1.8 K during daytime and nighttime, respectively. Based on the space-for-time method, the four sites shared the same climate background. The radiative forcing, the turbulent fluxes of latent and sensible heat, and the soil surface heat flux jointly determine the surface cooling effects of the non-desert sites.
Ge et al. [28] investigated the local impact of afforestation by comparing adjacent forest and open land pixels using satellite observations between 2001 and 2012. Guo et al. [32] and Wang et al. [33] used observational data to compare the land–atmosphere interaction at different surface types and quantify the contribution of land use change to surface temperature in the lower reaches of the Yangtze River valley. These research have shown that the non-radiative effects are stronger than the radiative effects. In the arid regions of northwestern China, we have similar results that non-radiative effects dominate the cooling effects of the non-desert sites relative to the desert site. Both the shortwave and longwave radiation terms had negative feedbacks on the cooling effects of the non-desert sites. However, some research have shown the changes in surface albedo result in changes in the radiative forcing that can also dominate the local cooling effects of deforestation at high latitudes [19,20]. This further demonstrates that the biophysical effects of LULCC depend on background climate and reveals the importance of conducting this research in different climate regions.
The latent heat flux and sensible heat flux terms had positive and negative feedbacks on the cooling effects, respectively, which were stronger during daytime. The variation of the latent heat flux at these sites was the main factor causing the differences of their surface temperatures during both daytime and nighttime. The non-desert sites had less upward and stronger downward sensible heat flux than the desert site during daytime and nighttime, respectively. The heat transfers to the upper atmosphere during daytime and the warmer air transfers downward to the surface in the stable atmosphere during nighttime. Therefore, the sensible heat flux in non-desert sites transferred less heat upward during daytime and transferred more heat downward during nighttime, which both warmed the non-desert surface (Figure 10). Schultz et al. [56] found that the nighttime T s response to deforestation was related to the strength of nocturnal temperature inversion, however, the daytime T s were influenced by the latent heat flux and absorbed solar radiation. Hence, they said the sensible heat flux mainly affect nighttime T s , which is opposite of our results. In their research, the forest with larger roughness generated stronger turbulence and transferred heat upward and downward during daytime and nighttime. The daytime effects of sensible heat flux were less than latent heat flux and radiative forcing. Our research shows that the differences in sensible heat flux during nighttime between the four sites were negligible, therefore, the sensible heat flux had stronger negative feedback on the cooling effects during daytime than nighttime.
The soil heat flux term had negative and positive feedbacks during daytime and nighttime, respectively. It is an important driving factor for the nighttime cooling effects at the non-desert sites together with latent heat flux. He et al. [16,52] also found that the shrubland had higher nighttime temperature than grassland mainly due to the larger surface soil heat flux in shrubland transferred more heat downward from the surface to the deep soil during daytime and released it at night.
It should be noted that the LULCC had different effects on the surface temperature and near-surface air temperature (Figure 3). Even though the near-surface air temperature depends on surface temperature, it is affected by other factors such as air advection. Hence, it can be said the surface temperature is more sensitive to LULCC than near-surface air temperature [10,12,57,58]. Winckler et al. [59] have shown that near-surface air temperature was affected by the LULCC only about half as much compared to surface temperature in climate models.

5. Conclusions

The effects of LULCC on the surface temperature were studied using enhanced observation at four sites, featuring land uses of vegetable, orchard, maize, and desert, in the Heihe River basin (HRB), an arid region of northwestern China. The desert site had the highest surface temperature during both daytime and nighttime. The strongest cooling effects in the maize, orchard, and vegetable sites were −20.43, −19.35, and −16.42 K, respectively, during daytime, and the average cooling effects were −1.38, −2.52, and −0.93 K, respectively, at nighttime. Based on the direct decomposed temperature metric theory, the radiative forcing and sensible heat flux had negative feedback on the cooling effects of the non-desert sites. The latent heat flux was the main factor causing the cooling effects of the non-desert sites during both daytime and nighttime. The soil surface heat flux was also an important driving factor for the nighttime cooling effects at the non-desert sites together with latent heat flux.
Our study compared the micrometeorological elements, radiation budget, and surface energy distribution at four sites with different land cover types in the HRB and discussed the mechanisms of biophysical effects of LULCC on surface temperature. This research provides a useful basis for improving the land surface parameterization scheme in climate models and for future land cover management strategies and mitigation warming policies. Several study aspects can be improved in future work. The vegetation maturity may have some effects on the surface properties, such as the albedo and vegetation fraction, that may influence the soil surface temperature. Moreover, the dry and wet conditions may influence the cooling effects of the vegetation relative to desert. Therefore, longer-period and more observational data and quantitative analysis at more sites are needed to generalize the empirical results about the magnitude of vegetation cooling effects and address future work.

Author Contributions

G.Y. designed this study and wrote the manuscript. Y.Z. and E.L. analyzed the data. Y.L. and G.Y. revised the manuscript. All authors have read and agreed to the published version of the manuscript.

Funding

This research was funded by the National Natural Science Foundation of China (42005061) and Jiangsu Provincial Basic Research Programme (Natural Science Fund BK20200818).

Data Availability Statement

The data were obtained from http://data.tpdc.ac.cn.

Conflicts of Interest

The authors declare no conflict of interest.

References

  1. Sanderson, E.W.; Jaiteh, M.; Levy, M.A.; Redford, K.H.; Wannebo, A.V.; Woolmer, G. The human footprint and the last of the wild. Bioscience 2002, 52, 891–904. [Google Scholar] [CrossRef] [Green Version]
  2. Hassan, Z.; Shabbir, R.; Ahmad, S.S.; Malik, A.H.; Aziz, N.; Butt, A.; Erum, S. Dynamics of land use and land cover change (LULCC) using geospatial techniques: A case study of Islamabad Pakistan. Springerplus 2016, 5, 812. [Google Scholar] [CrossRef] [PubMed] [Green Version]
  3. Peng, S.S.; Piao, S.; Zeng, Z.; Ciais, P.; Zhou, L.; Li, L.Z.X.; Myneni, R.B.; Yin, Y.; Zeng, H. Afforestation in china cools local land surface temperature. Proc. Natl. Acad. Sci. USA 2014, 111, 2915–2919. [Google Scholar] [CrossRef] [PubMed] [Green Version]
  4. Vitousek, P.M.; Mooney, H.A.; Lubchenco, J.; Melillo, J.M. Human domination of earth’s ecosystems. Science 1997, 277, 494–499. [Google Scholar] [CrossRef] [Green Version]
  5. Feddema, J.J.; Oleson, K.W.; Bonan, G.B.; Mearns, L.O.; Buja, L.E.; Meehl, G.A.; Washington, W.M. The Importance of land-cover change in simulating future climates. Science 2005, 310, 1674–1678. [Google Scholar] [CrossRef] [Green Version]
  6. Foley, J.A.; DeFries, R.; Asner, G.P.; Barford, C.; Bonan, G.; Carpenter, S.R.; Chapin, F.S.; Coe, M.T.; Daily, G.C.; Gibbs, H.K.; et al. Global consequences of land use. Science 2005, 309, 570–574. [Google Scholar] [CrossRef] [Green Version]
  7. Pongratz, J.; Reick, C.H.; Raddatz, T.; Claussen, M. Biogeophysical versus biogeochemical climate response to historical anthropogenic land cover change. Geophys. Res. Lett. 2010, 37, L08702. [Google Scholar] [CrossRef] [Green Version]
  8. Baldocchi, D. Managing land and climate. Nat. Clim. Change 2014, 4, 330–331. [Google Scholar] [CrossRef]
  9. Cao, Q.; Yu, D.; Georgescu, M.; Han, Z.; Wu, J. Impacts of land use and land cover change on regional climate: A case study in the agro-pastoral transitional zone of China. Environ. Res. Lett. 2015, 10, 124025. [Google Scholar] [CrossRef]
  10. Alkama, R.; Cescatti, A. Biophysical climate impacts of recent changes in global forest cover. Science 2016, 351, 600–604. [Google Scholar] [CrossRef] [Green Version]
  11. Lee, X.; Goulden, M.L.; Hollinger, D.Y.; Barr, A.; Black, T.A.; Bohrer, G.; Bracho, R.; Drake, B.; Goldstein, A.; Gu, L.; et al. Observed increase in local cooling effect of deforestation at higher latitudes. Nature 2011, 479, 384–387. [Google Scholar] [CrossRef] [Green Version]
  12. Li, Y.; Zhao, M.; Motesharrei, S.; Mu, Q.; Kalnay, E.; Li, S. Local cooling and warming effects of forests based on satellite observations. Nat. Commun. 2015, 6, 6603. [Google Scholar] [CrossRef] [Green Version]
  13. Arora, V.K.; Montenegro, A. Small temperature benefits provided by realistic afforestation efforts. Nat. Geosci. 2011, 4, 514–518. [Google Scholar] [CrossRef]
  14. Georgescu, M.; Lobell, D.B.; Field, C.B. Direct climate effects of perennial bioenergy crops in the United States. Proc. Natl. Acad. Sci. USA 2011, 108, 4307–4312. [Google Scholar] [CrossRef] [Green Version]
  15. Loarie, S.R.; Lobell, D.; Asner, G.; Mu, Q.; Field, C.B. Direct impacts on local climate of sugar-cane expansion in Brazil. Nat. Clim. Change 2011, 1, 105–109. [Google Scholar] [CrossRef]
  16. He, Y.; D’Odorico, P.; De Wekker, S.F.J.; Fuentes, J.D.; Litvak, M. On the impact of shrub encroachment on microclimate conditions in the northern Chihuahuan desert. J. Geophys. Res. 2010, 115, D21120. [Google Scholar] [CrossRef]
  17. Bonan, G.B. Observational evidence for reduction of daily maximum temperature by croplands in the midwest United States. J. Climate 2001, 14, 2430–2442. [Google Scholar] [CrossRef]
  18. Bonan, G.B.; Pollard, D.; Thompson, S.L. Effects of boreal forest vegetation on global climate. Nature 1992, 359, 716–718. [Google Scholar] [CrossRef]
  19. Claussen, M.; Brovkin, V.; Ganopolski, A. Biogeophysical versus biogeochemical feedbacks of large-scale land cover change. Geophys. Res. Lett. 2001, 28, 1011–1014. [Google Scholar] [CrossRef] [Green Version]
  20. Davin, E.L.; de Noblet-Ducoudré, N. Climatic impact of global-scale deforestation: Radiative versus nonradiative processes. J. Climate 2010, 23, 97–112. [Google Scholar] [CrossRef]
  21. Bounoua, L.; DeFries, R.; Collatz, G.J.; Sellers, P.; Khan, H. Effects of land cover conversion on surface climate. Clim. Change 2002, 52, 29–64. [Google Scholar] [CrossRef]
  22. Defries, R.S.; Bounoua, L.; Collatz, G.J. Human modification of the landscape and surface climate in the next fifty years. Glob. Chang. Biol. 2002, 8, 438–458. [Google Scholar] [CrossRef]
  23. Kanda, M.; Kanega, M.; Kawai, T.; Moriwaki, R.; Sugawara, H. Roughness lengths for momentum and heat derived from outdoor urban scale models. J. Appl. Meteorol. Climatol. 2007, 46, 1067–1079. [Google Scholar] [CrossRef]
  24. Campra, P.; Garcia, M.; Canton, Y.; Orueta, A.P. Surface temperature cooling trends and negative radiative forcing due to land use change toward greenhouse farming in southeastern Spain. J. Geophys. Res.-Atmos. 2008, 113, D18109. [Google Scholar] [CrossRef]
  25. Baldocchi, D.; Ma, S. How will land use affect air temperature in the surface boundary layer? Lessons learned from a comparative study on the energy balance of an oak savanna and annual grassland in California, USA. Tellus. B 2013, 65, 19994. [Google Scholar] [CrossRef] [Green Version]
  26. Yang, K.; Wu, H.; Qin, J.; Lin, C.; Tang, W.; Chen, Y. Recent climate changes over the Tibetan Plateau and their impacts on energy and water cycle: A review. Glob. Planet Change 2014, 112, 79–91. [Google Scholar] [CrossRef]
  27. Wang, L.; Lee, X.; Schultz, N.; Chen, S.; Wei, Z.; Fu, C.; Gao, Y.; Yang, Y.; Lin, G. Response of surface temperature to afforestation in the Kubuqi Desert, Inner Mongolia. J. Geophys. Res.-Atmos. 2018, 123, 948–964. [Google Scholar] [CrossRef]
  28. Ge, J.; Guo, W.; Pitman, A.J.; De Kauwe, M.G.; Chen, X.; Fu, C. The nonradiative effect dominates local surface temperature change caused by afforestation in China. J. Climate. 2019, 32, 4445–4471. [Google Scholar] [CrossRef]
  29. Hirsch, A.L.; Pitman, A.J.; Kala, J. The role of land cover change in modulating the soil moisture-temperature land-atmosphere coupling strength over Australia. Geophys. Res. Lett. 2014, 41, 5883–5890. [Google Scholar] [CrossRef]
  30. Benson-Lira, V.; Georgescu, M.; Kaplan, S.; Vivoni, E.R. Loss of a lake system in a megacity: The impact of urban expansion on seasonal meteorology in Mexico City. J. Geophys. Res.-Atmos. 2016, 121, 3079–3099. [Google Scholar] [CrossRef]
  31. Houghton, R.A.; House, J.I.; Pongratz, J.; Van Der Werf, G.R.; DeFries, R.S.; Hansen, M.C.; Le Quéré, C.; Ramankutty, N. Carbon emissions from land use and land-cover change. Biogeosciences 2012, 9, 5125–5142. [Google Scholar] [CrossRef] [Green Version]
  32. Guo, W.; Wang, X.; Sun, J.; Ding, A.; Zou, J. Comparison of land–atmosphere interaction at different surface types in the mid to lower reaches of the Yangtze River valley. Atmos. Chem. Phys. 2016, 16, 9875–9890. [Google Scholar] [CrossRef] [Green Version]
  33. Wang, X.; Guo, W.; Qiu, B.; Liu, Y.; Sun, J.; Ding, A. Quantifying the contribution of land use change to surface temperature in the lower reaches of the Yangtze River. Atmos. Chem. Phys. 2017, 17, 4989–4996. [Google Scholar] [CrossRef] [Green Version]
  34. Huang, J.; Zhang, W.; Zuo, J.; Bi, J.; Shi, J.; Wang, X.; Chang, Z.; Huang, Z.; Yang, S.; Zhang, B.; et al. An overview of the semi-arid climate and environment research observatory over the Loess Plateau. Adv. Atmos. Sci. 2008, 25, 906–921. [Google Scholar] [CrossRef]
  35. Wang, G.; Huang, J.; Guo, W.; Zuo, J.; Wang, J.; Bi, J.; Huang, Z.; Shi, J. Observation analysis of land-atmosphere interactions over the Loess Plateau of northwest China. J. Geophys. Res.-Atmos. 2010, 115, D00K17. [Google Scholar] [CrossRef] [Green Version]
  36. Hari, P.; Petäjä, T.; Bäck, J.; Kerminen, V.-M.; Lappalainen, H.K.; Vihma, T.; Laurila, T.; Viisanen, Y.; Vesala, T.; Kulmala, M. Conceptual design of a measurement network of the global change. Atmos. Chem. Phys. 2016, 16, 1017–1028. [Google Scholar] [CrossRef] [Green Version]
  37. Niu, G.-Y.; Yang, Z.-L.; Mitchell, K.E.; Chen, F.; Ek, M.B.; Barlage, M.; Kumar, A.; Manning, K.; Niyogi, D.; Rosero, E.; et al. The community Noah land surface model with multiparameterization options (Noah-MP): 1. Model description and evaluation with local-scale measurements. J. Geophys. Res.-Atmos. 2011, 116, D12109. [Google Scholar] [CrossRef] [Green Version]
  38. Huang, J.; Yu, H.; Guan, X.; Wang, G.; Guo, R. Accelerated dryland expansion under climate change. Nat. Clim. Change 2015, 6, 166–171. [Google Scholar] [CrossRef]
  39. Zhang, X.; Xiong, Z.; Zhang, X.; Shi, Y.; Liu, J.; Shao, Q.; Yan, X. Using multi-model ensembles to improve the simulated effects of land use/cover change on temperature: A case study over northeast China. Clim. Dynam. 2016, 46, 765–778. [Google Scholar] [CrossRef]
  40. Fu, Q.; Johanson, C.M.; Wallace, J.M.; Reichler, T. Enhanced mid-latitude tropospheric warming in satellite measurements. Science 2006, 312, 1179. [Google Scholar] [CrossRef]
  41. Ma, Z.; Fu, C. Some evidences of drying trend over North China from 1951 to 2004. Chinese Sci. Bull. 2006, 51, 2913–2925. [Google Scholar] [CrossRef]
  42. Jiang, B.; Liang, S. Improved vegetation greenness increases summer atmospheric water vapor over Northern China. J. Geophys. Res.-Atmos. 2013, 118, 8129–8139. [Google Scholar] [CrossRef]
  43. Liang, J.N.; Zhang, L.; Wang, Y.; Cao, X.J.; Zhang, Q.; Wang, H.B.; Zhang, B.D. Turbulence regimes and the validity of similarity theory in the stable boundary layer over complex terrain of the Loess Plateau, China. J. Geophys. Res.-Atmos. 2014, 119, 6009–6021. [Google Scholar] [CrossRef]
  44. Li, X.; Cheng, G.; Liu, S.; Xiao, Q.; Ma, G.; Jin, R.; Che, T.; Liu, Q.; Wang, W.; Qi, Y.; et al. Heihe watershed allied telemetry experimental research (HiWATER): Scientific objectives and experimental design. Bull. Amer. Meteorol. Soc. 2013, 94, 1145–1160. [Google Scholar] [CrossRef]
  45. Xu, Z.; Liu, S.; Li, X.; Shi, S.; Wang, J.; Zhu, Z.; Xu, T.; Wang, W.; Ma, M. Intercomparison of surface energy flux measurement systems used during the HiWATER-MUSOEXE. J. Geophys. Res.-Atmos. 2013, 118, 13140–13157. [Google Scholar] [CrossRef]
  46. Liu, Y.; Guo, W.D.; Song, Y.M. Estimation of key surface parameters in semi-arid region and their impacts on improvement of surface fluxes simulation. Sci. China Earth Sci. 2016, 59, 307–319. [Google Scholar] [CrossRef]
  47. Heusinkveld, B.G.; Jacobs, A.F.G.; Holtslag, A.A.M.; Berkowicz, S.M. Surface energy balance closure in an arid region: Role of soil heat flux. Agric. For. Meteorol. 2004, 122, 21–37. [Google Scholar] [CrossRef]
  48. Ochsner, T.E.; Sauer, T.J.; Horton, R. Soil heat storage measurements in energy balance studies. Agron. J. 2007, 99, 311–319. [Google Scholar] [CrossRef] [Green Version]
  49. Burba, G.G.; Verma, S.B.; Kim, J. Energy fluxes of an open water area in a mid-latitude prairie wetland. Bound. Lay. Meteorol. 1999, 91, 495–504. [Google Scholar] [CrossRef]
  50. Ma, Y.; Menenti, M.; Feddes, R.; Wang, J. Analysis of the land surface heterogeneity and its impact on atmospheric variables and the aerodynamic and thermodynamic roughness lengths. J. Geophys. Res.-Atmos. 2008, 113, D08113. [Google Scholar] [CrossRef]
  51. Liu, S.; Xu, Z.; Song, L.; Zhao, Q.; Ge, Y.; Xu, T.; Ma, Y.; Zhu, Z.; Jia, Z.; Zhang, F. Upscaling evapotranspiration measurements from multi-site to the satellite pixel scale over heterogeneous land surfaces. Agric. For. Meteorol. 2016, 230-231, 97–113. [Google Scholar] [CrossRef]
  52. He, Y.; De Wekker, S.F.J.; Fuentes, J.D.; D’Odorico, P. Coupled land-atmosphere modeling of the effects of shrub encroachment on nighttime temperatures. Agric. For. Meteorol. 2011, 151, 1690–1697. [Google Scholar] [CrossRef]
  53. Kang, S.L.; Davis, K.J.; LeMone, M.A. Observations of the ABL structures over a heterogeneous land surface during IHOP_2002. J. Hydrometeorol. 2007, 8, 221–244. [Google Scholar] [CrossRef]
  54. LeMone, M.A.; Tewari, M.; Chen, F.; Alferi, J.G.; Niyogi, D. Evaluation of the Noah land surface model using data from a fair weather IHOP_2002 day with heterogeneous surface fluxes. Mon. Weather Rev. 2008, 136, 4915–4941. [Google Scholar] [CrossRef]
  55. Yuan, G.; Zhang, L.; Liang, J.; Cao, X.; Guo, Q.; Yang, Z. Impacts of initial soil moisture and vegetation on the diurnal temperature range in arid and semiarid regions in China. J. Geophys. Res.-Atmos. 2017, 122, 11568–11583. [Google Scholar] [CrossRef]
  56. Schultz, N.M.; Lawrence, P.J.; Lee, X. Global satellite data highlights the diurnal asymmetry of the surface temperature response to deforestation. J. Geophys. Res.-Biogeo. 2017, 122, 903–917. [Google Scholar] [CrossRef]
  57. Luyssaert, S.; Jammet, M.; Stoy, P.C.; Estel, S.; Pongratz, J.; Ceschia, E.; Churkina, G.; Don, A.; Erb, K.; Ferlicoq, M.; et al. Land management and land cover change have impacts of similar magnitude on surface temperature. Nat. Clim. Chang. 2014, 4, 389–393. [Google Scholar] [CrossRef] [Green Version]
  58. Meier, R.; Davin, E.L.; Lejeune, Q.; Hauser, M.; Li, Y.; Martens, B.; Schultz, N.M.; Sterling, S.; Thiery, W. Evaluating and improving the Community Land Model’s sensitivity to land cover. Biogeosciences 2018, 15, 4731–4757. [Google Scholar] [CrossRef] [Green Version]
  59. Winckler, J.; Reick, C.H.; Luyssaert, S.; Cescatti, A.; Stoy, P.C.; Lejeune, Q.; Raddatz, T.; Chlond, A.; Heidkamp, M.; Pongratz, J. Different response of surface temperature and air temperature to deforestation in climate models. Earth Syst. Dynam. 2019, 10, 473–484. [Google Scholar] [CrossRef] [Green Version]
Figure 1. The location of the four sites and the terrain height.
Sustainability 15 03859 g001
Figure 2. Diurnal variations in soil temperature at four sites in HRB from June 2012 to September 2012 with (a) maize (b) desert (c) orchards, and (d) vegetable. Time is Beijing Time (here and hereafter).
Sustainability 15 03859 g002
Figure 3. Diurnal variations in (a) soil surface temperature, (b) near-surface air temperature, and (c) relative humidity at four sites in HRB from June 2012 to September 2012.
Sustainability 15 03859 g003
Figure 4. Diurnal variations in (a) downward shortwave radiation (DSR), (b) upward shortwave radiation (USR), (c) downward longwave radiation (DLR), and (d) upward longwave radiation (ULR) at four sites in HRB from June 2012 to September 2012.
Sustainability 15 03859 g004
Figure 5. Diurnal variations in albedo at four sites in HRB from June 2012 to September 2012.
Sustainability 15 03859 g005
Figure 6. Diurnal variations in soil heat flux at four sites in HRB from June 2012 to September 2012 (the solid lines represent the soil surface heat fluxes, and the dotted lines represent the soil heat fluxes at depths of 6 cm).
Sustainability 15 03859 g006
Figure 7. Diurnal variations in (a) latent heat flux (b) sensible heat flux at four sites in HRB from June 2012 to September 2012.
Sustainability 15 03859 g007
Figure 8. Monthly variations in surface roughness length at the four sites in HRB from June 2012 to September 2012.
Sustainability 15 03859 g008
Figure 9. Diurnal variations in the difference of (a) soil surface temperature, (b) sensible heat flux, (c) latent heat flux, (d) soil surface heat flux, (e) net shortwave radiation, (f) the product of downward longwave radiation and emissivity between the desert site and other three sites in HRB from June 2012 to September 2012.
Sustainability 15 03859 g009
Figure 10. Partition of the biophysical effects according to Equation (7) in (a) daytime and (b) nighttime in HRB from June 2012 to September 2012.
Sustainability 15 03859 g010
Table 1. Micrometeorological elements, instrument models, frame height, and site.
Observation ItemsType, ManufacturersHeight (m)Site
Wind speed/direction03002,
RM Young, USA
101
03001,
RM Young, USA
5/10Shenshawo
034B,
Met One, USA
1014, 17
Air temperature and humidityHMP155,
Vaisala, Finland
51
HMP45D,
Vaisala, Finland
514
HMP45C,
Vaisala, Finland
517
HMP45AC,
Vaisala, Finland
5/10Shenshawo
RadiationCNR4,
Kipp&Zonen, Netherland
61, 14
CNR1,
Kipp&Zonen, Netherland
617, Shenshawo
Soil temperature109ss-L,
Campbell, USA
0, −0.02, −0.04,
−0.1, −0.2, −0.4,
−0.6, −1
1
AV-10T,
Avalon, USA
14
109,
Campbell, USA
17, Shenshawo
Soil moisture SM300,
Delta-T Devices, UK
−0.02, −0.04,
−0.1, −0.2, −0.4,
−0.6, −1
1
ECH2O-5,
Decagon Devices, USA
14
CS616,
Campbell, USA
17, Shenshawo
Soil heat fluxHFP01,
Hukseflux, Netherland
−0.061, 17, Shenshawo
HFT3,
Campbell, USA
14
Sensible heat flux, latent heat fluxCSAT3 and Li7500,
Campbell/Li-cor, USA
4.614, Shenshawo
CSAT3 and EC150,
Campbell, USA
717
Gill and Li7500A,
Gill, UK; Li-cor, USA
3.81
Disclaimer/Publisher’s Note: The statements, opinions and data contained in all publications are solely those of the individual author(s) and contributor(s) and not of MDPI and/or the editor(s). MDPI and/or the editor(s) disclaim responsibility for any injury to people or property resulting from any ideas, methods, instructions or products referred to in the content.

