Article

Life Cycle Assessment of Black and Greywater Treatment Solutions for Remote and Sensitive Areas

1
Materials Research Laboratory, University of Nova Gorica, Vipavska 13, 5000 Nova Gorica, Slovenia
2
Slovenian National Building and Civil Engineering Institute, Dimičeva ulica 12, 1000 Ljubljana, Slovenia
3
School of Environmental Sciences, University of Nova Gorica, Vipavska 13, 5000 Nova Gorica, Slovenia
4
Faculty of Environmental Sciences and Natural Resource Management (MINA), Norwegian University of Life Sciences (NMBU), Fougnerbakken 3, NO-1432 Ås, Norway
5
Green Technology Center d.o.o., Trg Edvarda Kardelja 1, 5000 Nova Gorica, Slovenia
*
Author to whom correspondence should be addressed.
Sustainability 2023, 15(4), 3832; https://doi.org/10.3390/su15043832
Submission received: 8 January 2023 / Revised: 3 February 2023 / Accepted: 9 February 2023 / Published: 20 February 2023
(This article belongs to the Section Environmental Sustainability and Applications)

Abstract

:
Sensitive and remote areas have come under pressure from growing populations and tourism, often resulting in improper wastewater management. Efficiency, durability, the use of renewable construction materials, and the minimization of environmental impacts must be conformed to a sustainable paradigm. A life cycle assessment (LCA) was applied to compare three different decentralized wastewater treatment systems built at tourist facilities: a source separation sanitation system with a hybrid constructed wetland (S1), a sequential batch reactor (SBR) with a hybrid constructed wetland (S2), and a solar-powered composting toilet (S3). Benchmarking showed that S1 was preferred over S2. The differences were up to a factor of two, except for eutrophication, which was significantly higher for S2 (10×). S3 had the lowest environmental impact, but S3 treated only the blackwater fraction, i.e., urine, faeces, and toilet paper, and excluded greywater treatment, i.e., handwashing and/or kitchen wastewater. The scenario analysis showed that the environmental performance could be improved by installing solar panels, but this would increase the impact on the abiotic depletion of elements by 83% for S2. The LCA indicated the advantages, disadvantages, flexibility, and potential for design improvements to meet the environmental sustainability and market demands for system diversity.

Graphical Abstract

1. Introduction

Decentralized source separation wastewater systems, when properly designed, have proven effective for tourist destinations in remote areas because they are nearly emission-free, use little water and energy, and are relatively easy to manage [1,2,3]. In properly designed wastewater source separation systems, human excreta do not enter the water cycle, preventing both the release of pathogens into the aquatic environment and eutrophication. In case of blackwater (BW) treatment, the nutrients are recycled and biogas recovery is achievable. Greywater (GW) is usually associated with reuse after treatment due to its low contaminant content [4]. In remote and sensitive areas, various decentralized wastewater treatment solutions can be employed, such as (1) composting toilets with or without urine source separation [5,6], (2) sequence batch reactors [7], (3) anaerobic baffled reactors [8], (4) biofilters [9], or (5) constructed wetlands (CW) [10]. Practical applications of decentralized and/or separation systems in remote/sensitive areas showed that several factors influence their performance, such as environmental conditions (e.g., low temperatures and water accessibility), seasonal peaks in tourist visits, and maintenance requirements. Under remote conditions, even sophisticated solutions sometimes fail [11].
Ecological vulnerability has been defined as the ability of an ecosystem to withstand natural and anthropogenic disturbances in space and time, and its capacity to return to its original and sustainable state [12]. Sensitive and remote areas that are under pressure from a growing population and tourism are particularly vulnerable. A relevant example is karst areas, which are often protected for their natural values and diverse biodiversity [13]. Karst areas are highly susceptible to pollution because of their nature, geomorphological, and hydrological features, developed on water permeable rocks which enable fast infiltration with a significant lateral extension and highly effective recharge points, covered with shallow or sparse soils and vegetation. [14]. Inadequate or untreated wastewater released into such environments has significant negative consequences for wildlife and humans [15,16].
Wastewater management in remote and sensitive areas therefore requires systems with a high performance that are robust, adaptable, reliable, and allow for easy maintenance. In addition, the current practices in terms of energy and water consumption and the recovery rate of nutrients and materials are not always compatible with a sustainability approach, so the introduction of new technologies in line with stricter regulations is encouraged.
In addition to the problem of effective treatment in remote areas, another challenge is the management of the effluents, such as storage and further handling. For example, at high-altitude tourist facilities, it is common practice to discharge sludge, urine, and other effluents directly into the environment, which can be hazardous. Another common practice is their temporary storage on site and transport by helicopter to the facility where the effluents will eventually be treated. In Slovenia, for example, new regulations prohibit the direct discharge of wastewater into water bodies or indirect discharge less than 300 m from the shore of a natural or artificial lake [17]. The wastewater that cannot be discharged should be separated, and the fractions (greywater and blackwater) should be properly treated. Moreover, the proper management of composting toilets must be applied [18].
To improve sustainability, the planning of such technologies must consider not only their efficiency, but also other aspects such as durability, the use of renewable materials, and the environmental impact (i.e., the environmental performance of the technologies). LCA can be used to improve the sustainability of technologies. LCA is an effective tool that is commonly used as a decision support tool for wastewater management and the evaluation of the environmental performance of wastewater treatment systems by quantifying their environmental impacts [19]. In general, several factors influence the environmental impact of wastewater treatment technologies, such as the resource recycling potential, water source, energy use, source separation potential, and the scale of the technologies. For instance, when comparing centralized and decentralized systems using LCA, the latter showed environmental benefits by preventing pollution at the source, recycling nutrients, and reducing the energy requirements. The factors that made a significant difference were water sources and nutrient emissions [20]. The idea of transitioning from a centralized to decentralized GW treatment system in a newly developed area and to a BW treatment system at a tourist resort has been explored by Morandi and Steinmentz [21] and Estévez et al. [22], respectively. In both cases, it was shown that, given specific boundary conditions, the existing centralized treatment options can be successfully integrated into transitional approaches to resource-oriented sanitation, or even completely replaced. When considering the decentralized scenario (membrane technology for the anaerobic digestion of the BW instead of the centralized greywater treatment), Estévez et al. [23] found a better environmental performance in terms of resource recovery and a 2 kWh·m−3 lower energy demand required for the operation, based on a sensitivity analysis. Even so, these kind of on-site recovery facilities must be seriously optimized in terms of global warming potential for the operation phase.
These examples highlight the need for LCA studies that should incorporate the environmental impacts of wastewater treatment systems that are suitable for transitional states and energetic benefits, or consider hybrid wastewater treatment options, as seen in Resende et al. [24]. It has been noted that, in addition to the scale, technology, operation, and products that determine the competition between centralized and decentralized systems, another important factor is the system boundaries considered in the LCA [23]. Given this, there are several challenges that will lead to further developments that must consider new data bases, new correlations for energy use at different scales, and the integration of LCA studies into environmental policy issues. Scale is an important factor in implementing decentralized systems in remote and sensitive areas. There are a few studies that address the issue of an optimal decentralized scale for different community sizes. Xue et al. [25] showed with LCA that urine source recovery systems, household-installed composting toilets, BW for energy recovery, and GW for reuse back to toilets, deployed at a community scale were better than centralized systems at a city scale in terms of eutrophication, global warming, and energy potentials. Cashman et al. [26] conducted an LCA and cost analysis under different scenarios of membrane bioreactors at different scales, designed for different population densities under a range of climate conditions. The results demonstrated the importance of a complex system analysis to understand the environmental and cost trade-offs of different technologies. Such an analysis is required before a community can make an informed decision about transitioning to membrane bioreactor technologies.
In another study, Kobayashi et al. [27] conducted a comparative LCA to evaluate the environmental impacts at different scales of decentralized GW treatment (CWs and membrane bioreactors), with different reuse options for a hypothetical community (a maximum of 3500 people equivalent) in regions with severe cold periods. In this case, it was shown that, in addition to the scale of the decentralized systems, the amount of reused water and the mix of electricity technologies are critical in determining certain LCA indicators such as the global warming potential, eutrophication potential, and human health (e.g., carcinogenic potential).
Providing wastewater infrastructure for touristic facilities in sensitive and/or remote areas, such as natural parks and mountainous regions, demands careful consideration to achieve environmental sustainability and minimize the impacts. To our knowledge, few studies have comprehensively compared the environmental impacts of decentralized wastewater treatment systems designed for such areas, and for high-seasonal tourist fluctuations that include the end-of-life stage and benefits beyond the system boundary. Through a comparative LCA, this study evaluates three decentralized wastewater treatment systems: a source separation sanitation module with a hybrid constructed wetland (S1), a sequential batch reactor (SBR) with a hybrid constructed wetland (S2), and a solar-powered composting toilet (S3). These systems were selected for their demonstrated effectiveness in pollution prevention and because of the need for decentralized solutions in remote areas. The comparison aims to advance sustainable diversity in the market and the LCA results will inform the future improvements of these systems, motivated by a commitment to nature conservation.

2. Materials and Methods

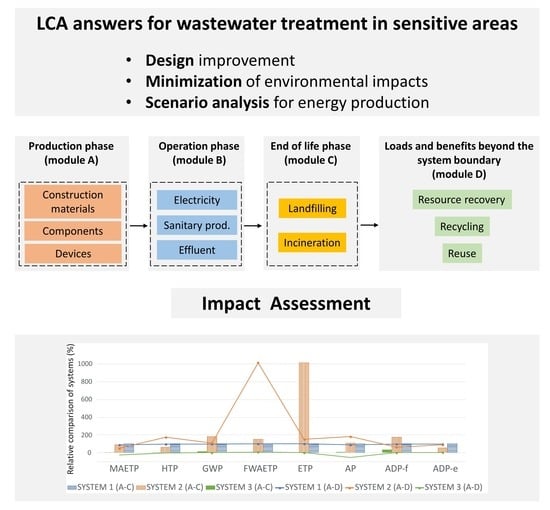
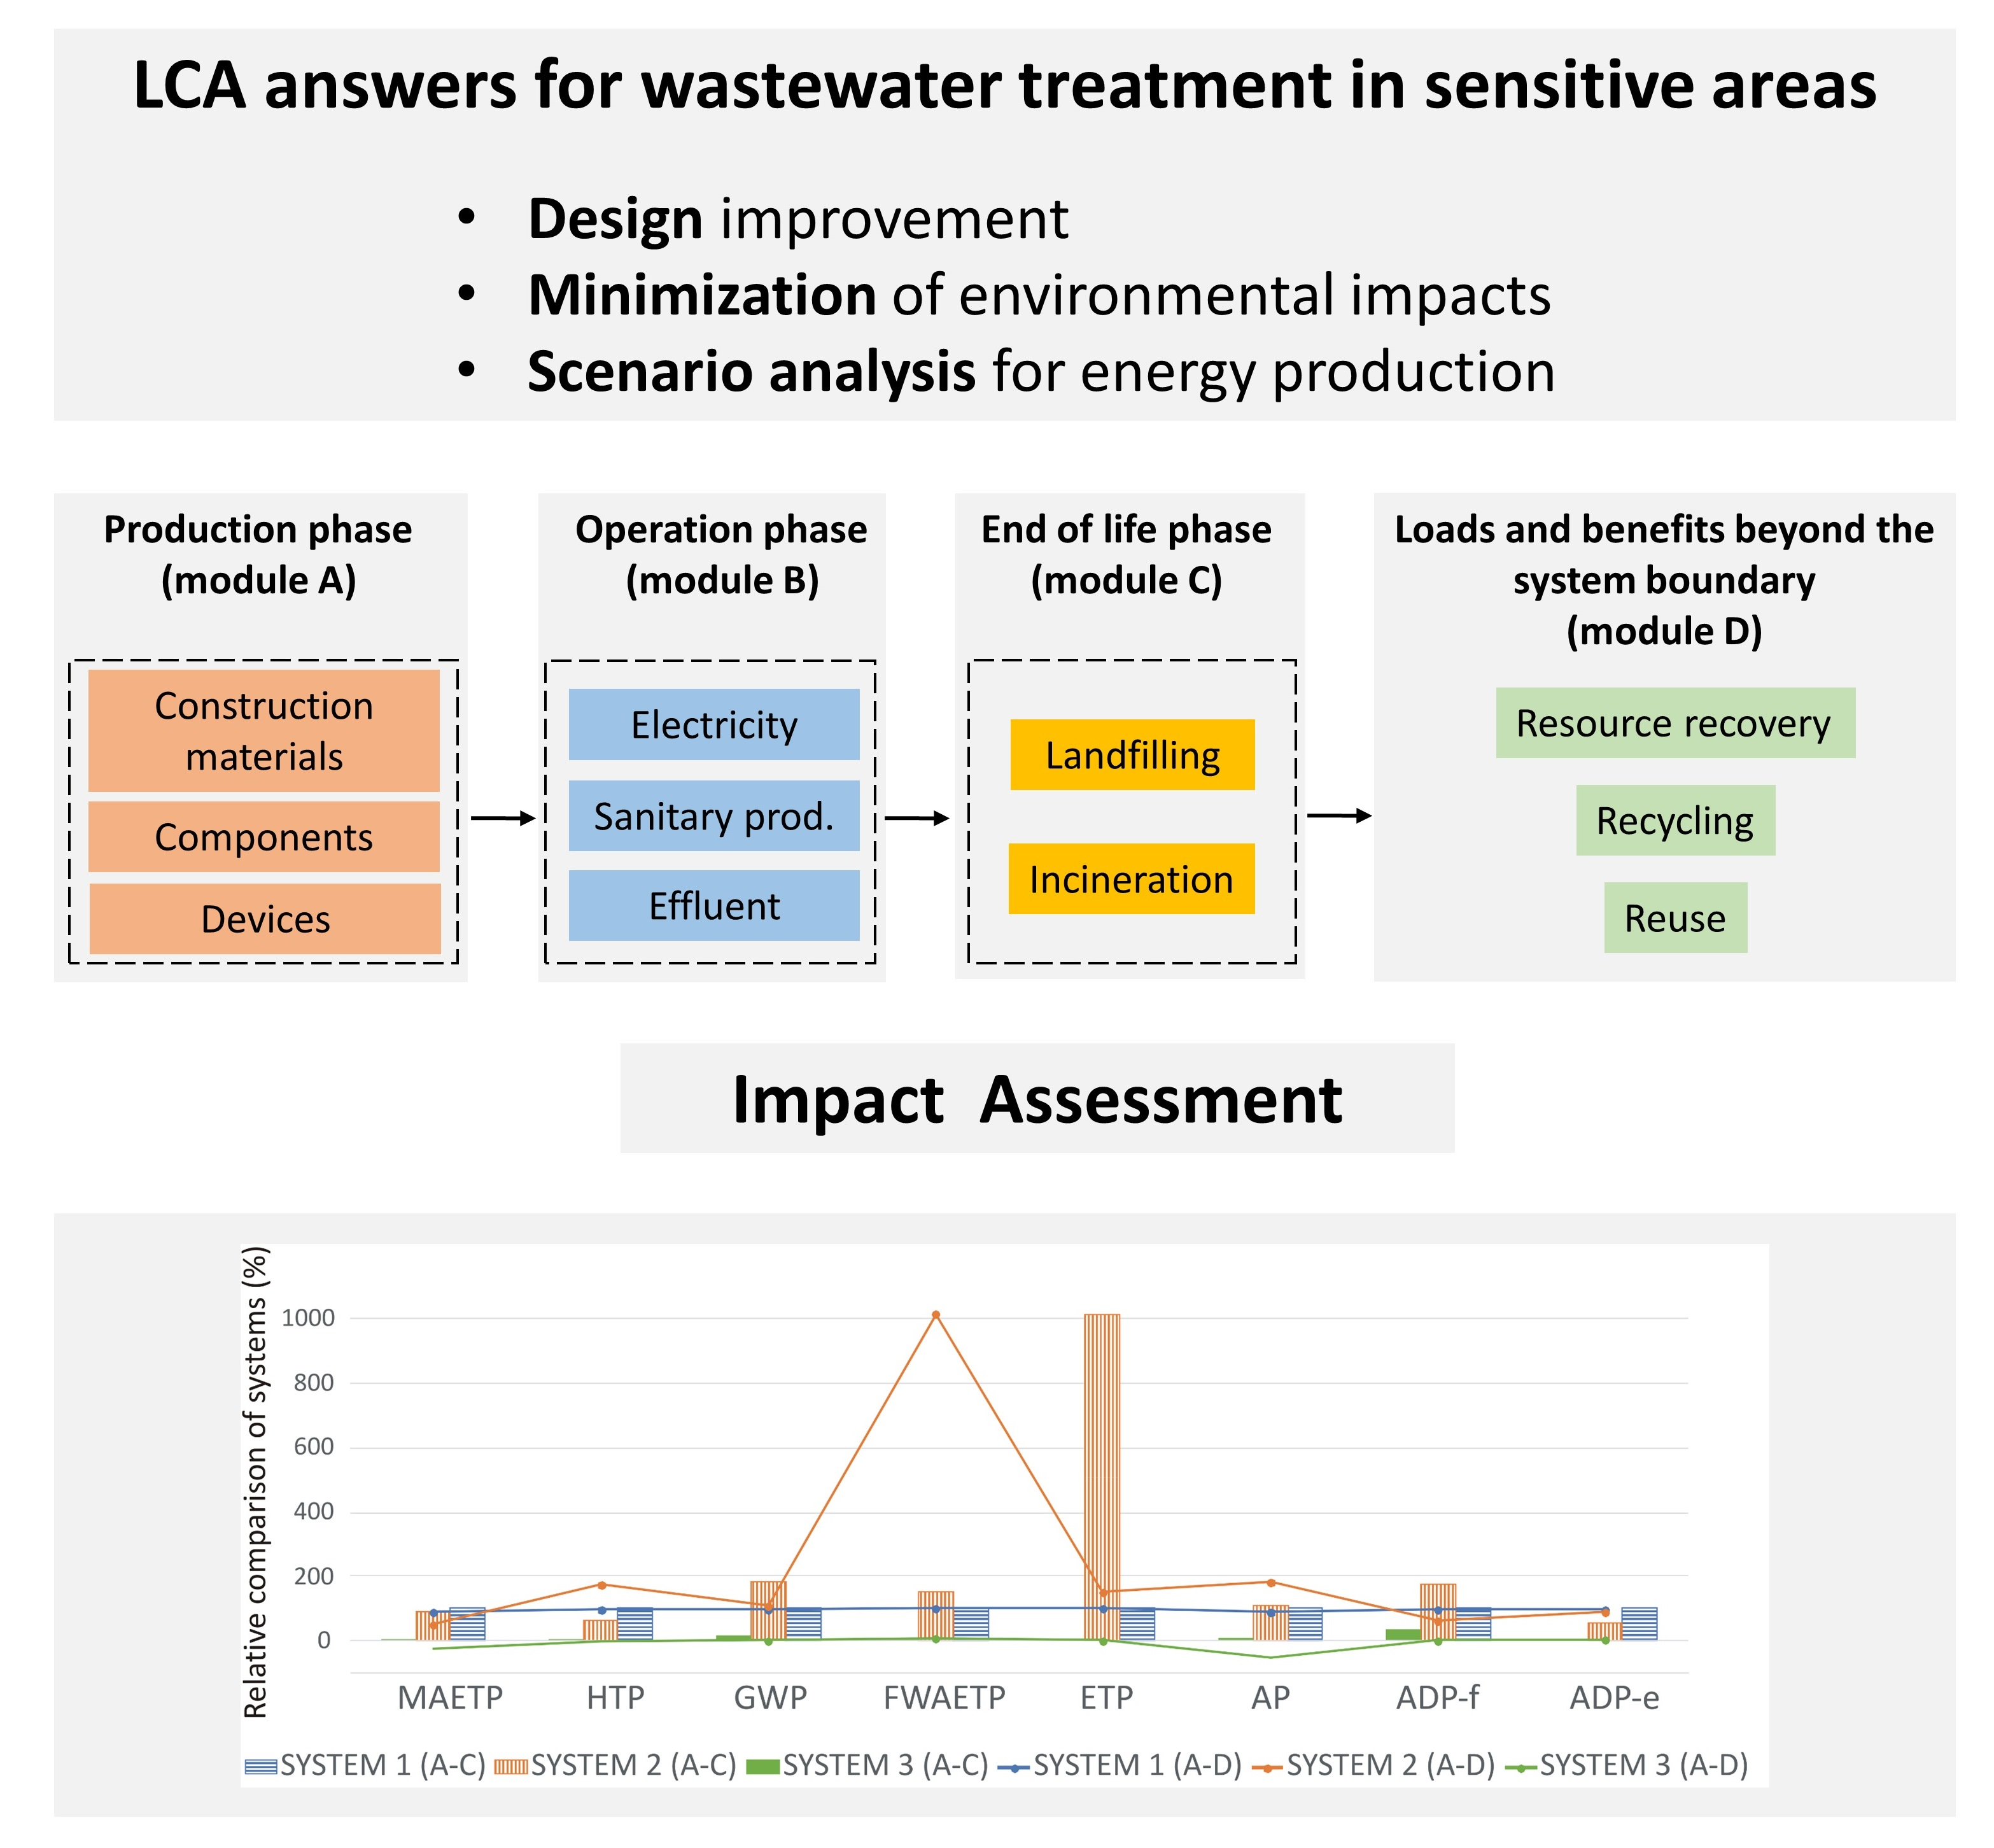
2.1. LCA Approach, Assumptions and Functional Unit

LCA is a technique used to quantify the environmental impact of a product system or service from raw material acquisition through end-of-life disposition. LCA is based on the quantification of all inputs (e.g., energy and raw material requirements) and outputs (e.g., environmental releases associated with each life cycle phase) [24]. The LCA method was applied in accordance with ISO 14040, ISO 14044, and EN 15804. We considered all the life cycle stages of the evaluated systems and calculated the environmental impacts for each stage. The CML 2001 Life Cycle Impact Assessment method (created by the Institute of Environmental Sciences of Leiden University) was applied in this study [28]. This method is one of the most common impact categories used in the LCA community and provides one of the most up-to-date practices for midpoint indicators. The results of the CML 2001 impact assessment method were presented in terms of the impact categories most relevant to GW and/or BW treatment systems, such as: the abiotic depletion of elements (ADP-e) [kg Sb eq.], the abiotic depletion of fossil resources (ADP -f) [MJ], the acidification potential (AP) [kg SO2 eq.], the eutrophication potential (EP) [kg Phosphate eq.], the freshwater aquatic ecotoxicity potential (FAETP) [kg DCB eq.], the global warming potential (GWP 100 years) [kg CO2 eq.], the human toxicity potential (HTP) [kg DCB eq.], and the marine aquatic ecotoxicity potential (MAETP) [kg DCB eq.].
The functional unit selected for the environmental assessment is the sanitary system used over a 30-year period, which is the expected lifetime of such systems [29]. It is assumed that the facility in a sensitive/remote area is open only during the tourist season (e.g., four months per year), so that 10,000 people visit the site and use the sanitation system per year (or season). In such a case, 300,000 people use the sanitation system over a 30-year period.
The Professional and Extension Database (last updated in 2022), which is integrated in the GaBi (professional LCA software), was used for the background inventory data.

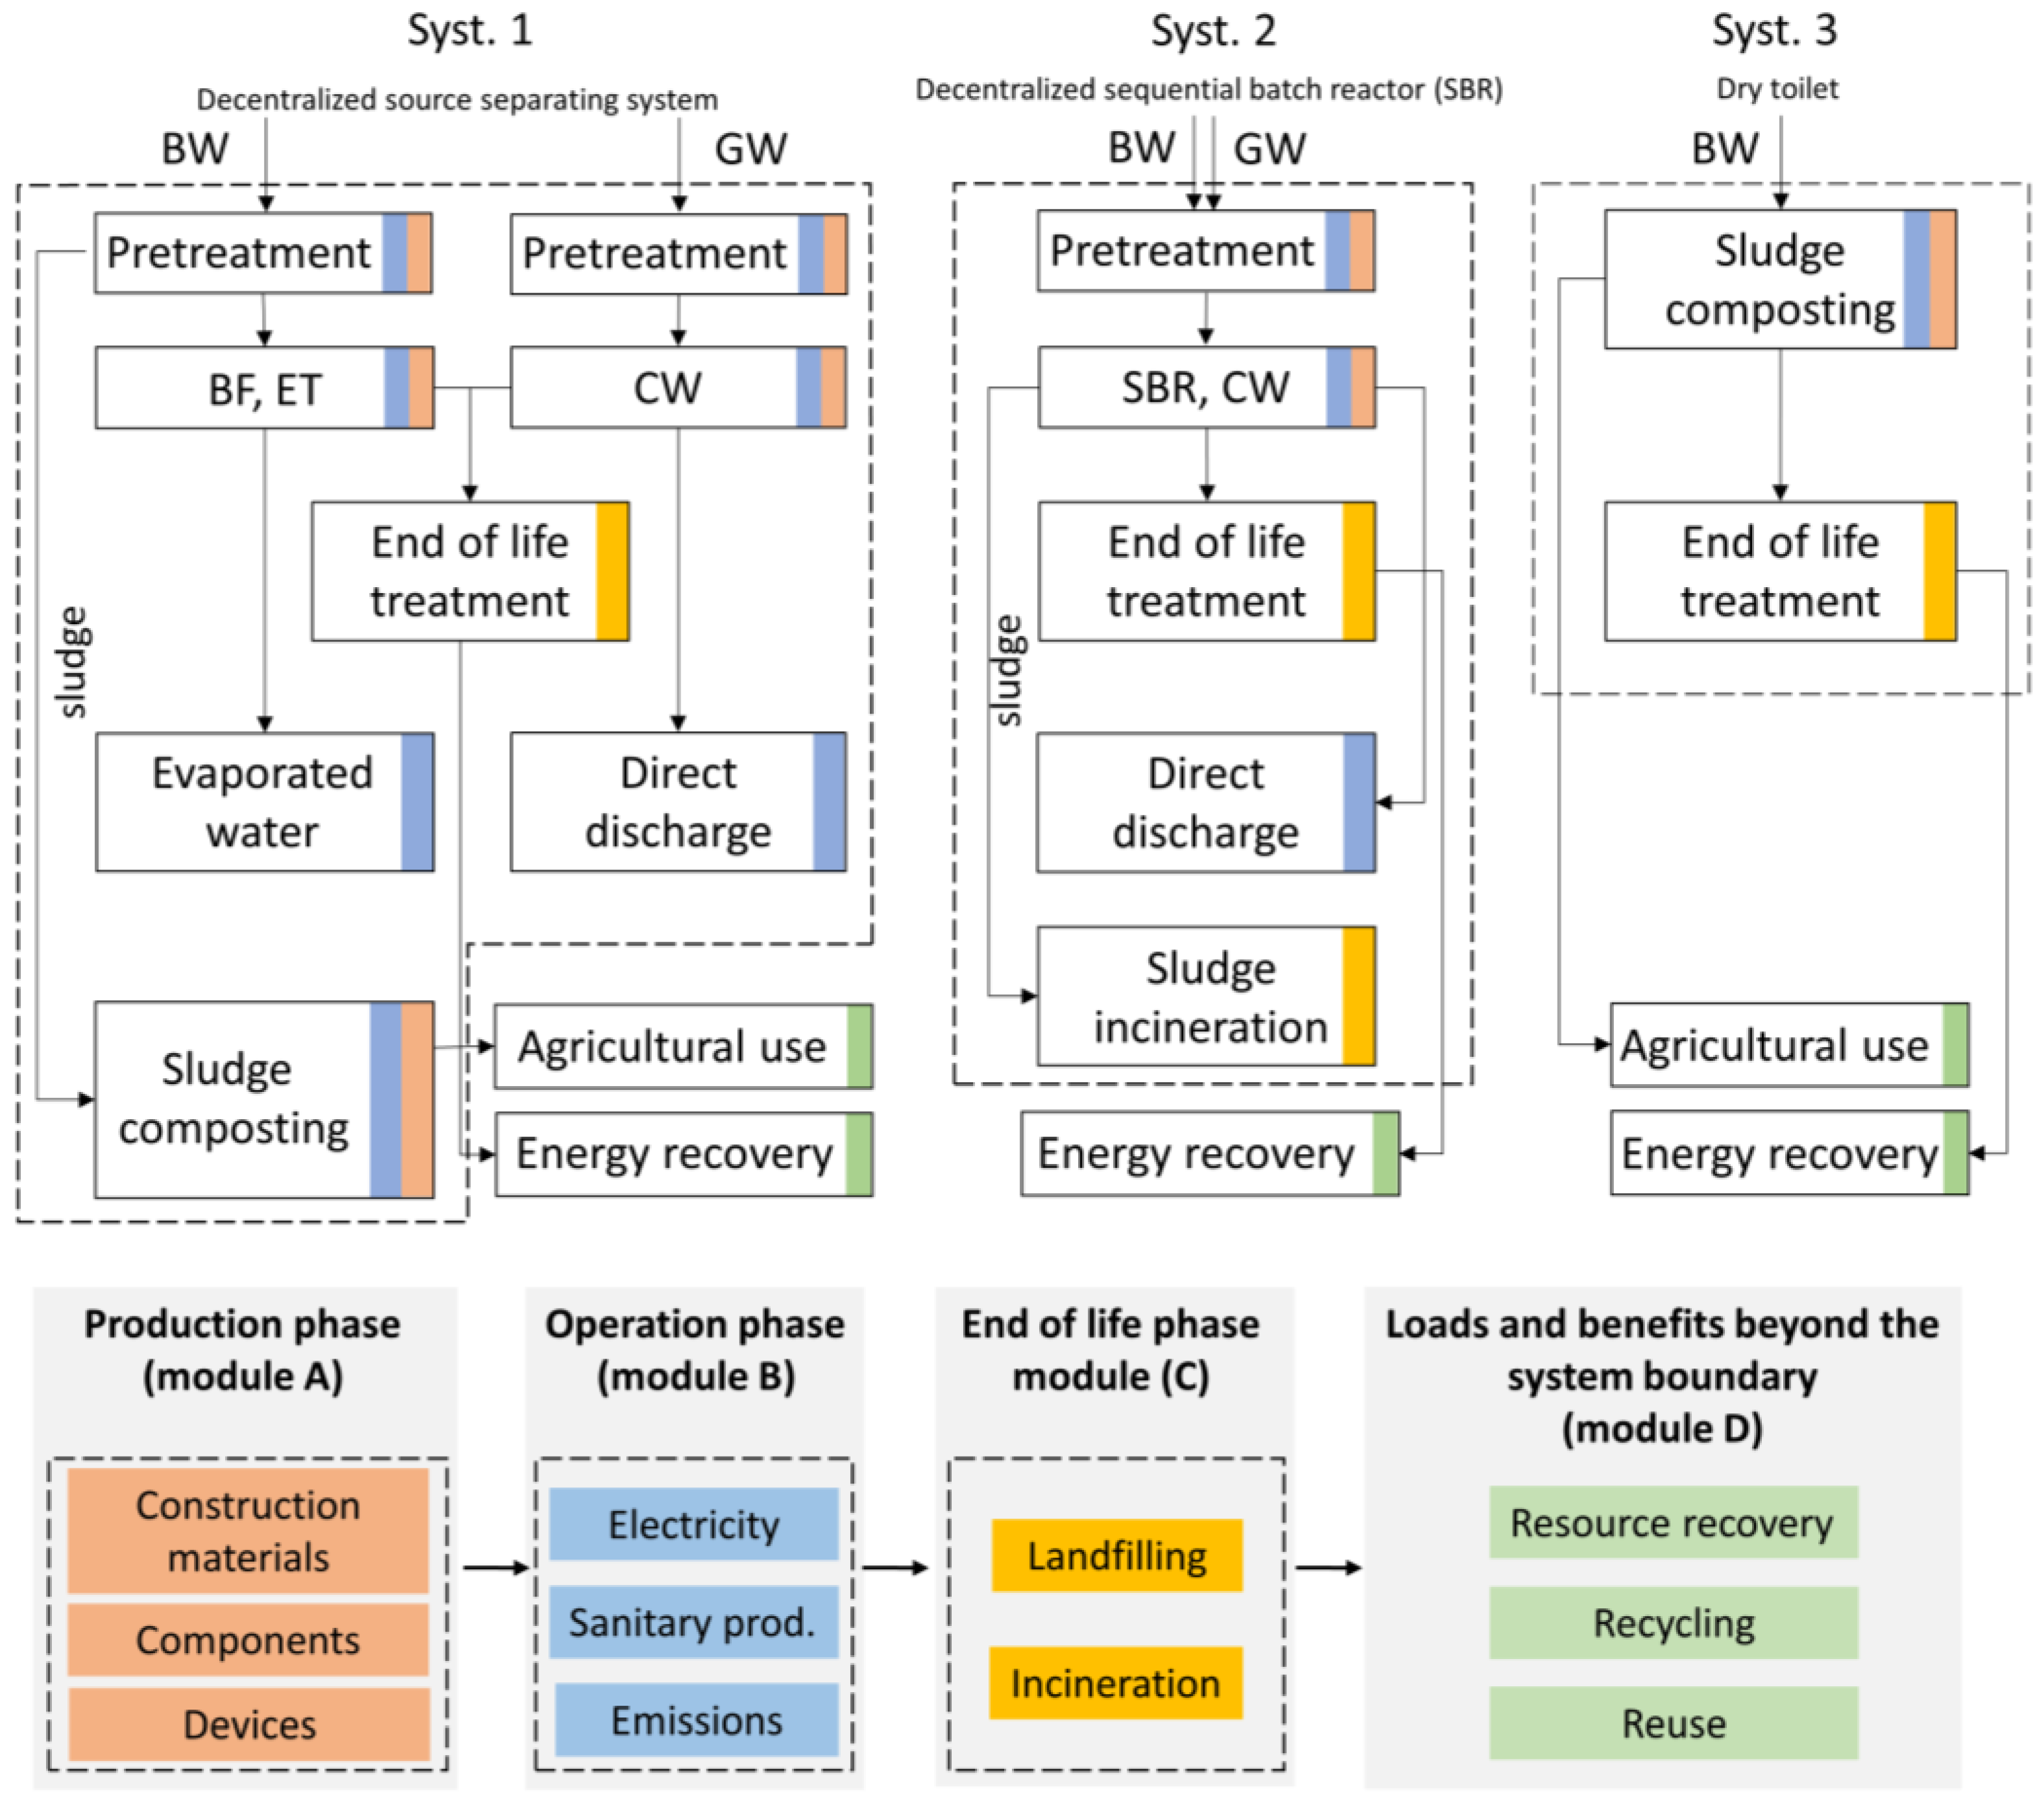
2.2. Description of Wastewater Treatment Systems and System Boundaries

The systems selected for this study can be installed in protected, sensitive areas, characterized by different environmental extremes (freezing or excessive temperatures) and subjected to technical challenges (their design, construction, operation, and integration into the local environment), but are also under the pressure of a high-seasonal fluctuation in tourists. Figure 1 describes the concept design of these systems.
S1 was a source separation system designed for the collection, separation, and treatment of BW and the GW on-site at a sanitary touristic facility on the coastline of Slovenia [1,30]. The BW (urine, faeces, and toilet paper) was collected using two vacuum toilets with a low water consumption (0.8 L/flush). The GW, from hand washing, was treated in a CW. The BW collected from the vacuum toilets was separated into two filters to obtain a liquid fraction and a solid fraction of the BW. The liquid fraction from the filters was then treated in a biofilter and recirculated in an evaporation module (an evaporation tank combined with a cascade dryer) powered by solar vacuum collectors, before the final evaporation. The resulting solids (sludge) from the filters were composted in a compost reactor.
S2 was a decentralized sequencing batch reactor (Compact SBR 21000) treating mixed wastewater (the GW from kitchen and showers and BW) from a tourist facility at high altitude in Slovenia. The wastewater was first screened through a grease trap and collected in a settling tank. From there, the wastewater was dosed into the aeration tank. The wastewater was finally treated in a CW before being released into the environment.
S3 was a dry toilet with solar collectors, designed for use in tourist facilities in the mountain region, including high altitudes. This system consisted of a wooden house containing a toilet unit and a compost container where the material (referred to as concentrated BW in this work) was collected and composted. When the container was full, it was moved and entered a secondary composting process. The composting process produced a certain amount of leachate (urine mixed with faeces) that was returned to the secondary composting process. A ventilation system prevented odours from the toilet while accelerating the composting process by heating it. The air was heated using the solar collectors attached to the house, and was directed into the room using a fan attached to the end of the ventilation pipe [5].
The system boundaries of the treatment systems include the construction (module A), use (module B), and end-of-life (module C) stages. Loads and benefits beyond the system boundary (module D) were also taken into account (Figure 1).
In the case of the construction stage (module A), the manufacturing of all relevant materials, building blocks, and devices was considered. The delivery distance of the materials is case specific; therefore, the delivery was excluded from the system boundaries. In the case of S1 and S2, it was assumed that these two sanitary systems were integrated into an existing tourist facility. For this reason, the construction of the building was not included in the LCA analysis. S3 was not part of the existing tourist facility, but a standalone wooden construction with two rooms (e.g., toilets).
The use stage (module B) is associated with the electricity consumption required for the operation of the systems, as well as the discharge of effluent water from S1 and S2 to the surface stream. In the case of S3, electricity was required only for ventilation to avoid bad odours. The use stage (module B) also includes the consumption of soap, water (S1 and S2), or hand sanitizer (S3).
The end-of-life stage (module C) includes landfilling or the incineration of construction waste generated after the demolition of wastewater treatment systems and the incineration of sludge (S2). Most construction waste is landfilled or recycled after the end-of-life stage of the sanitary systems, while wood components (S3) and geotextiles are incinerated.
Loads and benefits beyond the system boundary (module D) refer to the recycling, reuse, and/or energy recovery of the waste construction materials and other building blocks generated after the demolition of wastewater treatment plants, as well as the beneficial use of the compost derived from sludge (in agriculture as a substitute for mineral fertilizer). It is assumed that all the metal parts integrated into the sanitary systems can be recycled, as well as some of the components of pumps and solar collectors. Natural aggregates can be reused, while energy recovery refers to the incineration of wood components (S3) and geotextiles.
Sludges are generated in all systems, but their treatment differs. The sludge produced in S1 and S3 can be used as raw material for compost, which is free of pathogens. This compost can be used in agriculture. The sludge produced in S2, on the other hand, contains pathogens and must therefore be treated accordingly, usually by incineration at incineration plant.
The usage of sanitary systems is associated with toilet paper consumption. However, toilet paper consumption was not included in the LCA because it is the same for all three sanitary systems.
An additional simplification of the LCA study relates to the emissions (e.g., heavy metals) released to the soil from the use of compost as a substitute for mineral fertilizer in agricultural areas. This type of emissions was omitted from the system boundaries due to a lack of relevant data.

2.3. Life Cycle Inventory Details

The types and quantities of the construction materials and building blocks incorporated into each of the three GW and/or BW treatment systems are listed in Table 1, Table 2 and Table 3.
For S1, it was assumed that each person produces 1.3 L of BW (0.3 L of urine, 0.2 L of faeces, and 0.8 L of water for toilet flushing) and 1.2 L of GW (assuming the average water consumption for hand washing). In such a case, 300,000 people would produce 390 m3 of BW and 360 m3 of GW. After treatment in the biofilter, the liquid fraction of the BW is directed to an evaporation tank, where it is sanitized and evaporated. The GW, on the other hand, can either be discharged into the surface stream or reused after treatment with the CW. The parameters of the chemical oxygen demand (BOD = 41 mg/L), biochemical oxygen demand (COD = 89 mg/L), total phosphorus concentration (23 mg/L), ammonium concentration (33 mg/L), nitrogen dioxide concentration (0.3 mg/L), and nitrate concentration (7.3 mg/L) were considered to evaluate the impact of effluent discharge to surface water [30]. The S1 sanitation system, described in detail by Oarga-Mulec et al. [1], required 15.1 kWh of electricity per day. A total of 300,000 users of this sanitary system would produce about 3270 kg of sludge, which can be used as a raw material for compost production. The sludge was mixed with the ground bark of conifers, peat, and wheat bran in the ratio of 70%:5%:6.6%:18.3%. The compost obtained can be used as an additional source of phosphorus for agricultural purposes [1]. According to the Statistical Office of the Republic of Slovenia [31], 285 kg of mineral fertilizers are needed for one hectare of cropland. It was assumed that the same amount of compost is used per hectare of cultivated land. This compost is a substitute for mineral fertilizers.
In S2, each person was assumed to produce 14.1 L of BW (0.3 L of urine, 0.2 L of faeces, and 13.6 L of water for toilet flushing) and 1.2 L of GW (associated with hand washing). Both BW and GW are treated together in S2. Therefore, 4590 m3 of wastewater is treated, assuming 300,000 users of the sanitary system. Half of the wastewater treated in S2 is evaporated in the CW, while the rest (i.e., 2295 m3) is discharged into the surface stream. The same chemical parameters of effluent water were taken into account as considered in S1, with the same pollutant concentrations. However, the discharge of the effluent to surface water is significantly higher in S2 (2295 m3 versus 180 m3). S2, with the integration of a CW, requires about 20.6 kWh of electricity per day. During the service life of the S2, approximately 75,000 kg of sludge is produced, which is incinerated in the incineration plant.
In S3, each person was assumed to produce 0.2 L of faeces and 0.3 L of urine; both are collected in mobile containers. Since S3 does not use water, users of this sanitary system must disinfect their hands, for which an antibacterial agent is used. The consumption of hand sanitizer (based on isopropyl alcohol) is assumed to be 3 mL (i.e., 5 g) per person. The users of S1 and S2 wash their hands with tap water and soap consumption was assumed to be 1.5 g per hand washing, considering the data from Muñoz [32]. The electricity consumption for air ventilation is 0.48 kWh per day (two air ventilators, each consuming 0.24 kWh per day). The amount of sludge produced in S3 over a 30-year period is 38,400 kg, and it undergoes secondary composting to ensure its maturity and safety from pathogens. Thereafter, the toilet compost can be used on agricultural land, as in S1.
Data on material requirements, electricity consumption, and output flows were estimated primarily from previously published literature, annual reports, and additional data from all three systems’ manufacturers and operators. When data needed for the LCA calculations were not directly available, estimates were made based on available statistics and literature searches cited throughout the study.
Table 1. Life cycle inventory data for the construction of the source separation treatment system for blackwater and greywater (S1). Data gathered from literature [1,33].
Blackwater Treatment System
ComponentsUnitAmountMaterial
PumpsPieces6Electronic device
Biofilter * kg21Expanded clay
Blackwater collecting tankskg27Sewer pipe glass-fibre reinforced
Liquid fraction collecting tank (1 m3)kg45Sewer pipe glass-fibre reinforced
Cascade dryerkg15.6Steel
Evaporation tankkg58.3Steel
Solar vacuum collectorm215.6Sollar collector
Valveskg6.72Fitting brass
Plastic containerskg20HDPE
Sewer pipeskg10PVC
Heating pipekg2.5Copper
Insulationkg3.8EPS
Plexiglass lidkg0.07PMMA
Greywater treatment system (constructed wetland)
PumpsPieces2Electronic device
Valveskg1.94Fitting bras
Natural aggregate (0/2)kg7.200Limestone, crushed
Natural aggregate (16/32)kg36.000Limestone, crushed
Aerated pipesm6.8Rain drain pipe
Geotextilem2100PET
Plastic foilm240Polyethylene film
Plastic containerskg5PE-HD
Drainage pipesm18PVC
Distribution pipesm35PVC
Piesometersm3PVC
* The biofilter must be replaced at the end of each tourist season.
Table 2. Life cycle inventory data for the construction of the decentralized sequential batch reactor and constructed wetland (S2). Data gathered from literature [33,34].
Sequential Batch Reactor
ComponentsUnitAmountMaterial
CompressorsPieces8Electronic device
PumpsPieces2Electronic device
Valveskg8.73Fitting bras
Sequential Batch Reactorkg500HDPE
Wastewater settling tankskg1120HDPE
Sewer pipeskg8PVC
Constructed wetland
PumpsPieces2Electronic device
Valveskg1.94Fitting bras
Natural aggregate (0/2)kg7.200Limestone, crushed
Natural aggregate (16/32)kg36.000Limestone, crushed
Aerated pipesm6.8Rain drain pipe
Geotextilem2100PET
Plastic foilm240Polyethylene film
Plastic containerskg5PE-HD
Drainage pipesm18PVC
Distribution pipesm35PVC
Piesometersm3PVC
Table 3. Life cycle inventory data for the construction of the dry toilet (S3).
ComponentsUnitAmountMaterial
Gravelkg1000Limestone, crushed
Geotextilem23PET
Timberkg800Solid construction timber
Sewer pipeskg3PVC
Solar vacuum collectorm20.7Sollar collector
Plastic container kg15HDPE

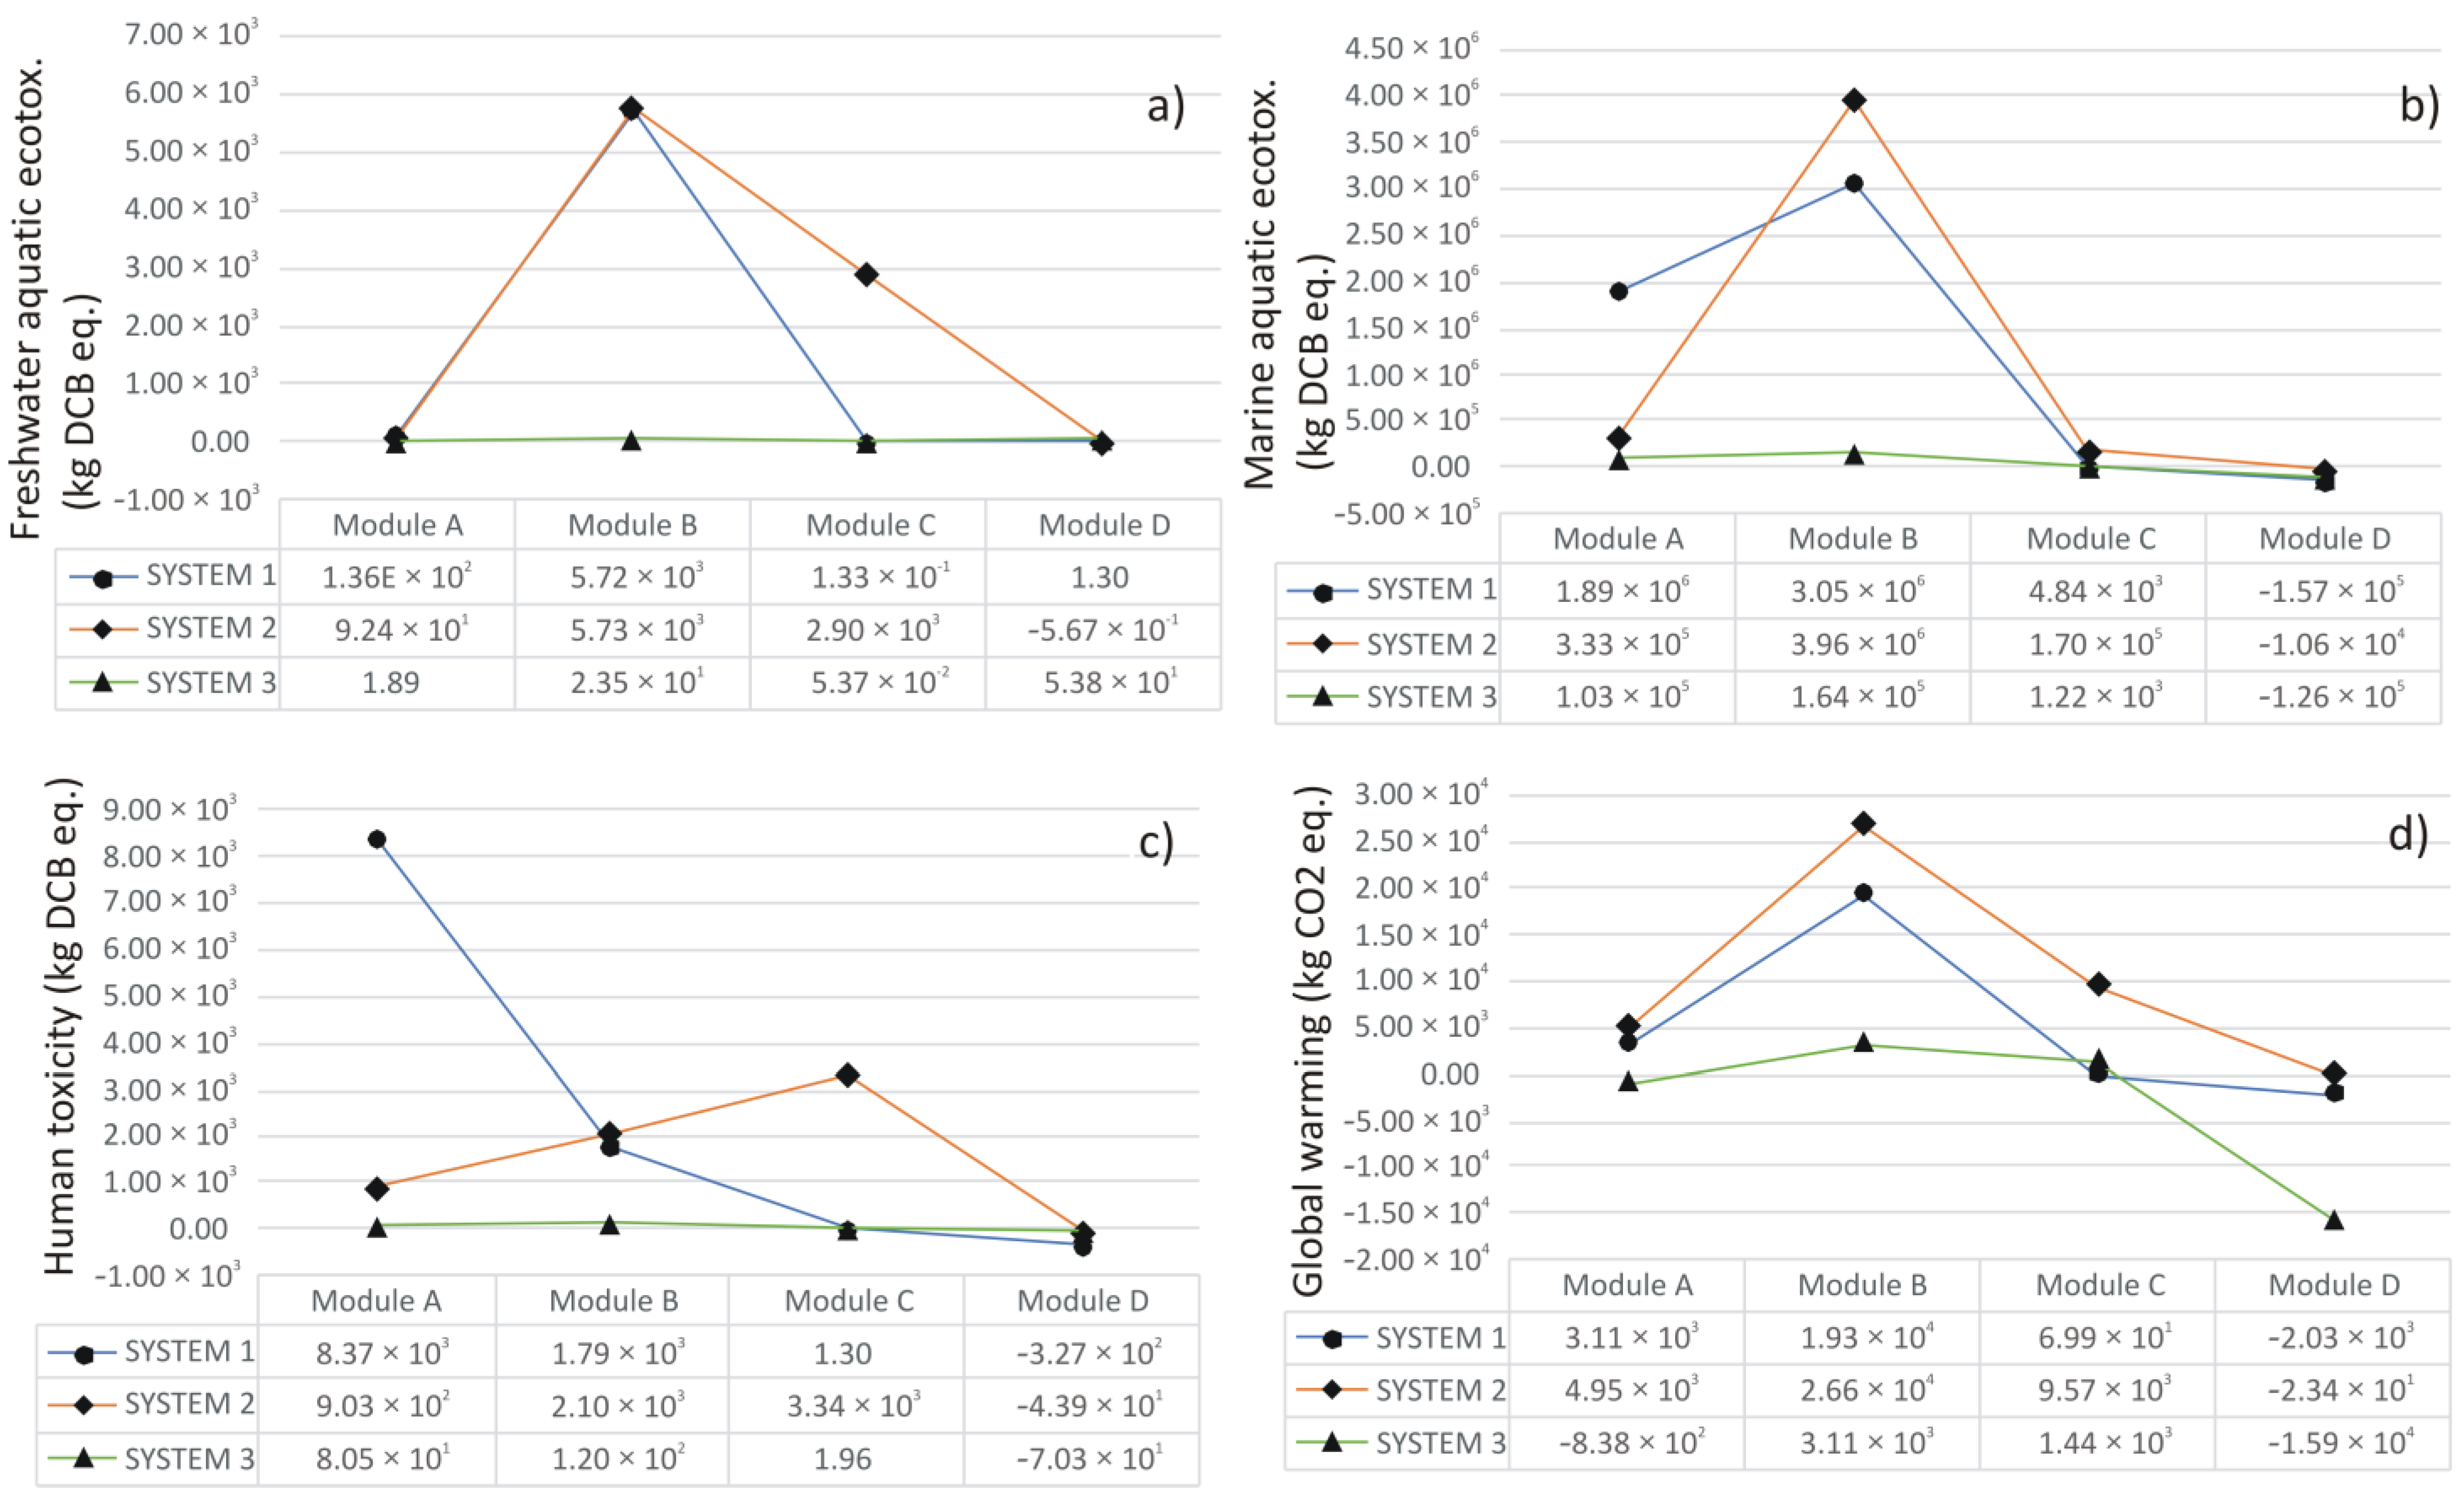
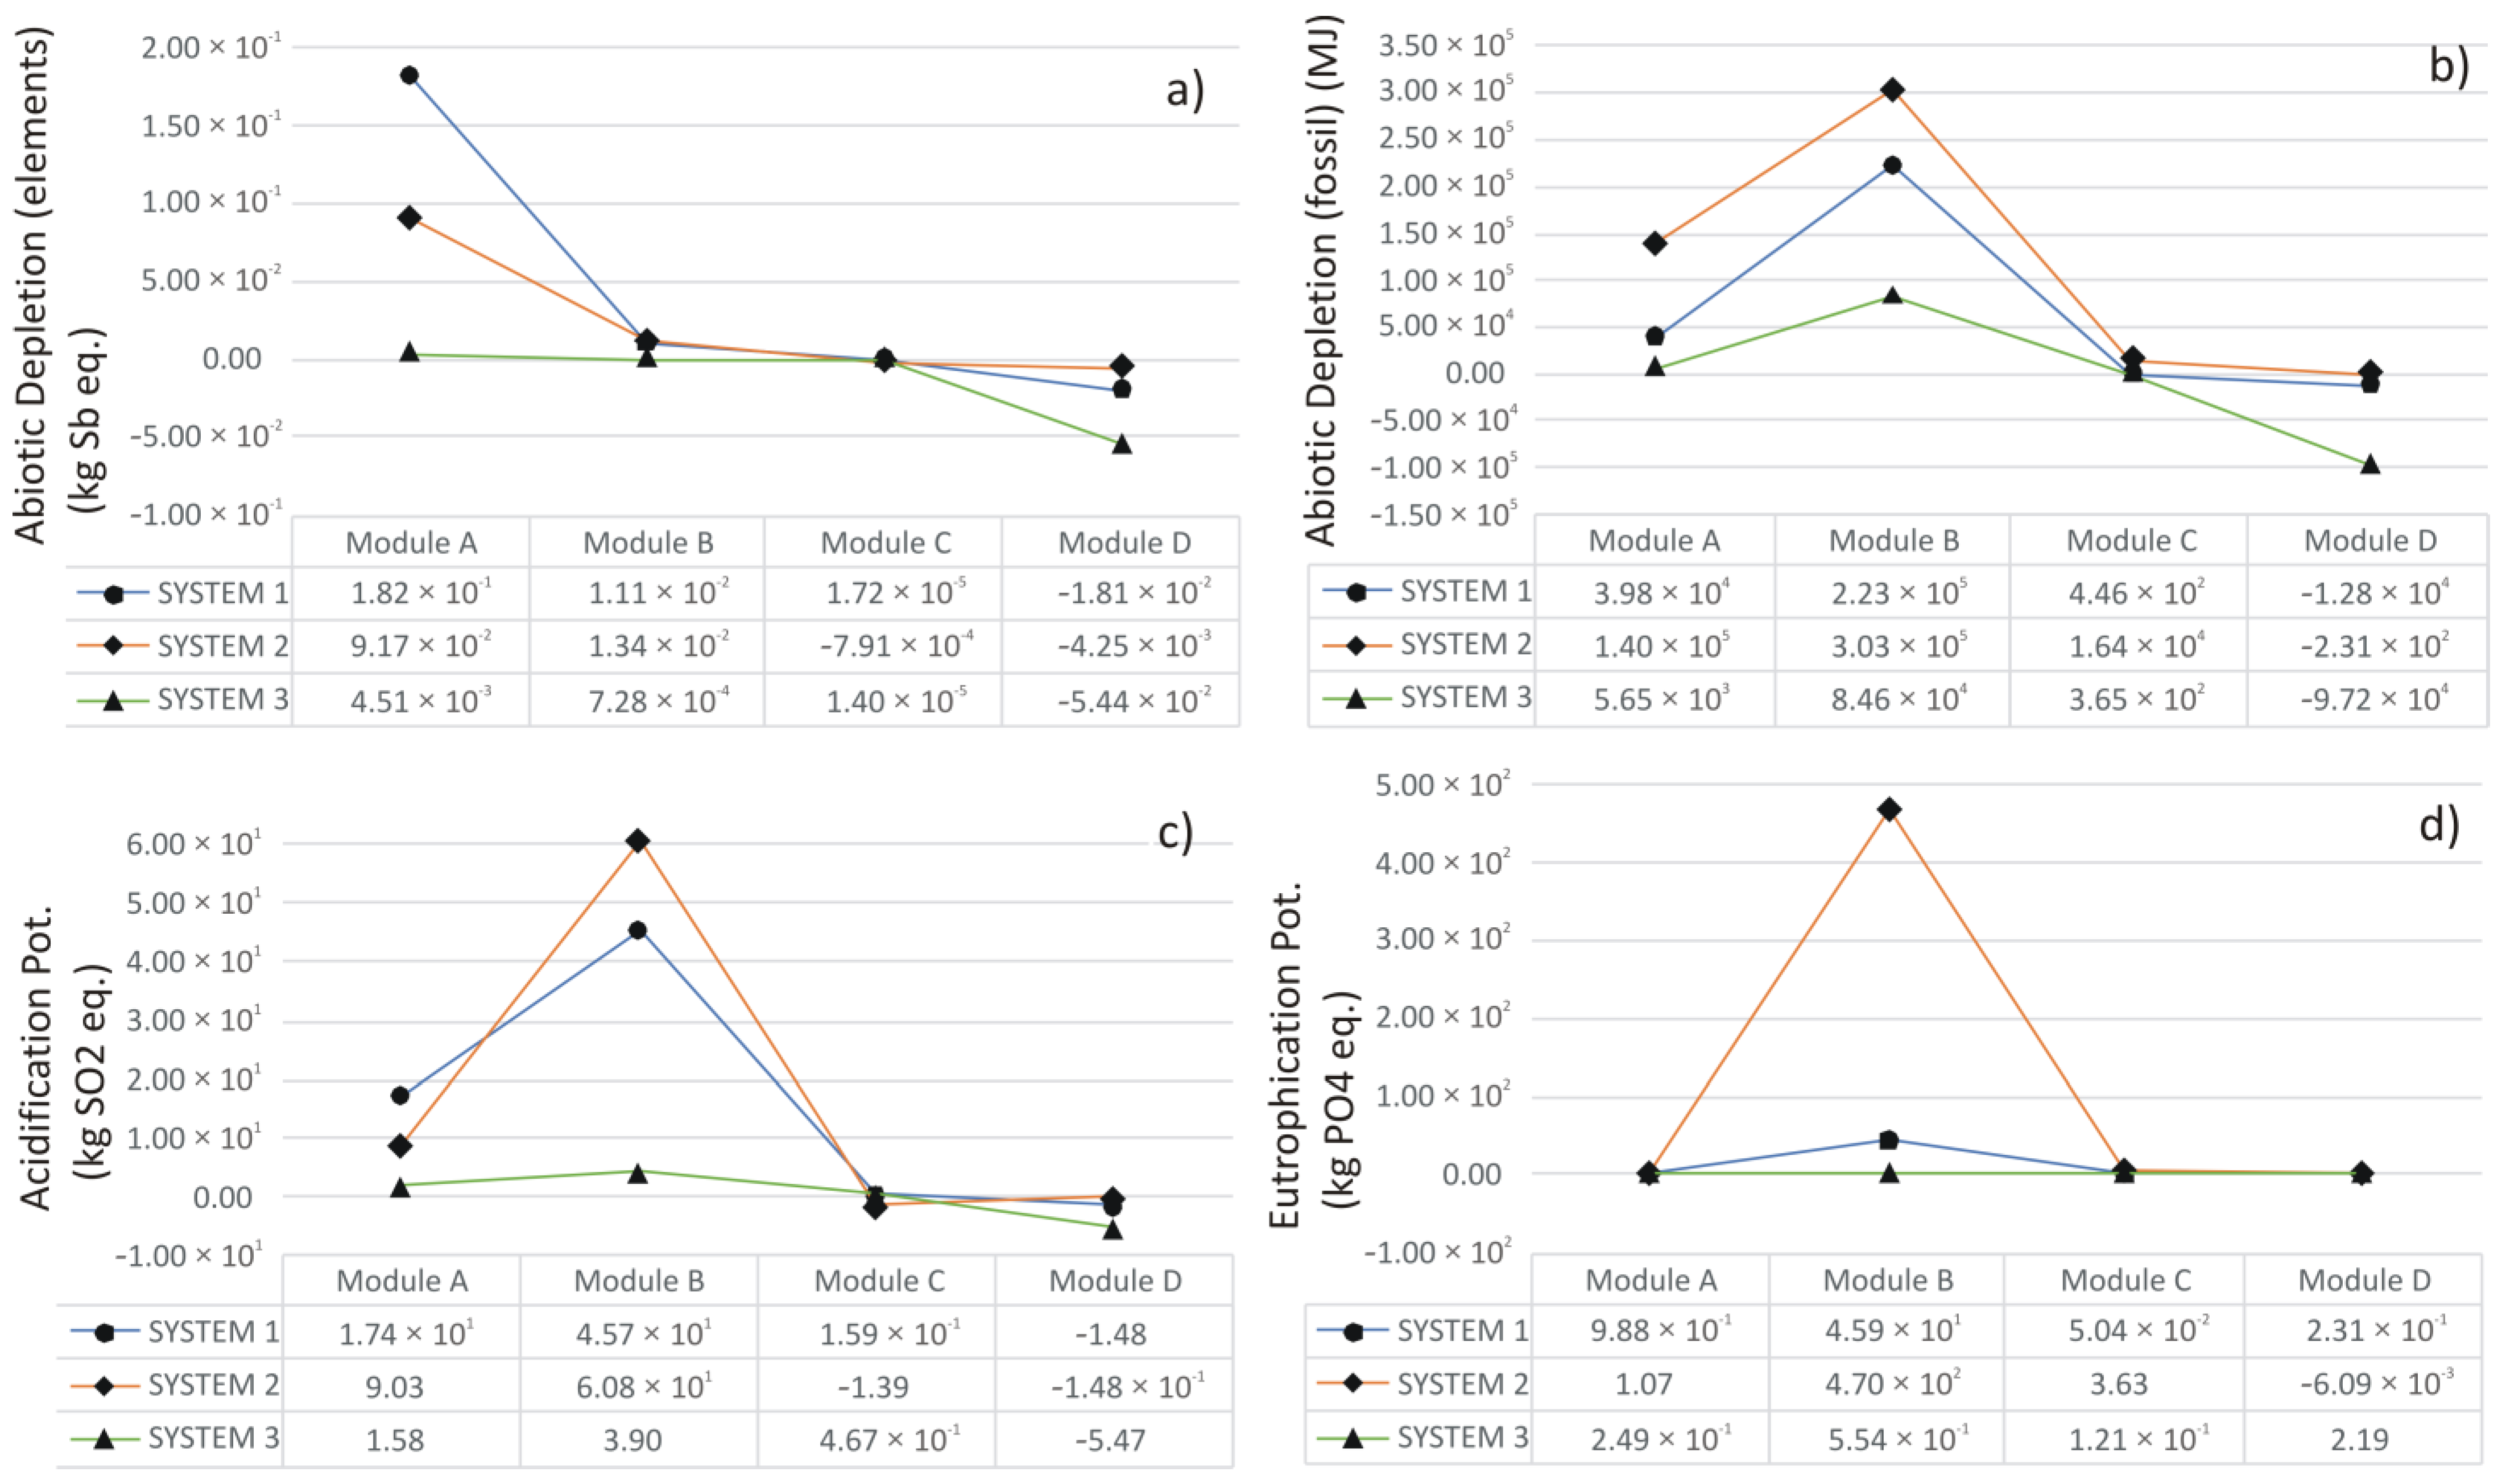
3. Results and Discussion

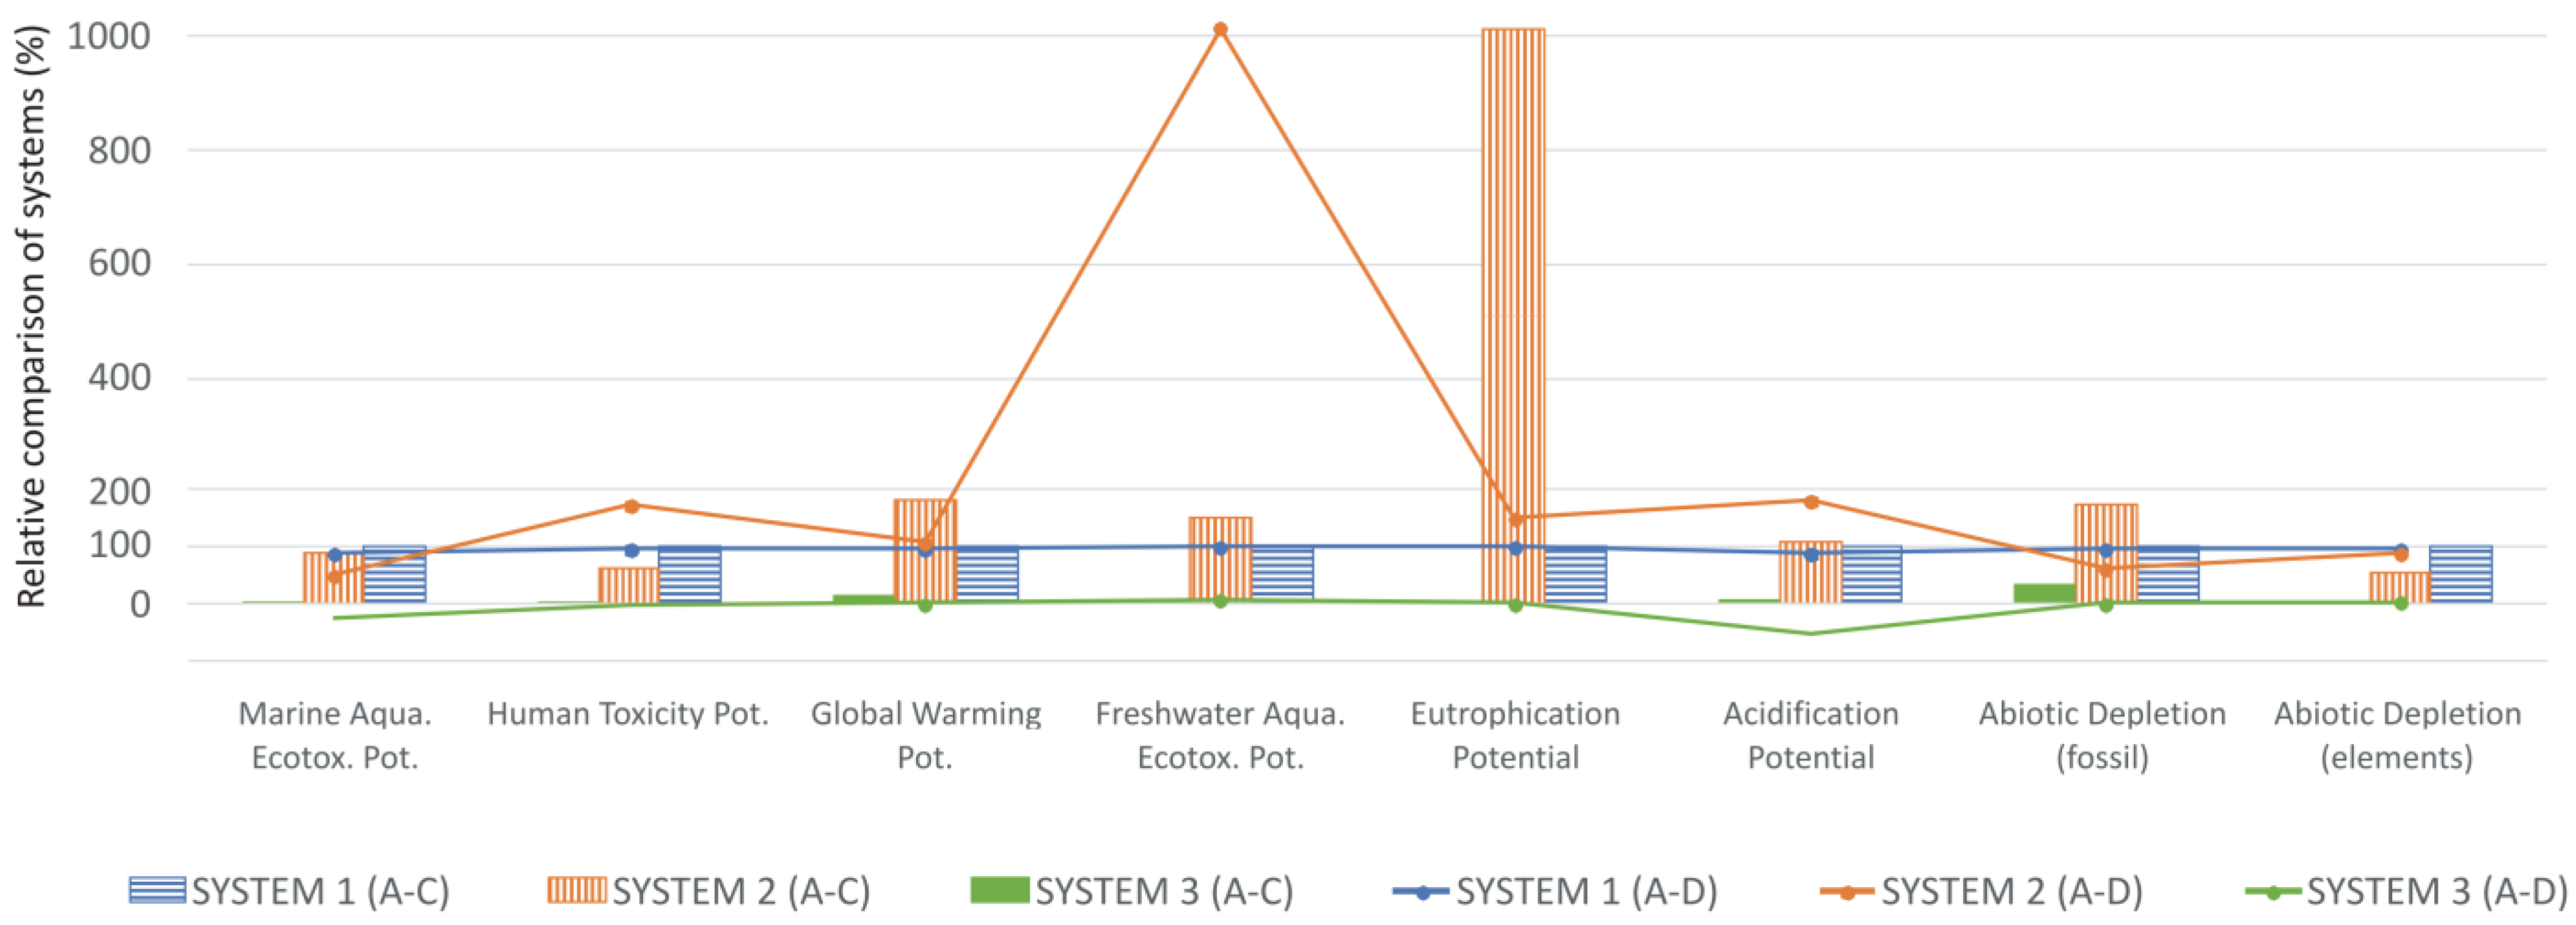
3.1. Comparison between Three Systems

The results of the LCA show that the environmental performance of S1 and S2 is relatively similar. S1 yields better results in terms of some impact categories, while S2 performs better with other impact categories. The differences are up to a factor of two, except for eutrophication. For this impact category, the impacts of S2 are an order of magnitude higher than those of S1. S3 results in significantly lower environmental impacts than S1 and S2, with the difference generally being an order of magnitude (Figure 2) (Table 4 and Table 5).
In terms of the abiotic depletion of elements, the differences between the three sanitary systems (Table 4) are related to their construction (e.g., the use of different construction materials and their quantities), while the differences in terms of the abiotic depletion of fossil resources are primarily related to the energy required to operate the systems. The solar collectors integrated into S1 contribute significantly to the abiotic depletion of elements in the life cycle of S1 (i.e., 50%), which is the main reason for the higher impact of this sanitary system compared to S2 (Table 1 and Figure S1 in the Supplementary Materials). The situation is exactly the opposite for the impact on the abiotic depletion of fossil resources. The electricity demand of S2 is about one third (36%) higher than that of S1, and the amount of plastic materials in the system is also higher, which is the main reason why S2 has almost twice the impact on the abiotic depletion of fossil resources than S1 (Table 4).
In the case of S3, the abiotic depletion potential of the elements is also mostly affected (83%) by the integration of the solar collector into the system. However, the surface area of the solar collector in S3 is much smaller (0.7 m2) than in S1 (15.6 m2), so the impact on the abiotic depletion potential of the elements is significantly lower (Table 5). The impact on the abiotic depletion of fossil resources in S3 is mainly influenced by the use of hand sanitizer. Isopropyl alcohol, which is produced from fossil resources, is often used as disinfection agent, as in this case.
In terms of the global warming potential, the ratio between S1 and S2 is about 1 versus 1.8 (Table 4). There are three main reasons for this difference. The first reason is the electricity consumption in the use stage (module B), which is higher in S2 than in S1 (20.1 kWh per day versus 15.6 kWh per day). The second reason is that S2 consists of a larger quantity of plastic components that must be disposed of at the end of the system’s service life (module C). Additionally, the third reason is the incineration of the sludge generated in S2 (also a part of module C). The sludge generated in S2 is not suitable for the production of compost that can be utilized in agricultural areas, as is the case with the sludge generated in S1 or S3. Due to its pathogens, the sludge produced at S2 is considered hazardous waste, and is incinerated at an incineration facility. The incineration of the sludge requires the use of support fuel (natural gas) and electricity, and the incineration is associated with a significant amount of greenhouse gas emissions. Our results show that in the life cycle of S2, the incineration of the sludge accounts for 23% of the emissions affecting global warming, the electricity required for its operation accounts for 65%, while the contribution of the construction waste disposal (part of module C) is only 9%.
In the case of S3, the construction stage (module A) yields a reverse impact on the GWP. This GWP mitigation is related to the carbon sequestration in biomass, since S3 is mainly composed of wood construction materials. However, after the end-of-life of the system, these wood materials are incinerated for heat recovery. For this reason, a significant amount of the emissions (39%) impacting the GWP in the life cycle of S3 are attributed to the end-of-life stage, module C, respectively. Most of the GWP emissions (54%) in the life cycle of S3 are attributed to the production of the hand sanitizer agent, which is required by toilet users to disinfect their hands.
In terms of eutrophication, the impacts of S1 and S2 are mainly related to effluent water (accounted in module C). However, the impact of S2 is higher than the impact of S1 by a factor of 10 (Table 4), which is due to the higher discharge of effluent water to the environment (2295 m3 in S2 versus 180 m3 in S1). In contrast, in the case of S3, the eutrophication potential is low because the system generates no effluent to environment. The eutrophication potential of S3 is mainly related to the production of the construction materials (module A).
The acidification potential of the three systems is mainly affected by the electricity needed to operate the sanitary systems. Consequently, S2 has an 8% higher impact on acidification than S1. The impact of S3 reaches only 9% of the impact of S1 (Table 4), since the electrical energy demand of S3 is also relatively low.
The results show that the production of soap consumed in the use stage for hand washing (S1 and S2) has significant impact on the freshwater aquatic eco-toxicity (see module B in Figure 3 and Tables S1 and S2 in the Supplementary Materials). This impact is almost for a factor of 260 greater than those associated with the use of isopropyl alcohol-based hand sanitizers (S3). A recent LCA study found that the use of isopropanol-based hand sanitizers is more environmentally friendly than hand washing with soap [35]. Another LCA analysis revealed that the potential to reduce the environmental impact of green cleaning products such as handwashing soaps may lie in the product formulas and ingredients [36]. In the case of S2, the sludge treatment process (e.g., incineration) results in a significant burden in terms of the freshwater aquatic eco-toxicity potential, contributing 33% of the total impact. The sludge incineration and the relatively large amount of construction waste disposed of in a landfill after the end-of-life of S2 are the main reasons why S2 yields almost a 50% higher impact on the freshwater aquatic eco-toxicity than S1. S3 has a lower impact on freshwater aquatic eco-toxicity compared to S1 and S2 (Table 4).
In terms of the marine aquatic eco-toxicity, S2 yields a 10% lower impact than that of S1 (Table 4). In the case of S1, the emissions affecting the marine aquatic eco-toxicity are increased mainly because of the solar collectors (module A), whose production is relatively harmful to the environment in terms of the marine aquatic eco-toxicity (contributing 31% of the total impact attributed to S1). In the case of S3, the majority of the emissions causing an impact on the marine aquatic eco-toxicity are related to the production of the solar collectors. However, due to the relatively small area of solar collectors required, the impact of S3 on the marine aquatic eco-toxicity is much smaller than that of S1 and S2 (Table 4).
In terms of human toxicity, S1 has an almost 40% higher impact than S2 (Table 4). Human toxicity impacts of S1 are mostly attributed to the construction materials, which account for 82% of the total parameter value (Figure 3). Solar collectors (in the case of S1 and S3) and copper pipes (in the case of S1) integrated into the sanitary systems are the construction materials responsible for most of the impact; other construction materials make a relatively small contribution (Figures S1 and S3 in the Supplementary Materials). However, in the case of S2, the situation is different. This sanitary system does not include solar collectors or components made of copper. The construction materials contribute only 14% of the human toxicity impacts, while the sludge incineration accounts for 53% of the human toxicity impacts in the life cycle of S2. In the case of S3, the human toxicity impacts are mainly due to the production of hand sanitizers (46%) and the construction materials (40% of the total parameter value) (Table S3 in the Supplementary Materials).

3.2. Benefits and Loads beyond the System Boundary

The benefits and loads beyond the system boundary (module D) are generally reported separately, as these credits/burdens are not accounted in the total environmental footprint of the systems studied (Figure 2).
The treatment of the sludge generated in S1 and S3 is related to the production of compost and its use in agricultural areas. Considering the hypothesis that compost substitutes mineral fertilizers in agriculture, such a beneficial use of sludge leads to environmental benefits in terms of the abiotic depletion of elements and several other impact categories. The sludge treatment in S3 is the same as in S1, however the amount of sludge produced is about 12 times higher because S3 does not provide as efficient a sludge decomposition as S1. Thus, S3 yields a relatively large amount of compost that can be used as a valuable raw material in agriculture. The benefits resulting from the avoided production of mineral fertilizers, due to the utilization of compost on agricultural land, outweigh the other burdens affecting the abiotic depletion of elements, abiotic depletion of fossil resources, and global warming potential in the construction (module A), use (module B), and end-of-life (module C) stages of S3, resulting in reverse impacts (Figure 3 and Figure 4).

3.3. Scenario with Solar (Photovoltaic) Panels for In-Site Production of Electricity

For the LCA study, the average European (EU-28) electricity grid mix was considered. This grid mix consists of electricity generated mainly in thermal power plants (about 38%, half from natural gas and half from coal) and in nuclear power plants (about 25%). In total, 23% of the electricity derives from renewable sources (e.g., hydropower and solar energy) [37]. Due to the relatively high share of electricity from thermal power plants, the production of this electricity is associated with emissions that significantly affect the global warming potential, acidification potential, abiotic depletion of fossil resources, and also toxicity related impacts.
It was hypothesized that the environmental impacts of the sanitary systems under discussion could be reduced by installing solar panels (photovoltaics) to generate electricity on site. In fact, the results of the LCA confirmed that, in such a case, the global warming impact of S1 is reduced by 81%, of S2 by 60%, and of S3 by 16% (Table 6).
The installation of solar panels (photovoltaics) to generate electricity on the site also leads to a significant reduction of the systems on the abiotic depletion of fossil resources, acidification, and marine aquatic ecotoxicity (S1 and S3). In the case of S3, these environmental improvements are less significant; the impacts are reduced by a maximum of 19%, in terms of acidification and marine aquatic ecotoxicity (Table 6). However, photovoltaic does not reduce the impact on abiotic depletion of elements, and in fact increases this impact significantly, especially in the case of S2 (Table 6), which requires more photovoltaic panels than S1 or S3.

3.4. Potential to Reduce the Eutrophication Potential of S1 and S2

GW can be reused for toilet flushing after its treatment with the CW, instead of being discharged into the environment (or surface stream). In such a case, the emissions affecting eutrophication can be significantly reduced (i.e., by 78% in the case of S1 and even by 97% in the case of S2). An additional benefit of wastewater reuse is the reduction of the water consumption at the source (i.e., the conservation of groundwater reserves).

3.5. Comparison with Other Studies and Perspectives

Comparing different LCA studies of wastewater treatment for small communities is challenging; the reason is not only due to differences in size, treatment technology, and treatment efficiency, but also to the coverage of system boundaries and the agreement/compatibility of the functional units between LCA studies (the amount of wastewater treated, person equivalents). Guidelines would be required for LCA practitioners to give them instructions on how to conduct harmonized and transparent LCAs of wastewater treatment technologies. Only in such a way would it be possible to conduct reliable comparisons among different LCA studies related to wastewater treatment.
Even when the functional units of two different LCA studies refer to person equivalents, caution is needed when making comparisons, because the amount of wastewater generated per person per day (e.g., GW) varies considerably. For example, Garfí et al. [38] assessed the environmental impact of an activated sludge wastewater treatment system designed for small communities, considering the construction and operation stages (modules A and B). In this case, 1500 people produced 292.5 m3 of wastewater per day, which means that one person produced 195 L of wastewater per day. The global warming potential associated with the treatment of 195 L of wastewater in the activated sludge system is 0.25 kg CO2 equivalents.
In our study, 78 people must use S1 to generate 195 L of GW and BW. The treatment of such an amount of wastewater, associated with modules A and B, results in 5.85 kg CO2 equivalents, which affects the global warming potential. In S2, 13 people generated 195 L of GW and BW, resulting in 1.8 kg CO2 equivalents associated with the wastewater treatment. However, when calculating the global warming potential for a user of S1 or S2, the footprint is relatively lower in the case of S1 (0.075 kg CO2 equivalents per user) compared to S2 (0.14 kg CO2 equivalents per user). This example shows that calculating the results of the LCA for a given amount of treated wastewater, rather than for users (or person equivalents), can lead to controversial results when dealing with decentralized wastewater systems. The proper definition of the functional unit is therefore of significant importance when benchmarking the environmental sustainability of decentralized wastewater systems.
Another comparison refers to the study by Gao et al. [39], who evaluated the environmental performance of composting toilets. They reported that a composting toilet generates about 133 kg CO2 equivalents per person per year, considering the construction and use stages, while the dry toilet (S3) in our study has an inverse impact on global warming when only the construction (module A) and use (module B) life cycle stages are considered (Figure 3). The reason for this difference is mainly related to the construction materials. In the construction stage, wooden structures have the opposite effect on global warming than structures made of non-renewable resources and components (e.g., bricks, concrete, plastic containers).

4. Conclusions

When benchmarking between S1 and S2, S1 is favoured. The main weakness of S2 is that the sludge produced contains pathogens. For this reason, the sludge must be treated as hazardous waste. Incineration, as the most common treatment method, has significant environmental impacts, especially in terms of human toxicity and global warming. S1 shows better results than S2 in terms of the abiotic depletion of fossil resources, acidification potential, eutrophication potential, global warming potential, and freshwater aquatic eco-toxicity potential. For the impacts related to the depletion of elements, human toxicity, and marine aquatic eco-toxicity, the situation is reversed.
The LCA results indicated that S3 can be considered to be the most environmentally sustainable of the three sanitary systems. The facility for S3 is a relatively simple construction, consisting mainly of wooden boards, while S1 and S2 are relatively sophisticated systems. They require parts/building blocks composed of different materials such as large volume plastic tanks, pumps, pipes (metal and plastic), and valves (metal). In addition, S1 requires a steel evaporation tank and solar collectors to provide the heat energy for the evaporation of the liquid fraction of BW. Unlike the other two systems, S3 does not require water for flushing and does not generate effluent to surface waters, except for a small amount of leachate that is recycled through secondary composting.
The scenario analysis of the three treatment systems indicated that the environmental performance of the systems could be improved if on-site solar panels (photovoltaics) were installed to generate electricity, instead of using electricity from the grid. However, solar panel production has a significant impact on the abiotic depletion of elements, which means that these impacts would increase. Their design and application should be flexible depending on the end user and location, and the market also needs system diversity. S3 is not necessarily the best option; social perception in particular can be a strong limitation. Nevertheless, all of these systems fit into the concept of a circular economy because they have features such as source separation, decentralization, and resource conservation (i.e., electricity, water, and recycled nutrients).

Supplementary Materials

The following supporting information can be downloaded at: https://www.mdpi.com/article/10.3390/su15043832/s1, Figure S1: Relative contribution of construction materials and building block to construction stage (module A) of the source separation sanitation system with hybrid constructed wetland; Figure S2: Relative contribution of construction materials and building block to construction stage (module A) of the sequential batch reactor (SBR) with hybrid constructed wetland; Figure S3: Relative contribution of construction materials and building block to construction stage (module A) of the solar-powered composting toilet; Table S1: LCA results for the source separation sanitation system with hybrid constructed wetland; Table S2; LCA results for the sequential batch reactor (SBR) with hybrid constructed wetland; and Table S3: LCA results for the solar-powered composting toilet.

Author Contributions

A.O.-M. and J.T. conceived and designed the paper. A.O.-M., J.T., P.D.J. and P.G. collected the data. All authors contributed to analyse the data and write the paper. All authors have read and agreed to the published version of the manuscript.

Funding

This research received no external funding.

Institutional Review Board Statement

Not applicable.

Informed Consent Statement

Not applicable.

Data Availability Statement

Data are contained within the article or Supplementary Materials.

Acknowledgments

The research was financially supported by the Slovenian Research Agency (Research Core Funding No. P2-0273 and P2-0412). Our thanks also to Katja Gregorič for providing valuable support for data collection.

Conflicts of Interest

The authors declare no conflict of interest. The founding sponsors had no role in the design of the study; in the collection, analyses, or interpretation of data; in the writing of the manuscript, and in the decision to publish the results.

References

  1. Oarga-Mulec, A.; Jenssen, P.D.; Krivograd-Klemenčič, A.; Uršič, M.; Griessler Bulc, T. Zero-discharge solution for blackwater treatment at remote tourist facilities. J. Clean. Prod. 2017, 166, 798–805. [Google Scholar] [CrossRef]
  2. Schories, G. IWAPIL—Innovative wastewater treatment applications for isolated locations. Desalination 2008, 224, 183–185. [Google Scholar] [CrossRef]
  3. Stefanakis, A.I. Constructed wetlands for sustainable wastewater treatment in hot and arid climates: Opportunities, challenges and case studies in the Middle East. Water 2020, 12, 1665. [Google Scholar] [CrossRef]
  4. Oteng-Peprah, M.; Acheampong, M.A.; deVries, N.K. Greywater characteristics, treatment systems, reuse strategies and user perception—A review. Water Air Soil Pollut. 2018, 229, 255. [Google Scholar] [CrossRef] [PubMed] [Green Version]
  5. Kelova, M. Assessment of a Prototype of Composting Toilet. Field Scale Study Assessing the Design, Performance and Potential of the Prototype. Master’s Thesis, Norwegian University of Life Science, Ås, Norway, August 2015. [Google Scholar]
  6. Simha, P.; Karlsson, C.; Viskari, E.L.; Malila, R.; Vinnerås, B. Field testing a pilot-scale system for alkaline dehydration of source-separated human urine: A case study in Finland. Front. Environ. Sci. 2020, 8, 168. [Google Scholar] [CrossRef]
  7. Alagha, O.; Allazem, A.; Bukhari, A.A.; Anil, I.; Mu’azu, N.D. Suitability of SBR for wastewater treatment and reuse: Pilot-scale reactor operated in different anoxic conditions. Int. J. Environ. Res. Public Health 2020, 17, 1617. [Google Scholar] [CrossRef] [Green Version]
  8. Moges, M.E.; Todt, D.; Janka, E.; Heistad, A.; Bakke, R. Sludge blanket anaerobic baffled reactor for source-separated blackwater treatment. Water Sci. Technol. 2018, 78, 1249–1259. [Google Scholar] [CrossRef] [Green Version]
  9. Moges, M.E.; Todt, D.; Eregno, F.E.; Heistad, A. Performance study of biofilter system for on-site greywater treatment at cottages and small households. Ecol. Eng. 2017, 105, 118–124. [Google Scholar] [CrossRef]
  10. Jenssen, P.D.; Mæhlum, T.; Krogstad, T.; Vråle, L. High performance constructed wetlands for cold climates. J. Environ. Sci. Health A 2005, 40, 1343–1353. [Google Scholar] [CrossRef]
  11. Ergas, S.J.; Amador, J.; Boyer, T.; Friedler, E. Onsite and decentralized wastewater management systems. J. Sustain. Water Built Environ. 2021, 7, 02021001. [Google Scholar] [CrossRef]
  12. Jiang, L.; Huang, X.; Wang, F.; Liu, Y.; An, P. Method for evaluating ecological vulnerability under climate change based on remote sensing: A case study. Ecol. Indic. 2018, 85, 479–486. [Google Scholar] [CrossRef]
  13. Melelli, L. Geodiversity: A new quantitative index for natural protected areas enhancement. Geoj. Tour. Geosites 2014, 13, 27–37. [Google Scholar]
  14. Kovačič, G.; Petrič, M.; Ravbar, N. Evaluation and quantification of the effects of climate and vegetation cover change on karst water sources: Case studies of two springs in South-Western Slovenia. Water 2020, 12, 3087. [Google Scholar] [CrossRef]
  15. Baum, R.; Luh, J.; Bartram, J. Sanitation: A global estimate of sewerage connections without treatment and the resulting impact on MDG progress. Environ. Sci. Technol. 2013, 47, 1994–2000. [Google Scholar] [CrossRef] [PubMed]
  16. Stark, J.S.; Corbett, P.A.; Dunshea, G.; Johnstone, G.; King, C.; Mondon, J.A.; Power, M.L.; Samuel, A.; Snape, I.; Riddle, M. The environmental impact of sewage and wastewater outfalls in Antarctica: An example from Davis station, East Antarctica. Water Res. 2016, 105, 602–614. [Google Scholar] [CrossRef]
  17. Decree on the Emission. Decree on the emission of substances and heat when discharging waste water into waters and the public sewage system. Uradni List. Repub. Slov. 2012, 64, 6392–6428. [Google Scholar]
  18. Decree on the Discharge. Decree on the discharge and treatment of urban wastewater. Uradni List. Repub. Slov. 2015, 98, 12234–12256. [Google Scholar]
  19. Corominas, L.; Byrne, D.M.; Guest, J.S.; Hospido, A.; Roux, P.; Shaw, A.; Short, M.D. The application of life cycle assessment (LCA) to wastewater treatment: A best practice guide and critical review. Water Res. 2020, 184, 116058. [Google Scholar] [CrossRef]
  20. Corominas, L.; Foley, J.; Guest, J.S.; Hospido, A.; Larsen, H.F.; Morera, S.; Shaw, A. Life cycle assessment applied to wastewater treatment: State of the art. Water Res. 2013, 47, 5480–5492. [Google Scholar] [CrossRef]
  21. Morandi, C.; Steinmetz, H. How does greywater separation impact the operation of conventional wastewater treatment plants? Water Sci. Technol. 2019, 79, 1605–1615. [Google Scholar] [CrossRef]
  22. Estévez, S.; González-García, S.; Feijoo, G.; Moreira, M.T. How decentralized treatment can contribute to the symbiosis between environmental protection and resource recovery. Sci. Total Environ. 2022, 812, 151485. [Google Scholar] [CrossRef] [PubMed]
  23. Estévez, S.; Feijoo, G.; Moreira, M.T. Environmental synergies in decentralized wastewater treatment at a hotel resort. J. Environ. Manag. 2022, 317, 115392. [Google Scholar] [CrossRef] [PubMed]
  24. Resende, J.D.; Nolasco, M.A.; Pacca, S.A. Life cycle assessment and costing of wastewater treatment systems coupled to constructed wetlands. Resour. Conserv. Recycl. 2019, 148, 170–177. [Google Scholar] [CrossRef]
  25. Xue, X.; Hawkins, T.R.; Schoen, M.E.; Garland, J.; Ashbolt, N.J. Comparing the life cycle energy consumption, global warming and eutrophication potentials of several water and waste service options. Water 2016, 8, 154. [Google Scholar] [CrossRef] [Green Version]
  26. Cashman, S.; Ma, X.; Mosley, J.; Garland, J.; Crone, B.; Xue, X. Energy and greenhouse gas life cycle assessment and cost analysis of aerobic and anaerobic membrane bioreactor systems: Influence of scale, population density, climate, and methane recovery. Bioresour. Technol. 2018, 254, 56–66. [Google Scholar] [CrossRef]
  27. Kobayashi, Y.; Ashbolt, N.; Davies, E.; Liu, Y. Life cycle assessment of decentralized greywater treatment systems with reuse at different scales in cold regions. Environ. Int. 2020, 134, 105215. [Google Scholar] [CrossRef]
  28. Guinée, J.B.; Gorrée, M.; Heijungs, R.; Huppes, G.; Kleijn, R.; de Koning, A.; van Oers, L.; Wegener Sleeswijk, A.; Suh, S.; Udo de Haes, H.A.; et al. Handbook on Life Cycle Assessment. Operational Guide to the ISO Standards; I: LCA in perspective. IIa: Guide. IIb: Operational annex. III: Scientific background; Kluwer Academic Publishers: Dordrecht, The Netherlands, 2002; p. 692. [Google Scholar]
  29. Buonocore, E.; Mellino, S.; Angelis, G.; Liu, G.; Ulgiati, S. Life cycle assessment indicators of urban wastewater and sewage sludge treatment. Ecol. Indic. 2016, 94, 13–23. [Google Scholar] [CrossRef] [Green Version]
  30. Cenčič, T. Ugotavljanje Učinkovitosti Čiščenja in Ponovne Uporabe Črne in Sive Vode v Sanitarnem Objektu v Krajinskem parku Sečoveljske Soline (Determining Efficiency of Cleaning and Reuse of Black and Gray Wastewater in Wastewater Treatment Facility in Sečovlje Salina Nature Park). Bachelor’s Thesis, University of Ljubljana, Ljubljana, Slovenia, 3 September 2012. [Google Scholar]
  31. Statistical Office of Republic of Slovenia 2015. Available online: https://www.stat.si/StatWeb/en/news/index/6110 (accessed on 9 June 2022).
  32. Muñoz, I. Country-specific life cycle inventories for human excretion of food products. Int. J. Life Cycle Assess. 2021, 26, 1794–1804. [Google Scholar] [CrossRef]
  33. Brix, H.; Arias, C.A. Danish guidelines for small-scale constructed wetland systems for onsite treatment of domestic sewage. Water Sci. Technol. 2005, 51, 1–9. [Google Scholar] [CrossRef]
  34. Gerbec, P. Wastewater Treatments in Protected Natural Heritage Areas in Slovenia: Current Status and Perspectives. Master’s Thesis, University of Nova Gorica, Slovenia, Balkans, 10 December 2019. [Google Scholar]
  35. Duane, B.; Pilling, J.; Saget, S.; Ashley, P.; Pinhas, A.R.; Lyne, A. Hand hygiene with hand sanitizer versus handwashing: What are the planetary health consequences? Environ. Sci. Pollut. Res. 2022, 29, 48736–48747. [Google Scholar] [CrossRef]
  36. Van Lieshout, K.G.; Bayley, C.; Akinlabi, S.O.; von Rabenau, L.; Dornfeld, D. Leveraging life cycle assessment to evaluate environmental impacts of green cleaning products. Procedia CIRP 2015, 29, 372–377. [Google Scholar] [CrossRef]
  37. Sphera. Electricity Grid Mix; AC, Technology Mix; Consumption Mix, to Consumer; <1 kV (en), 2018. Available online: http://gabi-documentation-2022.gabi-software.com/xml-data/processes/155a3c36-6185-4a54-bea8-87bcad6727f8.xml (accessed on 3 December 2022).
  38. Garfí, A.; Flores, L.; Ferrer, I. Life Cycle Assessment of wastewater treatment systems for small communities: Activated sludge, constructed wetlands and high rate algal ponds. J. Clean. Prod. 2017, 161, 211–219. [Google Scholar] [CrossRef]
  39. Gao, H.; Zhou, C.; Li, F.; Han, B.; Li, X. Economic and environmental analysis of five Chinese rural toilet technologies based on the economic input-output life cycle assessment. J. Clean. Prod. 2017, 163, S379–S391. [Google Scholar] [CrossRef]
Figure 1. Systems description and boundaries: BF, biofilter; BW, blackwater; ET, evaporation tank; CW, constructed wetland; GW, greywater; and SBR, sequencing batch reactor.
Sustainability 15 03832 g001
Figure 2. Relative comparison of the sanitary systems. System 1 is set as a reference (e.g., 100%). Module D (loads and benefits beyond system boundaries) is typically not included in the results (column plots). Inclusion of module D is presented in line plots.
Sustainability 15 03832 g002
Figure 3. Contribution of different life cycle stages (e.g., modules) of three systems on impact categories associated with: (a) freshwater aquatic ecotoxicity; (b) marine aquatic ecotoxicity; (c) human toxicity; and (d) global warming.
Sustainability 15 03832 g003
Figure 4. Contribution of different life cycle stages (e.g., modules) of three systems on impact categories associated with: (a) abiotic depletion (elements); (b) abiotic depletion (fossil); (c) acidification potential; and (d) eutrophication potential.
Sustainability 15 03832 g004
Table 4. Relative comparison of S1, S2 and S3 regarding their environmental impacts (sum of modules A, B and C). S1 is set as a reference (1.0).
Impact CategoryS1S2S3
Abiotic Depletion of elements (ADP-e)1.00.540.03
Abiotic Depletion of fossil (ADP-f)1.01.740.34
Acidification Potential (AP)1.01.080.09
Eutrophication Potential (EP)1.010.120.02
Freshwater Aquatic Ecotoxicity Pot. (FAETP)1.01.490.004
Global Warming Potential (GWP 100 years)1.01.830.16
Human Toxicity Potential (HTP)1.00.620.02
Marine Aquatic Ecotoxicity Pot. (MAETP)1.00.900.05
Table 5. Environmental performance of three sanitary systems as the sum of modules A to C. For comparison, the environmental performance was also calculated considering module D: loads and benefits beyond the system boundary (see columns representing the sum of modules A to D).
Impact CategoryUnitS1
(A–C)
S1
(A–D)
S2
(A–C)
S2
(A–D)
S3
(A–C)
S3
(A–D)
ADP_ekg Sb eq.1.93 × 10−11.75 × 10−11.04 × 10−11.00 × 10−15.25 × 10−3−4.91 × 10⁻²
ADP_fMJ2.64 × 1052.51 × 1054.59 × 1054.59 × 1059.06 × 104−6.55 × 10³
APkg SO2 eq.6.32 × 1016.17 × 1016.85 × 1016.83 × 1015.954.74 × 10−1
EPkg PO4 eq.4.69 × 1014.71 × 1014.75 × 1024.75 × 1029.24 × 10−13.11
FAETPkg DCB eq.5.85 × 1035.85 × 1038.72 × 1038.72 × 1032.54 × 1017.93 × 101
GWPkg CO2 eq.2.25 × 1042.05 × 1044.11 × 1044.11 × 1043.71 × 103−1.22 × 10⁴
HTPkg DCB eq.1.02 × 1049.83 × 1036.34 × 1036.30 × 1032.03 × 1021.32 × 102
MAETPkg DCB eq.4.95 × 1064.79 × 1064.46 × 1064.45 × 1062.69 × 1051.43 × 105
Table 6. Change in environmental performance of three wastewater treatment systems in the case of using electricity from photovoltaics (PV, EU-28 average), instead of electricity from the grid (EU-28 average).
Impact CategoryS1 Change (%)S2 Change (%)S3 Change (%)
Abiotic Depletion of elements +33+83+39
Abiotic Depletion of fossil −75−59−7
Acidification Potential−55−69−19
Eutrophication Potential −9−1−14
Freshwater Aquatic Ecotoxicity Potential −1−1−5
Global Warming Potential −81−60−16
Human Toxicity Potential −5−10−7
Marine Aquatic Ecotoxicity Potential −32−49−19
Disclaimer/Publisher’s Note: The statements, opinions and data contained in all publications are solely those of the individual author(s) and contributor(s) and not of MDPI and/or the editor(s). MDPI and/or the editor(s) disclaim responsibility for any injury to people or property resulting from any ideas, methods, instructions or products referred to in the content.

