
Implementing Time-Driven Activity-Based Costing for Unused Capacity Measurement in Local University


Abstract
:1. Introduction
2. Literature Reviews
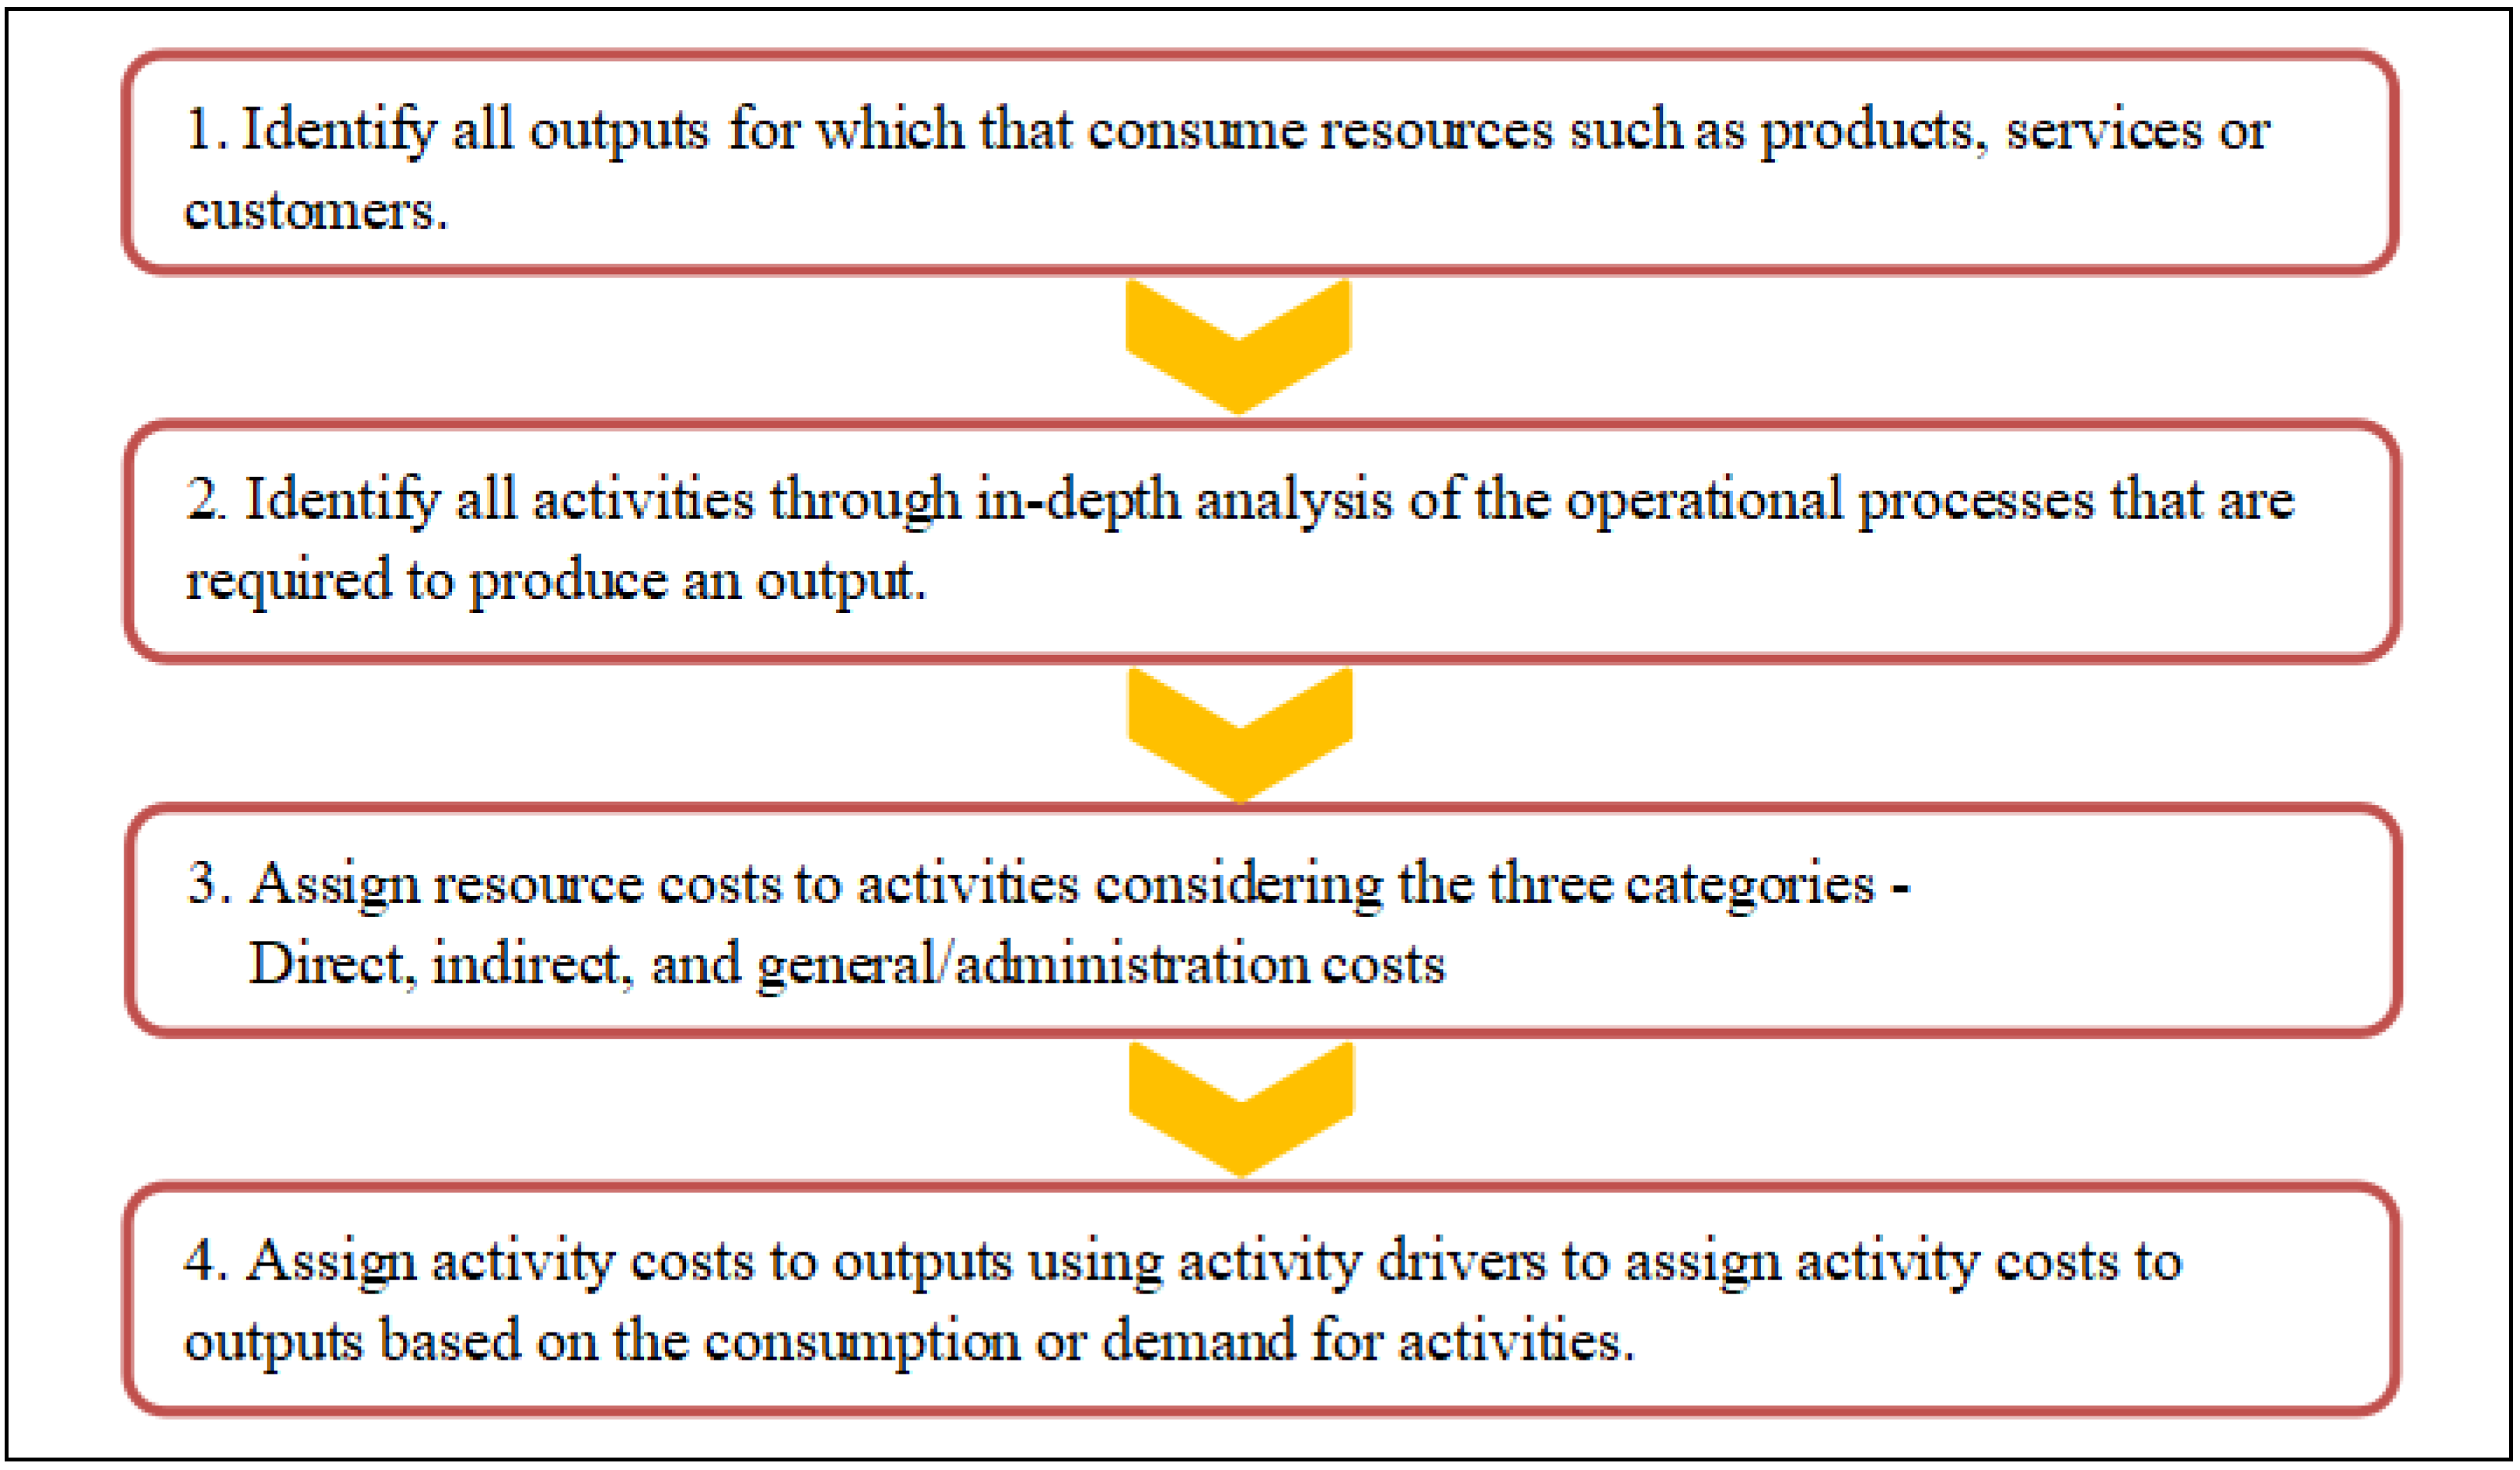
3. Materials and Methods
3.1. Process Mapping
3.2. Time Equation
3.3. Capacity Cost Rate
3.4. Forecasting
4. Results
4.1. Process Mapping
4.2. Time Equation
4.2.1. In DS45
4.2.2. In DS51/52
4.3. Capacity Cost Rate
4.3.1. In DS45
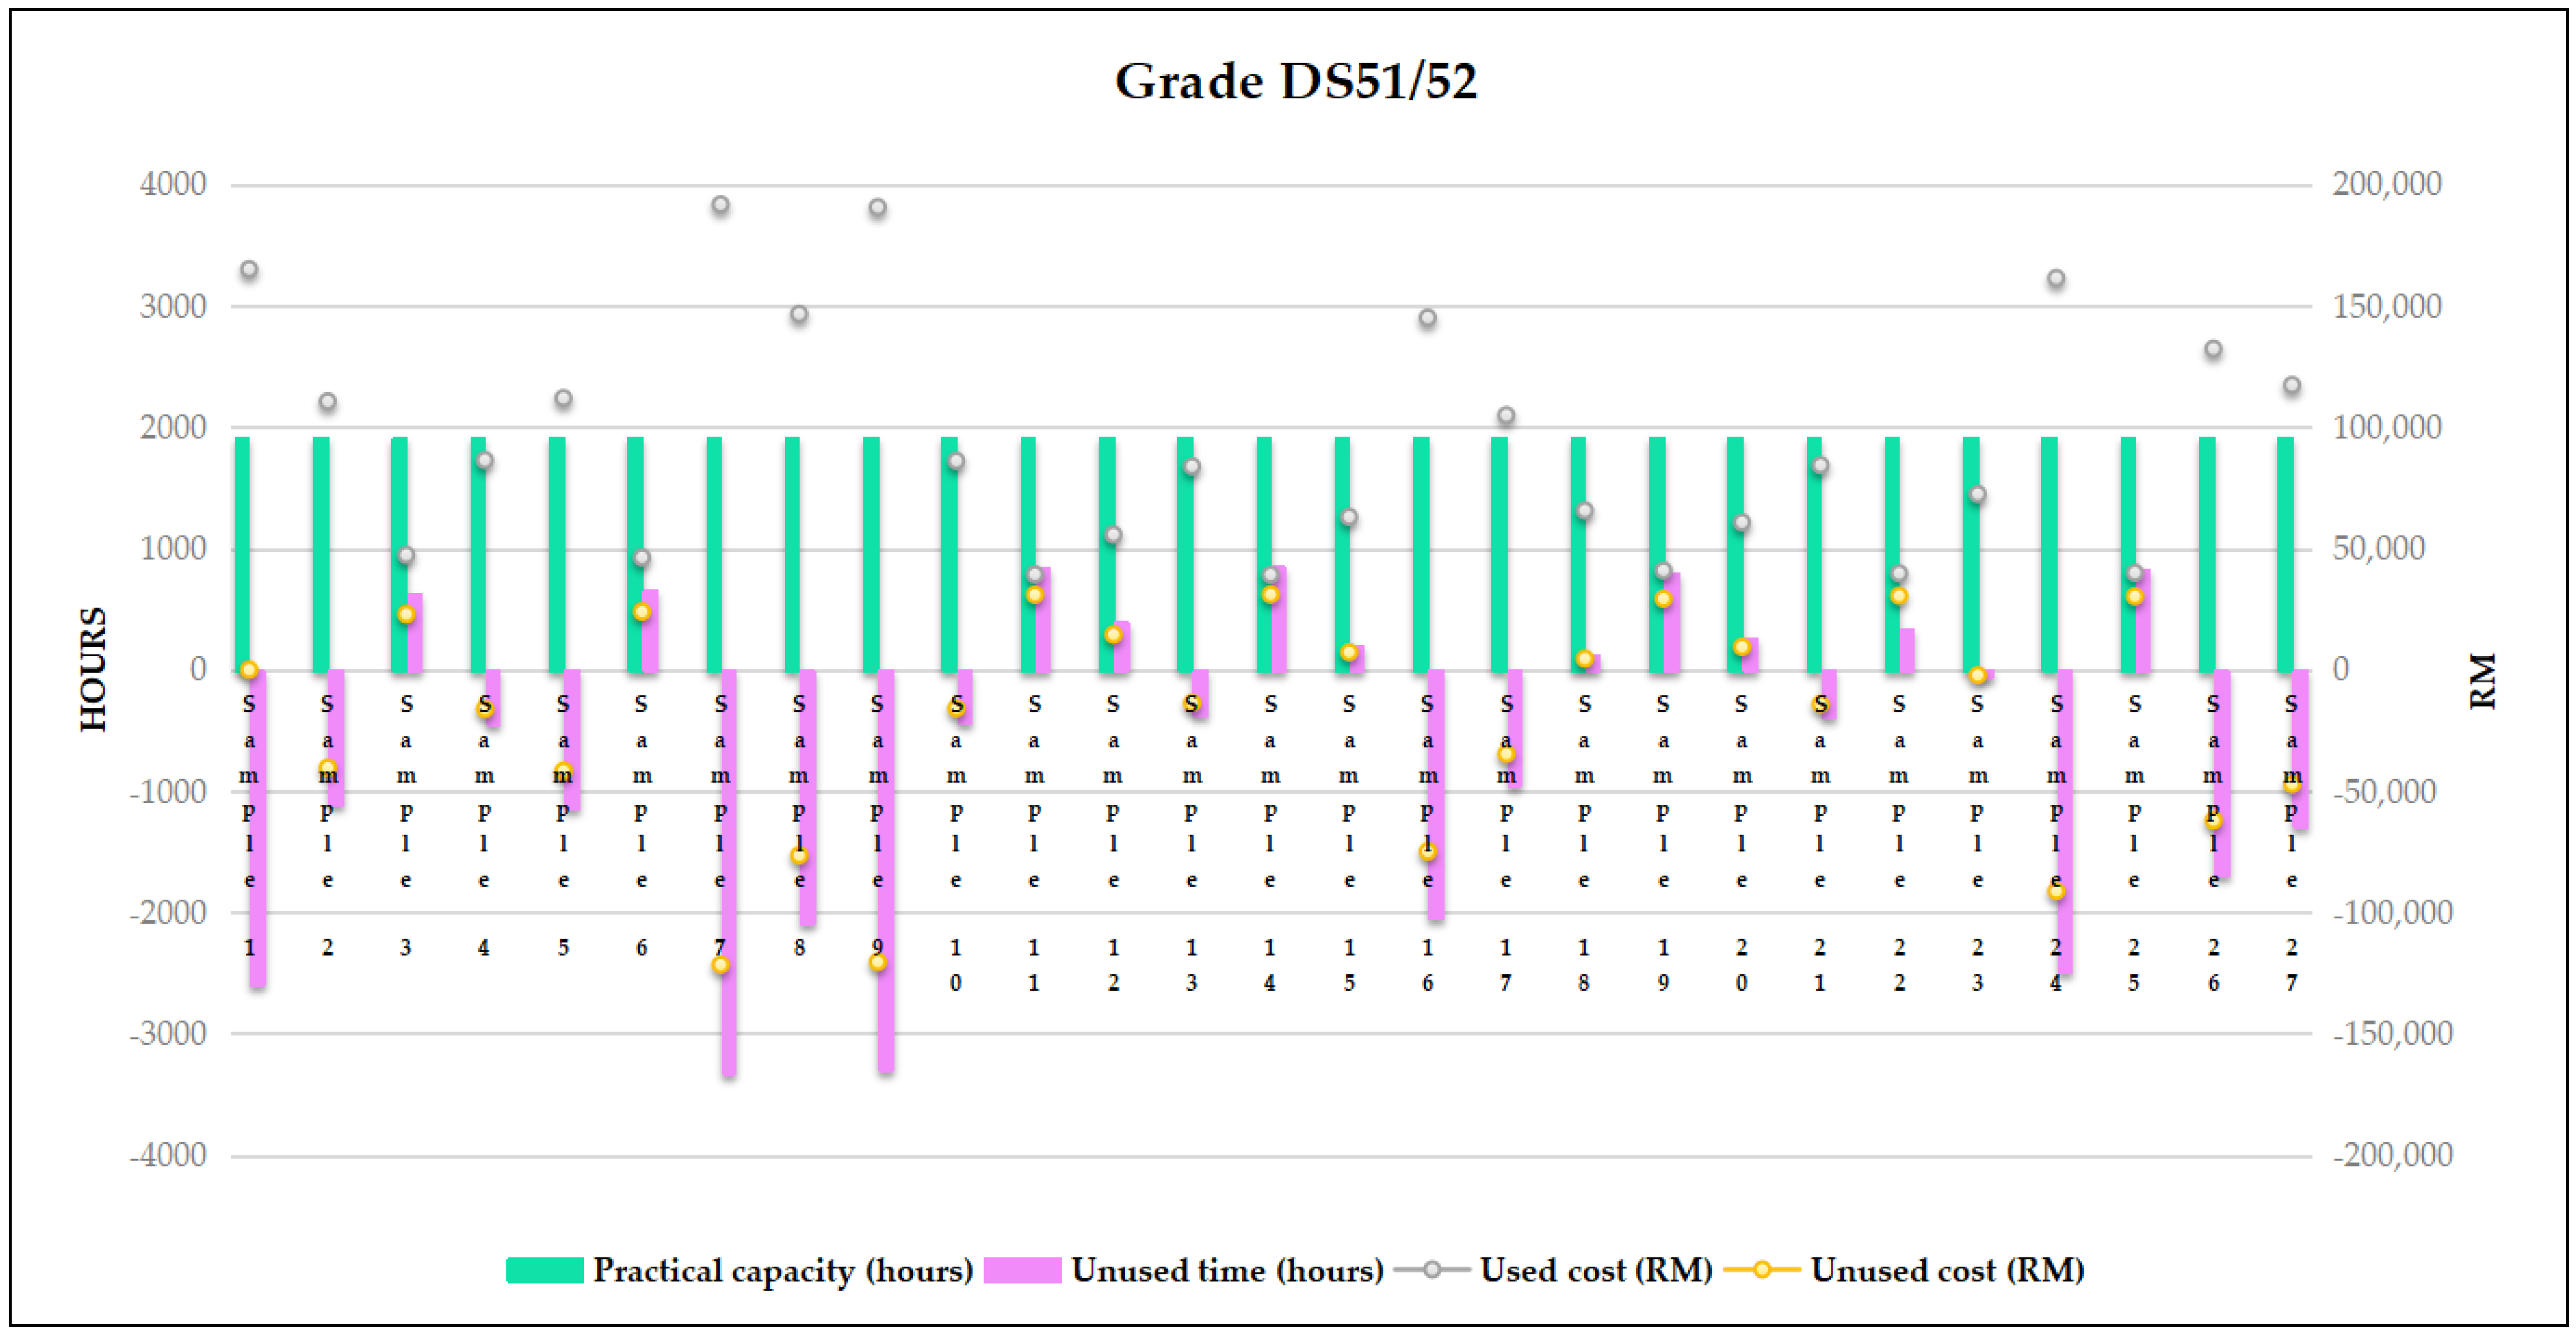
4.3.2. In DS51/52
4.4. Forecast Analysis
4.4.1. In DS45
4.4.2. In DS51/52
5. Discussion
Author Contributions
Funding
Institutional Review Board Statement
Informed Consent Statement
Data Availability Statement
Conflicts of Interest
References
- Lee, N.N.M. Higher Education in Southeast Asia in the Era of Globalization. In International Handbook of Higher Education; Springer: Berlin/Heidelberg, Germany, 2006; pp. 539–555. [Google Scholar] [CrossRef]
- World Higher Education Database. Available online: https://whed.net/home.php (accessed on 18 November 2022).
- UNESCO Institute for Statistics. Higher Education in Asia, Expanding Out, Expanding Up: The Rise of Graduate Education and University Research; UNESCO Institute for Statistics: Montreal, QC, Canada, 2014; pp. 1–163. [Google Scholar]
- Sebestyen, Z. The impact of the cost of unused capacity on production planning of flexible manufacturing systems. Period. Polytech. Soc. Manag. Sci. 2003, 11, 185–200. [Google Scholar]
- Amiri, N.A.; Khmidi, S.E. Implementing time-driven activity-based costing (TDABC) in out-patient nursing department: A case from UAE. Manag. Sci. Lett. 2019, 9, 365–380. [Google Scholar] [CrossRef]
- Activity-Based Costing (ABC) vs. Traditional Costing. Available online: https://strategiccfo.com/activity-based-costing-abc-vs-traditional-costing/ (accessed on 18 November 2022).
- Activity Based Costing: Topic Gateway Series No. 1. Available online: https://www.cimaglobal.com/Documents/ImportedDocuments/cid_tg_activity_based_costing_nov08.pdf.pdf (accessed on 18 November 2022).
- Kaplan, R.S.; Burns, W.J. Accounting and Management: Field Study Perspectives; Harvard Business School Press: Boston, MA, USA, 1987. [Google Scholar]
- Kaplan, R.S.; Anderson, S.R. Time-Driven Activity Based Costing. Harv. Bus. Rev. 2004, 82, 131–138. [Google Scholar] [CrossRef] [PubMed]
- Dziemianowicz, M.; Burmeister, J.; Dominello, M. Examining the Financial Impact of Altered Fractionation in Breast Cancer: An Analysis Using Time-Driven Activity-Based Costing. Pract. Radiat. Oncol. 2021, 11, 245–251. [Google Scholar] [CrossRef] [PubMed]
- Mohsin, N.M.R.; Al-Bayati, H.A.M.; Oleiwi, Z.H. Product-Mix Decision Using Lean Production and Activity-Based Costing: An Integrated Model. J. Asian Financ. Econ. Bus. 2021, 8, 517–527. [Google Scholar] [CrossRef]
- Zaini, S.N.A.M.; Abu, M.Y. Optimization of capacity utilization using time-driven activity-based costing for library system. IOP Conference Series: Mate-rials Science and Engineering, Volume 1092, The 2nd International Conference on Innovative Technology, Engineering and Sciences (iCITES 2020), Pekan Pahang, Malaysia, (22–23/12/2020). IOP Conf. Ser. Mater. Sci. Eng. 2021, 1092, 012016. [Google Scholar] [CrossRef]
- Kementerian Pengajian Tinggi Malaysia. Garis Panduan Integriti Akademik; Institutusi Pengajian Tinggi Malaysia: Putrajaya, Malaysia, 2010. [Google Scholar]
- Oraby, S. A Guide to Implementation of Time- Driven Activity -Based Costing in Saudi Electronic University. Int. J. Bus. Manag. 2020, 16, 68–78. [Google Scholar] [CrossRef]


| Sample | Time Equations |
|---|---|
| 1. | 9X1+ 7X3 + X6 + 3X15 + 20X16 + 15X34 + 2X38 + X39 + X41 + X48 + X49 |
| 2. | 24X1 + 5X3 + X6 + X13 + X14 + X17 + 2X26 + 3X38 + X39 + 4X41 + 3X48 + 2X51 |
| 3. | 14X1 + 2X3 + X12 + 3X39 + 2X49 + X50 + 5X51 |
| 4. | 22X1 + 5X3 + X11 + 12X16 + 2X39 + X51 |
| 5. | 7X1 + 2X3 + X7 + X13 + X17 + X38 + X39 + X40 + X51 |
| 6. | 12X1 + 5X3 + X15 + 2X17 + X26 + X38 + 2X39 + X40 + X41 + X48 + 2X49 + 2X51 |
| 7. | 12X1 + 2X3 + X7 + 21X16 + X38 + X41 + X51 |
| 8. | 22X1 + X11 + 12X16 + 2X39 + X51 |
| 9. | 12X1 + 2X3 + X6 + 17X16 + X30 + X31 + 3X39 + 2X41 + 6X48 + X49 + 13X51 |
| 10. | 8X1 + 2X3 + 27X16 + X38 + X39 + X51 |
| 11. | 8X1 + 2X3 + X7 + 18X16 + X30 + X39 + 2X48 + 2X51 |
| 12. | 7X1 + 4X3 + X11 + 15X16 + X38 + X39 + 4X51 |
| Driver | Cost Driver | Activities/Parameters | Quantity /Year (1) | Hours /Quantity (2) | Used Time (Hours/Year) (1) × (2) = (3) | |||
|---|---|---|---|---|---|---|---|---|
| Sample | 2 | 5 | 2 | 5 | 2 | 5 | ||
| Teaching and learning | ||||||||
| X1 | hours/credit | Undergrad teaching | 24 | 7 | 18 | 18 | 432 | 216 |
| X2 | hours/credit | Postgrad teaching | 0 | 0 | 18 | 18 | 0 | 0 |
| Supervision | ||||||||
| X3 | hours/student | Undergrad supervision | 5 | 2 | 28 | 28 | 140 | 56 |
| X4 | hours/student | Master supervision | 0 | 0 | 0 | 0 | 0 | 0 |
| X5 | hours/student | PhD supervision | 0 | 0 | 0 | 0 | 0 | 0 |
| Grant | ||||||||
| X6 | hours/grant | Internal grant | 1 | 0 | 20 | 20 | 20 | 0 |
| X7 | hours/grant | National grant | 0 | 1 | 20 | 20 | 0 | 20 |
| X8 | hours/grant | International grant | 0 | 0 | 0 | 0 | 0 | 0 |
| Publication | ||||||||
| X9 | hours/publication | ISI/WoS publication with IF | 0 | 0 | 30 | 30 | 0 | 0 |
| X10 | hours/publication | ISI/WoS publication without IF | 0 | 0 | 30 | 30 | 0 | 0 |
| X11 | hours/publication | SCOPUS journal | 0 | 0 | 30 | 30 | 0 | 0 |
| X12 | hours/publication | SCOPUS proceeding | 0 | 0 | 30 | 30 | 0 | 0 |
| X13 | hours/publication | Non-indexed peer-reviewed | 1 | 1 | 20 | 20 | 20 | 20 |
| X14 | hours/publication | Non-indexed proceeding | 1 | 0 | 20 | 20 | 20 | 0 |
| X15 | hours/publication | Module publication | 0 | 0 | 60 | 60 | 0 | 0 |
| Consultancy/advisory/awards | ||||||||
| X16 | hours/student | Internal consultation | 0 | 0 | 28 | 28 | 0 | 0 |
| X17 | hours/consultation | National consultation | 1 | 1 | 96 | 96 | 96 | 96 |
| X18 | hours/consultation | International consultation | 0 | 0 | 0 | 0 | 0 | 0 |
| X19 | hours/award | Internal academic award | 0 | 0 | 0 | 0 | 0 | 0 |
| X20 | hours/award | National academic award | 0 | 0 | 0 | 0 | 0 | 0 |
| X21 | hours/award | International academic award | 0 | 0 | 0 | 0 | 0 | 0 |
| X22 | hours/award | National exhibition award | 0 | 0 | 0 | 0 | 0 | 0 |
| X23 | hours/award | International exhibition award | 0 | 0 | 0 | 0 | 0 | 0 |
| X24 | hours/thesis | Master thesis examiner | 0 | 0 | 0 | 0 | 0 | 0 |
| X25 | hours/thesis | PhD thesis examiner | 0 | 0 | 0 | 0 | 0 | 0 |
| X26 | hours/book | Book editor | 2 | 0 | 10 | 10 | 20 | 0 |
| X27 | hours/publication | Journal editor | 0 | 0 | 0 | 0 | 0 | 0 |
| X28 | hours/publication | Proceeding editor | 0 | 0 | 0 | 0 | 0 | 0 |
| X29 | hours/publication | ISI/WoS journal reviewer | 0 | 0 | 8 | 8 | 0 | 0 |
| X30 | hours/publication | SCOPUS journal reviewer | 0 | 0 | 8 | 8 | 0 | 0 |
| X31 | hours/publication | Non-indexed journal reviewer | 0 | 0 | 8 | 8 | 0 | 0 |
| X32 | hours/session | International judge/evaluator | 0 | 0 | 0 | 0 | 0 | 0 |
| X33 | hours/session | National judge/evaluator | 0 | 0 | 8 | 8 | 0 | 0 |
| X34 | hours/session | Internal/postgrad proposal defend evaluator | 0 | 0 | 2 | 2 | 0 | 0 |
| Attitude/training/teamwork | ||||||||
| X35 | hours/position | Rational post | 0 | 0 | 0 | 0 | 0 | 0 |
| X36 | hours/position | Board of director (BOD) | 0 | 0 | 0 | 0 | 0 | 0 |
| X37 | hours/position | Secondment | 0 | 0 | 384 | 384 | 0 | 0 |
| X38 | hours/position | Task force | 3 | 1 | 384 | 384 | 1152 | 384 |
| X39 | hours/position | Committee | 1 | 1 | 384 | 384 | 384 | 384 |
| Social/community service | ||||||||
| X40 | hours/program | CSI | 0 | 1 | 8 | 8 | 0 | 8 |
| X41 | hours/program | CSR | 4 | 0 | 15 | 15 | 60 | 0 |
| Committee/administration /contribution | ||||||||
| X42 | hours/program | Internal speaker | 0 | 0 | 3 | 3 | 0 | 0 |
| X43 | hours/program | National speaker | 0 | 0 | 3 | 3 | 0 | 0 |
| X44 | hours/program | International speaker | 0 | 0 | 0 | 0 | 0 | 0 |
| X45 | hours/program | Internal facilitator | 0 | 0 | 0 | 0 | 0 | 0 |
| X46 | hours/program | National facilitator | 0 | 0 | 40 | 40 | 0 | 0 |
| X47 | hours/program | International facilitator | 0 | 0 | 0 | 0 | 0 | 0 |
| X48 | hours/program | Internal training/seminar | 3 | 0 | 8 | 8 | 24 | 0 |
| X49 | hours/program | National training/seminar | 0 | 0 | 24 | 24 | 0 | 0 |
| X50 | hours/program | International training/seminar | 0 | 0 | 24 | 24 | 0 | 0 |
| X51 | hours/program | Internal meeting | 2 | 1 | 4 | 4 | 8 | 4 |
| X52 | hours/program | National meeting | 0 | 0 | 4 | 4 | 0 | 0 |
| X53 | hours/program | International meeting | 0 | 0 | 0 | 0 | 0 | 0 |
| TOTAL | 2376 | 1098 | ||||||
| Sample | Time Equations |
|---|---|
| 1. | 21X1 + 6X3 + 3X4 + 3X6 + X7 + 2X12 + X13 + X16 + X24 + 7X38 + 2X39 + X40 + X48 + X50 + 2X51 |
| 2. | 14X1 + 5X3 + 3X4 + X6 + 2X7 + 3X12 + X27 + X32 + 4X38 + 2X39 + 2X40 + 4X51 |
| 3. | 11X1 + 4X3 + 3X4 + X5 + X6 + 2X7 + 2X12 + 2X13 + X17 + X24 + X38 + X40 + X46 + 3X48 + X49 + 8X51 + 3X52 |
| 4. | 16X1 + 11X3 + X7 + 6X12 + 2X15 + 2X17 + X19 + X20 + X22 + X24 + X27 + X30 + X38 + 2X39 + X40 + X48 + X50 + 3X51 + X52 |
| 5. | 8X1 + 5X4 + 13X6 + X7 + 18X12 + 13X13 + 4X38 + 7X48 + X51 |
| 6. | 14X1 + 8X3 + 8X6 + 4X7 + X12 + X22 + X33 + X39 + X40 + X45 + X46 + 7X51 + X52 |
| 7. | 32X1 + 4X3 + 4X4 + 3X5 + X6 + 3X7 + 2X11 + X12 + X13 + 2X15 + X16 + 3X17 + X26 + 4X33 + 3X38 + 6X39 + X41 + 3X48 + 12X51 |
| 8. | 26X1 + 4X3 + 3X4 + X6 + 5X11 + 16X12 + 14X13 + X16 + X27 + 2X38 + 4X39 + X40 + 4X51 |
| 9. | 18X1 + 8X3 + 2X4 + 3X6 + 2X7 + X9 + X12 + 3X13 + 2X20 + X30 + 7X38 + 4X39 + X40 + 6X48 + X49 + 4X51 |
| 10. | 19X1 + 3X3 + 4X4 + X5 + 3X6 + 2X7 + 3X12 + 5X13 + 2X15 + X27 + 6X30 + 3X39 + 2X40 + X48 + X49 + X50 + X51 |
| 11. | 26X1 + 5X3 + 3X4 + 5X12 + 2X13 + X18 + X32 + 3X44 + X50 + X51 |
| 12. | 10X1 + 3X4 + X5 + X6 + 9X13 + X15 + X17 + 2X38 + X40 + 4X51 + X52 |
| 13. | 14X1 + 19X3 + 2X4 + 2X6 + X12 + 19X16 + 2X38 + X41 + 3X48 + X51 |
| 14. | 2X3 + 2X4 + X6 + 2X7 + X12 + 2X33 + 7X34 + 2X39 + X48 + 2X51 |
| 15. | 9X1 + 4X3 + 2X4 + X6 + 2X7 + X12 + X16 + X27 + 4X31 + 2X38 + X39 + 2X41 + X48 + 2X51 |
| 16. | 12X1 + 6X3 + 2X4 + X6 + 2X12 + 23X16 + 2X30 + X31 + 3X38 + 4X39 + X41 + 2X48 + 5X51 |
| 17. | 9X1 + 4X3 + 2X4 + X6 + 2X7 + X11 + X12 + X16 + X24 + X30 + X31 + 5X38 + X39 + 4X51 |
| 18. | 8X1 + 8X3 + X4 + X5 + 6X4 + 2X12 + 2X38 + X39 + X41 + 6X51 |
| 19. | 9X1 + 4X3 + 4X4 + 2X7 + X12 + 2X13 + X17 + 4X31 + X39 + X41 + 4X51 |
| 20. | 14X1 + 10X3 + X4 + X5 + X6 + X9 + X11 + X15 + X17 + 2X38 + 2X41 |
| 21. | 13X1 + 7X3 + X4 + 4X6 + 2X7 + X9 + 5X11 + X12 + 10X16 + 3X38 + 3X41 + X48 + 3X51 |
| 22. | 6X1 + 4X3 + 2X4 + 2X5 + X6 + 2X7 + 6X12 + 2X33 + X38 + X41 + 5X51 |
| 23. | 12X1 + 3X3 + 3X4 + 2X7 + X12 + 24X16 + 2X38 + X41 + X48 + X51 |
| 24. | 22X1 + 5X3 + 2X4 + 3X5 + X6 + X11 + X12 + 25X16 + X17 + 2X24 + 7X39 + X41 + 3X51 |
| 25. | 12X1 + 5X3 + 2X4 + 2X6 + X7 + 4X12 + 3X22 + X39 + 3X41 + 2X51 |
| 27. | 29X1 + 4X3 + 3X6 + 3X15 + X16 + X19 + 2X38 + 5X39 + X41 |
| 28. | 7X1 + 5X3 + 2X4 + 2X12 + 27X16 + 2X27 + 7X31 + 2X38 + 3X39 + 5X48 + 3X51 |
| Driver | Cost Driver | Activities/Parameters | Quantity /Year (1) | Hours /Quantity (2) | Used Time (Hours/Year) (1) × (2) = (3) | |||
|---|---|---|---|---|---|---|---|---|
| Sample | 7 | 14 | 7 | 14 | 7 | 14 | ||
| Teaching and learning | ||||||||
| X1 | hours/credit | Undergrad teaching | 32 | 0 | 18 | 18 | 576 | 0 |
| X2 | hours/credit | Postgrad teaching | 0 | 0 | 18 | 18 | 0 | 0 |
| Supervision | ||||||||
| X3 | hours/student | Undergrad supervision | 4 | 2 | 28 | 28 | 112 | 56 |
| X4 | hours/student | Master supervision | 4 | 2 | 48 | 48 | 192 | 96 |
| X5 | hours/student | PhD supervision | 3 | 0 | 48 | 48 | 144 | 0 |
| Grant | ||||||||
| X6 | hours/grant | Internal grant | 1 | 1 | 20 | 20 | 20 | 20 |
| X7 | hours/grant | National grant | 3 | 2 | 20 | 20 | 60 | 40 |
| X8 | hours/grant | International grant | 0 | 0 | 0 | 0 | 0 | 0 |
| Publication | ||||||||
| X9 | hours/publication | ISI/WoS publication with IF | 0 | 0 | 30 | 30 | 0 | 0 |
| X10 | hours/publication | ISI/WoS publication without IF | 0 | 0 | 30 | 30 | 0 | 0 |
| X11 | hours/publication | SCOPUS journal | 2 | 0 | 30 | 30 | 60 | 0 |
| X12 | hours/publication | SCOPUS proceeding | 1 | 1 | 30 | 30 | 30 | 30 |
| X13 | hours/publication | Non-indexed peer-reviewed | 1 | 0 | 20 | 20 | 20 | 0 |
| X14 | hours/publication | Non-indexed proceeding | 0 | 0 | 20 | 20 | 0 | 0 |
| X15 | hours/publication | Module publication | 2 | 0 | 60 | 60 | 120 | 0 |
| Consultancy/advisory/awards | ||||||||
| X16 | hours/student | Internal consultation | 1 | 0 | 28 | 28 | 28 | 0 |
| X17 | hours/consultation | National consultation | 3 | 0 | 96 | 96 | 288 | 0 |
| X18 | hours/consultation | International consultation | 0 | 0 | 96 | 96 | 0 | 0 |
| X19 | hours/award | Internal academic award | 0 | 0 | 8 | 8 | 0 | 0 |
| X20 | hours/award | National academic award | 0 | 0 | 8 | 8 | 0 | 0 |
| X21 | hours/award | International academic award | 0 | 0 | 0 | 0 | 0 | 0 |
| X22 | hours/award | National exhibition award | 0 | 0 | 8 | 8 | 0 | 0 |
| X23 | hours/award | International exhibition award | 0 | 0 | 0 | 0 | 0 | 0 |
| X24 | hours/thesis | Master thesis examiner | 0 | 0 | 12 | 12 | 0 | 0 |
| X25 | hours/thesis | PhD thesis examiner | 0 | 0 | 12 | 12 | 0 | 0 |
| X26 | hours/book | Book editor | 1 | 0 | 10 | 10 | 10 | 0 |
| X27 | hours/publication | Journal editor | 0 | 0 | 0 | 0 | 0 | 0 |
| X28 | hours/publication | Proceeding editor | 0 | 0 | 0 | 0 | 0 | 0 |
| X29 | hours/publication | ISI/WoS journal reviewer | 0 | 0 | 8 | 8 | 0 | 0 |
| X30 | hours/publication | SCOPUS journal reviewer | 0 | 0 | 8 | 8 | 0 | 0 |
| X31 | hours/publication | Non-indexed journal reviewer | 0 | 0 | 8 | 8 | 0 | 0 |
| X32 | hours/session | International judge/evaluator | 0 | 0 | 0 | 0 | 0 | 0 |
| X33 | hours/session | National judge/evaluator | 4 | 2 | 8 | 8 | 32 | 16 |
| X34 | hours/session | Internal/postgrad proposal defend evaluator | 4 | 7 | 2 | 2 | 8 | 14 |
| Attitude/training/teamwork | ||||||||
| X35 | hours/position | Rational post | 0 | 0 | 0 | 0 | 0 | 0 |
| X36 | hours/position | Board of director (BOD) | 0 | 0 | 0 | 0 | 0 | 0 |
| X37 | hours/position | Secondment | 0 | 0 | 384 | 384 | 0 | 0 |
| X38 | hours/position | Task force | 3 | 0 | 384 | 384 | 1152 | 0 |
| X39 | hours/position | Committee | 6 | 2 | 384 | 384 | 2304 | 768 |
| Social/community service | ||||||||
| X40 | hours/program | CSI | 0 | 0 | 8 | 8 | 0 | 0 |
| X41 | hours/program | CSR | 1 | 0 | 15 | 15 | 15 | 0 |
| Committee/administration /contribution | ||||||||
| X42 | hours/program | Internal speaker | 0 | 0 | 0 | 0 | 0 | 0 |
| X43 | hours/program | National speaker | 0 | 0 | 0 | 0 | 0 | 0 |
| X44 | hours/program | International speaker | 0 | 0 | 3 | 3 | 0 | 0 |
| X45 | hours/program | Internal facilitator | 0 | 0 | 40 | 40 | 0 | 0 |
| X46 | hours/program | National facilitator | 0 | 0 | 40 | 40 | 0 | 0 |
| X47 | hours/program | International facilitator | 0 | 0 | 0 | 0 | 0 | 0 |
| X48 | hours/program | Internal training/seminar | 3 | 3 | 8 | 8 | 24 | 24 |
| X49 | hours/program | National training/seminar | 0 | 0 | 24 | 24 | 0 | 0 |
| X50 | hours/program | International training/seminar | 0 | 0 | 24 | 24 | 0 | 0 |
| X51 | hours/program | Internal meeting | 12 | 2 | 4 | 4 | 48 | 8 |
| X52 | hours/program | National meeting | 0 | 0 | 4 | 4 | 0 | 0 |
| X53 | hours/program | International meeting | 0 | 0 | 0 | 0 | 0 | 0 |
| TOTAL | 5243 | 1072 | ||||||
| Sample | Used Time (Hours/Year) | Capacity Cost Rate (RM/Hour) | Total Used Cost (RM/Year) |
|---|---|---|---|
| 1 | 2347 | 19.19 | 45,033.06 |
| 2 | 2376 | 19.19 | 45,589.50 |
| 3 | 1582 | 19.19 | 30,354.63 |
| 4 | 1674 | 19.19 | 32,119.88 |
| 5 | 1098 | 19.19 | 21,067.88 |
| 6 | 1857 | 19.19 | 35,631.19 |
| 7 | 1283 | 19.19 | 24,617.56 |
| 8 | 1534 | 19.19 | 29,433.63 |
| 9 | 2090 | 19.19 | 40,101.88 |
| 10 | 1728 | 19.19 | 33,156.00 |
| 11 | 1140 | 19.19 | 21,873.75 |
| 12 | 1472 | 19.19 | 28,244.00 |
| Sample | Used Time (Hours/Year) | Capacity Cost Rate (RM/Hour) | Total Used Cost (RM/Year) |
|---|---|---|---|
| 1 | 4514 | 36.59 | 165,184.19 |
| 2 | 3024 | 36.59 | 110,659.50 |
| 3 | 1294 | 36.59 | 47,352.31 |
| 4 | 2362 | 36.59 | 86,434.44 |
| 5 | 3060 | 36.59 | 111,976.88 |
| 6 | 1266 | 36.59 | 46,327.69 |
| 7 | 5243 | 36.59 | 191,861.03 |
| 8 | 4010 | 36.59 | 146,740.94 |
| 9 | 5212 | 36.59 | 190,726.63 |
| 10 | 2354 | 36.59 | 86,141.69 |
| 11 | 1075 | 36.59 | 30,921.72 |
| 12 | 1524 | 36.59 | 55,768.88 |
| 13 | 2293 | 36.59 | 83,909.47 |
| 14 | 1072 | 36.59 | 31,031.50 |
| 15 | 1722 | 36.59 | 63,014.44 |
| 16 | 3967 | 36.59 | 145,167.41 |
| 17 | 2868 | 36.59 | 104,950.88 |
| 18 | 1795 | 36.59 | 65,685.78 |
| 19 | 1119 | 36.59 | 29,311.59 |
| 20 | 1662 | 36.59 | 60,818.81 |
| 21 | 2305 | 36.59 | 84,348.59 |
| 22 | 1087 | 36.59 | 30,482.59 |
| 23 | 1981 | 36.59 | 72,492.22 |
| 24 | 4413 | 36.59 | 161,488.22 |
| 25 | 1093 | 36.59 | 30,263.03 |
| 26 | 3617 | 36.59 | 132,359.59 |
| 27 | 3208 | 36.59 | 117,392.75 |
| Sample | Practical Capacity (Hours) (1) | Used Time (Hours) (2) | Unused Time (Hours) (3) = (1) − (2) | Capacity Cost Rate (RM/Hour) (4) | Used Cost (RM) (2) × (4) | Unused Cost (RM) (3) × (4) |
|---|---|---|---|---|---|---|
| 1 | 1920 | 2347 | −427 | 19.19 | 45,033.06 | −8193.06 |
| 2 | 1920 | 2376 | −456 | 19.19 | 45,589.50 | −8749.50 |
| 3 | 1920 | 1582 | 338 | 19.19 | 30,354.63 | 6485.38 |
| 4 | 1920 | 1674 | 246 | 19.19 | 32,119.88 | 4720.13 |
| 5 | 1920 | 1098 | 822 | 19.19 | 21,067.88 | 15,772.13 |
| 6 | 1920 | 1857 | 63 | 19.19 | 35,631.19 | 1208.81 |
| 7 | 1920 | 1283 | 637 | 19.19 | 24,617.56 | 12,222.44 |
| 8 | 1920 | 1534 | 386 | 19.19 | 29,433.63 | 7406.38 |
| 9 | 1920 | 2090 | −170 | 19.19 | 40,101.88 | −3261.88 |
| 10 | 1920 | 1728 | 192 | 19.19 | 33,156.00 | 3684.00 |
| 11 | 1920 | 1140 | 780 | 19.19 | 21,873.75 | 14,966.25 |
| 12 | 1920 | 1472 | 448 | 19.19 | 28,244.00 | 8596.00 |
| Sample | Practical Capacity (Hours) (1) | Used Time (Hours) (2) | Unused Time (Hours) (3) = (1) − (2) | Capacity Cost Rate (RM/Hour) (4) | Used Cost (RM) (2) × (4) | Unused Cost (RM) (3) × (4) |
|---|---|---|---|---|---|---|
| 1 | 1920 | 4514 | −2594 | 36.59 | 165,184.19 | −94,924.19 |
| 2 | 1920 | 3024 | −1104 | 36.59 | 110,659.50 | −40,399.50 |
| 3 | 1920 | 1294 | 626 | 36.59 | 47,352.31 | 22,907.69 |
| 4 | 1920 | 2362 | −442 | 36.59 | 86,434.44 | −16,174.44 |
| 5 | 1920 | 3060 | −1140 | 36.59 | 111,976.88 | −41,716.88 |
| 6 | 1920 | 1266 | 654 | 36.59 | 46,327.69 | 23,932.31 |
| 7 | 1920 | 5243 | −3323 | 36.59 | 191,861.03 | −121,601.03 |
| 8 | 1920 | 4010 | −2090 | 36.59 | 146,740.94 | −76,480.94 |
| 9 | 1920 | 5212 | −3292 | 36.59 | 190,726.63 | −120,466.63 |
| 10 | 1920 | 2354 | −434 | 36.59 | 86,141.69 | −15,881.69 |
| 11 | 1920 | 1075 | 845 | 36.59 | 39,338.28 | 30,921.72 |
| 12 | 1920 | 1524 | 396 | 36.59 | 55,768.88 | 14,491.13 |
| 13 | 1920 | 2293 | −373 | 36.59 | 83,909.47 | −13,649.47 |
| 14 | 1920 | 1072 | 848 | 36.59 | 39,228.50 | 31,031.50 |
| 15 | 1920 | 1722 | 198 | 36.59 | 63,014.44 | 7245.56 |
| 16 | 1920 | 3967 | −2047 | 36.59 | 145,167.41 | −74,907.41 |
| 17 | 1920 | 2868 | −948 | 36.59 | 104,950.88 | −34,690.88 |
| 18 | 1920 | 1795 | 125 | 36.59 | 65,685.78 | 4574.22 |
| 19 | 1920 | 1119 | 801 | 36.59 | 40,948.41 | 29,311.59 |
| 20 | 1920 | 1662 | 258 | 36.59 | 60,818.81 | 9441.19 |
| 21 | 1920 | 2305 | −385 | 36.59 | 84,348.59 | −14,088.59 |
| 22 | 1920 | 1087 | 333 | 36.59 | 39,777.41 | 30,482.59 |
| 23 | 1920 | 1981 | −61 | 36.59 | 72,492.22 | −2232.22 |
| 24 | 1920 | 4413 | −2493 | 36.59 | 161,488.22 | −91,228.22 |
| 25 | 1920 | 1093 | 827 | 36.59 | 39,996.97 | 30,263.03 |
| 26 | 1920 | 3617 | −1697 | 36.59 | 132,359.59 | −62,099.59 |
| 27 | 1920 | 3208 | −1288 | 36.59 | 117,392.75 | −47,132.75 |
Disclaimer/Publisher’s Note: The statements, opinions and data contained in all publications are solely those of the individual author(s) and contributor(s) and not of MDPI and/or the editor(s). MDPI and/or the editor(s) disclaim responsibility for any injury to people or property resulting from any ideas, methods, instructions or products referred to in the content. |
© 2023 by the authors. Licensee MDPI, Basel, Switzerland. This article is an open access article distributed under the terms and conditions of the Creative Commons Attribution (CC BY) license (https://creativecommons.org/licenses/by/4.0/).
Share and Cite
Mohd Zaini, S.N.A.; Abu, M.Y. Implementing Time-Driven Activity-Based Costing for Unused Capacity Measurement in Local University. Sustainability 2023, 15, 3756. https://doi.org/10.3390/su15043756
Mohd Zaini SNA, Abu MY. Implementing Time-Driven Activity-Based Costing for Unused Capacity Measurement in Local University. Sustainability. 2023; 15(4):3756. https://doi.org/10.3390/su15043756
Chicago/Turabian StyleMohd Zaini, Sri Nur Areena, and Mohd Yazid Abu. 2023. "Implementing Time-Driven Activity-Based Costing for Unused Capacity Measurement in Local University" Sustainability 15, no. 4: 3756. https://doi.org/10.3390/su15043756
APA StyleMohd Zaini, S. N. A., & Abu, M. Y. (2023). Implementing Time-Driven Activity-Based Costing for Unused Capacity Measurement in Local University. Sustainability, 15(4), 3756. https://doi.org/10.3390/su15043756