
Directions for the Sustainability of Innovative Clustering in a Country

Abstract
:1. Introduction
- What are the distinct qualities of innovation clusters?
- a.
- Are there strongly defined symptoms of successful clustering that could be learned through the new practices and domestic history of various national economies worldwide?
- b.
- The clusters from which industries and segments appear to be the most productive and thriving globally?
- c.
- The need to form which new institutions and investment developments are the most apparent when looking at the clusters?
- 2.
- What critical innovation indices propel the country’s innovativeness and competitiveness forward?
- a.
- What is their significance when looking at the local and global picture of the country’s innovative and competitive success?
- b.
- What is possible when creating new regional mechanisms and financial and investment platforms that minimize the cluster’s dependency on the regional budget funds?
2. Literature Review
2.1. Theoretical Foundation of Innovative Clustering Worldwide
- Location of quality human resources with the established network for disseminating new technologies, knowledge, and products.
- Geographic proximity facilitates the dissemination of information related to the studied discipline and minimizes innovation costs.
- Flexible structure in the form of large but also small- and medium-sized enterprises promotes innovative growth in clusters.
2.2. Analysis of Innovative Trends of the Leading Countries
- (1)
- Emphasis on the dissemination of innovations by creating a favorable environment and a rational economic structure;
- (2)
- focus on leading R&D and development of targeted large-scale projects covering all stages of the scientific and production cycle;
- (3)
- promoting innovation through improving infrastructure and coordinating the activities of various science-intensive sectors and industries based on borrowing foreign technologies.
3. Materials and Methods
- The innovation clusters have unique attributes that make them the leading choice when creating a business association in the country;
- There are assets of cluster development reflected by the vital innovation indices that propel the country’s innovativeness and competitiveness forward on the global innovation and competitiveness lists.
- The first null hypothesis (H0-1) is related to the research question one—there is no statistical effect from the factors of institutional development, human capital, and research, infrastructure, market development, business development, knowledge and technology, creative results on the innovation index of the leading countries in innovative development;
- The first alternative hypothesis (H1-1) is a statistical effect of institutional development, human capital, research, infrastructure, market development, business development, knowledge and technology, and creative results on the innovation index of the leading countries in innovative development;
- The second null hypothesis (H0-2) is related to the research question two—there is no statistical effect from institutional development, human capital, research, infrastructure, market development, business development, knowledge and technology, and creative results on the level of competitiveness of countries leading innovative development;
- The second alternative hypothesis (H1-2) is a statistical effect of institutional development, human capital, research, infrastructure, market development, business development, knowledge and technologies, and creative results on the competitiveness of countries-leaders of innovative development.
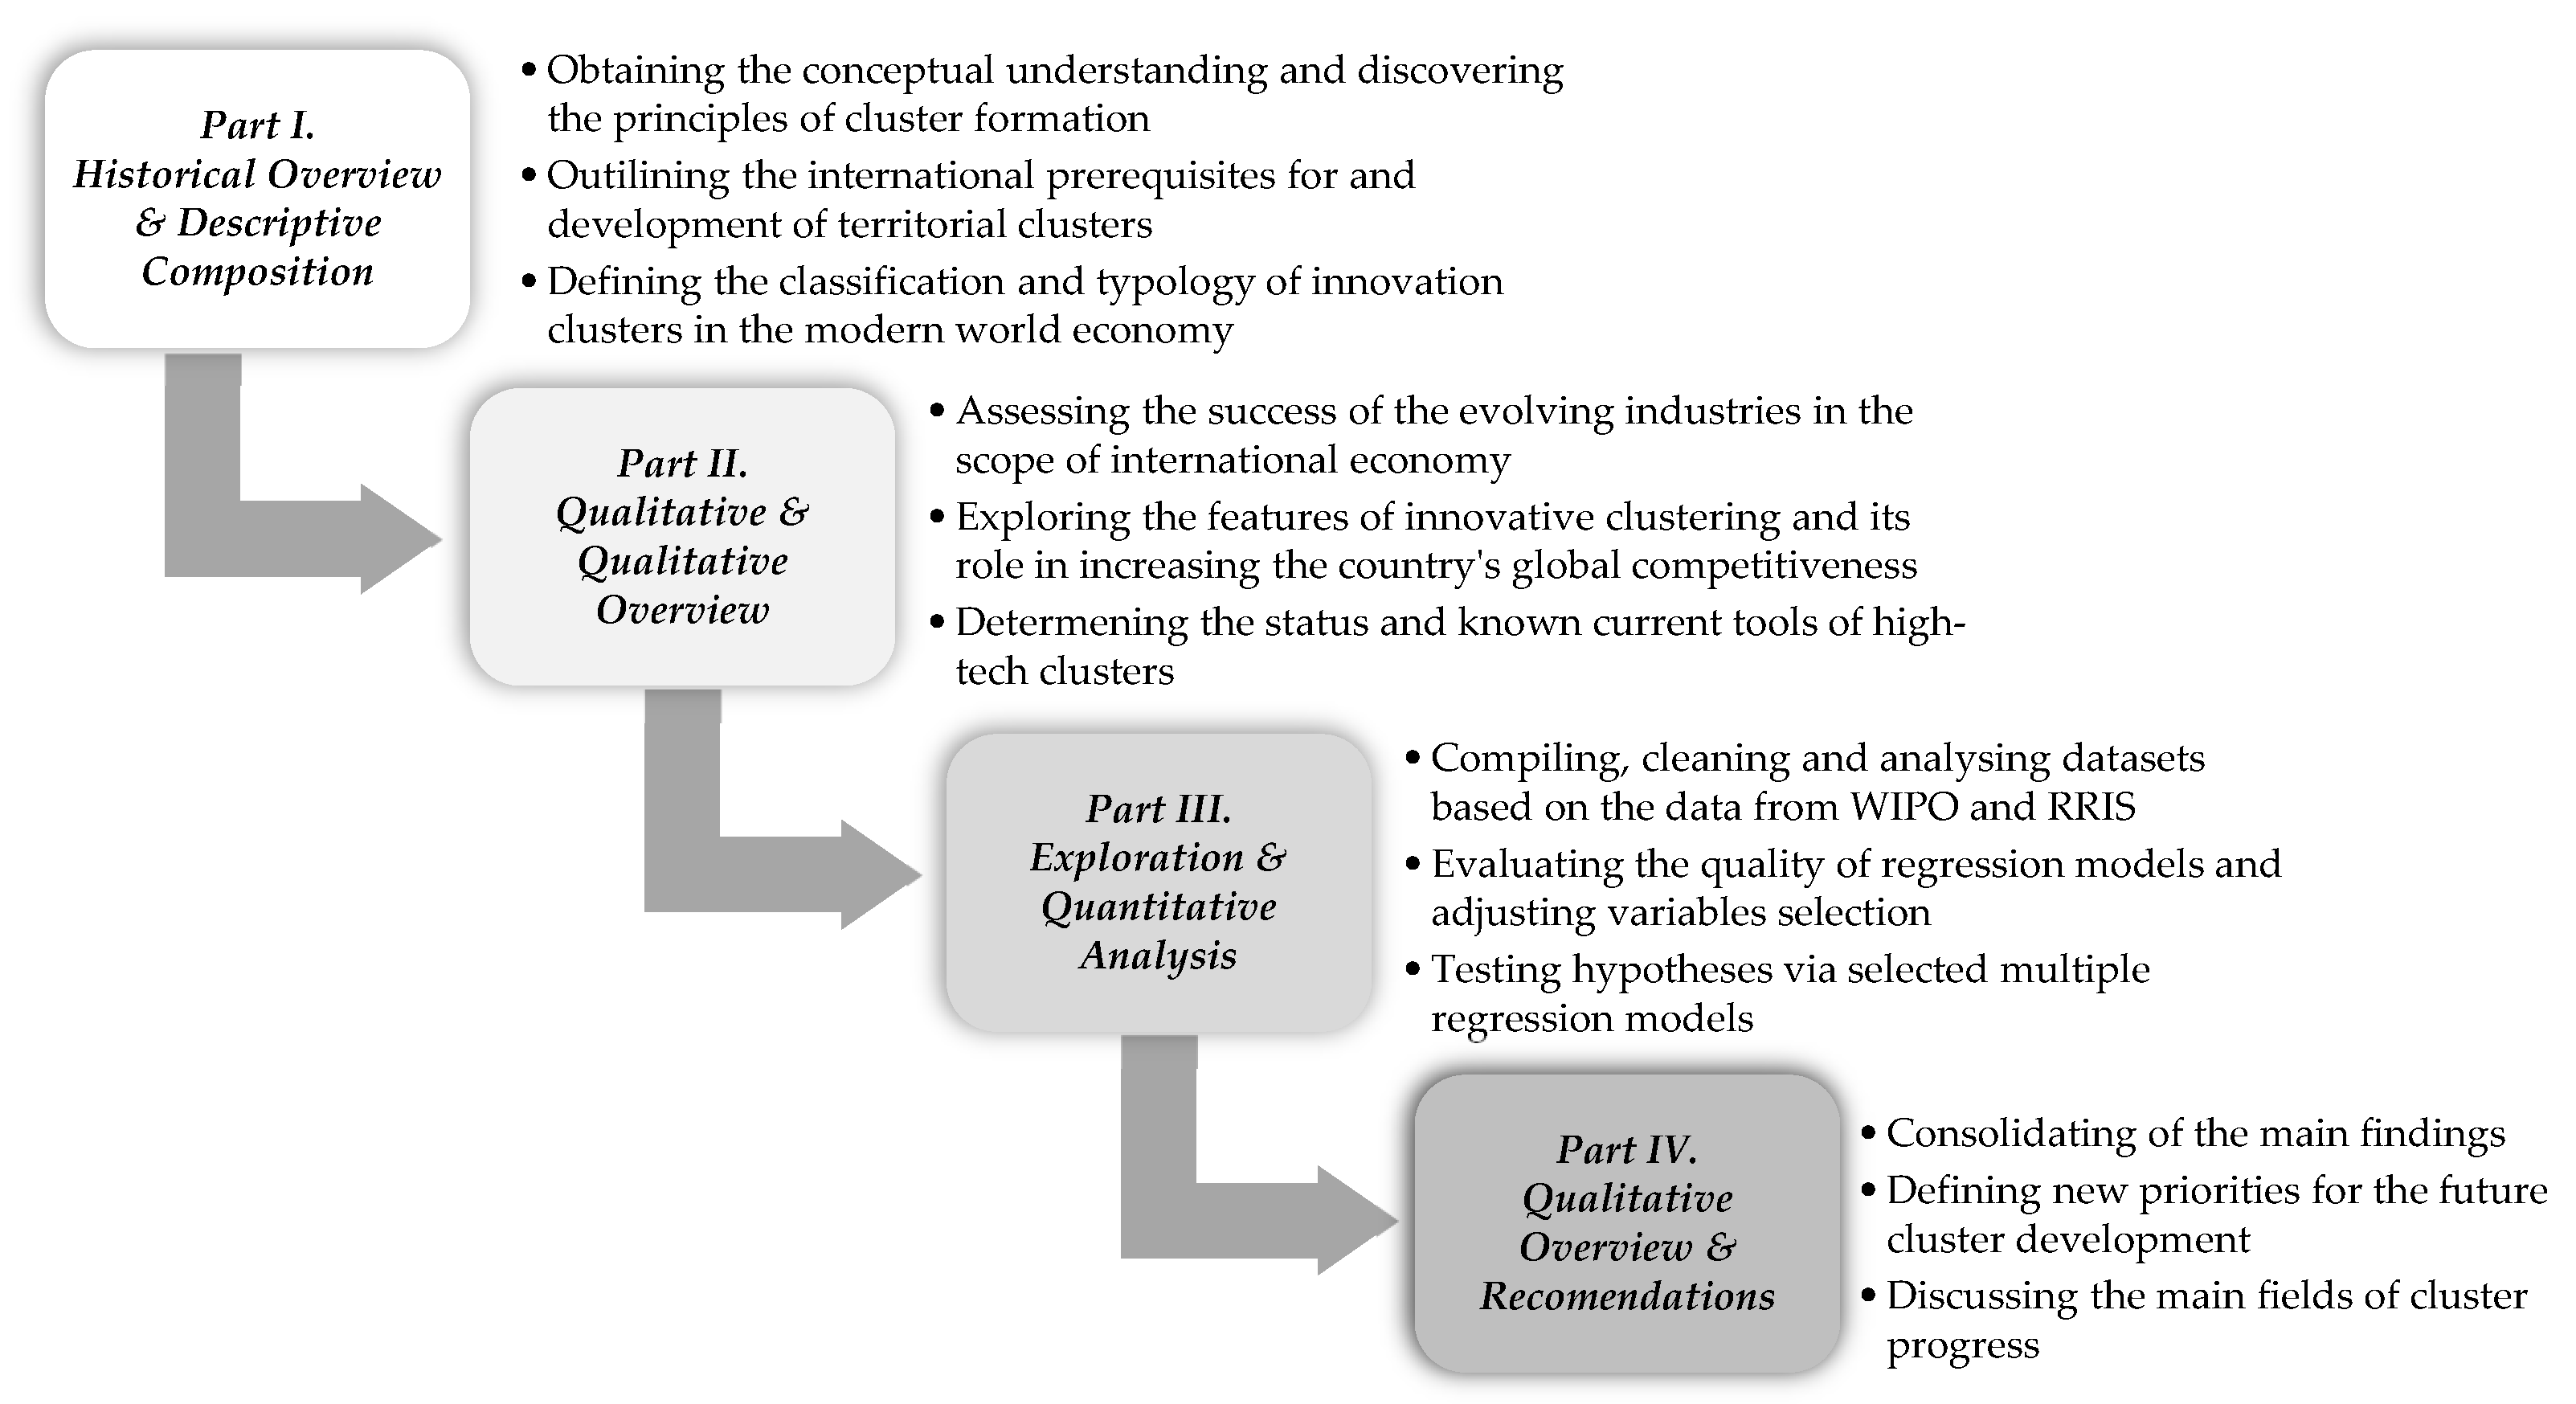
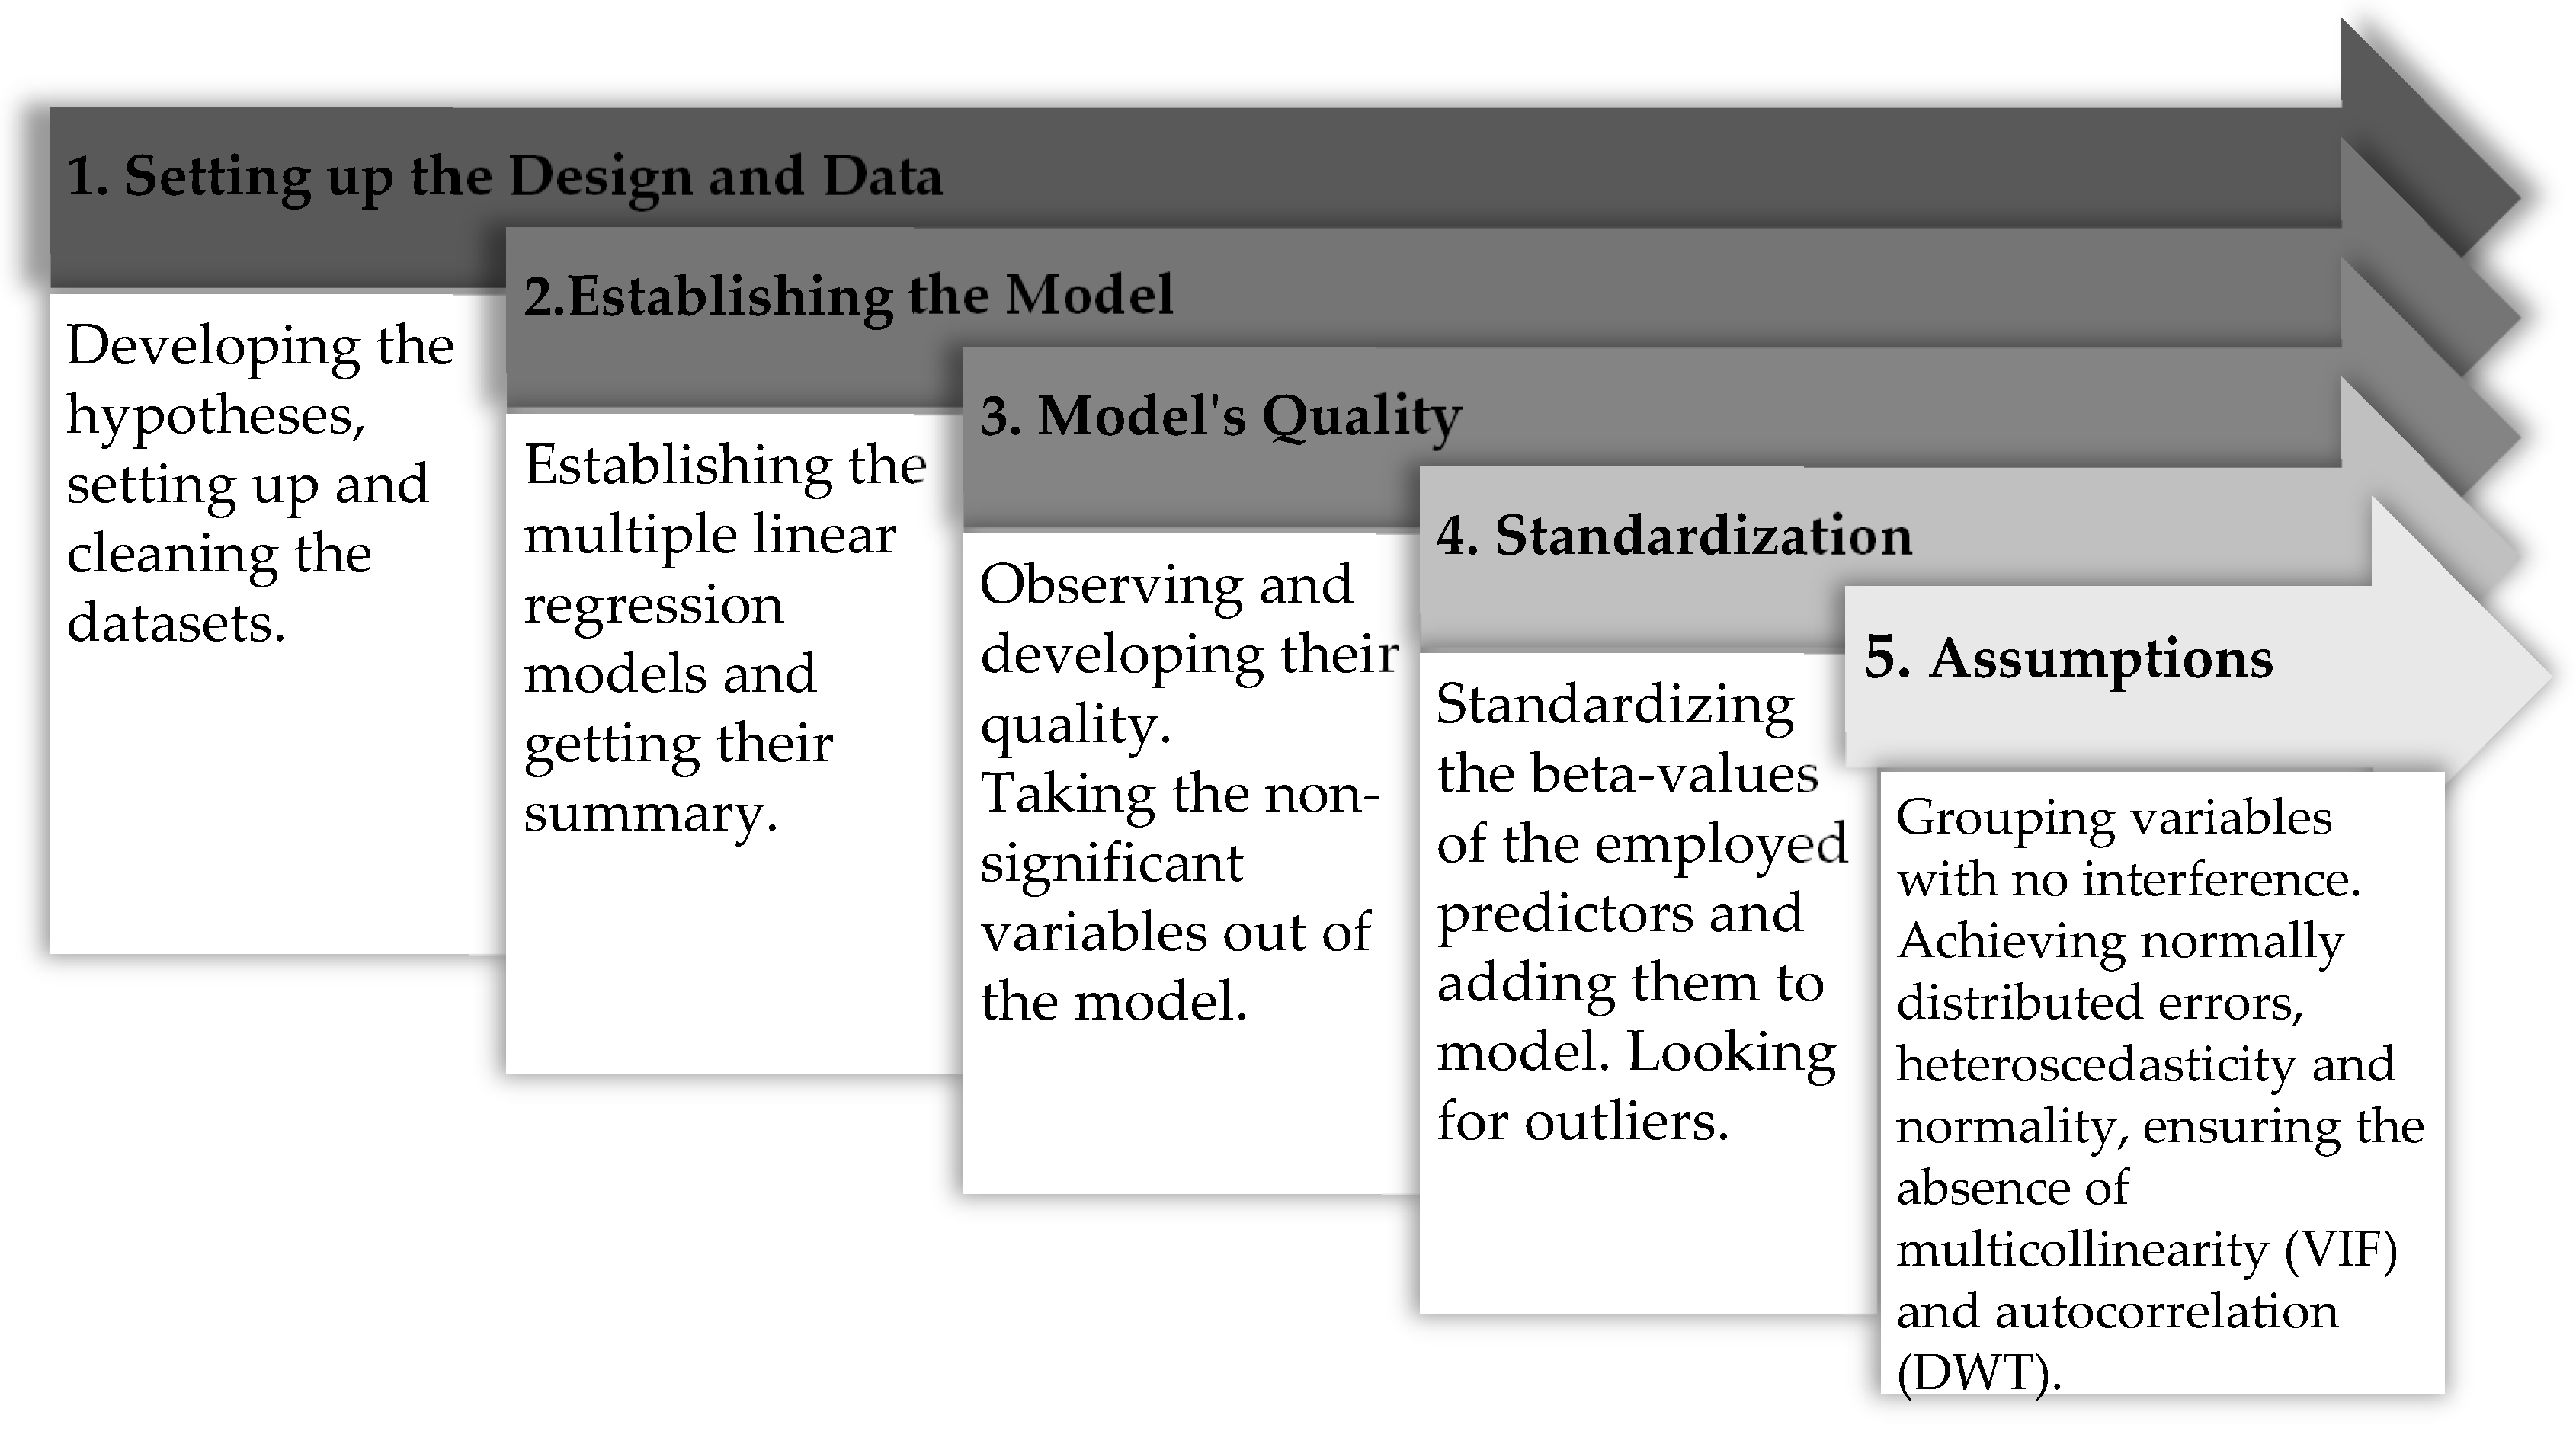
3.1. Qualitative and Quantitative Research
3.2. Data and Foundation for the Regression Analysis
4. Results
4.1. Regression Analysis Results for the First Hypothesis
4.2. Regression Analysis Results for the Second Hypothesis
- firms offering formal training, %—moderate significance (0.0170) and impact of 0.136176;
- university–industry collaboration in R&D—the maximum significance of 0.0000486 and estimator (0.361615);
- joint ventures/strategic alliances/bn GDP PPP—the moderate significance of 0.0120 with impact (0.146760).
- Patents by origin/billion GDP at PPP in USD—moderate significance (0.01450) and adverse effect (0.29440);
- PCT patents by origin/billion GDP PPP in USD—high significance (0.00187) and impact (0.60954);
- Quality certificates ISO 9001/bn GDP PPP—moderate significance (0.01291) and impact (−0.22761).
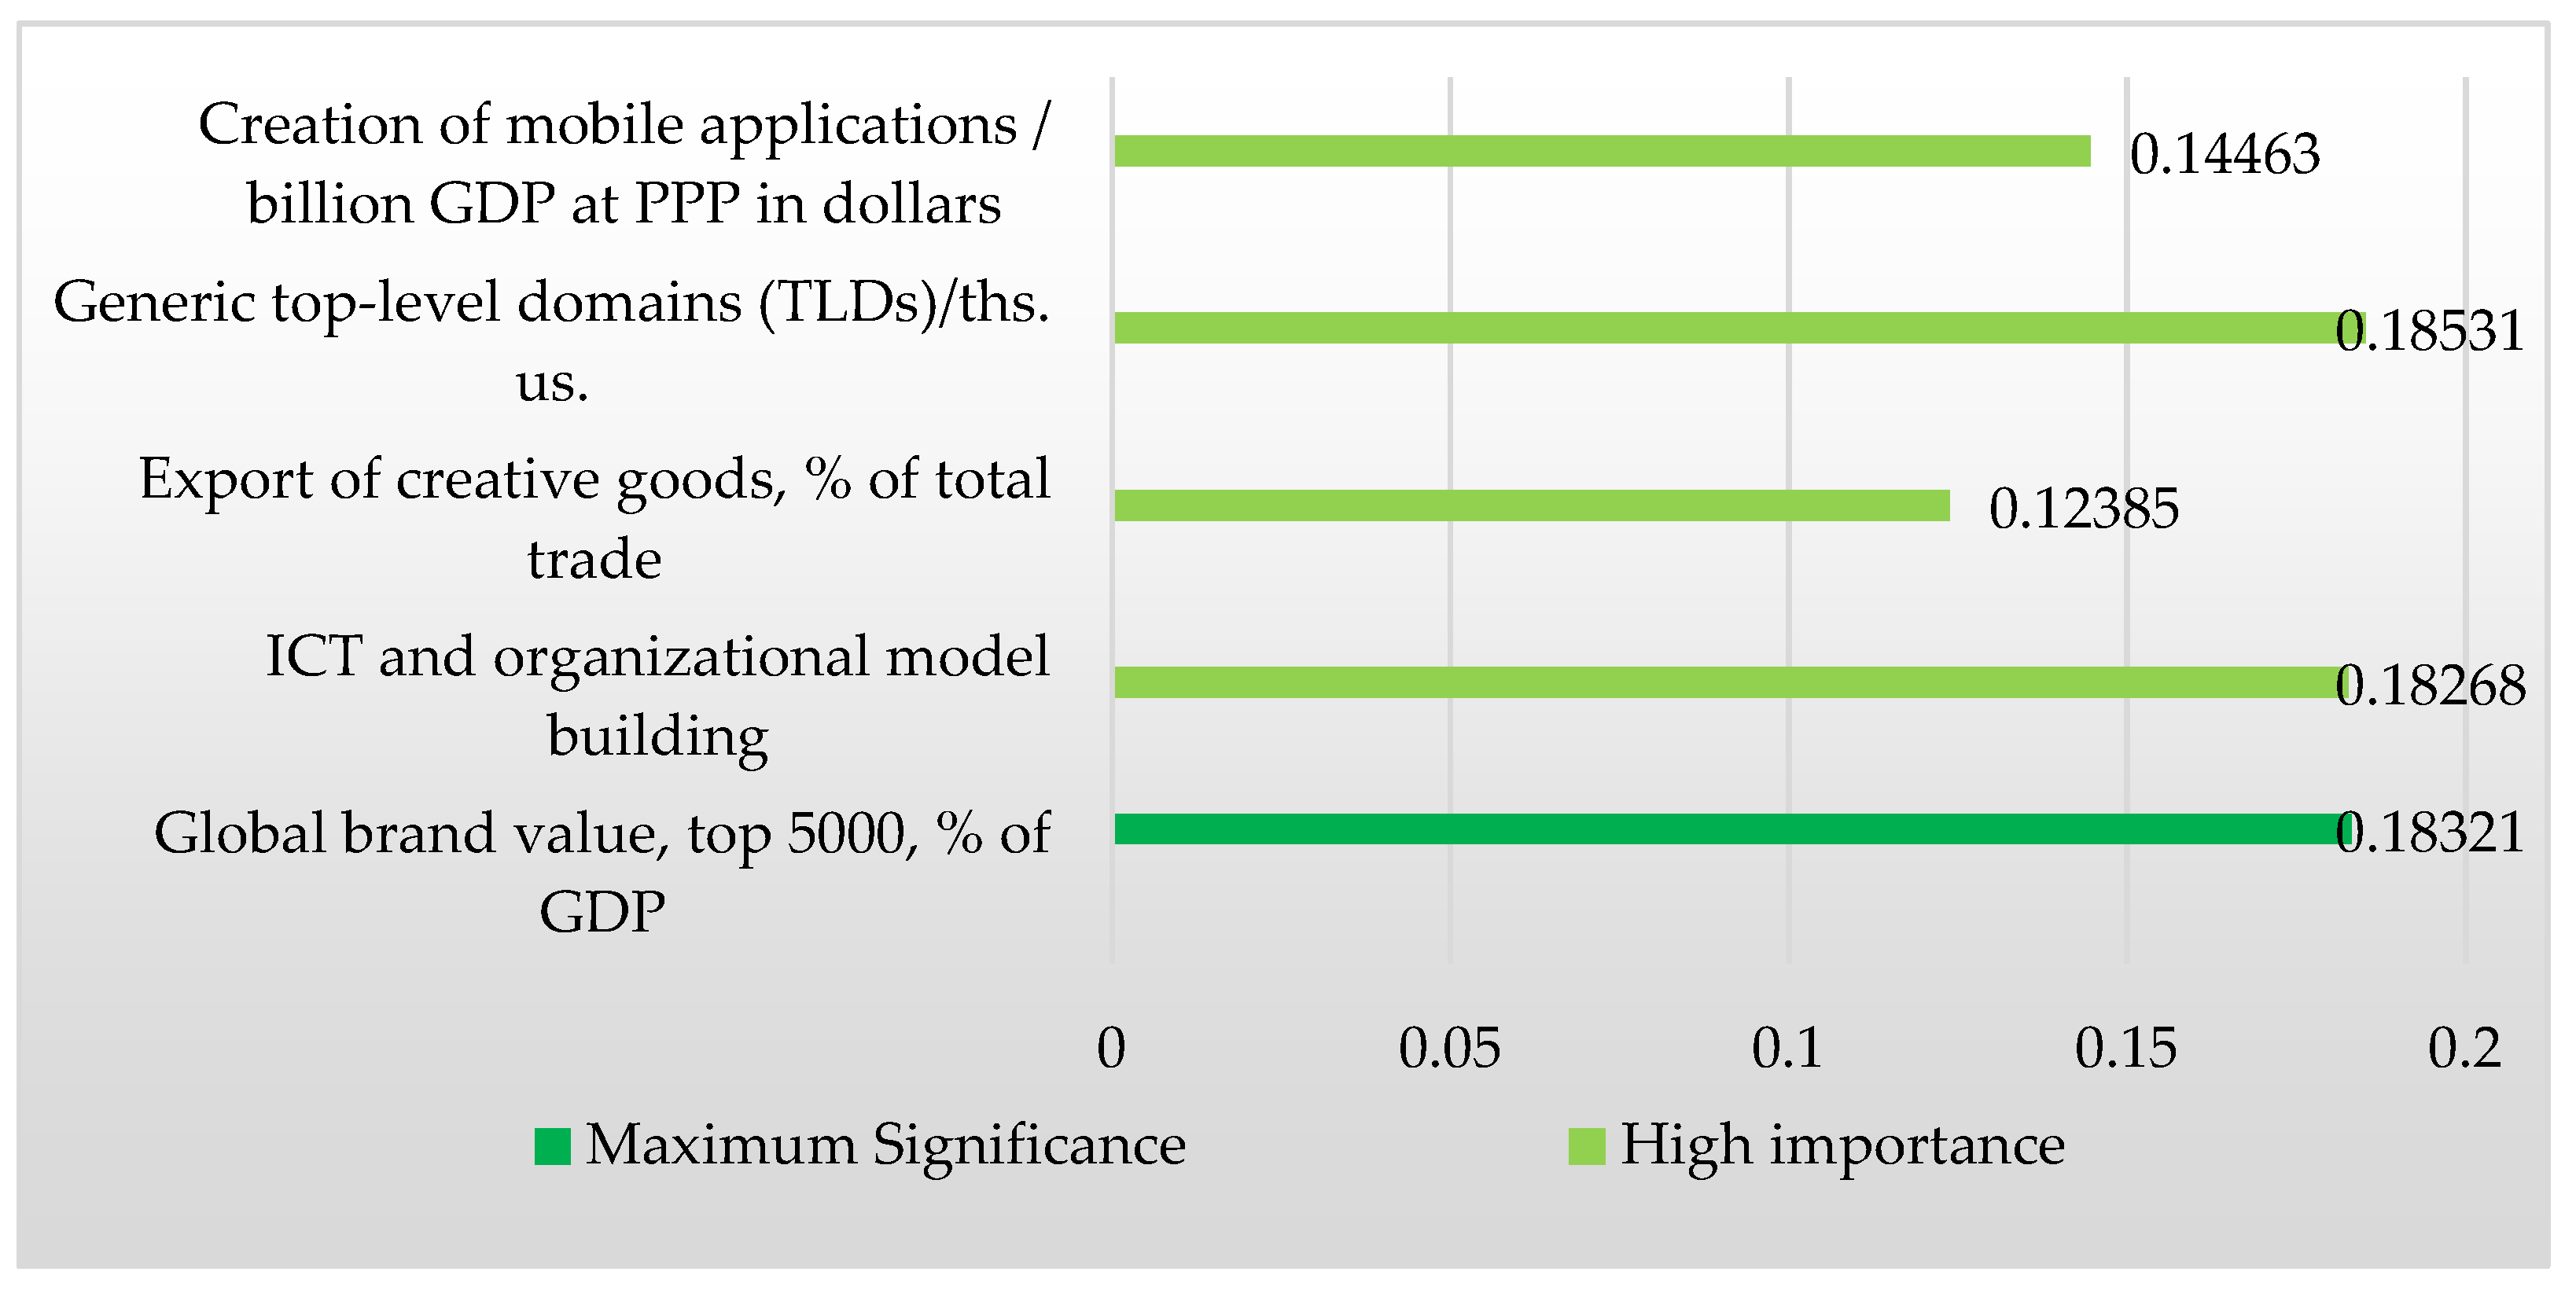
- Global brand value, top 5000, %GDP—moderate significance (0.03835) with an influence of 0.17840;
- ICT and organizational model building—moderate significance (0.02342) and impact (0.23437);
- Creation of mobile applications/billion GDP at PPP in dollars—high significance (0.00555) and impact (0.22703).
5. The Main Findings
5.1. Regression Analysis Results for the Hypotheses
5.2. Defining the New Priorities
- expand the scope and intensity of funding for high-tech research and priority areas in R&D centers and commercial institutions from the regional budget;
- reallocate budgetary resources towards increasing the share of funds allocated on competitive terms to stimulate greater effectiveness of scientific research and development,
- improve information and socio-cultural awareness systems to attract new innovative companies and small businesses to participate in scientific cooperation;
- significantly improve systems for encouraging scientists, mainly in the public sector, to define robust mechanisms for motivating talented people in high-tech disciplines;
- competitively motivate the population to increase the patent activity of Russian inventors abroad;
- create more favorable financial and technological conditions for motivating development institutions to support innovative projects;
- based on the best world experience, deepen the integration of science and education, improve the quality of training in high-tech areas, as well as in academics;
- optimize the contract and volunteer systems for training and recruiting specialists in innovative fields of activity supported by the boosted demand;
- reorganize the communication and management structure of executive, government, research, and commercial institutions;
- promote the participation of the local commercial market in the use of domestic innovations;
- intensify the export of goods and services coming from heavily specialized innovation clusters;
- establish more excellent political stability through increased government efficiency that strongly follows the need for renovation;
- accumulate a large proportion of researchers through the motivation of the population to increase incoming tertiary mobility;
- simplify procedures for obtaining domestic credit by the private sector and organize a new system of economic incentives for starting a new business;
- establish new diplomatic contacts for economic cooperation with clusters from other countries and create conditions for optimizing the net inflow of foreign direct investments in innovation;
- increase gross expenditure on R&D in an attempt to gradually expand the domestic market, providing more creative and high-tech in total trade;
- organize social and economic platforms to boost revenue from newly popularized intellectual property;
- open new programs for formal training through innovative firms, as well as create incentives for the activation of venture capital investors;
- initiate socio-cultural programs to popularize the use of information and communication technologies in order to increase interest in scientific and technical journalism;
- provide access to essential tools for creating mobile applications and modernizing the organizational model of communications;
- work towards continual improvement in the quality of primary, secondary, and vocational education to increase levels of competence in reading, mathematics, and other sciences;
- optimize the logistics infrastructure and intensify the interconnectivity of cluster regions;
- create regulatory and economic incentives to increase global awareness and value of domestic brands;
- optimize digital information channels to intensify the absorption of circulating scientific and educational information in the public domain;
- to implement new cultural programs to raise the authority of the administrative representatives of the state, improve the regular quality of the country and solidify the rule of law;
- constructively work on the quality of education in vocational schools to achieve new positions in the university rankings from QS World University Ranking;
- create pragmatic and attractive conditions for intensifying investment activity in innovative products in the regions;
- make cooperation between universities and industry in the field of R&D more omnipresent.
6. Results Discussion
Discussing Main Fields of Cluster Development
- Design and implement the new management methods and tools to achieve greater efficiency of investment development institutions in a region. The same should with the investments that go towards the financial institutions themselves;
- Conceptualization and interconnected formation of new institutions of investment development in regions;
- Applying a more concrete project specification of investment proposals when allocating the productive capacities in infrastructure and social projects;
- Creation and support of mechanisms for financing and development of investment platforms. These mechanisms will minimize the participation of the regional budget in the construction of innovative clusters;
- Design in greater detail the development plans for each participant of the investment cluster and outline the future growth of regions within a more extended period;
- Organize incentives for financing R&D from alternative sources, including incentive taxation;
- Modify the information base and improve researchers’ technical and instrumental equipment with better telecommunications;
- Implement unilateral support to improve scientific professions’ status and close participants’ socio-democratic gaps in research and international relations;
- Simplify the procedure for obtaining a patent and registering an industrial design.
7. Conclusions
Author Contributions
Funding
Institutional Review Board Statement
Informed Consent Statement
Data Availability Statement
Conflicts of Interest
Appendix A

| Group | Variable | Explanation |
|---|---|---|
| Group 1. Generalized variables’ influence on the leading countries’ GII and GCR. Variables represent the following fields: Institutions, Human capital, research, Infrastructure, Market sophistication, Business Sophistication, Innovation linkages, Knowledge and technology outputs, and creative outputs. | pol_envt_1_1 | Political environment |
| reg_envt_1_2 | Regulatory environment | |
| bus_envt_1_3 | Business environment | |
| edcn_2_1 | Education | |
| trt_edcn_2_2 | Tertiary education | |
| res_dev_2_3 | Research and development (R&D) | |
| info_commn_tech_3_1 | Information and communication technologies (ICTs) | |
| gnrl_infra_3_2 | General infrastructure | |
| eco_sust_3_3 | Ecological sustainability | |
| crdt_4_1 | Credit | |
| invest_4_2 | Investment | |
| trd_div_mark_scl_4_3 | Trade, diversification, and market scale | |
| know_works_5_1 | Knowledge workers | |
| innov_linkgs_5_2 | Innovation linkages | |
| know_absrb_5_3 | Knowledge absorption | |
| know_creat_6_1 | Knowledge creation | |
| know_impct_6_2 | Knowledge impact | |
| know_difsn_6_3 | Knowledge diffusion | |
| intang_assts_7_1 | Intangible assets | |
| creat_gds_servs_7_2 | Creative goods and services | |
| online_creat_7_3 | Online creativity | |
| Group 1. Complex variables’ influence on the leading countries’ GII and GCR. Variables represent the following fields: The political environment, Regulatory environment, and Business environment. | pol_oper_stab_1_1_1 | Political and operational stability |
| gov_effects_1_1_2 | Government effectiveness | |
| reg_qual_1_2_1 | Regulatory quality | |
| rul_law_1_2_2 | The rule of law | |
| cst_redcy_disms_1_2_3 | Cost of redundancy dismissal | |
| eas_start_bus_1_3_1 | Ease of starting a business | |
| eas_resol_insolv_1_3_2 | Ease of resolving insolvency | |
| Group 2. Complex variables’ influence on the leading countries’ GII and GCR. Variables represent the following fields: Education. | expd_edc_2_1_1 | Expenditure on education, % GDP |
| gov_fun_ppl_sec_2_1_2 | Government funding/pupil, secondary, % GDP/cap | |
| schl_lif_exp_2_1_3 | School life expectancy, years | |
| pisa_scls_rd_mth_sci_2_1_4 | PISA scales in reading, maths, and science | |
| ppl_tch_rat_sec_2_1_5 | Pupil-teacher ratio, secondary | |
| Group 3. Detailed variables’ impact on the leading countries’ GII and GCR. Variables represent the following fields: Tertiary education, Research, and Development. | trt_enrl_grs_2_2_1 | Tertiary enrolment, % gross |
| grad_sci_engin_2_2_2 | Graduates in science and engineering, % | |
| trt_inb_mob_2_2_3 | Tertiary inbound mobility, % | |
| resrs_fte_2_3_1 | Researchers, FTE/mn pop. | |
| grs_expd_res_dev_2_3_2 | Gross expenditure on R&D, % GDP | |
| glob_corp_r_d_invst_top_2_3_3 | Global corporate R&D investors, top three, mn USD | |
| qs_uni_rank_top3_2_3_4 | QS university ranking, top three | |
| Group 4. Complex variables’ impact on the leading countries’ GII and GCR. Variables represent the following fields: Information and communication technologies, General infrastructure, Ecological sustainability. | ict_accss_3_1_1 | ICT access |
| ict_use_3_1_2 | ICT use | |
| gov_onilne_srvc_3_1_3 | Government’s online service | |
| e_part_3_1_4 | E-participation | |
| elctro_outpt_3_2_1 | Electricity output, GWh/mn pop. | |
| logs_perf_3_2_2 | Logistics performance | |
| grs_cap_frm_gdp_3_2_3 | Gross capital formation, % GDP | |
| gdp_unt_ener_use_3_3_1 | GDP/unit of energy use | |
| envir_perf_3_3_2 | Environmental performance | |
| iso_14001_envir_cert_3_3_3 | ISO 14001 environmental certificates/bn PPP USD GDP | |
| Group 5. Detailed variables’ influence on the leading countries’ GII and GCR. Variables represent the following fields: Credit, Investment, Trade, diversification, and market scale. | eas_getng_creds_4_1_1 | Ease of getting credit |
| dom_cred_priv_sectr_gdp_4_1_2 | Domestic credit to private sector, % GDP | |
| mcrfin_grs_lns_gdp_4_1_3 | Microfinance gross loans, % GDP | |
| eas_prtc_mnr_invst_4_2_1 | Ease of protecting minority investors | |
| mrkt_cap_gdp_4_2_2 | Market capitalization, % GDP | |
| vntr_cap_invst_dls_gdp_4_2_3 | Venture capital investors, deals/bn PPP USD GDP | |
| vent_cap_recipnts_dls_gdp_4_2_4 | Venture capital recipients, deals/bn PPP USD GDP | |
| appd_trf_rte_wght_avg_4_3_1 | Applied tariff rate, weighted avg., % | |
| dom_ind_div_4_3_2 | Domestic industry diversification | |
| dom_mrkt_scl_4_3_3 | Domestic market scale, bn PPP USD | |
| Group 6. Detailed variables’ impact on the leading countries’ GII and GCR. Variables represent the following fields: Knowledge workers, Innovation linkages, Knowledge absorption. | know_int_empl_5_1_1 | Knowledge-intensive employment, % |
| frm_offgs_form_train_5_1_2 | Firms offering formal training, % | |
| gerd_perf_bus_gdp_5_1_3 | GERD performed by business, % GDP | |
| gerd_fin_bus_5_1_4 | GERD financed by business, % | |
| fem_empld_adv_dgrs_5_1_5 | Females employed w/advanced degrees, % | |
| uni_indry_r_d_col_5_2_1 | University–industry R&D collaboration †| |
| stte_clst_dev_dpth_5_2_2 | State of cluster development and depth †| |
| gerd_fin_abrd_gdp_5_2_3 | GERD financed abroad, % GDP | |
| joint_vent_strt_alli_dls_gdp_5_2_4 | Joint venture/strategic alliance deals/bn PPP USD GDP | |
| pat_fam_gdp_5_2_5 | Patent families/bn PPP USD GDP | |
| intel_prpt_pay_ttl_trd_5_3_1 | Intellectual property payments, % total trade | |
| hi_tech_imp_ttl_trd_5_3_2 | High-tech imports, % total trade | |
| ict_servs_imprt_ttl_trd_5_3_3 | ICT services imports, % total trade | |
| fdi_net_infls_gdp_5_3_4 | FDI net inflows, % GDP | |
| resch_tlnt_buss_5_3_5 | Research talent, % in businesses | |
| Group 7. Detailed variables’ influence on the leading countries’ GII and GCR. Variables represent the following fields: Knowledge creation, Knowledge impact, Knowledge diffusion. | ptnts_orgn_gdp_6_1_1 | Patents by origin/bn PPP USD GDP |
| pct_pat_orgn_gdp_6_1_2 | PCT patents by origin/bn PPP USD GDP | |
| util_mdls_orgn_gdp_6_1_3 | Utility models by origin/bn PPP USD GDP | |
| sci_tech_articl_gfp_6_1_4 | Scientific and technical articles/bn PPP USD GDP | |
| cit_doc_h_indx_6_1_5 | Citable documents H-index | |
| lbr_prod_grwth_6_2_1 | Labor productivity growth, % | |
| new_buss_th_pop_6_2_2 | New businesses/thousands pop. | |
| sftwre_spend_gdp_6_2_3 | Software spending, % GDP | |
| iso_9001_qual_cert_gdp_6_2_4 | ISO 9001 quality certificates/bn PPP USD GDP | |
| hi_tech_mnfct_6_2_5 | High-tech manufacturing, % | |
| intel_prop_rcipts_ttl_trd_6_3_1 | Intellectual property receipts, % total trade | |
| prodn_exp_cmplx_6_3_2 | Production and export complexity | |
| hi_tech_exp_ttl_trd_6_3_3 | High-tech exports, % total trade | |
| ict_srvs_exp_ttl_trd_6_3_4 | ICT services exports, % total trade | |
| Group 8. Detailed variables’ influence on the leading countries’ GII and GCR. Variables represent the following fields: Intangible assets, Creative goods, and services, Online creativity. | trdmks_orgn_gdp_7_1_1 | Trademarks by origin/bn PPP USD GDP |
| glob_brnd_val_top_5000_gdp_7_1_2 | Global brand value, top 5000% of GDP | |
| indust_dsgn_orgn_gdp_7_1_3 | Industrial designs by origin/bn PPP USD GDP | |
| ict_organ_mdl_creats_7_1_4 | ICTs and organizational model creation | |
| cult_creat_servs_exp_ttl_trd_7_2_1 | Cultural and creative services exports, % total trade | |
| ntnl_feat_films_7_2_2 | National feature films/mn pop. | |
| entermt_med_mrkt_7_2_3 | Entertainment and media market/thousand pop. | |
| print_othr_med_mnfrng_7_2_4 | Printing and other media, % manufacturing | |
| creat_gds_exprt_ttl_trd_7_2_5 | Creative goods exports, % total trade | |
| gen_top_lvl_dmns_tlds_7_3_1 | Generic top-level domains (TLDs)/thousand pop. | |
| country_tlds_7_3_2 | Country-code TLDs/thousand pop. | |
| wiki_edit_7_3_3 | Wikipedia edits/mn pop. | |
| mbl_app_creat_7_3_4 | Mobile app creation/bn PPP USD GDP |
| Multiple Linear Regression on Detailed World Cluster Indicators | |||||
|---|---|---|---|---|---|
| lm(formula = glob_innov_indx ~ pol_oper_stab_1_1_1 + gov_effects_1_1_2 + reg_qual_1_2_1 + rul_law_1_2_2 + cst_redcy_disms_1_2_3 +eas_start_bus_1_3_1 + eas_resol_insolv_1_3_2, data = clustdata_3) | |||||
| Residuals: | Min | 1Q | Median | 3Q | Max |
| −17.292 | −5.508 | −0.295 | 6.732 | 13.706 | |
| Coefficients | Estimate | Standard Error | t-value | Pr (>|t|) | Significance |
| pol_oper_stab_1_1_1 | −0.163871 | 0.093504 | −1.753 | 0.086977 | . |
| gov_effects_1_1_2 | 0.595766 | 0.141547 | 4.209 | 0.000132 | *** |
| reg_qual_1_2_1 | −0.157317 | 0.146073 | −1.077 | 0.287639 | |
| rul_law_1_2_2 | 0.207007 | 0.180931 | 1.144 | 0.259052 | |
| cst_redcy_disms_1_2_3 | −0.009371 | 0.035143 | −0.267 | 0.791038 | |
| eas_start_bus_1_3_1 | −0.005171 | 0.045881 | −0.113 | 0.910810 | |
| eas_resol_insolv_1_3_2 | 0.055890 | 0.051916 | 1.077 | 0.287824 | |
| Significance codes | 0 ‘***’ | 0.001 ‘**’ | 0.01 ‘*’ | 0.05 ‘.’ | 0.1 ‘’ |
| Residual standard error: | 8.28 on 42 degrees of freedom | ||||
| Multiple R-squared | 0.7234 | Adjusted R-squared | 0.6774 | ||
| F-statistic | 15.7 on 7 and 42 DF | p-value | 0.0000000006534 | ||
| Multiple Linear Regression on Detailed World Cluster Indicators | |||||
|---|---|---|---|---|---|
| lm(formula = glob_innov_indx ~ expd_edc_2_1_1 + gov_fun_ppl_sec_2_1_2 + schl_lif_exp_2_1_3 + pisa_scls_rd_mth_sci_2_1_4 + ppl_tch_rat_sec_2_1_5, data = clustdata_3) | |||||
| Residuals: | Min | 1Q | Median | 3Q | Max |
| −21.537 | −7.888 | −1.685 | 6.288 | 25.553 | |
| Coefficients | Estimate | Standard Error | t-value | Pr (>|t|) | Significance |
| expd_edc_2_1_1 | 0.081222 | 0.061687 | 1.317 | 0.194762 | |
| gov_fun_ppl_sec_2_1_2 | −0.005316 | 0.076400 | −0.070 | 0.944838 | |
| schl_lif_exp_2_1_3 | 0.114208 | 0.079670 | 1.434 | 0.158780 | |
| pisa_scls_rd_mth_sci_2_1_4 | 0.470633 | 0.114425 | 4.113 | 0.000168 | *** |
| ppl_tch_rat_sec_2_1_5 | −0.015419 | 0.063405 | −0.243 | 0.809000 | |
| Significance codes | 0 ‘***’ | 0.001 ‘**’ | 0.01 ‘*’ | 0.05 ‘.’ | 0.1 ‘’ |
| Residual standard error: | 11.86 on 44 degrees of freedom | ||||
| Multiple R-squared | 0.4053 | Adjusted R-squared | 0.3377 | ||
| F-statistic | 5.997 on 5 and 44 DF | p-value | 0.0002591 | ||
| Multiple Linear Regression on Detailed World Cluster Indicators | |||||
|---|---|---|---|---|---|
| lm(formula = glob_innov_indx ~ trt_enrl_grs_2_2_1 + grad_sci_engin_2_2_2 + trt_inb_mob_2_2_3 + resrs_fte_2_3_1 + grs_expd_res_dev_2_3_2 + glob_corp_r_d_invst_top_2_3_3 + qs_uni_rank_top3_2_3_4, data = clustdata_3) | |||||
| Residuals: | Min | 1Q | Median | 3Q | Max |
| −13.938 | −4.511 | 1.361 | 4.714 | 12.002 | |
| Coefficients | Estimate | Standard Error | t-value | Pr (>|t|) | Significance |
| trt_enrl_grs_2_2_1 | −0.029578 | 0.050302 | −0.588 | 0.5597 | |
| grad_sci_engin_2_2_2 | 0.001215 | 0.043818 | 0.028 | 0.9780 | |
| trt_inb_mob_2_2_3 | 0.084239 | 0.045282 | 1.860 | 0.0699 | . |
| resrs_fte_2_3_1 | 0.342458 | 0.138373 | 2.475 | 0.0174 | * |
| grs_expd_res_dev_2_3_2 | 0.061844 | 0.138981 | 0.445 | 0.6586 | |
| glob_corp_r_d_invst_top_2_3_3 | 0.399705 | 0.128724 | 3.105 | 0.0034 | ** |
| qs_uni_rank_top3_2_3_4 | 0.090795 | 0.073093 | 1.242 | 0.2211 | |
| Significance codes | 0 ‘***’ | 0.001 ‘**’ | 0.01 ‘*’ | 0.05 ‘.’ | 0.1 ‘’ |
| Residual standard error: | 7.214 on 42 degrees of freedom | ||||
| Multiple R-squared | 0.7901 | Adjusted R-squared | 0.7551 | ||
| F-statistic | 22.58 on 7 and 42 DF | p-value | 0.000000000002455 | ||
| Multiple Linear Regression on Detailed World Cluster Indicators | |||||
|---|---|---|---|---|---|
| lm(formula = glob_innov_indx ~ ict_accss_3_1_1 + ict_use_3_1_2 + gov_onilne_srvc_3_1_3 + e_part_3_1_4 + elctro_outpt_3_2_1 + logs_perf_3_2_2 + grs_cap_frm_gdp_3_2_3 + gdp_unt_ener_use_3_3_1 + envir_perf_3_3_2 + iso_14001_envir_cert_3_3_3, data = clustdata_3) | |||||
| Residuals: | Min | 1Q | Median | 3Q | Max |
| −14.6983 | −4.3034 | −0.4233 | 3.9970 | 22.4092 | |
| Coefficients | Estimate | Standard Error | t-value | Pr (>|t|) | Significance |
| ict_accss_3_1_1 | −0.028523 | 0.091829 | −0.311 | 0.75776 | |
| ict_use_3_1_2 | 0.323226 | 0.121049 | 2.670 | 0.01100 | * |
| gov_onilne_srvc_3_1_3 | 0.069525 | 0.111721 | 0.622 | 0.53736 | |
| e_part_3_1_4 | −0.003655 | 0.102806 | −0.036 | 0.97182 | |
| elctro_outpt_3_2_1 | 0.058136 | 0.091476 | 0.636 | 0.52879 | |
| logs_perf_3_2_2 | 0.292538 | 0.083509 | 3.503 | 0.00117 | *** |
| grs_cap_frm_gdp_3_2_3 | 0.041162 | 0.050466 | 0.816 | 0.41966 | |
| gdp_unt_ener_use_3_3_1 | 0.009448 | 0.051504 | 0.183 | 0.85540 | |
| envir_perf_3_3_2 | −0.022907 | 0.095193 | −0.241 | 0.81109 | |
| iso_14001_envir_cert_3_3_3 | −0.058217 | 0.051487 | −1.13 | 0.26508 | |
| Significance codes | 0 ‘***’ | 0.001 ‘**’ | 0.01 ‘*’ | 0.05 ‘.’ | 0.1 ‘’ |
| Residual standard error: | 8.068 on 39 degrees of freedom | ||||
| Multiple R-squared | 0.7562 | Adjusted R-squared | 0.6937 | ||
| F-statistic | 12.1 on 10 and 39 DF | p-value | 0.000000003774 | ||
| Multiple Linear Regression on Detailed World Cluster Indicators | |||||
|---|---|---|---|---|---|
| lm(formula = glob_innov_indx ~ eas_getng_creds_4_1_1 + dom_cred_priv_sectr_gdp_4_1_2 + mcrfin_grs_lns_gdp_4_1_3 + eas_prtc_mnr_invst_4_2_1 + mrkt_cap_gdp_4_2_2 + vntr_cap_invst_dls_gdp_4_2_3 + vent_cap_recipnts_dls_gdp_4_2_4 + appd_trf_rte_wght_avg_4_3_1 + dom_ind_div_4_3_2 + dom_mrkt_scl_4_3_3, data = clustdata_3) | |||||
| Residuals: | Min | 1Q | Median | 3Q | Max |
| −14.557 | −6.011 | −2.242 | 5.295 | 17.630 | |
| Coefficients | Estimate | Standard Error | t-value | Pr (>|t|) | Significance |
| eas_getng_creds_4_1_1 | −0.064568 | 0.045077 | −1.432 | 0.16000 | |
| dom_cred_priv_sectr_gdp_4_1_2 | 0.127132 | 0.054785 | 2.321 | 0.02563 | * |
| mcrfin_grs_lns_gdp_4_1_3 | 0.052633 | 0.061191 | 0.860 | 0.39497 | |
| eas_prtc_mnr_invst_4_2_1 | −0.047410 | 0.052548 | −0.902 | 0.37247 | |
| mrkt_cap_gdp_4_2_2 | 0.035677 | 0.071559 | 0.499 | 0.62089 | |
| vntr_cap_invst_dls_gdp_4_2_3 | 0.281821 | 0.087648 | 3.215 | 0.00262 | ** |
| vent_cap_recipnts_dls_gdp_4_2_4 | 0.067587 | 0.071185 | 0.949 | 0.34823 | |
| appd_trf_rte_wght_avg_4_3_1 | 0.004719 | 0.050611 | 0.093 | 0.92619 | |
| dom_ind_div_4_3_2 | −0.020118 | 0.057846 | −0.348 | 0.72988 | |
| dom_mrkt_scl_4_3_3 | 0.145226 | 0.050235 | 2.891 | 0.00625 | ** |
| Significance codes | 0 ‘***’ | 0.001 ‘**’ | 0.01 ‘*’ | 0.05 ‘.’ | 0.1 ‘’ |
| Residual standard error: | 8.597 on 39 degrees of freedom | ||||
| Multiple R-squared | 0.7232 | Adjusted R-squared | 0.6522 | ||
| F-statistic | 10.19 on 10 and 39 DF | p-value | 0.00000003809 | ||
| Multiple Linear Regression on Detailed World Cluster Indicators | |||||
|---|---|---|---|---|---|
| lm(formula = glob_innov_indx ~ know_int_empl_5_1_1 + frm_offgs_form_train_5_1_2 + gerd_perf_bus_gdp_5_1_3 + gerd_fin_bus_5_1_4 + fem_empld_adv_dgrs_5_1_5 + uni_indry_r_d_col_5_2_1 + stte_clst_dev_dpth_5_2_2 + gerd_fin_abrd_gdp_5_2_3 + joint_vent_strt_alli_dls_gdp_5_2_4 + pat_fam_gdp_5_2_5 + intel_prpt_pay_ttl_trd_5_3_1 + hi_tech_imp_ttl_trd_5_3_2 + ict_servs_imprt_ttl_trd_5_3_3 + fdi_net_infls_gdp_5_3_4 + resch_tlnt_buss_5_3_5, data = clustdata_3) | |||||
| Residuals: | Min | 1Q | Median | 3Q | Max |
| −9.2065 | −3.2165 | −0.0226 | 2.9250 | 6.8455 | |
| Coefficients | Estimate | Standard Error | t-value | Pr (>|t|) | Significance |
| know_int_empl_5_1_1 | 0.052218 | 0.055063 | 0.948 | 0.34965 | |
| frm_offgs_form_train_5_1_2 | 0.095343 | 0.033610 | 2.837 | 0.00763 | ** |
| gerd_perf_bus_gdp_5_1_3 | 0.342999 | 0.108123 | 3.172 | 0.00320 | ** |
| gerd_fin_bus_5_1_4 | −0.033702 | 0.065372 | −0.516 | 0.60951 | |
| fem_empld_adv_dgrs_5_1_5 | 0.002486 | 0.049871 | 0.050 | 0.96054 | |
| uni_indry_r_d_col_5_2_1 | 0.052491 | 0.049048 | 1.070 | 0.29206 | |
| stte_clst_dev_dpth_5_2_2 | 0.070823 | 0.044942 | 1.576 | 0.12432 | |
| gerd_fin_abrd_gdp_5_2_3 | −0.046814 | 0.040470 | −1.157 | 0.25544 | |
| joint_vent_strt_alli_dls_gdp_5_2_4 | 0.054855 | 0.034897 | 1.572 | 0.12524 | |
| pat_fam_gdp_5_2_5 | 0.170581 | 0.069345 | 2.460 | 0.01914 | * |
| intel_prpt_pay_ttl_trd_5_3_1 | 0.018258 | 0.034211 | 0.534 | 0.59703 | |
| hi_tech_imp_ttl_trd_5_3_2 | 0.024762 | 0.026189 | 0.946 | 0.35107 | |
| ict_servs_imprt_ttl_trd_5_3_3 | 0.017184 | 0.030097 | 0.571 | 0.57179 | |
| fdi_net_infls_gdp_5_3_4 | 0.047350 | 0.020375 | 2.324 | 0.02624 | * |
| resch_tlnt_buss_5_3_5 | −0.045329 | 0.071114 | −0.637 | 0.52813 | |
| Significance codes | 0 ‘***’ | 0.001 ‘**’ | 0.01 ‘*’ | 0.05 ‘.’ | 0.1 ‘’ |
| Residual standard error: | 4.692 on 34 degrees of freedom | ||||
| Multiple R-squared | 0.9281 | Adjusted R-squared | 0.8964 | ||
| F-statistic | 29.26 on 15 and 34 DF | p-value | 0.000000000000004386 | ||
| Multiple Linear Regression on Detailed World Cluster Indicators | |||||
|---|---|---|---|---|---|
| lm(formula = glob_innov_indx ~ ptnts_orgn_gdp_6_1_1 + pct_pat_orgn_gdp_6_1_2 + util_mdls_orgn_gdp_6_1_3 + sci_tech_articl_gfp_6_1_4 + cit_doc_h_indx_6_1_5 + lbr_prod_grwth_6_2_1 + new_buss_th_pop_6_2_2 + sftwre_spend_gdp_6_2_3 + iso_9001_qual_cert_gdp_6_2_4 + hi_tech_mnfct_6_2_5 + intel_prop_rcipts_ttl_trd_6_3_1 + prodn_exp_cmplx_6_3_2 + hi_tech_exp_ttl_trd_6_3_3 + ict_srvs_exp_ttl_trd_6_3_4, data = clustdata_3) | |||||
| Residuals: | Min | 1Q | Median | 3Q | Max |
| −10.2562 | −3.1863 | −0.2367 | 3.6327 | 12.1574 | |
| Coefficients | Estimate | Standard Error | t-value | Pr (>|t|) | Significance |
| ptnts_orgn_gdp_6_1_1 | −0.098235 | 0.054282 | −1.810 | 0.07894 | . |
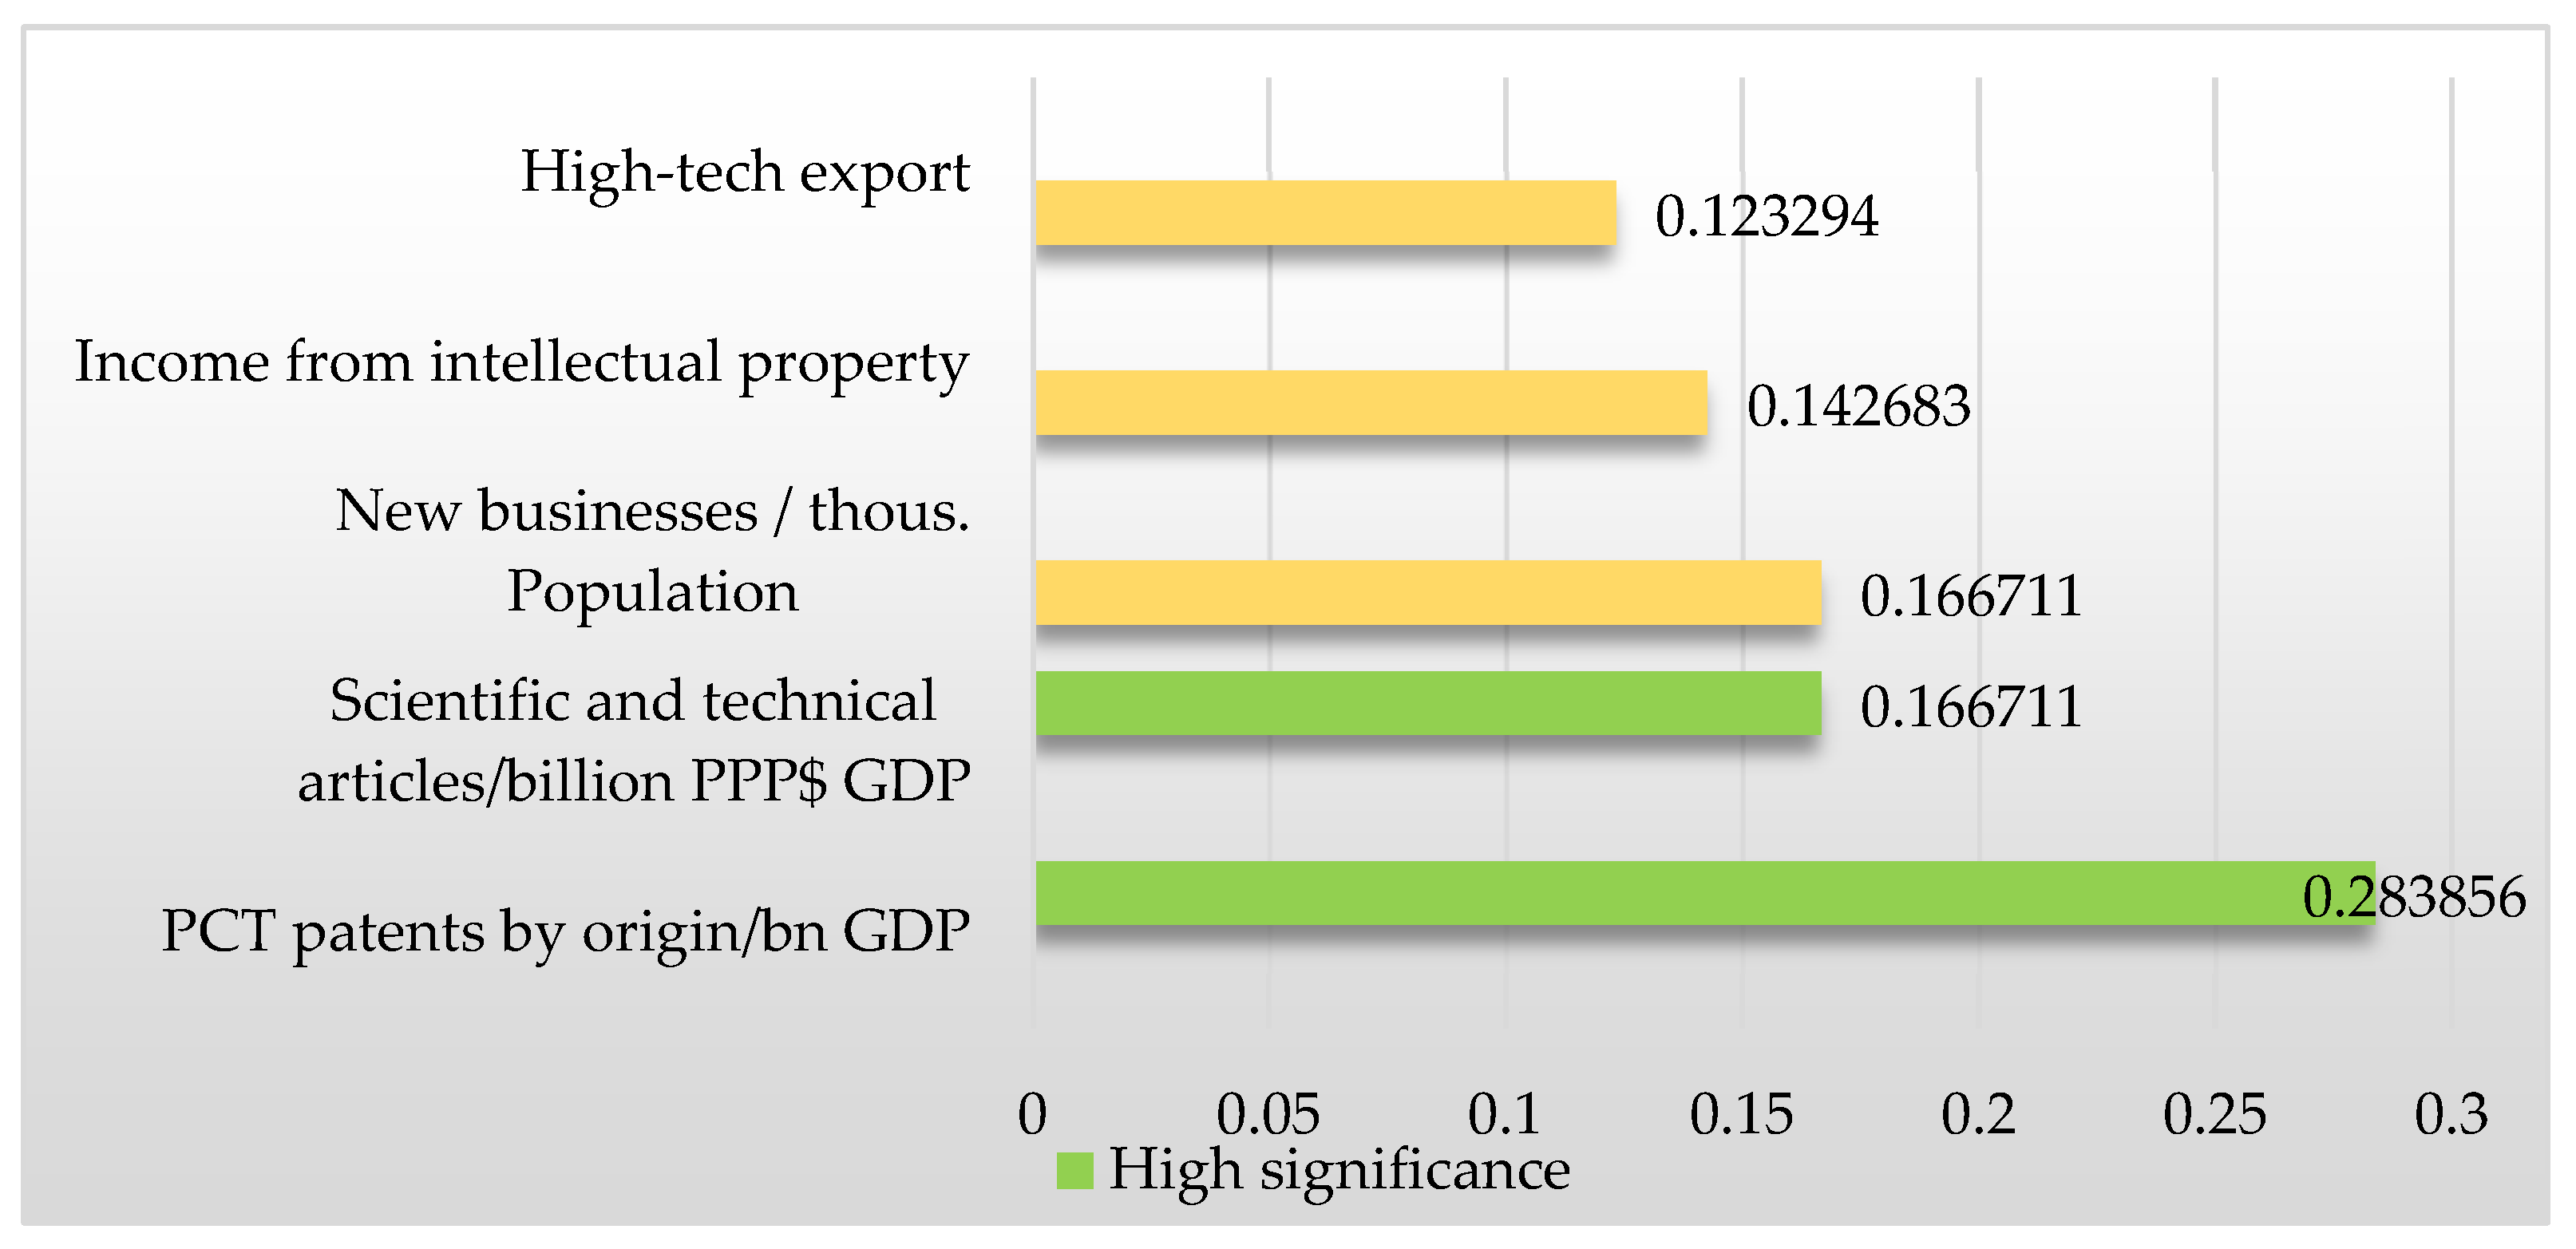
| pct_pat_orgn_gdp_6_1_2 | 0.283856 | 0.079522 | 3.570 | 0.00106 | ** |
| util_mdls_orgn_gdp_6_1_3 | 0.030213 | 0.044690 | 0.676 | 0.50344 | |
| sci_tech_articl_gfp_6_1_4 | 0.166711 | 0.051631 | 3.229 | 0.00270 | ** |
| cit_doc_h_indx_6_1_5 | 0.008406 | 0.067363 | 0.125 | 0.90141 | |
| lbr_prod_grwth_6_2_1 | 0.046115 | 0.036580 | 1.261 | 0.21576 | |
| new_buss_th_pop_6_2_2 | 0.073564 | 0.034042 | 2.161 | 0.03762 | * |
| sftwre_spend_gdp_6_2_3 | 0.063021 | 0.037435 | 1.683 | 0.10119 | |
| iso_9001_qual_cert_gdp_6_2_4 | −0.114786 | 0.047308 | −2.426 | 0.02054 | * |
| hi_tech_mnfct_6_2_5 | 0.086854 | 0.077963 | 1.114 | 0.27285 | |
| intel_prop_rcipts_ttl_trd_6_3_1 | 0.142683 | 0.062881 | 2.269 | 0.02953 | * |
| prodn_exp_cmplx_6_3_2 | 0.094308 | 0.061031 | 1.545 | 0.13128 | |
| hi_tech_exp_ttl_trd_6_3_3 | 0.123294 | 0.057204 | 2.155 | 0.03809 | * |
| ict_srvs_exp_ttl_trd_6_3_4 | −0.014180 | 0.031501 | −0.450 | 0.65538 | |
| Significance codes | 0 ‘***’ | 0.001 ‘**’ | 0.01 ‘*’ | 0.05 ‘.’ | 0.1 ‘’ |
| Residual standard error: | 5.529 on 35 degrees of freedom | ||||
| Multiple R-squared | 0.8972 | Adjusted R-squared | 0.8561 | ||
| F-statistic | 21.83 on 14 and 35DF | p-value | 0.0000000000003222 | ||
| Multiple Linear Regression on Detailed World Cluster Indicators | |||||
|---|---|---|---|---|---|
| lm(formula = glob_innov_indx ~ trdmks_orgn_gdp_7_1_1 + glob_brnd_val_top_5000_gdp_7_1_2 + indust_dsgn_orgn_gdp_7_1_3 + ict_organ_mdl_creats_7_1_4 + cult_creat_servs_exp_ttl_trd_7_2_1 + ntnl_feat_films_7_2_2 + entermt_med_mrkt_7_2_3 + print_othr_med_mnfrng_7_2_4 + creat_gds_exprt_ttl_trd_7_2_5+ gen_top_lvl_dmns_tlds_7_3_1 + country_tlds_7_3_2 + wiki_edit_7_3_3 + mbl_app_creat_7_3_4, data = clustdata_3) | |||||
| Residuals: | Min | 1Q | Median | 3Q | Max |
| −13.2249 | −3.6059 | −0.4945 | 3.0047 | 13.5717 | |
| Coefficients | Estimate | Standard Error | t-value | Pr (>|t|) | Significance |
| trdmks_orgn_gdp_7_1_1 | 0.01445 | 0.04333 | 0.333 | 0.74076 | |
| glob_brnd_val_top_5000_gdp_7_1_2 | 0.18321 | 0.04083 | 4.487 | 0.0000712 | *** |
| indust_dsgn_orgn_gdp_7_1_3 | 0.07141 | 0.04542 | 1.572 | 0.12463 | |
| ict_organ_mdl_creats_7_1_4 | 0.18268 | 0.05402 | 3.382 | 0.00175 | ** |
| cult_creat_servs_exp_ttl_trd_7_2_1 | 0.01818 | 0.04472 | 0.407 | 0.68673 | |
| ntnl_feat_films_7_2_2 | 0.02478 | 0.04737 | 0.523 | 0.60418 | |
| entermt_med_mrkt_7_2_3 | 0.08643 | 0.07988 | 1.082 | 0.28646 | |
| print_othr_med_mnfrng_7_2_4 | −0.05315 | 0.04166 | −1.276 | 0.21017 | |
| creat_gds_exprt_ttl_trd_7_2_5 | 0.12385 | 0.04276 | 2.896 | 0.00639 | ** |
| gen_top_lvl_dmns_tlds_7_3_1 | 0.18531 | 0.05740 | 3.228 | 0.00266 | ** |
| country_tlds_7_3_2 | −0.01656 | 0.06655 | −0.249 | 0.80489 | |
| wiki_edit_7_3_3 | 0.09497 | 0.07073 | 1.343 | 0.18777 | |
| mbl_app_creat_7_3_4 | 0.14463 | 0.04760 | 3.038 | 0.00441 | ** |
| Significance codes | 0 ‘***’ | 0.001 ‘**’ | 0.01 ‘*’ | 0.05 ‘.’ | 0.1 ‘’ |
| Residual standard error: | 6.088 on 36 degrees of freedom | ||||
| Multiple R-squared | 0.8719 | Adjusted R-squared | 0.8256 | ||
| F-statistic | 18.84 on 13 and 36 DF | p-value | 0.000000000002914 | ||
| Multiple Linear Regression on Detailed World Cluster Indicators | |||||
|---|---|---|---|---|---|
| lm(formula = comp_rank ~ pol_envt_1_1 + reg_envt_1_2 + bus_envt_1_3 + edcn_2_1 + trt_edcn_2_2 + res_dev_2_3 + info_commn_tech_3_1 + gnrl_infra_3_2 + eco_sust_3_3 + crdt_4_1 + invest_4_2 + trd_div_mark_scl_4_3 + know_works_5_1 + innov_linkgs_5_2 + know_absrb_5_3 + know_creat_6_1 + know_impct_6_2 + know_difsn_6_3 + intang_assts_7_1 + creat_gds_servs_7_2 + online_creat_7_3, data = clustdata_2_comp) | |||||
| Residuals: | Min | 1Q | Median | 3Q | Max |
| −14.5828 | −3.6565 | 0.1154 | 3.7406 | 10.4262 | |
| Coefficients | Estimate | Standard Error | t-value | Pr (>|t|) | Significance |
| pol_envt_1_1 | 0.289614 | 0.197372 | 1.467 | 0.15526 | |
| reg_envt_1_2 | 0.006527 | 0.087055 | 0.075 | 0.94086 | |
| bus_envt_1_3 | −0.038233 | 0.087538 | −0.437 | 0.66619 | |
| edcn_2_1 | 0.016010 | 0.081392 | 0.197 | 0.84571 | |
| trt_edcn_2_2 | 0.085048 | 0.070851 | 1.200 | 0.24171 | |
| res_dev_2_3 | −0.006140 | 0.176948 | −0.035 | 0.97260 | |
| info_commn_tech_3_1 | −0.114156 | 0.123641 | −0.923 | 0.36505 | |
| gnrl_infra_3_2 | −0.031974 | 0.085881 | −0.372 | 0.71293 | |
| eco_sust_3_3 | −0.035532 | 0.088261 | −0.403 | 0.69082 | |
| crdt_4_1 | 0.053444 | 0.061642 | 0.867 | 0.39453 | |
| invest_4_2 | 0.173309 | 0.056132 | 3.088 | 0.00504 | ** |
| trd_div_mark_scl_4_3 | −0.047546 | 0.083220 | −0.571 | 0.57309 | |
| know_works_5_1 | 0.155823 | 0.144782 | 1.076 | 0.29251 | |
| innov_linkgs_5_2 | 0.001397 | 0.156521 | 0.009 | 0.99295 | |
| know_absrb_5_3 | 0.306327 | 0.108855 | 2.814 | 0.00961 | ** |
| know_creat_6_1 | 0.088024 | 0.198562 | 0.443 | 0.66151 | |
| know_impct_6_2 | 0.123157 | 0.109853 | 1.121 | 0.27334 | |
| know_difsn_6_3 | −0.101738 | 0.070306 | −1.447 | 0.16081 | |
| intang_assts_7_1 | −0.062554 | 0.084757 | −0.738 | 0.46765 | |
| creat_gds_servs_7_2 | −0.056567 | 0.095164 | −0.594 | 0.55780 | |
| online_creat_7_3 | −0.057665 | 0.100634 | −0.573 | 0.57196 | |
| Significance codes | 0 ‘***’ | 0.001 ‘**’ | 0.01 ‘*’ | 0.05 ‘.’ | 0.1 ‘’ |
| Residual standard error: | 7.687 on 24 degrees of freedom | ||||
| Multiple R-squared | 0.8833 | Adjusted R-squared | 0.7812 | ||
| F-statistic | 8.652 on 21 and 24 DF | p-value | 0.0000009499 | ||
| Multiple Linear Regression on Detailed World Cluster Indicators | |||||
|---|---|---|---|---|---|
| lm(formula = glob_comp_rank ~ pol_oper_stab_1_1_1 + gov_effects_1_1_2 + reg_qual_1_2_1 + rul_law_1_2_2 + cst_redcy_disms_1_2_3 + eas_start_bus_1_3_1 + eas_resol_insolv_1_3_2, data = clustdata_3) | |||||
| Residuals: | Min | 1Q | Median | 3Q | Max |
| −15.0616 | −6.8072 | 0.3288 | 3.6199 | 17.2266 | |
| Coefficients | Estimate | Standard Error | t-value | Pr (>|t|) | Significance |
| pol_oper_stab_1_1_1 | −0.14711 | 0.10287 | −1.430 | 0.160865 | |
| gov_effects_1_1_2 | 0.62615 | 0.15879 | 3.943 | 0.000334 | *** |
| reg_qual_1_2_1 | −0.36924 | 0.18157 | −2.034 | 0.049016 | * |
| rul_law_1_2_2 | 0.46789 | 0.21355 | 2.191 | 0.034656 | * |
| cst_redcy_disms_1_2_3 | −0.01328 | 0.03898 | −0.341 | 0.735213 | |
| eas_start_bus_1_3_1 | 0.08189 | 0.04876 | 1.680 | 0.101242 | |
| eas_resol_insolv_1_3_2 | −0.03531 | 0.06586 | −0.536 | 0.595033 | |
| Significance codes | 0 ‘***’ | 0.001 ‘**’ | 0.01 ‘*’ | 0.05 ‘.’ | 0.1 ‘’ |
| Residual standard error: | 8.682 on 38 degrees of freedom | ||||
| Multiple R-squared | 0.7644 | Adjusted R-squared | 0.721 | ||
| F-statistic | 17.61 on 7 and 38 DF | p-value | 0.00000000037 | ||
| Multiple Linear Regression on Detailed World Cluster Indicators | |||||
|---|---|---|---|---|---|
| lm(formula = comp_rank ~ expd_edc_2_1_1 + gov_fun_ppl_sec_2_1_2 + schl_lif_exp_2_1_3 + pisa_scls_rd_mth_sci_2_1_4 + ppl_tch_rat_sec_2_1_5, data = clustdata_3) | |||||
| Residuals: | Min | 1Q | Median | 3Q | Max |
| −28.321 | −11.279 | 1.228 | 7.239 | 25.381 | |
| Coefficients | Estimate | Standard Error | t-value | Pr (>|t|) | Significance |
| expd_edc_2_1_1 | 0.11502 | 0.08006 | 1.437 | 0.15856 | |
| gov_fun_ppl_sec_2_1_2 | −0.14144 | 0.09868 | −1.433 | 0.15952 | |
| schl_lif_exp_2_1_3 | 0.14626 | 0.09769 | 1.497 | 0.14219 | |
| pisa_scls_rd_mth_sci_2_1_4 | 0.46905 | 0.14281 | 3.284 | 0.00213 | ** |
| ppl_tch_rat_sec_2_1_5 | −0.02919 | 0.08072 | −0.362 | 0.71955 | |
| Significance codes | 0 ‘***’ | 0.001 ‘**’ | 0.01 ‘*’ | 0.05 ‘.’ | 0.1 ‘’ |
| Residual standard error: | 13.83 on 40 degrees of freedom | ||||
| Multiple R-squared | 0.3707 | Adjusted R-squared | 0.292 | ||
| F-statistic | 4.712 on 5 and 40 DF | p-value | 0.001777 | ||
| Multiple Linear Regression on Detailed World Cluster Indicators | |||||
|---|---|---|---|---|---|
| lm(formula = comp_rank~ trt_enrl_grs_2_2_1 + grad_sci_engin_2_2_2 + trt_inb_mob_2_2_3 + resrs_fte_2_3_1 + grs_expd_res_dev_2_3_2 + glob_corp_r_d_invst_top_2_3_3 + qs_uni_rank_top3_2_3_4, data = clustdata_3) | |||||
| Residuals: | Min | 1Q | Median | 3Q | Max |
| −17.367 | −8.950 | 1.148 | 6.776 | 16.249 | |
| Coefficients | Estimate | Standard Error | t-value | Pr (>|t|) | Significance |
| trt_enrl_grs_2_2_1 | −0.12312 | 0.07859 | −1.567 | 0.1255 | |
| grad_sci_engin_2_2_2 | 0.01102 | 0.06742 | 0.163 | 0.8711 | |
| trt_inb_mob_2_2_3 | 0.13357 | 0.08187 | 1.631 | 0.1111 | |
| resrs_fte_2_3_1 | 0.48812 | 0.22177 | 2.201 | 0.0339 | * |
| grs_expd_res_dev_2_3_2 | −0.10934 | 0.21918 | −0.499 | 0.6208 | |
| glob_corp_r_d_invst_top_2_3_3 | 0.18945 | 0.19709 | 0.961 | 0.3425 | |
| qs_uni_rank_top3_2_3_4 | 0.27677 | 0.11290 | 2.452 | 0.0189 | * |
| Significance codes | 0 ‘***’ | 0.001 ‘**’ | 0.01 ‘*’ | 0.05 ‘.’ | 0.1 ‘’ |
| Residual standard error: | 10.66 on 38 degrees of freedom | ||||
| Multiple R-squared | 0.6446 | Adjusted R-squared | 0.5792 | ||
| F-statistic | 9.848 on 7 and 38 DF | p-value | 0.0000006116 | ||
| Multiple Linear Regression on Detailed World Cluster Indicators | |||||
|---|---|---|---|---|---|
| lm(formula = comp_rank ~ ict_accss_3_1_1 + ict_use_3_1_2 + gov_onilne_srvc_3_1_3 + e_part_3_1_4 + elctro_outpt_3_2_1 + logs_perf_3_2_2 + grs_cap_frm_gdp_3_2_3 + gdp_unt_ener_use_3_3_1 + envir_perf_3_3_2 + iso_14001_envir_cert_3_3_3, data = clustdata_3) | |||||
| Residuals: | Min | 1Q | Median | 3Q | Max |
| −15.8648 | −5.9625 | −0.8444 | 5.3112 | 18.5022 | |
| Coefficients | Estimate | Standard Error | t-value | Pr (>|t|) | Significance |
| ict_accss_3_1_1 | −0.12447 | 0.11863 | −1.049 | 0.30124 | |
| ict_use_3_1_2 | 0.54250 | 0.16043 | 3.382 | 0.00179 | ** |
| gov_onilne_srvc_3_1_3 | 0.13673 | 0.14598 | 0.937 | 0.35536 | |
| e_part_3_1_4 | −0.10616 | 0.12942 | −0.820 | 0.41759 | |
| elctro_outpt_3_2_1 | −0.02635 | 0.12085 | −0.218 | 0.82868 | |
| logs_perf_3_2_2 | 0.44315 | 0.12709 | 3.487 | 0.00134 | ** |
| grs_cap_frm_gdp_3_2_3 | 0.03648 | 0.06400 | 0.570 | 0.57231 | |
| gdp_unt_ener_use_3_3_1 | 0.03295 | 0.06532 | 0.504 | 0.61711 | |
| envir_perf_3_3_2 | −0.16654 | 0.13939 | −1.195 | 0.24020 | |
| iso_14001_envir_cert_3_3_3 | −0.14832 | 0.06454 | −2.298 | 0.02765 | * |
| Significance codes | 0 ‘***’ | 0.001 ‘**’ | 0.01 ‘*’ | 0.05 ‘.’ | 0.1 ‘’ |
| Residual standard error: | 9.842 on 35 degrees of freedom | ||||
| Multiple R-squared | 0.7211 | Adjusted R-squared | 0.6414 | ||
| F-statistic | 9.049 on 10 and 35 DF | p-value | 0.0000003852 | ||
| Multiple Linear Regression on Detailed World Cluster Indicators | |||||
|---|---|---|---|---|---|
| lm(formula = comp_rank ~ eas_getng_creds_4_1_1 + dom_cred_priv_sectr_gdp_4_1_2 + mcrfin_grs_lns_gdp_4_1_3 + eas_prtc_mnr_invst_4_2_1 + mrkt_cap_gdp_4_2_2 + vntr_cap_invst_dls_gdp_4_2_3 + vent_cap_recipnts_dls_gdp_4_2_4 + appd_trf_rte_wght_avg_4_3_1 + dom_ind_div_4_3_2 + dom_mrkt_scl_4_3_3, data = clustdata_3) | |||||
| Residuals: | Min | 1Q | Median | 3Q | Max |
| −14.0398 | −4.8333 | 0.3732 | 4.9378 | 13.5259 | |
| Coefficients | Estimate | Standard Error | t-value | Pr (>|t|) | Significance |
| eas_getng_creds_4_1_1 | 0.02081 | 0.04765 | 0.437 | 0.665010 | |
| dom_cred_priv_sectr_gdp_4_1_2 | 0.18872 | 0.05681 | 3.322 | 0.002100 | ** |
| mcrfin_grs_lns_gdp_4_1_3 | −0.05798 | 0.06241 | −0.929 | 0.359186 | |
| eas_prtc_mnr_invst_4_2_1 | −0.06488 | 0.05551 | −1.169 | 0.250374 | |
| mrkt_cap_gdp_4_2_2 | 0.11827 | 0.07054 | 1.677 | 0.102539 | |
| vntr_cap_invst_dls_gdp_4_2_3 | 0.38458 | 0.08992 | 4.277 | 0.000139 | *** |
| vent_cap_recipnts_dls_gdp_4_2_4 | 0.03192 | 0.06965 | 0.458 | 0.649592 | |
| appd_trf_rte_wght_avg_4_3_1 | 0.02863 | 0.05157 | 0.555 | 0.582307 | |
| dom_ind_div_4_3_2 | −0.09949 | 0.05742 | −1.733 | 0.091955 | . |
| dom_mrkt_scl_4_3_3 | 0.06170 | 0.05399 | 1.143 | 0.260939 | |
| Significance codes | 0 ‘***’ | 0.001 ‘**’ | 0.01 ‘*’ | 0.05 ‘.’ | 0.1 ‘’ |
| Residual standard error: | 8.368 on 35 degrees of freedom | ||||
| Multiple R-squared | 0.7984 | Adjusted R-squared | 0.7407 | ||
| F-statistic | 13.86 on 10 and 35 DF | p-value | 0.000000001925 | ||
| Multiple Linear Regression on Detailed World Cluster Indicators | |||||
|---|---|---|---|---|---|
| lm(formula = comp_rank~ know_int_empl_5_1_1 + frm_offgs_form_train_5_1_2 + gerd_perf_bus_gdp_5_1_3 + gerd_fin_bus_5_1_4 + fem_empld_adv_dgrs_5_1_5 + uni_indry_r_d_col_5_2_1 + stte_clst_dev_dpth_5_2_2 + gerd_fin_abrd_gdp_5_2_3 + joint_vent_strt_alli_dls_gdp_5_2_4 + pat_fam_gdp_5_2_5 + intel_prpt_pay_ttl_trd_5_3_1 + hi_tech_imp_ttl_trd_5_3_2 + ict_servs_imprt_ttl_trd_5_3_3 + fdi_net_infls_gdp_5_3_4 + resch_tlnt_buss_5_3_5, data = clustdata_3) | |||||
| Residuals: | Min | 1Q | Median | 3Q | Max |
| −11.7963 | −3.2011 | 0.7465 | 3.3827 | 12.0669 | |
| Coefficients | Estimate | Standard Error | t-value | Pr (>|t|) | Significance |
| know_int_empl_5_1_1 | 0.133322 | 0.097739 | 1.364 | 0.1827 | |
| frm_offgs_form_train_5_1_2 | 0.136176 | 0.053892 | 2.527 | 0.0170 | * |
| gerd_perf_bus_gdp_5_1_3 | 0.067653 | 0.188422 | 0.359 | 0.7221 | |
| gerd_fin_bus_5_1_4 | 0.071454 | 0.099733 | 0.716 | 0.4793 | |
| fem_empld_adv_dgrs_5_1_5 | −0.103991 | 0.080484 | −1.292 | 0.2062 | |
| uni_indry_r_d_col_5_2_1 | 0.361615 | 0.076297 | 4.740 | 0.0000486 | *** |
| stte_clst_dev_dpth_5_2_2 | −0.009798 | 0.071208 | −0.138 | 0.8915 | |
| gerd_fin_abrd_gdp_5_2_3 | −0.089739 | 0.066569 | −1.348 | 0.1877 | |
| joint_vent_strt_alli_dls_gdp_5_2_4 | 0.146760 | 0.054877 | 2.674 | 0.0120 | * |
| pat_fam_gdp_5_2_5 | −0.209578 | 0.179050 | −1.171 | 0.2510 | |
| intel_prpt_pay_ttl_trd_5_3_1 | 0.029767 | 0.051904 | 0.573 | 0.5706 | |
| hi_tech_imp_ttl_trd_5_3_2 | −0.071274 | 0.044602 | −1.598 | 0.1205 | |
| ict_servs_imprt_ttl_trd_5_3_3 | 0.022804 | 0.047476 | 0.480 | 0.6345 | |
| fdi_net_infls_gdp_5_3_4 | 0.029289 | 0.032653 | 0.897 | 0.3769 | |
| resch_tlnt_buss_5_3_5 | −0.018735 | 0.139301 | −0.134 | 0.8939 | |
| Significance codes | 0 ‘***’ | 0.001 ‘**’ | 0.01 ‘*’ | 0.05 ‘.’ | 0.1 ‘’ |
| Residual standard error: | 6.975 on 30 degrees of freedom | ||||
| Multiple R-squared | 0.8799 | Adjusted R-squared | 0.8199 | ||
| F-statistic | 14.65 on 15 and 30 DF | p-value | 0.0000000006987 | ||
| Multiple Linear Regression on Detailed World Cluster Indicators | |||||
|---|---|---|---|---|---|
| lm(formula = comp_rank ~ ptnts_orgn_gdp_6_1_1 + pct_pat_orgn_gdp_6_1_2 + util_mdls_orgn_gdp_6_1_3 + sci_tech_articl_gfp_6_1_4 + cit_doc_h_indx_6_1_5 + lbr_prod_grwth_6_2_1 + new_buss_th_pop_6_2_2 + sftwre_spend_gdp_6_2_3 + iso_9001_qual_cert_gdp_6_2_4 + hi_tech_mnfct_6_2_5 + intel_prop_rcipts_ttl_trd_6_3_1 + prodn_exp_cmplx_6_3_2 + hi_tech_exp_ttl_trd_6_3_3 + ict_srvs_exp_ttl_trd_6_3_4, data = clustdata_3) | |||||
| Residuals: | Min | 1Q | Median | 3Q | Max |
| −16.2287 | −4.7558 | −0.0701 | 5.8296 | 20.3768 | |
| Coefficients | Estimate | Standard Error | t-value | Pr (>|t|) | Significance |
| ptnts_orgn_gdp_6_1_1 | −0.29440 | 0.11368 | −2.590 | 0.01450 | * |
| pct_pat_orgn_gdp_6_1_2 | 0.60954 | 0.17929 | 3.400 | 0.00187 | ** |
| util_mdls_orgn_gdp_6_1_3 | 0.07780 | 0.08735 | 0.891 | 0.37995 | |
| sci_tech_articl_gfp_6_1_4 | 0.15830 | 0.10258 | 1.543 | 0.13294 | |
| cit_doc_h_indx_6_1_5 | −0.11225 | 0.17531 | −0.640 | 0.52668 | |
| lbr_prod_grwth_6_2_1 | 0.01107 | 0.06867 | 0.161 | 0.87296 | |
| new_buss_th_pop_6_2_2 | 0.07465 | 0.05943 | 1.256 | 0.21848 | |
| sftwre_spend_gdp_6_2_3 | 0.07434 | 0.08200 | 0.907 | 0.37157 | |
| iso_9001_qual_cert_gdp_6_2_4 | −0.22761 | 0.08627 | −2.638 | 0.01291 | * |
| hi_tech_mnfct_6_2_5 | 0.25979 | 0.13814 | 1.881 | 0.06944 | . |
| intel_prop_rcipts_ttl_trd_6_3_1 | 0.06765 | 0.14475 | 0.467 | 0.64354 | |
| prodn_exp_cmplx_6_3_2 | −0.03500 | 0.11273 | −0.311 | 0.75825 | |
| hi_tech_exp_ttl_trd_6_3_3 | 0.06244 | 0.11116 | 0.562 | 0.57834 | |
| ict_srvs_exp_ttl_trd_6_3_4 | 0.01082 | 0.06738 | 0.161 | 0.87352 | |
| Significance codes | 0 ‘***’ | 0.001 ‘**’ | 0.01 ‘*’ | 0.05 ‘.’ | 0.1 ‘’ |
| Residual standard error: | 9.512 on 31 degrees of freedom | ||||
| Multiple R-squared | 0.7692 | Adjusted R-squared | 0.665 | ||
| F-statistic | 7.381 on 14 and 31 DF | p-value | 0.000001989 | ||
| Multiple Linear Regression on Detailed World Cluster Indicators | |||||
|---|---|---|---|---|---|
| lm(formula = comp_rank ~ trdmks_orgn_gdp_7_1_1 + glob_brnd_val_top_5000_gdp_7_1_2 + indust_dsgn_orgn_gdp_7_1_3 + ict_organ_mdl_creats_7_1_4 + cult_creat_servs_exp_ttl_trd_7_2_1 + ntnl_feat_films_7_2_2 + entermt_med_mrkt_7_2_3 + print_othr_med_mnfrng_7_2_4 + creat_gds_exprt_ttl_trd_7_2_5 + gen_top_lvl_dmns_tlds_7_3_1 + country_tlds_7_3_2 + wiki_edit_7_3_3 + mbl_app_creat_7_3_4, data = clustdata_3) | |||||
| Residuals: | Min | 1Q | Median | 3Q | Max |
| −17.0720 | −4.2354 | −0.2075 | 4.1525 | 13.0579 | |
| Coefficients | Estimate | Standard Error | t-value | Pr (>|t|) | Significance |
| trdmks_orgn_gdp_7_1_1 | −0.04462 | 0.06625 | −0.673 | 0.50548 | |
| glob_brnd_val_top_5000_gdp_7_1_2 | 0.17840 | 0.08259 | 2.160 | 0.03835 | * |
| indust_dsgn_orgn_gdp_7_1_3 | −0.05100 | 0.07322 | −0.697 | 0.49112 | |
| ict_organ_mdl_creats_7_1_4 | 0.23437 | 0.09846 | 2.380 | 0.02342 | * |
| cult_creat_servs_exp_ttl_trd_7_2_1 | −0.05173 | 0.06981 | −0.741 | 0.46413 | |
| ntnl_feat_films_7_2_2 | 0.07157 | 0.07128 | 1.004 | 0.32283 | |
| entermt_med_mrkt_7_2_3 | −0.06915 | 0.14529 | −0.476 | 0.63736 | |
| print_othr_med_mnfrng_7_2_4 | −0.04733 | 0.06662 | −0.710 | 0.48263 | |
| creat_gds_exprt_ttl_trd_7_2_5 | 0.06185 | 0.06396 | 0.967 | 0.34079 | |
| gen_top_lvl_dmns_tlds_7_3_1 | 0.21999 | 0.11771 | 1.869 | 0.07081 | . |
| country_tlds_7_3_2 | 0.03150 | 0.10289 | 0.306 | 0.76146 | |
| wiki_edit_7_3_3 | 0.01012 | 0.10389 | 0.097 | 0.92298 | |
| mbl_app_creat_7_3_4 | 0.22703 | 0.07633 | 2.974 | 0.00555 | ** |
| Significance codes | 0 ‘***’ | 0.001 ‘**’ | 0.01 ‘*’ | 0.05 ‘.’ | 0.1 ‘’ |
| Residual standard error: | 8.559 on 32 degrees of freedom | ||||
| Multiple R-squared | 0.8071 | Adjusted R-squared | 0.7288 | ||
| F-statistic | 10.3 on 13 and 32 DF | p-value | 0.00000004825 | ||
References
- Marshall, A. Principles of Economics, 8th ed.; MacMillan and Co.: London, UK, 1890; Available online: http://www.library.fa.ru/files/marshall-principles.pdf (accessed on 18 December 2020).
- Porter, M. Clusters and the New Economics of Competition. Harvard Business Review Magazine. 1998. Available online: https://hbr.org/1998/11/clusters-and-the-new-economics-of-competition (accessed on 26 August 2021).
- Porter, M. The Competitive Advantage of Nations. Harvard Business Review. 1990. Available online: https://hbr.org/1990/03/the-competitive-advantage-of-nations (accessed on 26 August 2021).
- Schmitz, H. On the Clustering of Small Firms. IS Bulletin, Volume 23, Issue 3. 1992. Available online: https://onlinelibrary.wiley.com/doi/abs/10.1111/j.1759-5436.1992.mp23003012.x (accessed on 26 January 2021).
- Rosenfeld, S. Bringing Business Clusters into the Mainstream of Economic Development. Eur. Plan. Stud. 1997, 5. Available online: https://www.researchgate.net/publication/237446231_Bringing_business_clusters_into_the_mainstream_of_economic_development (accessed on 26 January 2021). [CrossRef]
- Feser, E.J. Old and New Theories of Industry Clusters. Clusters and Regional Specialization: On Geography, Technology and Networks; Pion Press: London, UK, 1998. [Google Scholar]
- Elsner, W. An Industrial Policy Agenda 2000 and Beyond—Experience, Theory, and Policy. In Industrial Policies After 2000. Recent Economic Thought, Vol 72; Elsner, W., Groenewegen, J., Eds.; Springer: Dordrecht, The Netherlands, 2000. [Google Scholar] [CrossRef]
- Steiner, M.; Hartmann, C. Organizational learning in clusters: A case study on material and immaterial dimensions of cooperation. Reg. Stud. 2006, 40, 493–506. [Google Scholar] [CrossRef]
- Roeland, T.; Den Hertog, P. Boosting Innovation, the Cluster Approach; OECD Proceedings, Publication Services: Paris, France, 1999. [Google Scholar]
- Bergman, E.M.; Feser, E.J. Industrial and Regional Clusters: Concepts and Comparative Applications; Loveridge, S., Jackson, R., Eds.; WVU Research Repository; West Virginia University: Morgantown, WV, USA, 1999. [Google Scholar]
- Egan, T. Toronto Competes: An Assessment of Toronto’s Global Competitiveness; ICF Consulting, Toronto (Ont.); Economic Development Office: Toronto, ON, Canada, 2000. [Google Scholar]
- Crouch, C.; Farrell, H. Great Britain: Falling Through the Holes in the Network Concept. In Local Production Systems in Europe: Rise or Demise? Crouch, C., Le Galès, P., Trigilia, C., Voelzkow, H., Eds.; Oxford University Press: Oxford, UK, 2001; pp. 154–211. [Google Scholar]
- Van den Berg, L.; Braun, E.; van Winden, W. Growth Clusters in European Cities: An Integral Approach. Urban Stud. 2001, 38, 185205. [Google Scholar] [CrossRef]
- OECD-DATAR. World Congress on Local Clusters. 2001. Available online: https://www.oecd.org/sti/ind/oecd-datarworldcongressonlocalclusters.htm (accessed on 13 December 2020).
- Visser, E.-J.; Boschma, R. Clusters and Networks as Learning Devices for Individual Firms. 2002. Available online: http://ecsocman.hse.ru/data/463/656/1219/clust.pdf (accessed on 12 December 2020).
- Andersson, T.; Serger, S.S.; Sörvik, J.; Wise, E. The Cluster Policies Whitebook; IKED-International Organisation for Knowledge Economy and Enterprise Development: Malmö, Sweden, 2004; ISBN 91-85281-03-4. [Google Scholar]
- Ksenofontova, O.L. Industrial clusters as a factor in the development of the region: A theoretical aspect. Sovremennye naukoemkie tekhnologii. Regional application. Russ. J. Ind. Economics 2015, 14, 32–41. [Google Scholar] [CrossRef]
- Khablak, V.V.; Xia, H. Clusters in the global economy. Bull. Dalrybvtuz 2015, 15, 65–88. [Google Scholar]
- NOVA. Silicon Valley in Transition Economic and Workforce Implications in the Age of iPads, Android Apps, and the Age of iPads, Android Apps, and the Social Web. Workforce Board. 2011. Available online: http://www.ncnano.org/TechStudyFullReport_03.pdf (accessed on 13 December 2022).
- Akopyan, A.R. Evolution of Scientific Approaches to Clustering of Subjects of the World Economy. 2017. Available online: https://cyberleninka.ru/article/n/evolyutsiya-nauchnyh-podhodov-k-klasterizatsii-subektov-mirovogo-hozyaystva (accessed on 25 November 2020).
- Pogodina, T.V.; Kuznetsov, N.V.; Abdikeev, N.M. Financial and Economic Mechanisms for Creating Innovative Territorial Clusters. Bulletin of the Financial University. 2016. Available online: https://cyberleninka.ru/article/n/finansovo-ekonomicheskie-mehanizmy-sozdaniya-innovatsionnyh-territorialnyh-klasterov (accessed on 14 March 2021).
- Mikhailov, A.S. The Baltic Approach to the Creation of An Organized International Cluster. Reg. Econ. Manag. Electron. Sci. J. 2014. Available online: https://eee-region.ru/article/3811/ (accessed on 20 December 2020).
- Enterprise and Industry DG. Innovation Clusters in Europe: A Statistical Analysis and Overview of Current Policy Support. 2014. Available online: https://cluster.hse.ru/mirror/pubs/share/212169880 (accessed on 10 January 2021).
- Subcontract.ru. Competitiveness Clusters–Finnish Cluster Development Experience. 2003. Available online: http://subcontract.ru/docum/documshow_documid_169.html (accessed on 13 December 2020).
- Ketels, C. European Clusters; Harvard Business School: Boston, MA, USA, 2004; Available online: https://www.hbs.edu/ris/Publication%20Files/Ketels_European_Clusters_2004_b69f9f19-35c6-4626-b8c2-84c6cbcf1459.pdf (accessed on 16 January 2021).
- Li, C. Cluster approach in China’s innovative development. Russ. Entrep. 2009, 24, 67–92. [Google Scholar]
- Izotov, D.A. Specifics of Cluster Structures in the Chinese Economy. Regional Studies. 2015. Available online: https://www.researchgate.net/publication/286439774_Specificity_of_Cluster_Structures_in_the_Chinese_Economy (accessed on 20 December 2020).
- Gercic, Y.G. Chinese Super Dragon of National Power. World Pole of Innovations. 2020. Available online: https://cyberleninka.ru/article/n/analiz-opyta-rossii-i-kitaya-v-realizatsii-klasternoy-politiki-i-sovmestnyh-innovatsionnyh-proektov (accessed on 20 January 2021).
- Porvatkina, M.V. Foreign Experience in the Formation and Development of Regional Clusters in Economically Developed Countries. In Bulletin of the TSPU; Tomsk State Pedagogical University: Tomsk, Russia, 2011; Volume 36. [Google Scholar]
- Khavronin, S.B. Northern European Society as an Institutional Prerequisite for the Development of Science-Based Business; Human Dimension of the World Economy and Politics: Moscow, Russia, 2013. [Google Scholar]
- European Cluster Collaboration Platform. Information on Innovative Clusters in Europe. 2021. Available online: https://clustercollabeoration.eu/ (accessed on 18 January 2021).
- Clustermapping.us. Cluster: A Regional Concentration of Related Industries. 2021. Available online: http://www.clustermapping.us/cluster (accessed on 20 January 2022).
- INNOVA/PRO INNO Europe Paper. The Concept of Clusters and Cluster Policies and Their Role for Competitiveness and Innovation: Main Statistical Results and Lessons Learned. 2008. Available online: https://www.academia.edu/6711216/Clusters_working_document_sec_2008_2635_en (accessed on 15 May 2021).
- WIPO. Global Innovation Index 2021 Report. China. 2021. Available online: https://www.wipo.int/edocs/pubdocs/en/wipo_pub_gii_2021/cn.pdf (accessed on 13 March 2022).
- WIPO. Global Innovation Index 2021 Report. Russian Federation. 2021. Available online: https://www.wipo.int/edocs/pubdocs/en/wipo_pub_gii_2021/ru.pdf (accessed on 10 March 2022).
- WIPO. Global Innovation Index 2021 Report. Sweden. 2021. Available online: https://www.wipo.int/edocs/pubdocs/en/wipo_pub_gii_2021/se.pdf (accessed on 13 March 2022).
- WIPO. Global Innovation Index 2021 Report. United States of America. 2021. Available online: https://www.wipo.int/edocs/pubdocs/en/wipo_pub_gii_2021/us.pdf (accessed on 10 March 2022).
- WIPO Database. Data about the Innovation Index per Country. 2022. Available online: https://www.wipo.int/tools/en/#gsc.tab=0 (accessed on 12 May 2022).
- WIPO World Intellectual Property Organization. Global Innovation Index (GII). 2022. Available online: https://www.wipo.int/global_innovation_index/en/ (accessed on 15 March 2022).
- METI. Industrial Cluster Project. Ministry of Economy, Trade and Industry of Japan. 2009. Available online: https://www.meti.go.jp/policy/local_economy/tiikiinnovation/source/2009Cluster(E).pdf (accessed on 2 May 2022).
- Statology.org. Understanding Heteroscedasticity in Regression Analysis. 2020. Available online: https://www.statology.org/heteroscedasticity-regression/ (accessed on 4 June 2022).
- Qu, J.; Hao, X. Digital Economy, Financial Development, and Energy Poverty Based on Mediating Effects and a Spatial Autocorrelation Model. Sustainability 2022, 14, 9206. [Google Scholar] [CrossRef]
- Dospinescu, O.; Nicoleta, D. Workaholism in IT: An Analysis of the Influence Factors. Adm. Sci. 2020, 10, 96. [Google Scholar] [CrossRef]
- Samara, M.A.; Ismail, B.; Abdelhafid, A.; Pascal, L. A Survey of Outlier Detection Techniques in IoT: Review and Classification. J. Sens. Actuator Netw. 2022, 11, 4. [Google Scholar] [CrossRef]
- Statology.org. Multiple R vs. R-Squared: What Is the Difference? 2021. Available online: https://www.statology.org/multiple-r-vs-r-squared/ (accessed on 5 June 2022).
- IMD. World Competitiveness Ranking. 2021 Results. 2021. Available online: https://www.imd.org/centers/world-competitiveness-center/rankings/world-competitiveness/ (accessed on 3 June 2022).


| Author | Year | Source |
|---|---|---|
| Porter [3] | 1990 | The competitive advantage of nations |
| Schmitz [4] | 1992 | On clustering of small firms |
| Rosenfeld [5] | 1997 | Bringing business clusters into the mainstream of economic development |
| Porter [2] | 1998 | On competition |
| Feser [6] | 1998 | Old and new theories of industry clusters |
| Elsner [7] | 1998 | An industrial policy agenda 2000 and beyond |
| Steiner and Hartmann [8] | 2006 | Learning with clusters |
| Roelandt and den Hertag [9] | 1999 | Cluster analysis and cluster-based policy making in OECD countries |
| Bergman and Feser [10] | 1999 | Industrial and regional clusters |
| Egan [11] | 2000 | Toronto Competes |
| Crouch and Farrell [12] | 2001 | Great Britain: falling through the holes in the network concept |
| Van den Berg, Braun and van Winden [13] | 2001 | Growth clusters in European cities |
| OECD-DATAR [14] | 2001 | World congress on local clusters regional clusters in Europe |
| Visser and Boshma [15] | 2002 | Clusters and Networks as learning devices for individual firms |
| Andersson, Serger, Sörvik and Wise [16] | 2004 | The cluster policies white book |
| Classification Property | Cluster Type | Cluster Characteristic |
|---|---|---|
| Nature of the underlying resource | Idea generators | The goal is the creation of innovations, the leading resource is knowledge, and the result of the activity is the creation of innovative technologies. |
| Consumers of innovation | Cluster organizations can jointly acquire new technologies. | |
| The dominant type of relationship | Vertical | They consist mainly of enterprises and organizations connected through the relationship “buyer-seller.” |
| Horizontal | Consist of enterprises from different industries that operate in a common market for the final product and use standard technology, similar workforce skills, and natural resources. | |
| State participation | With the participation of the state | The state takes part in the creation and functioning of clusters. |
| Without the participation of the state | The state does not take part in the creation and functioning of clusters. | |
| Life-cycle stage | Emerging clusters | Clusters at the stage of origin and formation. |
| Developing clusters | Clusters in development. | |
| Clusters that have fallen into disrepair | Clusters in decline. | |
| Type of development dynamics | Leading clusters | Balanced development of production and specialized services, intense internal competition, high research potential, effective intracluster interaction within the framework of joint projects and intersectoral organizations. |
| Stable clusters | Positive dynamics in the development of cluster elements and intra-cluster interaction. However, the level of development necessary to obtain significant benefits from the association still needs to be reached. | |
| Asynchronous clusters | The uneven development of the cluster structure as a whole and the weakness of individual elements. However, there are distinct competitive advantages. | |
| Hidden clusters | Unite several successfully functioning enterprises. However, they are far from a full-fledged cluster structure, and their construction processes could be faster. |
| Rank | Cluster Name | Country | Industry |
|---|---|---|---|
| 1 | Tokyo–Yokohama | Japan | Electronics, mechanical engineering, energy, ITC, production |
| 2 | Shenzhen–Hong Kong–Guangzhou | China/Hong Kong | Digital communications, logistics, finance, mobile technology |
| 3 | Beijing | China | Digital communications, electronics, automotive, metallurgy, mechanical engineering |
| 4 | Seoul | South Korea | Digital communications, electronics, mechanical engineering, chemical industry |
| 5 | San Jose–San Francisco | USA | Computer technology, shipbuilding, finance, biotechnology |
| 10 | Paris | France | Transport, automotive, energy, internet and telecommunications, finance |
| 15 | London | United Kingdom | Finance, technology |
| 19 | Amsterdam–Rotterdam | Netherlands | Logistics, retail products, energy |
| 20 | Koln | Germany | Mechanical engineering, chemistry, food industry |
| 27 | Tel Aviv | Israel | Computer technology, chemistry, textiles |
| 28 | Taipei–Hinchu | Taiwan | ICT, electronics, biotechnology, finance |
| 29 | Singapore | Singapore | Telecommunications, finance, transport, logistics, computers |
| 31 | Melbourne | Australia | Finance, medical technologies, biotechnologies, ICT |
| 32 | Moscow | Russia | Information and communication technologies, biotechnologies, infrastructure, production |
| 35 | Stockholm | Sweden | High technology, information and communication technology, retail |
| 36 | Eindhoven | Netherlands | High technology, biomedical technology, engineering |
| 40 | Toronto | Canada | Aviation, media, finance, high technology, finance |
| 41 | Tehran | Iran | Mechanical engineering, metalworking, radio equipment, automotive industry |
| 43 | Brussels | Belgium | Engineering, gastronomy, finance, electronics, chemistry, telecommunications |
| 46 | Madrid | Spain | Biotechnology, ICT, energy, logistics |
| 48 | Milan | Italy | Light industry, automotive, chemical industry, mechanical engineering, medical technology |
| 49 | Istanbul | Turkey | Logistics, finance, electronics, textile industry |
| 50 | Zurich | Switzerland | Finance, light industry, machine and textile industry, tourism |
| 56 | Copenhagen | Denmark | Biotechnology, finance, logistics |
| 62 | Bangalore | India | Information technology, telecommunications, biotechnology, automotive, mechanical engineering |
| 66 | Sao Paulo | Brazil | Finance, telecommunications, automotive, pharmaceuticals, electronics |
| 71 | Vienna | Austria | Biotechnology, pharmaceuticals, ICT, electronics, mechanical engineering |
| 74 | Helsinki | Finland | Electronics, mechanical engineering, chemical industry, information technology |
| 92 | Lausanne | Switzerland | Mechanical engineering, information technology, finance, computer peripherals, biotechnology, logistics |
| 100 | Warsaw | Poland | High technologies, electrical engineering, metallurgy, mechanical engineering |
| Multiple Linear Regression on World Cluster Indicators | |||||
|---|---|---|---|---|---|
| lm(formula = glob_inov_indx ~ pol_envt_1_1 + reg_envt_1_2 + bus_envt_1_3 + edcn_2_1 + trt_edcn_2_2 + res_dev_2_3 + info_commn_tech_3_1 + gnrl_infra_3_2 + eco_sust_3_3 + crdt_4_1 + invest_4_2 + trd_div_mark_scl_4_3 + know_works_5_1 + innov_linkgs_5_2 + know_absrb_5_3 + know_creat_6_1 + know_impct_6_2 + know_difsn_6_3 + intang_assts_7_1 + creat_gds_servs_7_2 + online_creat_7_3, data = clustdata_2) | |||||
| Residuals: | Min | 1Q | Median | 3Q | Max |
| −4.5750 | −0.7956 | 0.1724 | 1.0272 | 4.5813 | |
| Coefficients | Estimate | Standard Error | t-value | Pr (>|t|) | Significance |
| pol_envt_1_1 | −0.017282 | 0.053022 | −0.326 | 0.746892 | |
| reg_envt_1_2 | 0.027455 | 0.026582 | 1.033 | 0.310526 | |
| bus_envt_1_3 | −0.006229 | 0.025584 | −0.243 | 0.809419 | |
| edcn_2_1 | 0.010802 | 0.023322 | 0.463 | 0.646811 | |
| trt_edcn_2_2 | 0.017289 | 0.019733 | 0.876 | 0.388418 | |
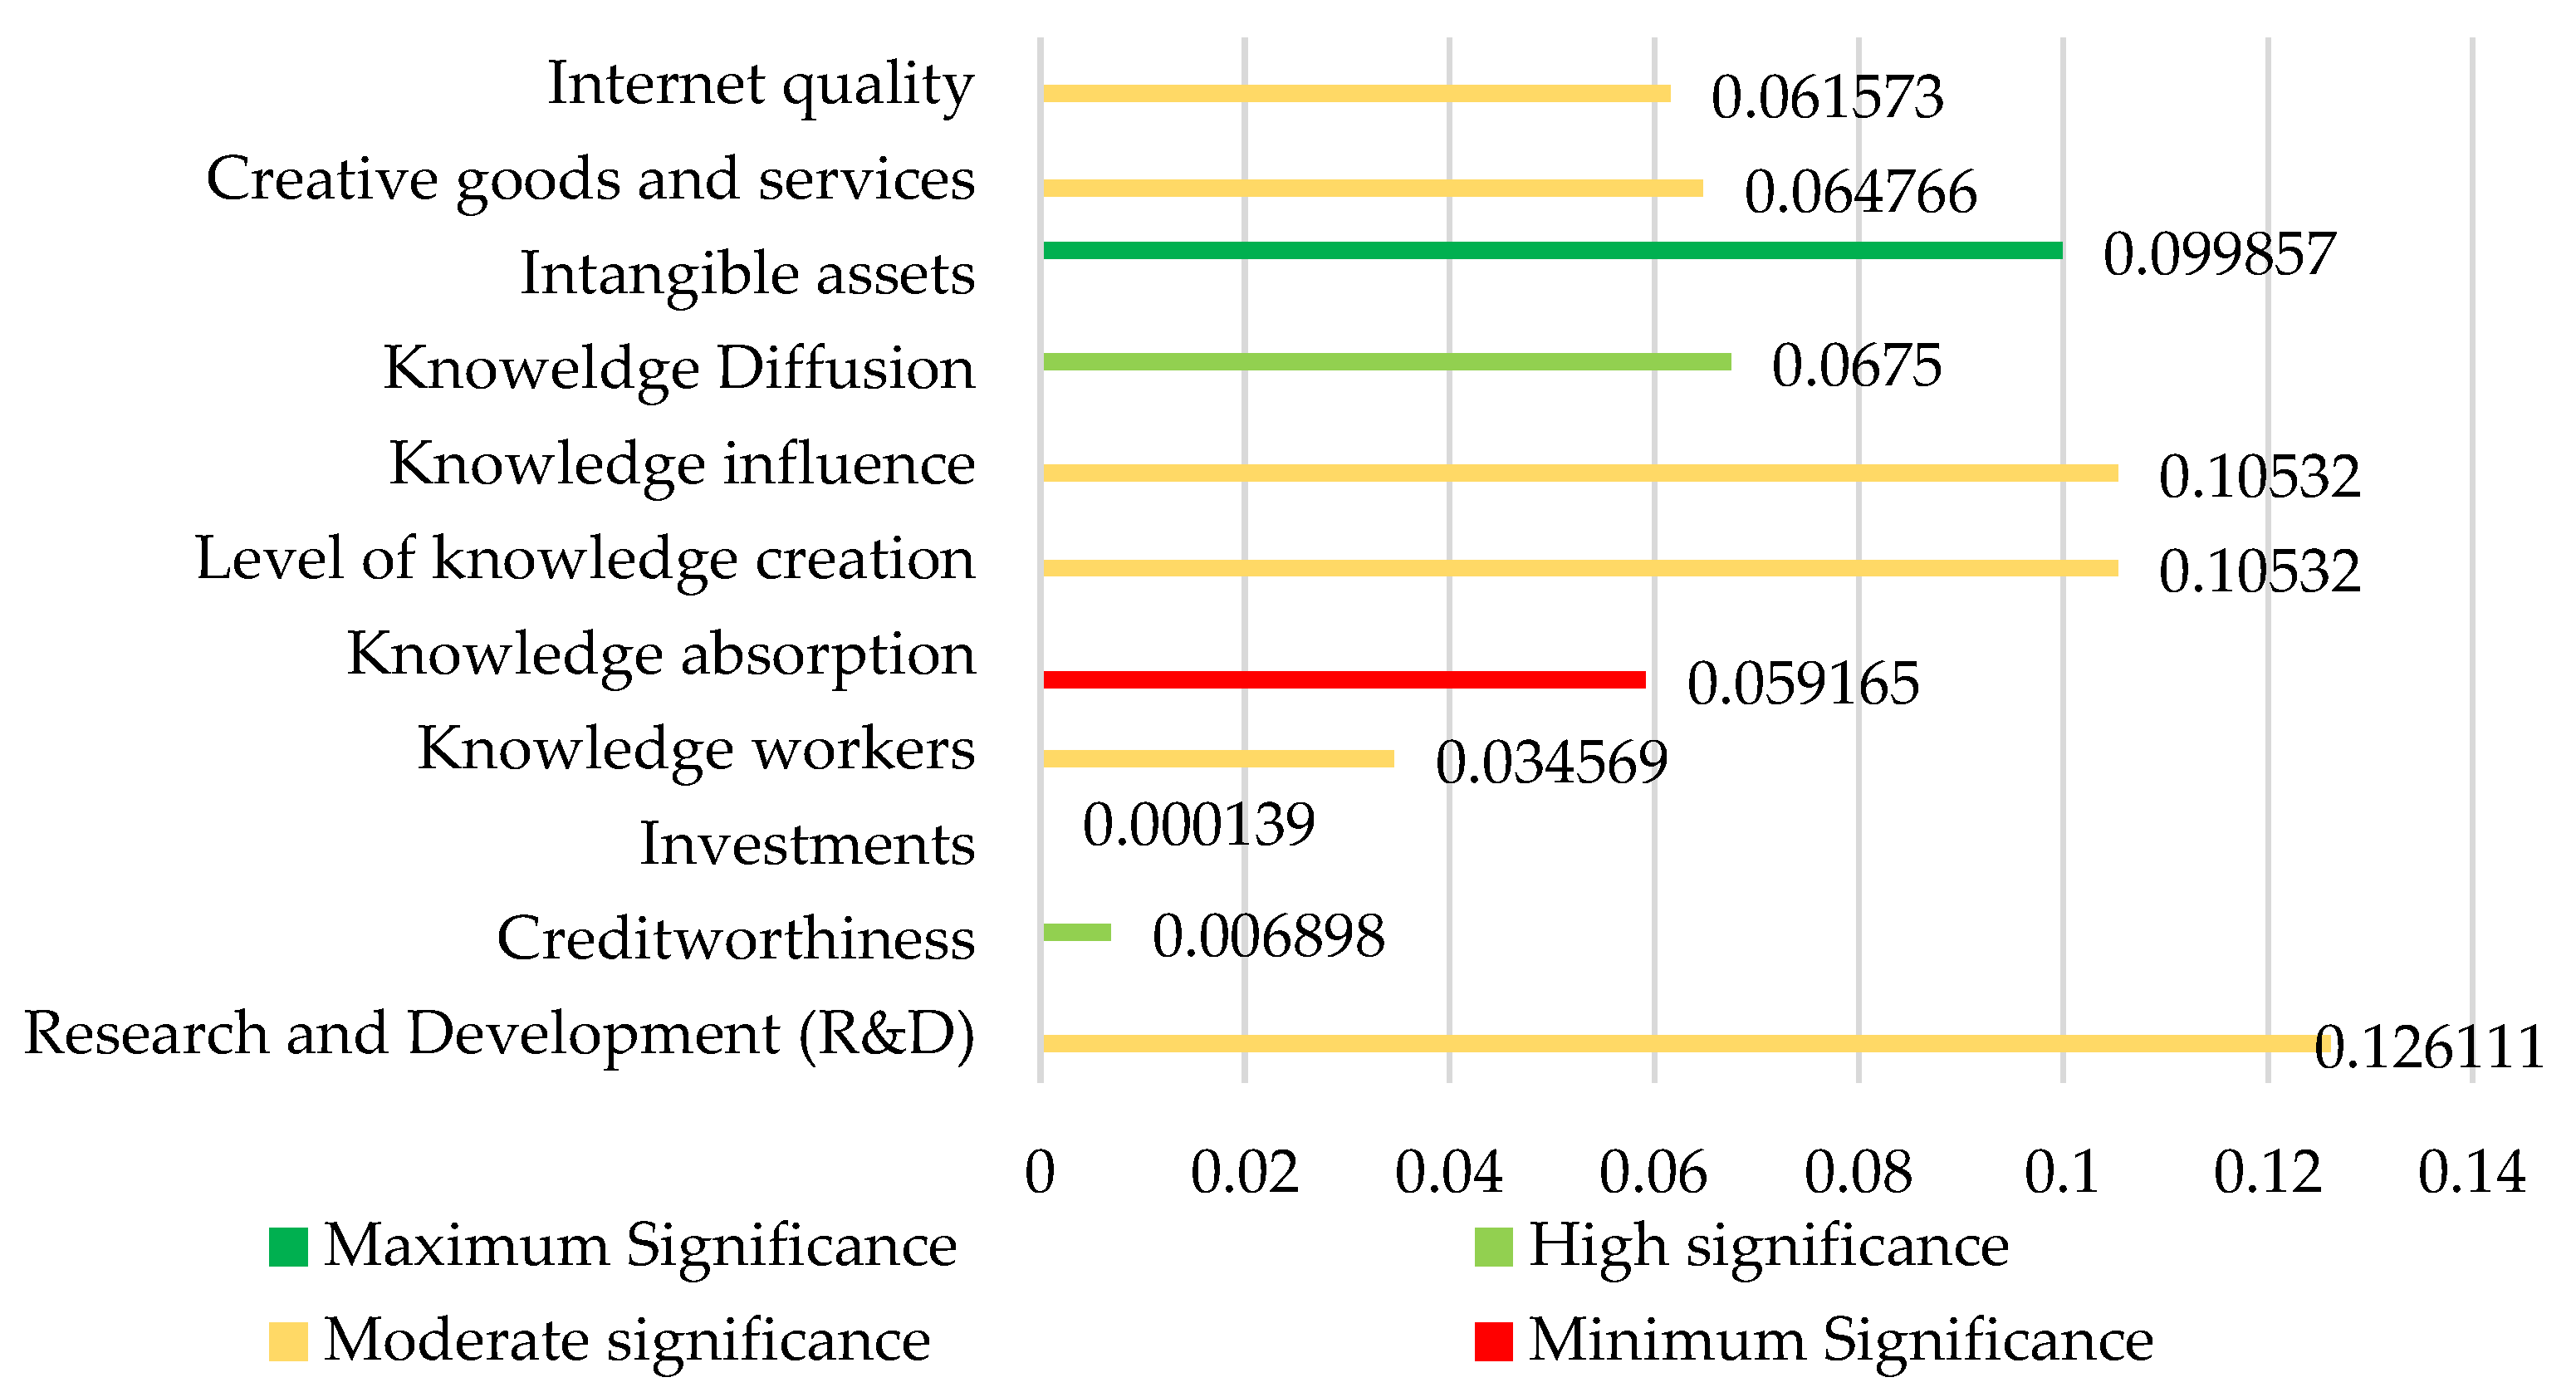
| res_dev_2_3 | 0.126111 | 0.054488 | 2.314 | 0.028193 | * |
| info_commn_tech_3_1 | 0.010911 | 0.034337 | 0.318 | 0.753026 | |
| gnrl_infra_3_2 | 0.027026 | 0.025495 | 1.060 | 0.298180 | |
| eco_sust_3_3 | 0.012605 | 0.026821 | 0.470 | 0.642030 | |
| crdt_4_1 | 0.055343 | 0.018975 | 2.917 | 0.006898 | ** |
| invest_4_2 | 0.070270 | 0.015936 | 4.410 | 0.000139 | *** |
| trd_div_mark_scl_4_3 | −0.003336 | 0.024870 | −0.134 | 0.894248 | |
| know_works_5_1 | 0.098623 | 0.044393 | 2.222 | 0.034569 | * |
| innov_linkgs_5_2 | −0.008346 | 0.041009 | −0.204 | 0.840195 | |
| know_absrb_5_3 | 0.059165 | 0.032217 | 1.836 | 0.076929 | . |
| know_creat_6_1 | 0.105320 | 0.038933 | 2.705 | 0.011486 | * |
| know_impct_6_2 | 0.075818 | 0.032985 | 2.299 | 0.029204 | * |
| know_difsn_6_3 | 0.067500 | 0.022344 | 3.021 | 0.005334 | ** |
| intang_assts_7_1 | 0.099857 | 0.026628 | 3.750 | 0.000818 | *** |
| creat_gds_servs_7_2 | 0.064766 | 0.029364 | 2.206 | 0.035786 | * |
| online_creat_7_3 | 0.061573 | 0.027190 | 2.264 | 0.031478 | * |
| Significance codes | 0 ‘***’ | 0.001 ‘**’ | 0.01 ‘*’ | 0.05 ‘.’ | 0.1 ‘’ |
| Residual standard error: | 2.481 on 28 degrees of freedom | ||||
| Multiple R-squared | 0.9834 | Adjusted R-squared | 0.971 | ||
| F-statistic | 79.23 on 21 and 28 DF | p-value | <0.00000000000000022 | ||
| Minimum Importance/Low Priority | Moderate Importance/Medium Priority | High Importance/Medium Priority | Maximum Significance | |
| Indicators affecting the country’s innovation rating | Political and operational stability | Researchers (FTE/million population) | Gross spending on R&D, % of GDP | Government effectiveness |
| Tertiary inbound mobility (%) | Use of ICT | Venture investors (deals/bn GDP PPP USD) | PISA scales in reading, math, and science | |
| … | Internal credit to the private sector (%, GDP) | The scale of the domestic market (billion PPP USD) | Logistic performance | |
| … | Patent families/billion GDP PPP in dollars | Firms offering formal training (%) | Global brand value, top 5000%GDP | |
| … | Net FDI inflow | Gross domestic expenditure on R&D | … | |
| … | New businesses/thousands Population | PCT patents by origin/bn GDP PPP USD | … | |
| … | ISO 9001 quality certifications/billion GDP PPP | Scientific and technical articles/billion PPP USD GDP | … | |
| … | Proceeds from intellectual property, % of total trade | ICT and organizational model building | … | |
| … | High-tech exports, % of total trade | Export of creative goods, % of total trade | … | |
| … | … | Generic top-level domains (TLDs)/thousands | … | |
| … | … | Creation of mobile applications / billion GDP by PPP in dollars | … |
| Minimum Importance/Low Priority | Moderate Importance/Medium Priority | High Importance/Medium Priority | Maximum Significance | |
| Indicators affecting the country’s competitiveness | … | Regulatory quality | Investment Level | Government efficiency |
| … | Law supremacy | Absorption of knowledge | Venture investors (deals/bn GDP PPP USD) | |
| … | Researchers (FTE/million population) | PISA reading, mathematics, and natural sciences | Cooperation between university and industry in R&D areas | |
| … | QS University Rankings, top three | Use of ICT | … | |
| … | ISO 14001 environmental certifications/billion GDP PPP | Logistic performance | … | |
| … | Firms offering formal education, % | Domestic credit private sector | … | |
| … | Joint ventures/strategic alliances/bn GDP PPP | PCT patents for origin/billion GDP at PPP in USD USA | … | |
| … | Patents by origin/billion GDP PPP USD | Creation of mobile applications/billion GDP at PPP in dollars | … | |
| … | ISO Quality Certifications 9001/billion GDP PPP | … | … | |
| … | World value brands, top 5000% of GDP | … | … | |
| … | ICT and organizational model building | … | … |
Disclaimer/Publisher’s Note: The statements, opinions and data contained in all publications are solely those of the individual author(s) and contributor(s) and not of MDPI and/or the editor(s). MDPI and/or the editor(s) disclaim responsibility for any injury to people or property resulting from any ideas, methods, instructions or products referred to in the content. |
© 2023 by the authors. Licensee MDPI, Basel, Switzerland. This article is an open access article distributed under the terms and conditions of the Creative Commons Attribution (CC BY) license (https://creativecommons.org/licenses/by/4.0/).
Share and Cite
Bobek, V.; Streltsov, V.; Horvat, T. Directions for the Sustainability of Innovative Clustering in a Country. Sustainability 2023, 15, 3576. https://doi.org/10.3390/su15043576
Bobek V, Streltsov V, Horvat T. Directions for the Sustainability of Innovative Clustering in a Country. Sustainability. 2023; 15(4):3576. https://doi.org/10.3390/su15043576
Chicago/Turabian StyleBobek, Vito, Vladislav Streltsov, and Tatjana Horvat. 2023. "Directions for the Sustainability of Innovative Clustering in a Country" Sustainability 15, no. 4: 3576. https://doi.org/10.3390/su15043576
APA StyleBobek, V., Streltsov, V., & Horvat, T. (2023). Directions for the Sustainability of Innovative Clustering in a Country. Sustainability, 15(4), 3576. https://doi.org/10.3390/su15043576