Abstract
In the present study, a calcium alginate bead adsorbent was prepared from brown algae (Macrosystis pyrifera) and was used for removal of Pb+2, Cu+2, and Sb+3 ions from aqueous solutions, using a fixed bed column. The initial concentration of metal ions, mass of adsorbent, recirculation flow, hydrodynamic cavitation, and contact time were examined, and the adsorption kinetics and isotherms were systematically studied. The Taguchi five-factor methodology was used for the development at three levels of experimentation. Experiment N° 24 (concentration, 10 mg/L; flow rate, 10 mL/s; adsorbent mass, 10 g; hydrodynamic cavitation with maximum air flow, and treatment time 240 min) resulted in the maximum removal of 92%, 78%, and 16% of lead, copper, and antimony ions, respectively. The average rate constants corresponding to pseudo-second-order kinetics for lead, copper, and antimony ions were 5.3 × 10⁻³, 1.4 × 10⁻³, and 7 × 10⁻⁵ g.mg−1min−1, respectively. In the adsorption process, they closely approximate to Langmuir and Freundlich isotherms, with adsorption capacities for Pb2+, Cu2+, and Sb3+ of 7.60, 2.07, and 0.37 mg/g, respectively, with good bioadsorption affinity of Pb > Cu > Sb. It was demonstrated that the bioadsorption equipment, with proper control of the factors, achieves concentration values of lead and copper ions below the current environmental regulations. The results of these studies indicated that calcium alginate is a promising adsorbent for separating and recovering heavy metal ions from contaminated water, although further research is needed for antimony ions.
1. Introduction
With the development of industry and the fast consumption of natural resources, heavy metals emitted from mining, metallurgy, and manufacturing have significantly increased in the past decades and have severely affected the environment [1]. The sewage of heavy metals cannot be easily biodegraded, which causes serious deterioration in the ecological environment [2]. The removal of heavy metal pollutants from industrial effluents has become an essential condition for the conduct of industrial activities, in accordance with the principles of clean production [3,4]. Lead is a non-essential element of the human body. It can enter the human body through the food chain and respiratory system, causing an inadequate supply of nutrients an d oxygen, thus, resulting in brain tissue damage [5]. Children in the growth and development stage are especially sensitive to lead, and excessive lead in their bodies will lead to developmental delay, loss of appetite, and hearing disorders [6]. Long-term exposure to lead can harm the kidneys, brain, liver, reproductive system, and central nervous system [7]. Additionally, long-term exposure to lead may also cause anemia, anorexia, dyslexia, convulsions, coma, and cancer [8]. Copper is one of the most valuable and prevalent metals used in the industry and is usually found at different concentrations in wastewater. However, a high percentage of copper leads to serious health problems, such as diarrhea, vomiting, nausea, and abdominal cramps, to cite but a few [9]. Among heavy metals, copper is considered one of the most toxic metals to aquatic organisms [10]. Consequently, the interest in water treatment from copper ions has been increasing in order to reduce or stop its propagation into the environment through soil and groundwater, which will eventually cause its accumulation along the food chain [11]. Antimony (Sb) and related compounds have been used in many areas, such as in flame retardants, alloys, ceramics, pigments, and synthetic fibers [12,13]. The presence of antimony in the environment includes pentavalent and trivalent species, and the toxicity of Sb(III) species is more poisonous than that of Sb(V) species [12,13]. Antimony is highly toxic and carcinogenic to the human body. Due to the increase in Sb application, Sb and the related compounds were listed as priority contaminants by several authorities, such as the US Environmental Protection Agency (USEPA) and European Union (EU) [12,14]. The highest permitted level of antimony in drinking water is strictly regulated by USEPA, EU, and China as 6, 5, and 5 μg/L, respectively [12,15]. Technologies for removing heavy metal ions mainly include flotation, chemical precipitation, adsorption, membrane separation, ion exchange, electrodialysis, and biological processes [16,17]. Membrane separation, such as reverse osmosis or nanofiltration, may require high pressure, leading to a high energy cost [18]. Due to its simplicity and low-cost, adsorption is considered as a green and environmental friendly method to remove heavy metals from industrial effluents [19]. However, favorable attributes of adsorption processes, such as design simplicity, environmental friendliness, economic feasibility, operational simplicity and wide availability, make it a preferred technique over others [20]. Among the adsorption processes, continuous adsorption columns are widely used for wastewater treatment to control pollutant concentration levels [21,22]. In carbon-based materials, sodium alginate (SA) has attracted wide attention due to its nontoxicity, low price, easy doping, and stability. The abundant hydroxyl and carboxyl groups of SA are flexible modifiable sites [23,24]. Sodium alginate is a natural polysaccharide which can be extracted from brown algae. It has some outstanding features, such as high bio-compatibility, bio-degradability, and renewability. Moreover, it has a high adsorption affinity for heavy metal ions [19]. Alginate, derived from natural brown algae, is commonly used as a natural adsorbent for the removal of metal ions due to its abundant carboxyl groups (−COOH) and hydroxyl groups (−OH) [25]. These groups serve as the coordination and reaction sites [26]. Non-conventional adsorbents, such as algae, has also been reported for the removal of heavy metals in a fluidized biosorption column with a maximum removal efficiency of 89% and 70% for lead and arsenic, respectively [27].
Hydrodynamic cavitation is a phenomenon of formation, growth, and collapse of cavitation bubbles because the local liquid pressure drops to the saturation pressure at a given temperature [28]. Due to the enormous energy and good mass transfer effect generated by hydrodynamic cavitation, hydrodynamic cavitation can be effectively combined with other water treatment methods [29]. Bethi et al. [30] mention that hydrodynamic cavitation can be used as a tool to intensify the adsorption process.
In this work, calcium alginate beads were synthesized from brown algae (Macrosystis pyrifera); subsequently, the beads were characterized by energy-dispersive X-ray/scanning electron microscopy (SEM–EDX). Then, the simultaneous adsorption of lead, copper, and antimony ions from their synthetic aqueous solution on a column packed with calcium alginate was analyzed by atomic absorption spectrophotometry. The adsorption capacity was studied by varying the experimental conditions, such as adsorbent dosage, solution concentration, contact time, recirculation flow, and hydrodynamic cavitation. Furthermore, adsorption kinetic and isotherm models were investigated.
2. Materials and Methods
2.1. Chemical
All chemicals used in this study were purchased from the supplier MERCK in Peru, and consisted of standard solutions of Cu(NO3)2 of 1000 mg/L, Cu(II) in HNO3 of 0.5 mol/L, Pb(NO3)2 of 1000 mg/L, lead (II) in HNO3 of 2 mol/L, and Sb2O3 of 1000 mg/L Sb (III) in HCl 2 mol/L. Calcium chloride (CaCl2. 2H2O), sodium hydroxide (NaOH), sodium hypochlorite (NaClO), sodium carbonate (Na2CO3), isopropyl alcohol (%), and ethylenediaminetetraacetic acid (EDTA) were also purchased. All solutions were freshly prepared with ultrapure deionized water (Millipore, >18 MΩ cm) throughout the experimental process.
2.2. Preparation of Bioadsorbent
The brown algae (Macrosystis pyrifera) was collected on the Peruvian coast (Callao province, Peru) in April 2021. A total of 10 kg of biomass was collected, then stored in polyethylene bags at 4 °C in the Department of Forensic Engineering of the Criminalistics Directorate of the National Police of Peru. The extraction of polysaccharides was performed following the steps proposed by Ayarza León (2015), with slight modifications; the biomass was washed with drinking water and deionized water to remove sand and external salts, and it was then dried in oven at 60 °C for 12 h before it was lightly crushed to approximately 5 mm in diameter. Sodium hypochlorite solutions (0.5% /w/w) were applied for 24 h to clarify the material and remove phenolic compounds. Alginate extraction was performed at room temperature with a 2% (w/w) sodium carbonate solution. The crude alginate extract was isolated by precipitation in 2-propanol and purified by redissolving it in aqueous medium with EDTA, followed by filtration and finally drying at 60 °C for 24 h.
2.3. Preparation of Calcium Alginate Beads
The calcium alginate beads were prepared. Solution A was prepared as follows: 12 g sodium alginate was added to 400 mL ultrapure water to form an aqueous solution (3% m/v) at 80 °C; it was stirred at 200 RPM for 15 min using a magnetic iron stirrer, then cooled to 4 °C. Solution B was prepared as follows: 12 g of calcium chloride was added to 1300 mL of ultrapure water to form an aqueous solution (1.8% m/v) at 20 °C. Homogenization was performed by manual agitation. Next, solution A was gelled in solution B, and was added dropwise using disposable pipettes, while using a magnetic stirrer at 300–1300 rpm for 60 min at room temperature. Then, the solution with the alginate beads was left to stand for 24 h to finish the gelation process, after which the beads were washed several times with deionized water and dried using a heat source (an oven at a temperature of 60 °C) for 12 h, until they reached a constant weight. These dried calcium alginate beads were used for all batch and continuous flow experiments. Finally, they were stored in hermetically sealed plastic bags until further use.
2.4. Microscopic Characterization
Scanning electron microscopy/energy dispersive X-ray SEM–EDX analysis SEM (TESCAN VEGA’s 4th generation Scanning Electron Microscope (SEM) (Czech Republic—2020)) photographs of the calcium alginate microspheres were taken VEGA’s 4th generationScanning Electron Microscope (SEM), at a power of 20 kV. The samples were previously coated with a thin layer of gold by means of a sputter coating unit to make them conductive. The morphology of the alginate contact surface at the microscopic level is rough and porous, with an average porosity of 20 um, and this morphology is obtained by using the secondary electron detector of the SEM equipment. Furthermore, the presence of lead and copper are detected by the X-ray energy-dispersive detector.
2.5. Taguchi Experimental Design Methodology
The Taguchi method determines the minimum number of experimental runs. In this study, which uses an L27 orthogonal matrix design, five factors with three levels were selected, and the controllable factors were metal ion concentration, sample recirculation flow rate, adsorbent mass, treatment time, and hydrodynamic cavitation. Table 1 shows the factors and experimental levels. Factor X4 was evaluated at the low level (hydrodynamic cavitation and adsorption), medium level (hydrodynamic cavitation, minimum air flow and adsorption), and high level (hydrodynamic cavitation, maximum air flow and adsorption). Experiments were performed in duplicate and mean values were reported. The analysis was performed with Minitab software (version 19.1.1).

Table 1.
The factors affecting the adsorption process and their levels.
2.6. Experimental Equipment
The experiments in the fixed bed column were carried out in a compact unit containing a reservoir for storing the feed solution of acrylic material of 4 L capacity. A water pump with a power of 25 W and flow rate of 36 L/h, connected by a synthetic pipe with an internal diameter of 5 mm, drives the water to the packed bed column. The column was made of acrylic material with an internal diameter of 7 cm and a height of 34 cm; inside the column in the form of a cylinder there was a 50 μm mesh of polypropylene material to maintain the integrity of the bed during the entire experimental phase. A SOBO AP 200 air pump of 2 W power and adjustable flow, with a maximum flow rate of 3 L/min, and a pressure of 0.02 MPa was used for air intake through a venturi tube of 6.35 mm of diameter. The schematic diagram of the column adsorption system is shown in Figure 1.
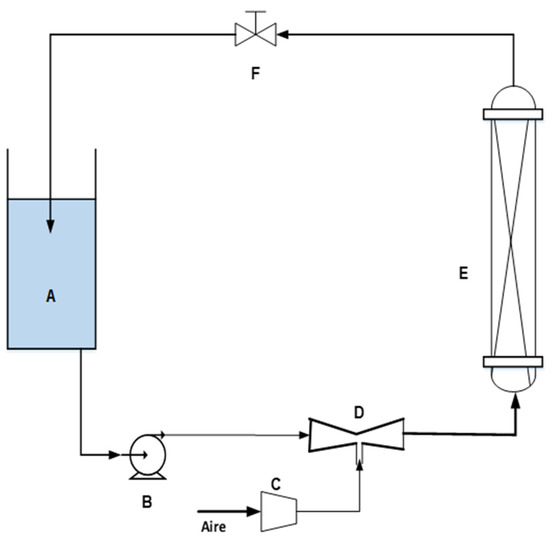
Figure 1.
Packed bed column studies on biosorption (A—solution; B—pump; C—air pump; D—venturi tube; E—acrylic column; F—flow control valve.
Table 2 shows the specifications of the venturi tube, in terms of inlet and outlet diameter (D), throat diameter (d), inlet and throat distance (L1), and throat and outlet distance (L2), while (d/D) is the ratio of diameters.

Table 2.
Venturi tube specifications.
2.7. Data Analysis
The adsorption capacity of lead ions, copper, and antimony in equilibrium was calculated using the following Equation (1):
where qe is the equilibrium adsorption capacity (mg·g−1); C0 is the initial concentration of metal ions (mg·L−1), Ce is the equilibrium concentration of metal ions (mg·L−1); V is the volume of aqueous solution containing metal ions content (L); m is the mass of adsorbent (g) used. The percentages of metal ion removal (Re, %) were computed using the following Equation (2):
where Re (%) is the adsorption efficiency, and C0 and Ce (mg/L) are, respectively, the initial and equilibrium metal concentrations.
2.8. Modeling of Adsorption Equilibrium Isotherm and Kinetics
Different adsorption equilibrium isotherms and kinetics models are used to simulate the correlation between the amount of Pb(II), Cu(II), and Sb(III) adsorbed at equilibrium () and concentration of the liquid phase at equilibrium. Equation (3) demonstrates the Langmuir model, as follows:
By linearizing the Equation (3), Equation (4) is obtained as follows:
where is the Langmuir maximum adsorption capacity (mg/g), and b (L/mg) is Langmuir constant. The constants ( and b) were determined from the linear plot of against .
The Freundlich isotherm model is another empirical equation used in correlating qe to . It is expressed as follows:
The linearized form of Equation (5) is given as follows:
where and n are the Freundlich constant and adsorption intensity, respectively, which are evaluated from the plot of ln() against ln(). Values of represent favorable adsorption conditions [31].
Toth Isotherm Model
The Toth isotherm is another empirical modification of the Langmuir equation, with the objective of minimizing the error between the experimental data and the predicted value of the equilibrium data [32]. This model is well suited to describe heterogeneous adsorption systems [33]. The exponent of the Toth isotherm (t) is related to the heterogeneity of the surface; if t is equal to the unit, the Toth model is reduced to the Langmuir model; this suggests that the adsorption occurs on a homogeneous surface [34]. Equation (7) represents the Toth adsorption isotherm model, with Qm, b, and t representing the model parameters [35], as follows:
where b is the Toth isotherm constant (mg g−1) and t is the Toth isotherm constant (mg g−1).
The adsorption rates of lead, copper, and antimony in alginate were studied, and the solutions were sampled at different times to measure the concentrations of lead, copper, and antimony. To forecast the pace at which an adsorption process occurs, a variety of adsorption kinetic models are available.
Pseudo-first-order (PFO) and pseudo-second-order (PSO) kinetic models are the most commonly used kinetic models. Expressions of a pseudo-first-order model (Equation (7)) and a pseudo-second-order model (Equation (6)) were obtained by integrating the following general equation:
The expression of the pseudo-first-order reaction model for (n = 1) of Equation (7) is as follows:
Integrating Equation (7) for boundary conditions () leads to the following linear equation:
where is the first-order rate constant ().
For adsorption systems following the pseudo-second-order (PSO) kinetics, the adsorbate was assumed to be adsorbed onto two surface sites, as expressed in the following equation [36]:
Integrating Equation (4) for boundary conditions () leads to the following formula:
A plot of versus t would result in a straight line, from which constants ( and ) can be calculated, as well as (g/mg min). Here, (mg/g) is the adsorption amount of lead, copper, and antimony ions at time t (min), and is the equilibrium adsorption capacity.
3. Results and Discussion
3.1. Microscopic Characterization
The characterization of the morphology of the alginate pearls was determined by scanning electron microscopy equipment (SEM). The SEM photographs of the calcium alginate microspheres were taken with a TESCAN model Vega 4 microscope (Czech Republic, 2020) at a power of 20 kV. Figure 2a presents micrographs of calcium alginate. The prepared calcium alginate is 2–3 mm in diameter (Figure 2b). Prior to SEM analysis, the samples were coated with a thin layer of gold using a sputter coating unit to make them conductive. In this study, SEM was used to reveal the change in the surface structure and morphology of the biosorbent before and after adsorption. As seen in Figure 3 and Figure 4, the images are different in terms of topography and surface roughness.
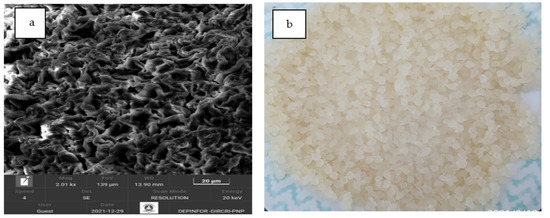
Figure 2.
SEM microphotography of calcium alginate (a); calcium alginate is 2–3 mm in diameter (b).
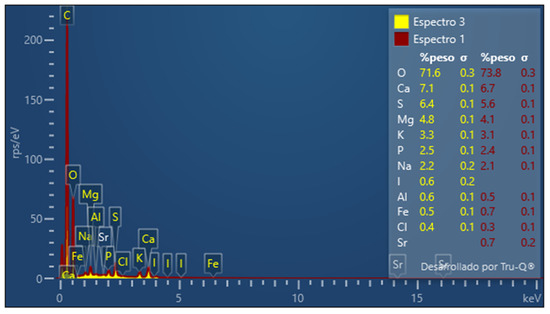
Figure 3.
Image of EDX analysis of fresh calcium alginate.
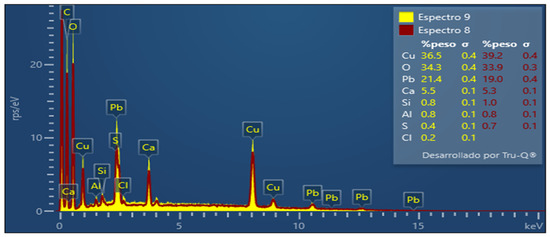
Figure 4.
EDX spectra of calcium alginate used for adsorption.
3.2. Characterization of Adsorbent
The chemical characteristics of biosorbents are identified by the energy-dispersive X-ray spectroscopy (EDX) analysis. The chemical composition of the adsorbent by EDX analysis is shown in Figure 3. The peaks of the elements in weight percentage O (71.6%), Ca (7.1%), S (6.4%), Mg (4.8%), K (3.3%), P (2.5%), I (12.21%), Na (2.2%), I (0.6%), Al (0.6%), Fe (0.5%), and Cl (0.4%) are shown. The main elements present in the material are O, Ca, S, Mg, and K.
To confirm the presence of ions Pb2+, Cu+2, and Sb3+ in the alginate beads, the EDX spectra were investigated. The EDX spectrum for the intact alginate does not present the characteristic peak of lead and copper (Figure 3), while the EDX alginate spectrum loaded with the aqueous solution clearly shows the lead and copper peak (Figure 4). The peaks in the percentages of adsorbed metal ions of lead (21.4%) and copper (36.5%) are shown in Figure 4. Therefore, SEM/EDX analysis confirms that the biosorbents have the ability to remove metal ions from an aqueous solution.
The experimental results for the removal of lead, copper, and antimony ions are shown in Table 3.

Table 3.
Matrix and measured (experimental) values of adsorption.
The adsorption capacity and equilibrium concentration of lead, copper, and antimony ions are also shown.
3.3. Effect of Contact Time on Adsorption of Pb(II), Cu (II) and Sb (III)
The effect of the contact time on the adsorption capacity of calcium alginate for lead, copper, and antimony ions is shown in Figure 5. It is observed that it increases rapidly in the first 50 min of treatment, then increases slowly, reaching a maximum adsorption capacity within the first 120 min for lead at 3.76 mg/g and copper at 1.64 mg/g. Antimony increases in slow steps, reaching equilibrium at 0.01 mg/g. After this time, no significant change in treatment time was observed. This observation may be due to the fact that, at initial step, the numbers of available sites for adsorption of Pb2+, Cu2+ is greater than when close to equilibrium [37].
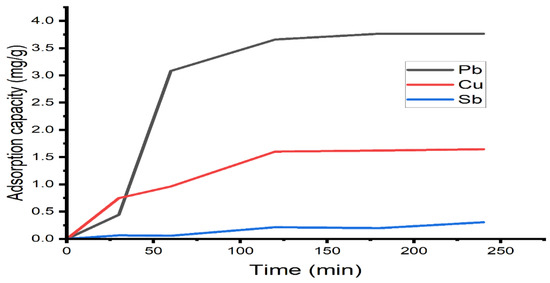
Figure 5.
Effect of contact time on the adsorption capacity of heavy metal ions under the followimg conditions: recirculation flow 5 mL/s, adsorbent mass of 10 g, concentration of ions 10 mg/L, and agitation with air.
Figure 6 shows the adsorption efficiency of lead, copper, and antimony ions on calcium alginate as a function of adsorption time. Lead exhibits the highest adsorption efficiency, followed by copper ions. The adsorption efficiency was 90% for lead ions. Copper has an adsorption efficiency of around 80%. During the 30 min of adsorption, the adsorption rate is very fast and decreases until the adsorption equilibrium is reached. The slope to equilibrium is steep for lead and copper. Antimony ions reach less than 10% adsorption in 240 min. This difference in percentage removal of the metal ions can be attributed to their charge and ionic radius. Therefore, Pb(II) and Cu(II) ions with a charge (+2) adsorbed better on the sorbent surface than antimony, which reached 10% removal.
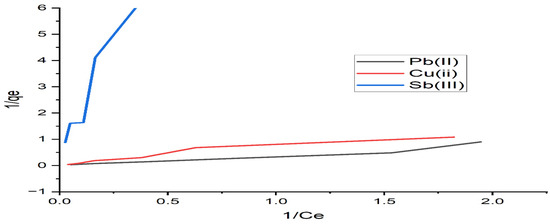
Figure 6.
Removal efficiency of metal ions at the following conditions: recirculation flow 5 mL/s, adsorbent mass of 10 g, concentration of ions 10 mg/L, and agitation with air.
3.4. Adsorption Isotherms
The adsorption isotherm expresses the specific relation between the concentration of adsorbate and its degree of accumulation onto the adsorbent surface at a constant temperature. The Langmuir and Freundlich models were used to obtain the adsorption isotherms. The Langmuir model is based on the assumption that all adsorption sites are equally active. The plots of the Langmuir and Freundlich isotherms are shown in Figure 7 and Figure 8, respectively. The model equations, the values of the constants calculated from these equations, and the square of the correlation coefficients of the models are presented in Table 4. According to Table 4, the experimental data were best fitted by the Freundlich isotherm, with the highest R2 value of 0.976 for lead and copper. From Table 4, the n values of the Freundlich model are 1, indicating a favorable adsorption onto the investigated algae. Similar results of maximum lead adsorption capacity (63.69 mg/g) were also reported by [38]. For the Toth isotherms, the coefficient of determination is higher than 0.99 for lead and copper ions, and it is 0.90 for antimony, as shown in Table 4. We conclude that the equation with three parameters shows very good agreement with the experimental data.
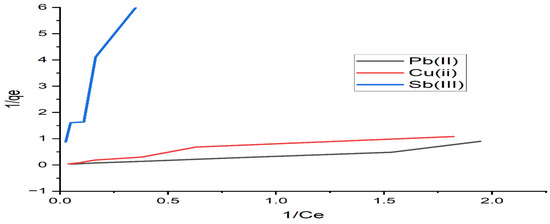
Figure 7.
Langmuir isotherm applied to the adsorption of Pb(II), Cu(II), and Sb(III) by alginate.
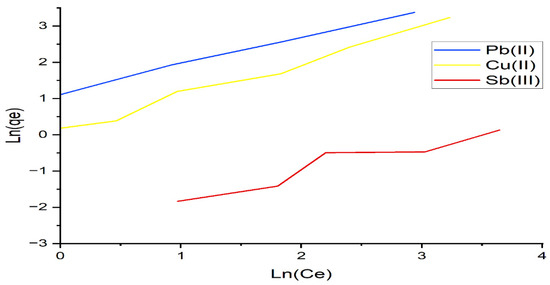
Figure 8.
Freundlich isotherm applied to the adsorption of Pb(II), Cu(II), and Sb(III) by alginate.

Table 4.
Parameters and determination coefficients of the Langmuir, Freundlich, and Toth isotherm models.
3.5. Kinetic Studies
The adsorption kinetics of Pb(II), Cu(II), and Sb(III) by modified alginate were studied at the initial concentration of 10 mg/L of the ions, with a contact time of 180 min and a temperature of 25 °C. The experimental data was explained in adsorption models, such as pseudo-first-order and pseudo-second-order kinetics in Equations (10) and (12), respectively. Figure 9 and Figure 10 illustrate the pseudo-first- and second-order model, respectively. Table 5 shows correlation coefficients, pseudo-first-order rate parameters, sorption capacity (), and correlation coefficients, as well as second-order rate parameters, . The correlation coefficients for the second-order model are strong for lead and copper ions, with R2 = 0.99, and antimony fits the first-order kinetic model well with a value of R2 = 0.806. This value suggests that the ion degradation process follows a second-order kinetic adsorption model.
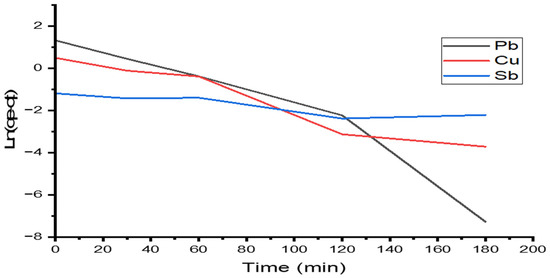
Figure 9.
Kinetic adsorption models (pseudo-first-order) for Pb(II), Cu(II), and Sb(III).
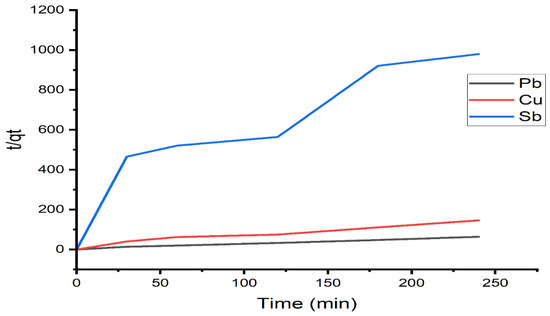
Figure 10.
Pseudo-second-order kinetic plots for Pb(II), Cu(II), and Sb(III).

Table 5.
Kinetic parameters of Pb2+, Cu2+, and Sb3+.
3.6. ANOVA Results
An ANOVA analysis was performed to evaluate the contribution of each controllable factor to the process response, which is the removal efficiency of lead, copper, and antimony ions. The ANOVA results are shown in Table 6 and Table 7. It can be observed from the percentage contribution that the initial concentration (X1) and adsorbent dose (X3) are the most influential factors for the adsorption of Pb(II) and Cu(II) by calcium alginate. When the initial concentration of lead and copper at the low level (2 mg/L) is reached above 80%, we achieve a removal of lead and copper which correlates with the results observed by other researchers. It was observed in Figure 11, Figure 12 and Figure 13 that the adsorption of Pb(II), Cu(II), and Sb(III) decreased with increasing adsorbent dosage. This might be due to the rise in the number of available adsorption sites to bind the Pb(II), Cu(II), and Sb(III) ions whose concentration in the wastewater is constant, as the increase in adsorbent dose resulted in surplus unoccupied adsorption sites [39]. Similar to our findings, it was found in another study that the percentage removal of Cu(II) decreased when increasing the initial copper concentration [40]. It was observed that the percentage removal for the metal ions Pb (II), Cu (II), and Sb (III) increased when increasing the contact time to 240 min (Figure 11, Figure 12 and Figure 13). This may be due to the increased time taken by the metal ions to reach the active sites of the biosorbent. However, with time, the number of active sites decreased considerably, the adsorption rate decreased, and, finally, the adsorption equilibrium was reached [41]. The factor with the highest percentage contribution to Sb removal is treatment time (X5), as shown in Table 7 and Figure 7. In the present study, the results did not show a significant variation in the percentage of lead and copper removal with flow rate. Some authors point out that the total adsorption capacity of the adsorbent in a fixed bed operation could decrease with increasing flow rate, which is explained by insufficient solute residence time.

Table 6.
ANOVA for percentage removal of lead, copper, and antimony.

Table 7.
Order of influence of response parameters.
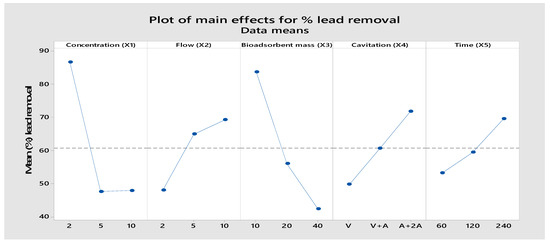
Figure 11.
Main effect plot for the means of percentage for lead removal.
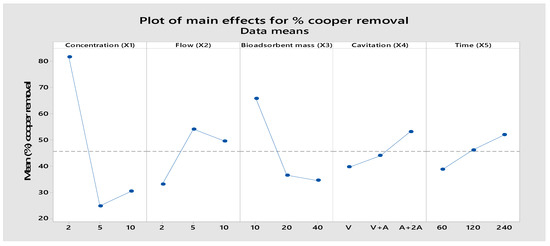
Figure 12.
Main effect plot for the means of percentage for copper removal.
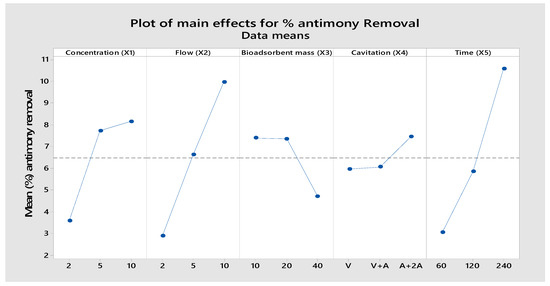
Figure 13.
Main effect plot for the means of percentage for antimony removal.
From Figure 11, Figure 12 and Figure 13 the factor (X4) shows a very significant influence on the percentage of removal for Pb, Cu, and Sb ions, especially when the factor is at the high level. The integration of adsorption and hydrodynamic cavitation at the high level of the X4 factor (maximum air flow) intensified the removal of metal ions, reaching a removal of 71.75% of Pb, 53.13% of Cu, and 7.43% of Sb in 240 min of treatment. The synergistic effect observed can be attributed to the fact that hydrodynamic cavitation (HC) increases homogenization, agitation of the mixture, and internal pressure due to the air flow, facilitating the metal ions to come into contact with the active sites of the adsorbent. Ref. [30] studied the degradation of rhodamine dye by a hybrid system (HC and packed bed hydrogel adsorption) and observed that the percentage of dye removal increased significantly from 25.42% to 65% when hydrogel adsorption was combined with HC. The increase in dye degradation can be attributed to the fact that high molecular weight organic contaminants are broken into smaller fragments. These smaller fragments adsorb faster on the hydrogel than the original dye molecules [42]. Similar results were also reported in the total organic carbon (TOC) reduction by the hybrid system, which was 73.60%; the individual effects of HC and adsorption with hydrogel alone were 19.4% and 26.13%, respectively. A study conducted by [43] on biosorption of copper ions in yeast found some different effects between static adsorption, adsorption by agitation, and adsorption by negative pressure cavitation. These three adsorption modes achieved a removal of 81.46%, 73.36%, and 67.17%, respectively, at 60 min of treatment. They demonstrated that the results with negative pressure cavitation can improve bioadsorption capacity and enhance copper ion removal. The observed impact can be attributed to thermal and mechanical effects where the interfacial tension between immiscible phases is reduced, leading to enhanced mass and heat transport across the boundary due to convection generated by local turbulence. Ref. [44] found that the total TOC reduction by the hybrid system (hydrodynamic cavitation and adsorption) was 73.60%; the individual effects of HC and hydrogel alone were 19.4% and 26.13%, respectively. The results confirmed that the initial concentration of lead caused a contribution (38.48%), followed by the amount of adsorbent (33.69%), hydrodynamic cavitation (9.21%), flow (9.5%) and time (5.18%), to the removal of lead. Likewise, Table 6 shows that the factors that have the greatest contribution are the treatment time (26.59%), followed by the flow rate (26.59%), in the removal of antimony. Individually, each factor at some level influenced the removal of lead, copper, and antimony.
4. Conclusions
In this research, calcium alginate microspheres were synthesized from brown algae (Macrosystis pyrifera) and used as a bioadsorbent to remove lead, copper, and antimony from an aqueous solution. The process reached equilibrium in 120 min. This study evaluated the feasibility of using calcium alginate by the Taguchi method to determine the most suitable removal condition through 27 trials. Experiment N° 24 offered the best bioadsorption conditions (concentration, 10 mg/L; flow rate, 10 mL/s; adsorbent mass, 10 g; treatment time 240 min, and hydrodynamic cavitation with maximum air flow) resulted in the maximum removal of 92%, 78%, and 16% of lead, copper, and antimony ions, respectively. The contribution of controllable factors in lead ion removal was adsorbent mass (X1) with 38.48%, initial concentration (X3) with 33.6%, while treatment time was the lowest with 5.18%. The adsorption kinetics followed a pseudo-second-order model; for lead and copper ions the value of R2 = 0.992 was calculated, and for the antimony ion a pseudo-first-order model with a value of R2 = 0.896 was calculated. The Freundlich isotherm was more satisfactory than Langmuir for lead and copper ions (R2 = 0.97) in the isothermal studies and for antimony (R2 = 0.90). In this research, the results showed that the integration of hydrodynamic cavitation and adsorption significantly improves the percentage removal of metal ions in the specific form of the antimony ion. This report is an important step towards the understanding and utilization of the bioadsorption integration system coupled to a venturi tube in the removal of lead, copper, and antimony. The novelty of the research is to have found that the integration of adsorption and hydrodynamic cavitation has a high influence on the removal of the metals under study, especially when accompanied by an air stream. Future research will focus on understanding the mechanisms of adsorption integrated with hydrodynamic cavitation with orifice plates for the removal of heavy metals from wastewater.
Author Contributions
Conceptualization, J.T.M.-C. and N.A.C.; Methodology, L.A.C.V.; Software, J.A.L.H.; Validation, J.T.M.-C., W.D.S.S. and N.A.C.; Formal analysis, P.B.D.B.; Investigation, J.T.M.-C. and W.D.S.S.; Resources, J.H.G.G.; Supervision, J.A.V. All authors have read and agreed to the published version of the manuscript.
Funding
The authors would like to thank the Universidad Nacional del Callao for their financial support for the publication of the article.
Institutional Review Board Statement
Not applicable.
Informed Consent Statement
Not applicable.
Data Availability Statement
Not applicable.
Conflicts of Interest
The authors declare no conflict of interest.
References
- Rakib, M.A.; Sasaki, J.; Matsuda, H.; Quraishi, S.B.; Mahmud, J.; Doza, B.; Ullah, A.A.; Fatema, K.J.; Newaz, A.; Bhuiyan, M.A. Groundwater salinization and associated co-contamination risk increase severe drinking water vulnerabilities in the southwestern coast of Bangladesh. Chemosphere 2020, 246, 125646. [Google Scholar] [CrossRef] [PubMed]
- Shahzad, A.; Miran, W.; Rasool, K.; Nawaz, M.; Jang, J.; Lim, S.-R.; Lee, D.S. Heavy metals removal by EDTA-functionalized chitosan graphene oxide nanocomposites. RSC Adv. 2017, 7, 9764–9771. [Google Scholar] [CrossRef]
- Xu, C.; Feng, Y.; Li, H.; Wu, R.; Ju, J.; Liu, S.; Yang, Y.; Wang, B. Adsorption of heavy metal ions by iron tailings: Behavior, mechanism, evaluation and new perspectives. J. Clean. Prod. 2022, 344, 131065. [Google Scholar] [CrossRef]
- Miranda, L.S.; Ayoko, G.A.; Egodawatta, P.; Goonetilleke, A. Adsorption-desorption behavior of heavy metals in aquatic environments: Influence of sediment, water and metal ionic properties. J. Hazard. Mater. 2022, 421, 126743. [Google Scholar] [CrossRef]
- Wang, Z.; Jin, P.; Wang, M.; Wu, G.; Sun, J.; Zhang, Y.; Dong, C.; Wu, A. Highly efficient removal of toxic Pb2+ from wastewater by an alginate-chitosan hybrid adsorbent. J. Chem. Technol. Biotechnol. 2018, 93, 2691–2700. [Google Scholar] [CrossRef]
- Liu, X.; Zheng, G.; Wu, Y.; Shen, X.; Jing, J.; Yu, T.; Song, H.; Chen, J.; Luo, W. Lead exposure results in hearing loss and disruption of the cochlear blood–labyrinth barrier and the protective role of iron supplement. Neurotoxicology 2013, 39, 173–181. [Google Scholar] [CrossRef]
- Awual, M.R. Assessing of lead(III) capturing from contaminated wastewater using ligand doped conjugate adsorbent. Chem. Eng. J. 2016, 289, 65–73. [Google Scholar] [CrossRef]
- Idris, A.; Ismail, N.S.M.; Hassan, N.; Misran, E.; Ngomsik, A.-F. Synthesis of magnetic alginate beads based on maghemite nanoparticles for Pb(II) removal in aqueous solution. J. Ind. Eng. Chem. 2012, 18, 1582–1589. [Google Scholar] [CrossRef]
- Knobeloch, L.; Ziarnik, M.; Howard, J.; Theis, B.; Farmer, D.; Anderson, H.; Proctor, M. Gastrointestinal Upsets Associated with Ingestion of Copper-Contaminated Water. Environ. Health Perspect. 1994, 102, 958. [Google Scholar] [CrossRef]
- Sorvari, J.; Sillanpää, M. Influence of metal complex formation on heavy metal and free EDTA and DTPA acute toxicity determined by Daphnia magna. Chemosphere 1996, 33, 1119–1127. [Google Scholar] [CrossRef]
- Vincevica-Gaile, Z.; Klavins, M. Transfer of Metals in Food Chain: An Example with Copper and Lettuce. Environ. Clim. Technol. 2012, 10, 21–24. [Google Scholar] [CrossRef]
- Tu, Y.; Ren, L.-F.; Lin, Y.; Shao, J.; He, Y.; Gao, X.; Shen, Z. Adsorption of antimonite and antimonate from aqueous solution using modified polyacrylonitrile with an ultrahigh percentage of amidoxime groups. J. Hazard. Mater. 2020, 388, 121997. [Google Scholar] [CrossRef]
- Qi, P.; Luo, R.; Pichler, T.; Zeng, J.; Wang, Y.; Fan, Y.; Sui, K. Development of a magnetic core-shell Fe3O4@TA@UiO-66 microsphere for removal of arsenic(III) and antimony(III) from aqueous solution. J. Hazard. Mater. 2019, 378, 120721. [Google Scholar] [CrossRef] [PubMed]
- Wang, H.; Lv, Z.; Wang, B.; Wang, Y.-N.; Sun, Y.; Tsang, Y.F.; Zhao, J.; Zhan, M. Effective stabilization of antimony in Waste-to-Energy fly ash with recycled laboratory iron–rich residuals. J. Clean. Prod. 2019, 230, 685–693. [Google Scholar] [CrossRef]
- Liu, Y.; Wu, P.; Liu, F.; Li, F.; An, X.; Liu, J.; Wang, Z.; Shen, C.; Sand, W. Electroactive Modified Carbon Nanotube Filter for Simultaneous Detoxification and Sequestration of Sb(III). Environ. Sci. Technol. 2019, 53, 1527–1535. [Google Scholar] [CrossRef] [PubMed]
- Abdelrahman, E.A.; Hegazey, R.M. Exploitation of Egyptian insecticide cans in the fabrication of Si/Fe nanostructures and their chitosan polymer composites for the removal of Ni(II), Cu(II), and Zn(II) ions from aqueous solutions. Compos. Part B Eng. 2019, 166, 382–400. [Google Scholar] [CrossRef]
- He, Y.; Gou, S.; Zhou, L.; Tang, L.; Liu, T.; Liu, L.; Duan, M. Amidoxime-functionalized polyacrylamide-modified chitosan containing imidazoline groups for effective removal of Cu2+ and Ni2+. Carbohydr. Polym. 2021, 252, 117160. [Google Scholar] [CrossRef]
- Yang, R.; Aubrecht, K.B.; Ma, H.; Wang, R.; Grubbs, R.B.; Hsiao, B.S.; Chu, B. Thiol-modified cellulose nanofibrous composite membranes for chromium (VI) and lead (II) adsorption. Polymer 2014, 55, 1167–1176. [Google Scholar] [CrossRef]
- Gao, X.; Guo, C.; Hao, J.; Zhao, Z.; Long, H.; Li, M. Adsorption of heavy metal ions by sodium alginate based adsorbent-a review and new perspectives. Int. J. Biol. Macromol. 2020, 164, 4423–4434. [Google Scholar] [CrossRef]
- Popoola, L.T. Nano-magnetic walnut shell-rice husk for Cd(II) sorption: Design and optimization using artificial intelligence and design expert. Heliyon 2019, 5, e02381. [Google Scholar] [CrossRef]
- Srivastava, V.C.; Mall, I.D.; Mishra, I.M. Multicomponent Adsorption Study of Metal Ions onto Bagasse Fly Ash Using Taguchi’s Design of Experimental Methodology. Ind. Eng. Chem. Res. 2007, 46, 5697–5706. [Google Scholar] [CrossRef]
- Wu, G.-Q.; Zhang, X.; Hui, H.; Yan, J.; Zhang, Q.-S.; Wan, J.-L.; Dai, Y. Adsorptive removal of aniline from aqueous solution by oxygen plasma irradiated bamboo based activated carbon. Chem. Eng. J. 2012, 185–186, 201–210. [Google Scholar] [CrossRef]
- Huang, Y.; Wang, Z. Preparation of composite aerogels based on sodium alginate, and its application in removal of Pb2+and Cu2+ from wáter. Int. J. Biol. Macromol. 2018, 107, 741–747. [Google Scholar] [CrossRef] [PubMed]
- Sutirman, Z.A.; Sanagi, M.M.; Aini, W.I.W. Alginate-based adsorbents for removal of metal ions and radionuclides from aqueous solutions: A review. Int. J. Biol. Macromol. 2021, 174, 216–228. [Google Scholar] [CrossRef] [PubMed]
- Pan, L.; Wang, Z.; Zhao, X.; He, H. Efficient removal of lead and copper ions from water by enhanced strength-toughness alginate composite fibers. Int. J. Biol. Macromol. 2019, 134, 223–229. [Google Scholar] [CrossRef] [PubMed]
- Chen, J.H.; Li, G.P.; Liu, Q.L.; Ni, J.C.; Wu, W.B.; Lin, J.M. Cr(III) ionic imprinted polyvinyl alcohol/sodium alginate (PVA/SA) porous composite membranes for selective adsorption of Cr(III) ions. Chem. Eng. J. 2010, 165, 465–473. [Google Scholar] [CrossRef]
- Sulaymon, A.H. Column Biosorption of Lead, Cadmium, Copper, and Arsenic ions onto Algae. J. Bioprocess. Biotech. 2013, 3, 1–7. [Google Scholar] [CrossRef]
- Wang, B.; Su, H.; Zhang, B. Hydrodynamic cavitation as a promising route for wastewater treatment—A review. Chem. Eng. J. 2021, 412, 128685. [Google Scholar] [CrossRef]
- Carpenter, J.; Badve, M.; Rajoriya, S.; George, S.; Saharan, V.K.; Pandit, A.B. Hydrodynamic cavitation: An emerging technology for the intensification of various chemical and physical processes in a chemical process industry. Rev. Chem. Eng. 2017, 33, 433–468. [Google Scholar] [CrossRef]
- Bethi, B.; Manasa, V.; Srinija, K.; Sonawane, S.H. Intensification of Rhodamine-B dye removal using hydrodynamic cavitation coupled with hydrogel adsorption. Chem. Eng. Process.-Process. Intensif. 2018, 134, 51–57. [Google Scholar] [CrossRef]
- Rangabhashiyam, S.; Anu, N.; Nandagopal, M.G.; Selvaraju, N. Relevance of isotherm models in biosorption of pollutants by agricultural byproducts. J. Environ. Chem. Eng. 2014, 2, 398–414. [Google Scholar] [CrossRef]
- Ayawei, N.; Ebelegi, A.N.; Wankasi, D. Modelling and Interpretation of Adsorption Isotherms. J. Chem. 2017, 2017, 3039817. [Google Scholar] [CrossRef]
- Foo, K.Y.; Hameed, B.H. Insights into the modeling of adsorption isotherm systems. Chem. Eng. J. 2010, 156, 2–10. [Google Scholar] [CrossRef]
- Brdar, M.; Šćiban, M.; Takači, A.; Došenović, T. Comparison of two and three parameters adsorption isotherm for Cr(VI) onto Kraft lignin. Chem. Eng. J. 2012, 183, 108–111. [Google Scholar] [CrossRef]
- Hashi, M.; Tezel, F.H.; Thibault, J. Ethanol Recovery from Fermentation Broth via Carbon Dioxide Stripping and Adsorption. Energy Fuels 2010, 24, 4628–4637. [Google Scholar] [CrossRef]
- Al Bsoul, A.; Hailat, M.; Abdelhay, A.; Tawalbeh, M.; Jum’h, I.; Bani-Melhem, K. Treatment of olive mill effluent by adsorption on titanium oxide nanoparticles. Sci. Total Environ. 2019, 688, 1327–1334. [Google Scholar] [CrossRef]
- Yang, K.; Xue, F.; Sun, Q.; Yue, R.; Lin, D. Adsorption of volatile organic compounds by metal-organic frameworks MOF-177. J. Environ. Chem. Eng. 2013, 1, 713–718. [Google Scholar] [CrossRef]
- Mahapatra, A.; Mishra, B.; Hota, G. Electrospun Fe2O3–Al2O3 nanocomposite fibers as efficient adsorbent for removal of heavy metal ions from aqueous solution. J. Hazard. Mater. 2013, 258–259, 116–123. [Google Scholar] [CrossRef]
- Pap, S.; Knudsen, T.; Radonić, J.; Maletić, S.; Igić, S.M.; Sekulić, M.T. Utilization of fruit processing industry waste as green activated carbon for the treatment of heavy metals and chlorophenols contaminated water. J. Clean. Prod. 2017, 162, 958–972. [Google Scholar] [CrossRef]
- Mohamad, O.A.; Hao, X.; Xie, P.; Hatab, S.; Lin, Y.; Wei, G. Biosorption of Copper (II) from Aqueous Solution Using Non-Living Mesorhizobium amorphae Strain CCNWGS0123. Microbes Environ. 2012, 27, 234–241. [Google Scholar] [CrossRef]
- Zhao, M.; Zhao, J.; Huang, Z.; Wang, S.; Zhang, L. One pot preparation of magnetic chitosan-cystamine composites for selective recovery of Au(III) from the aqueous solution. Int. J. Biol. Macromol. 2019, 137, 721–731. [Google Scholar] [CrossRef] [PubMed]
- Bethi, B.; Sonawane, S.; Potoroko, I.; Bhanvase, B.A. Novel hybrid system based on hydrodynamic cavitation for treatment of dye waste water: A first report on bench scale study. J. Environ. Chem. Eng. 2017, 5, 1874–1884. [Google Scholar] [CrossRef]
- ZU, Y.-G.; Zhao, X.-H.; Hu, M.-S.; Ren, Y.; Xiao, P.; Zhu, L.; Cao, Y.-J.; Zhang, Y. Biosorption effects of copper ions on Candida utilis under negative pressure cavitation. J. Environ. Sci. 2006, 18, 1254–1259. [Google Scholar] [CrossRef] [PubMed]
- Raj, A.; Bethi, B.; Sonawane, S.H. Investigation of removal of crystal violet dye using novel hybrid technique involving hydrodynamic cavitation and hydrogel. J. Environ. Chem. Eng. 2018, 6, 5311–5319. [Google Scholar] [CrossRef]
Disclaimer/Publisher’s Note: The statements, opinions and data contained in all publications are solely those of the individual author(s) and contributor(s) and not of MDPI and/or the editor(s). MDPI and/or the editor(s) disclaim responsibility for any injury to people or property resulting from any ideas, methods, instructions or products referred to in the content. |
© 2023 by the authors. Licensee MDPI, Basel, Switzerland. This article is an open access article distributed under the terms and conditions of the Creative Commons Attribution (CC BY) license (https://creativecommons.org/licenses/by/4.0/).