Abstract
The dual credit policy is currently the main starting point for China to achieve the green and sustainable development of the auto market. However, the policy’s impact on future market development remains unclear. It is necessary to consider the market capacity constraints and the market competition environment. By researching the impact of the dual credit policy on the micro-decision-making of automakers and the long-term evolution of the macro-auto market, the effect of the dual credit policy on the Chinese auto industry is obtained. This paper considers the market capacity constraint, combines the competitive relationship and game payment matrix between NEV makers and CFV makers, constructs a game model of the competition density between NEVs and CFVs, simulates the development and evolution of China’s auto market size, and analyzes the effect of the quantitative parameters of the dual credit policy on the auto market. The results show that: (1) the increase in NEV makers’ sale of credits will stimulate their production incentives, and the increase in conventional fuel vehicle (CFV) makers’ cost of purchasing credits will reduce their production incentives; (2) tightened fuel consumption standards for CFVs has an enhanced stimulating effect on the increase in the market share of NEVs, which can effectively reduce the market share of CFVs; (3) the price of credits facilitates the growth of the NEV market share, but credit prices that are too high do not stimulate the growth of the NEV market share to a significant degree; (4) the increase in the proportion of credits required for NEVs and the increase in the price of credits together help to reduce the market share of CFVs and increase the market share of NEVs.
1. Introduction
The automobile industry is an important strategic pillar industry of China’s national economy, and China has been the world’s largest automobile market for ten consecutive years. With the explosive growth in automobile sales, the consumption of gasoline and diesel for automobiles accounts for more than 80% of the consumption of refined oil [1], and the environmental and climate impacts caused by the consumption of fossil fuels are increasing year by year. For example, in China, automobile carbon emissions account for approximately 7.5% of total social carbon emissions [2]. Additionally, vehicle exhaust emissions account for more than 80% of all carbon monoxide produced and 20% to 30% of urban particulate matter pollutants [3]. The progress in carbon emission reduction made by the automobile industry, which is an important source of carbon emissions as well as smog and photochemical smog pollution, will affect the realization of China’s dual carbon goals [4]. At the same time, the environmental pollution problems caused by the growth in conventional fuel vehicle sales have attracted increasing attention from the Chinese government [5]. Therefore, promoting the green and sustainable development of the automobile industry has become an important transformation direction of China’s automobile industry.
Investing in the development of new energy vehicles is the key path to achieving a green and sustainable automotive industry in China. In the past ten years, China’s new energy vehicles have been advancing in a major way, with sales increasing from 0 in 2009 to 1.242 million in 2019. China’s new energy vehicle sales have surpassed those of the United States, with China becoming the world’s largest new energy vehicle sales market [6]. However, constrained by external factors such as lagging infrastructure construction and low consumer acceptance [7], the current market share of new energy vehicles in China is only 6%, and conventional fuel vehicles are still the mainstream of the automobile consumption market. The reasons for this are, on the one hand, the poor range of new energy vehicles, the lack of strong chip technology autonomy, and the lack of product quality standardization; on the other hand, many automakers have difficulty producing both new energy vehicles and conventional fuel vehicles. Specifically, the limited resources of the automakers themselves make it impossible for them to combine the R&D, production, and service for both new energy vehicles and conventional fuel vehicles at the same time. Therefore, driven by their operating profit, automakers have to optimize a game between these two production strategies to maximize their interests [8]. Recently in China, given the relatively broad market capacity of conventional fuel vehicles and substantial product profits, many automakers generally focus on the production of conventional fuel vehicles, and new energy vehicles are often used as a supplement to their car production. In this context, to meet the requirements of China’s new energy industry development and to improve the energy consumption structure, the government urgently needs to adopt targeted policies to alleviate this vehicle production status quo.
In recent years, Chinese provinces and cities have introduced several supportive policies for new energy vehicles, covering fiscal subsidies, infrastructure construction, financial protection, administration, technology sharing, and other aspects [9]. However, due to the lack of management and implementation and the lack of precision in support, these policies have had a limited effect in promoting the production of new energy vehicles and have failed to achieve the expected utility set by the government. In response to this situation, to effectively determine the game theory-based strategy of producing conventional fuel vehicles or producing new energy vehicles, the Ministry of Industry and Information Technology (MIIT) issued the policy Parallel Management Measures for Average Fuel Consumption of Passenger Vehicle Enterprises and New Energy Vehicle Points (hereinafter referred to as the “dual credit policy”) in 2017, which quantifies the energy efficiency of new and old automobile products in terms of points; moreover, the policy sets target values [10] and establishes a point trading mechanism between automakers for new and old automobile products to gradually replace financial subsidies.
Therefore, the official implementation of the dual credit policy has brought new challenges to the production and operation of automakers. How to deal with the production game between conventional fuel vehicles and new energy vehicles is an important issue facing automakers in the context of the transformation of the auto industry. At the same time, as a policy maker, the government has had a relatively short period of time following the official implementation of the dual credit policy. The mechanism of the impact of the policy on the evolution of the auto market and whether the dual credit policy has achieved the desired effect remain to be proven. In addition, there is an imbalance in which there is more empirical evidence than theoretical analysis. Thus, there is an unnecessary theoretical “vacuum” behind the promotional practice of new energy vehicles empowered by the dual credit policy. Hence, this paper aims to explore the macro-effects of the dual credit policy on the micro-decision-making of automakers and the evolution of the Chinese auto market and provide a reference for the construction of an effective intervention mechanism for the development of China’s automotive industry.
This paper considers the market capacity and the profit of the automakers’ production game, where a competitive density game model is constructed between new energy vehicles and conventional fuel vehicles, and the impact of the dual credit policy on the micro decisions of automakers and the long-term evolution of the macro automotive market is studied to analyze the transmission path of the impact of the dual credit policy on China’s auto industry. The contributions of this paper are: (1) considering the mechanism of the dual credit policy, expanding the research related to the proliferation of new energy vehicles from the supply side, and constructing an effective intervention mechanism for industrial development to provide a reference; (2) studying the process of new energy vehicle market evolution and the emergence mechanism in the industry, starting from the behavioral decision pattern of individual vehicle enterprises participating in the competitive market; and (3) by combining the production decision behavior of automakers with the macro development behavior of the auto market and incorporating the population competition relationship in the evolutionary behavior of the auto market, the model is better able to explore the micro–macro action mechanism of automakers on the evolution of the Chinese auto market.
The remainder of the paper is structured as follows: In Section 2, the relevant literature is reviewed. Section 3 introduces the model background of this paper. Section 4 introduces the methodology of this paper. Section 5 and Section 6 address the game results, proof, and analysis. Section 7 conducts numerical simulation. Section 8 summarizes.
2. Literature Review
This study is related to two streams of literature: (1) the production decisions of automakers under the dual credit policy; and (2) the factors influencing the evolution of the new energy vehicle market.
2.1. Production Decisions of Automakers under the Dual Credit Policy
The government promulgated the dual credit policy with the aim of promoting the development of new energy vehicles and promoting energy savings and a reduction in the consumption of conventional fuel vehicles. The official implementation of the dual credit policy has brought a new research situation to the production decisions of automakers. Ou et al. [11] further adopted the new energy and oil consumption credit (NEOCC) model to point out that producing long-range NEVs under the dual credit policy is more efficient than producing other plug-in hybrids. Li et al. [12] established mixed-integer linear programming (MILP) and used a heuristic algorithm combined with data simulation to explore production decisions regarding ICEVs and NEVs under subsidy policies and the dual credit policy considering competition and cross-chain cooperation. He et al. [13] presented an optimal production decision model under the dual credit policy and considered two factors: credit prices and time-dependent electric vehicle investment costs. The results show that the high profitability of NEVs can accelerate electrification, while a rapid increase in credit prices may delay it. Peng et al. [14] considered both centralized and decentralized supply chains and explored the production decisions of automakers under the dual credit policy. The results suggest that the dual credit policy effectively increases automakers’ output of new energy vehicles in both situations. Yu et al. [15] studied the substitution effect of the dual credit policy on subsidy policy and showed that the dual credit policy has a positive effect on the promotion of new energy vehicles. Zhu et al. [16] proposed a decision algorithm for the production strategy of automakers under the dual credit policy and studied the behavioral strategies of automakers in response to this policy. Ma et al. [17] found that for the fuel efficiency of automakers whose actual average fuel consumption is higher than the standard, the dual credit policy may reduce their enthusiasm to produce new energy vehicles. Lou et al. [18] discussed the influence of the dual credit policy on the production decisions of automakers and argued that the implementation of the dual credit policy may not be able to help automakers improve the fuel economy of ICEVs or reduce the production of high fuel consumption vehicles (HFCVs). They suggested the revision of relevant parameters of the China’s dual credit policy. It can be seen that the impact of the dual credit policy on the production decisions of automakers needs to be further studied.
2.2. Factors Influencing the Evolution of the New Energy Vehicle Market
The development and evolution of the new energy vehicle market is a dynamic process, and to scientifically understand the quantitative rules of this process we must first analyze the influence of factors such as government policies on the evolution of this market. The current research on the evolution of the new energy vehicle market mainly considers automakers as a whole and explores the factors that affect the evolution of the new energy vehicle market. Alexandros et al. [19] described new energy vehicle policy in Europe, believing that the government’s support for technological innovation can promote the development of the new energy vehicle industry. William and Gregory [20] described a series of policies implemented by the state government of California for the new energy vehicle industry. Their research shows that a series of legislative and regulatory measures adopted by this state government, such as zero-emission vehicles and low-carbon fuel standards, are beneficial for new energy vehicles and the promotion of new energy vehicles. Yu et al. [21] considered the market competition and credit cooperation relationships that constitute the diffusion process of new energy vehicles to reveal the diffusion patterns and trends of new energy vehicles among vehicle companies. Liu et al. [22] argued that the key factors affecting the diffusion of electric vehicles include the technical level, policies and regulations, consumer acceptance and expectations, prices and models, and the market structure and competition. Among these influencing factors, the role of policies and regulations has received extensive attention. Chen et al. [23] studied the behavioral decision making of manufacturers under the combination of carbon tax and subsidy policies, and they argued that the bilateral dynamic tax subsidy mechanism can provide more incentives for manufacturers. Through a dynamic analysis of government subsidy strategies, Fan et al. [24] showed that subsidies are not the decisive factor for the successful diffusion of low-carbon strategies. Liu et al. [25] considered the impact of emission tax and subsidy policies on the development of the electric vehicle industry under static and dynamic scenarios, respectively. Their results show that dynamic tax and a static subsidy are more effective in promoting the development of the electric vehicle industry. In addition, under the background of the decline in China’s new energy vehicle subsidy, Ji et al. [26] and Kong et al. [27] studied the impact of a series of other policies on the diffusion of electric vehicles after the decline in this subsidy. Jiao et al. [28] developed a game model to study the impact of policies on the diffusion of new energy vehicles and demonstrated that the dual credit policy can replace financial subsidies. Kong et al. [29] considered the interaction of production, technology and the market to simulate the impact of policy parameters on policy objectives and found that the double credit policy has a limited impact on the diffusion of the new energy vehicle market, but can reduce the overall energy consumption of the automotive industry.
However, previous studies have focused more on the market evolution of new energy vehicles and related influencing factors and less on the dynamic development process of the whole automobile market, including new energy vehicles and conventional fuel vehicles, by using density theory. The market evolution and dynamic evolution between new energy vehicles and conventional fuel vehicles are like those of population competition, as the growth of either side further compresses the potential growth space of the other, thus affecting the development rate of the other. Interspecies competition may occur when individuals of two different species share limited resources in the same area, so it is more appropriate to include the population competition between new energy vehicles and conventional fuel vehicles in the study of the evolution of the automotive market in China.
2.3. Summary
The literature contains some theoretical contributions to the study of the automotive market’s development and evolution, but issues also exist. First, the development and evolution of the automotive industry are often driven by self-organized behaviors resulting from frequent interactions among individuals [30]. Previous studies lacked combining individual micro behaviors with the macro development behaviors of the system, and such micro individual behaviors are mainly reflected in the production decisions and behaviors of automakers. Second, the mutual competition relationship existing between new energy vehicles and conventional fuel vehicles is similar to population competition, and few studies have considered the development and evolutionary impact of the automotive industry from the perspective of population competition. Third, due to limited market resources, the development of the automotive industry is affected by density-limiting benefits [31]; evolutionary game studies are often based on constant population size, while parties with higher returns can more effectively use the ability to achieve market share growth, reflecting the fact that individual returns may change the population size [32]. Fourth, previous studies related to the dual credit policy abstracted only the policy concept, and few scholars considered the actual credit accounting method in their model.
3. Model Backgrounds
The dual credit policy is for managing corporate average fuel consumption (CAFC) and new energy vehicle (NEV) credits for passenger vehicles to promote new energy vehicles, energy conservation, and consumption reduction in conventional fuel vehicles. The research objects of this paper are new energy vehicle makers (NEVs) and conventional fuel vehicle makers (CFVs). The dual credit policy has strict requirements for individual automakers to achieve credits (positive credits). Automakers can pass the test in the following ways: (1) automakers can independently develop and produce new energy vehicles to obtain positive points; (2) automakers can obtain positive credits from other companies to offset their negative credits. When an automaker chooses to produce CFVs, if the value of corporate average fuel consumption (CAFC) compliance generated is lower than the actual value, negative CAFC credits are generated. Each CFV produced will generate a certain number of negative NEV credits, which can be offset by the positive CAFC credits obtained by affiliated companies. Alternatively, they can buy NEV credits from other companies to offset negative CAFC credits and negative NEV credits; the offset ratios are all 1:1. Among them, CAFC positive credits can only be carried forward or transferred to affiliated automakers by themselves and cannot be used to offset NEV negative credits, while NEV positive credits can be traded freely to offset NEV negative credits and CAFC negative credits. In this policy, CFV makers are required to meet both the mandatory CAFC credits and NEV credits over a planning horizon before being permitted to manufacture CFVs. If either the amount of CAFC credits or that of NEV credits is deficient, CFV makers must offset the credit shortfall by self-generating, purchasing externally or taking other measures; otherwise, producing CFVs will not be allowed [33]. The carryover and trading framework of the dual credit policy is shown in Figure 1.
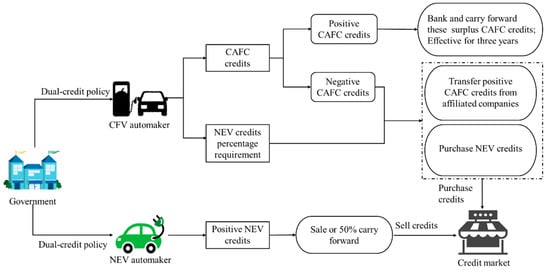
Figure 1.
Carry-over and trading framework of the dual credit policy.
4. Methodology
4.1. Automakers’ Production Decision Game Model Construction
- (1)
- The research objects of the dual credit policy assessment are passenger vehicle enterprises. There are 2 types of vehicle manufacturers in the passenger vehicles market, called automaker 1 and automaker 2, and each manufacturer is an independent organic whole, while both are engaged in vehicle production activities in the auto market and have balanced production and sales.
- (2)
- Automakers have a market choice between producing new energy vehicles or producing conventional fuel vehicles, and both have different maximum market volumes. There are the same collection of actions that automakers can choose, i.e., as A1 = A2 =, A1 = {NEV, with the probability ; CFV, with the probability 1 − }, A2 = {NEV, with the probability ; CFV, with the probability }, but producing new energy vehicles has incremental costs, incremental revenues, and other factors that distinguish it from producing conventional fuel vehicles [8,34].
- (3)
- Due to the assessment of the dual credit policy, automakers incur additional benefits and costs. The dual credit policy allows the purchase of NEV credits from other companies to offset negative CAFC credits and negative NEV credits. One positive NEV credit can offset one negative CAFC credit, and it is a one-way credit offset. The NEV automaker earns NEV credits for each new energy vehicle produced , and selling surplus NEV credits to CFV automakers can generate additional credit revenue . According to the Ministry of Industry and Information Technology (MIIT) and the Average Fuel Consumption of Chinese Passenger Vehicle Manufacturers and New Energy Vehicle Credit Accounting Table [35,36] that it issued, among the more than 100 automakers included, none of those producing only CFVs met the fuel consumption target set by the government. If automakers want to produce conventional fuel vehicles, they must purchase a certain amount of new energy vehicle credits to produce them. Therefore, this paper focuses on the case where an automaker produces CFVs, generates negative CAFC credits, and needs to purchase NEV credits to compensate. To meet the assessment standards, CFV automakers need to pay additional credit costs , where is the NEV ratio requirement and is the CAFC credit earned per CFV produced by a CFV automaker. The is the actual CAFC value of the CFV automaker, and is the CAFC compliance value. The previous year’s credit carryover is not considered.
- (4)
- Assuming that different automakers produce vehicles in the market and provide positioning for the type of vehicles, i.e., whether to produce NEVs or CFVs can be seen as the game between multiple automakers in terms of production strategies, combining their relative fit in the group and thus choosing and adjusting their strategies. The symbols and meanings of the relevant parameters are shown in Table 1. Combining the above assumptions yields the game payment matrix shown in Table 2.
 Table 1. Symbols and their descriptions.
 Table 2. Game payment matrix for automakers.
In the process of analysis of the above game model, it can be seen that driven by their resource constraints and operating profit, automakers need to optimize a game between the production of NEVs and CFVs to maximize their interests. The development and evolution of the automobile industry are driven by the self-organizational behavior generated by automakers’ production decision game strategy. The industry’s development is inseparable from the maximum market volume, and a density game can be used to analyze automakers’ production decisions.
4.2. Construction of the Density Game Model of the Competition between NEVs and CFVs
4.2.1. Market Evolution for the Independent Development of NEVs and CFVs
The sizes of NEVs and CFVs in the automotive market are and , respectively; and denote their natural growth rates, respectively; and denote the maximum current market capacity of new energy vehicles and conventional fuel vehicles in the micro market, respectively. The dynamic evolution equation for the independent development of two different types of vehicles in the automotive market is shown in Equation (1):
In Equation (1) represent the initial population sizes of the two types of vehicles in the passenger vehicles market. denote the population density of the two types of vehicles in year , and reflect the development trend of the two types of vehicles in the passenger vehicles market. The logistic equation for the long-term development trend of CFVs is derived from Equation (1), as shown in Equation (2):
4.2.2. Construction of the Density Game Model of the Competition between NEVs and CFVs
The density game model (as in Equation (3)) proposed by Novak et al. [31] and Huang et al. [32] is borrowed to explore the competitive evolutionary behavior of conventional fuel vehicles and new energy vehicles for the automobile market in the competitive density game model. Density game has been applied to research areas such as biology and social networks [37,38,39]. The original state of the model is shown in Equation (3):
The original formula is shown in Equation (3), where the denotes the number of populations of different strategic selectors at a given time, denotes the net replication rate of different strategy selectors when not constrained by density, denotes the maximum environmental capacity, denotes the payoff of strategy when strategy and strategy are played (), and denotes the total number of all selector populations for strategy . The model assumes that the population size of the system is influenced not only by the game payoff matrix but also by the different environmental capacities of the population, which links the game payoff matrix to the population density limit, indicating that individuals with higher payoffs are more powerful and can better utilize resources compared to their competitors.
Based on a density game theory approach, in this paper a density game model of competition between NEVs and CFVs in the Chinese market is constructed to reveal the characteristics of the relationship between NEVs and CFVs in that market, as shown in Equation (4):
To simplify the construction of the density boom competition model, let , ,, . In Equation (4), , respectively, denote the current market sizes of NEVs and CFVs in the auto market with both as a function of time .
The represent the net replication rate of NEVs and CFVs in the auto market without environmental capacity constraints, respectively. Under the given conditions, both values are constant.
denote the maximum current environmental capacity in the auto market for the producing new energy vehicles and conventional fuel vehicles, respectively.
denote the market revenue per unit in the auto market where all automakers in the auto market choose to produce NEVs, and all choose to produce CFVs.
denotes the maximum market value added of NEVs in the auto market in the current period.
denotes the maximum market value added of CFVs in the auto market in the current period.
denote the coefficients of the role of CFVs on the unit market size of NEVs and the role of NEVs on the unit market size of CFVs when the two types of vehicle makers choose to produce NEVs and CFVs production strategies to game each other, respectively.
The denote the development trend of NEVs and CFVs in the auto market, respectively.
The formula denotes the growth retardation coefficients of NEVs and CFVs in the auto market due to the consumption of limited social resources, respectively.
From model (4) and Table 2, it can be seen that model (4) describes the dual credit policy scenario, i.e., the competitive density game model under the influence of market volume for NEVs or CFVs when automakers choose two different strategies for producing NEVs and CFVs.
5. Model Analysis
5.1. Game Model Stability Analysis
The probability of automaker 1 producing an NEV is , and the probability of producing a CFV is . The probability of automaker 2 producing an NEV is , and the probability of producing a CFV is . is the expected revenue function of automaker 1 choosing to produce NEVs, is the expected revenue function of automaker 1 choosing to produce CFVs, is the average expected revenue of automaker 1, is the expected revenue function of automaker 2 choosing to produce NEVs, is the expected revenue function of automaker 2 choosing to produce conventional fuel vehicles, and is the average expected revenue of automaker 2.
Due to the limited rationality of the setup, automakers gradually adjust their strategies according to the external situation in the game process. For example, if the automaker’s adaptation of “producing NEVs” is better than “producing CFVs”, the number of car companies choosing this strategy increases afterward. The following is a replication of the dynamic equation to analyze the production strategy adopted by automakers, as shown in Equations (7) and (8):
Let , ; we can obtain 5 local equilibrium points: O (0, 0), (0, 1), (1, 0), (1, 1), .
According to Friedman’s method [40], the stability analysis of the Jacobi matrix of the above equations leads to the system evolutionary stability strategy (ESS). From the system of equations in Equation (7), the Jacobi matrix can be calculated as:
The stability of the equilibrium point of the system of Equation (7) can be determined by the sign of the determinant and the trace T of the matrix , as shown in Equation (9). When and T are satisfied, the equilibrium point of the replicated dynamic equation is the evolutionary stabilization strategy (ESS). Therefore, and T of Equation (7) can be obtained as shown in Table 3, and stability solutions for parameter changes in the game model can be obtained as shown in Table 4.

Table 3.
Determinants and traces of the evolutionary equilibrium point of the game model.

Table 4.
Stability solutions for parameter changes in the game model.
The analysis of each equilibrium point leads to the following conclusions:
- (1)
- When , the equilibrium point is (1, 1), that is, (NEV, NEV). Both types of automakers in the market choose to “produce new energy vehicles”. At this time, automakers produce NEVs and sell NEV credits to make up for the incremental cost of producing NEVs, while the cost of credits purchased by automakers producing CFVs to complete the assessment exceeds the incremental cost of switching to producing NEVs. Thus, automakers choose NEVs;
- (2)
- When , or , the equilibrium point is O(0, 0), that is, (CFV, CFV). Both types of automakers in the market choose to “produce CFVs”; at this time, automakers do not sell NEV credits for producing NEVs to cover the incremental cost of producing NEVs, and the cost of credits purchased for producing CFVs is less than the incremental cost of switching to producing NEVs; thus, automakers choose to continue to produce CFVs;
- (3)
- According to the above analysis, the strategies of automakers are different in different situations. In reality, it is reflected in the stage of development changes. From the overall perspective, the optimal strategy is: produce new energy vehicles, produce new energy vehicles. Under this strategy, the dual credit policy helps stimulate more automakers to produce new energy vehicles.
5.2. Competition Density Game Model Stability Analysis
5.2.1. Competition Density Game Model Equilibrium Point Analysis
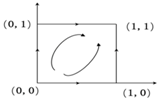
From an analysis of the stability of the evolutionary game strategy, the market automakers’ decisions about what kind of cars to make under the influence of the dual credit policy mostly follow the process of the initial stage to the ideal stage (as shown in Figure 2), and the system needs the dual credit policy to be regulated to move forward in its evolution. In the evolutionary process, some automakers choose to produce new energy vehicles, while other automakers continue to produce conventional fuel vehicles. These two types of automakers generate competition relationships in the market, which are similar to population competition. The growth of either party will further compress the potential growth space of the other party and affect the development speed of the other party. When individuals of two different species share limited resources in the same area, interspecies competition may occur and inhibit the development speed of the two species. The specific impact of the regulation means of the dual credit policy on the diffusion of production decisions of automakers is of importance. Considering the limited market resources, the development of the automotive industry is affected by the density limitation benefit [31]. The party with a higher revenue can more effectively use the ability of the resources to achieve market diffusion, thus further approaching the stability strategy for the competition density model.
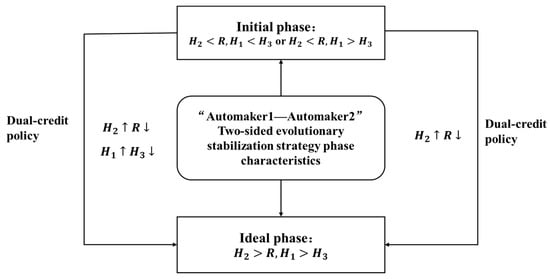
Figure 2.
“Automaker1—Automaker2” two-sided evolutionary stabilization strategy phase characteristics.
To determine the equilibrium state of the development process of NEVs and CFVs in the auto market in the competitive density game model, let ; then, we have:
(1) According to the stability theory of ordinary differential equations, in Equation (5), four local equilibria can be obtained: ;
(2) Then, based upon the stability theory of ordinary differential equations, the Jacobian matrix of Equation (5) can be expressed as Equation (11). The corresponding determinant value and trace of the matrix can be expressed as in Equation (12):
Then, according to the stability theory of ordinary differential equations, the equilibrium reaches the asymptotic stable state when and . The determinant value, trace value, and the stability condition of the equilibrium points in competition coexistence can be obtained as shown in Table 5 and Table 6.

Table 5.
The determinant and trace of the evolutionary equilibrium point.

Table 6.
Stability solution for parameter variation.
According to the above table, in the two stages of the evolutionary path that exist between automakers in the market, if automakers producing new energy vehicles benefit beforehand, then they always need dual credit policy regulation. To promote the production of new energy vehicles, increase automakers’ credit revenue, increase the credit cost of production of conventional fuel vehicles for automakers, and intervene in the market for new energy vehicles industry development to obtain evolutionary stability solution. In this paper, the summarized two-stage evolutionary path is matched with the equilibrium solution of the competition density game model to solve the automotive market evolutionary path as well.
(1) Initial phase: The production of new energy vehicle makers makes too little profit from the sale of NEV credits. In the production of conventional fuel vehicles, automakers produce too many high fuel consumption models and produce negative fuel consumption points, which need only to be offset to zero by purchasing new energy points at a very low price. Thus, the automakers in the market continue to produce conventional fuel vehicles and the dual credit policy is less effective. At this point, the competition density game model has no equilibrium point and conventional fuel vehicles have a high market share in the market; it is difficult for new energy vehicles, which originally have a very low market share, to enter the competition evolution stage with them.
(2) Ideal phase: The production of new energy vehicle makers has higher profits from the sale of new energy credits, increasing their incentive to produce new energy vehicles; the negative fuel consumption credits generated by automakers producing conventional fuel vehicles can hardly be offset by the purchase of new energy credits at a very low price to zero, and the significant effect of the dual credit policy has prompted these automakers to consider transformation. At this time, there is an equilibrium point in the competition density game model, and the market for new energy vehicles and conventional fuel vehicles enters a competitive evolutionary stage.
When , the equilibrium point of this system is stable; that is, the two groups of NEVs and CFVs finally reach the stable state. Substituting the original variables corresponding to into the model stability condition and the stability point , the expression of Equations (13) and (14) becomes:
Equation (14) shows the relationship between the system stability point and the game payment matrix, where are the market holdings of NEVs and CFVs at the stabilization point, respectively. To reveal some of the key parameters involved in the game payment matrix and the impact on the stability point of the competitive system, in this paper are used as parameters to find its corresponding partial derivative of Equation (14) and to obtain formulas , , , , , , , , , and .
By analyzing the equilibrium points, the results can be obtained as shown in Table 7.

Table 7.
Effect of different parameters on the equilibrium point.
As known from the above Table 7, different parameters have different effects on the steady state of the system. In Table 7, the formula in columns 2 and 3 of row 6 and columns 2 and 3 of row 7 are “>0 and <0”, denoting that due to the dual credit policy and according to the long-term equilibrium stability of the system, the higher the income of NEV automakers selling credits, the higher the cost of CFV automakers purchasing credits, which helps to increase the market share of NEVs at the point of stability and can reduce the market share of CFVs at the point of stability.
5.2.2. Competition Density Game Model Analysis of the Stability Phase Diagram
From the analysis of the stability points shown in Table 7, it is clear that the conditions for the existence of stability points in the competitive systems of NEVs and CFVs are . In this paper, the isosceles positioning relationship and the phase diagram analysis methods are combined with track alignment to analyze the system stability. The phase diagrams (Figure 3) of the isotropic lines and are shown below. Since and are greater than zero, the positive and negative aspects of the system are determined by the equations in the parentheses of Equation (15):
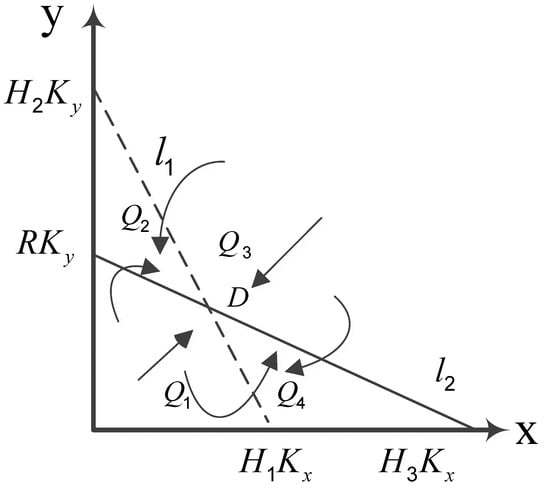
Figure 3.
Phase diagram of equilibrium point .
When , there exists a negative slope of the isotropic lines and , and the isotropic lines intersect in the first quadrant, where the slope of is greater than the slope of . From the phase diagram (Figure 3), it is known that the full graph trajectories converge to the stabilization point , indicating that point is the stable equilibrium point. When the initial value is at , the evolutionary characteristics of the two sides of the game are , indicating that the growth rate of both NEVs and CFVs in this region is less than zero; when the initial value is at , the evolution of both sides of the game is characterized by , indicating that the growth rate of NEVs in this region is less than zero while the growth rate of CFVs is greater than zero. When the initial value is at , the evolution of both sides of the game is characterized by , indicating that the growth rate of both NEVs and CFVs in this region is greater than zero. When the initial value is at , the evolution of both sides of the game is characterized by , indicating that the growth rate of NEV market holdings in this region is greater than zero while the growth rate of CFVs is less than zero.
6. Data and Methodology
6.1. Research Subjects and Data Selection
To reveal the dynamic influence process of the development and evolution of China’s automobile market, the sales volumes of new energy and conventional fuel passenger vehicles markets were selected as the research samples, where the conventional fuel vehicle types exclude low-speed electric vehicles and agricultural vehicles. Data are from the China Automobile Market Yearbook, China Automotive Industry Yearbook, and China National Bureau of Statistics. The dual credit policy 2019 went into force; that is, before 2019 NEV and CFV sales volumes were not affected by the dual credit policy, and the market sales volume of NEVs consisted of only 10 years, so the maximum environmental capacity of NEVs refers to the maximum environmental capacity of the market of CFVs. In this paper, the 1996–2018 CFV market sales volume was selected as the study data to forecast the maximum market size of CFVs, and the relevant data for 2019 were selected as the initial values of the model parameters. The sales volume of CFVs and NEVs refer to the China Automotive Market Yearbook. The model initial values of and for NEVs and CFVs were 1.06 million and 20.1601 million units, respectively.
According to a McKinsey report, CNY 200 thousand–250 thousand is the popular price point for China’s passenger vehicles market, with the average price per NEV being CNY 239 thousand and the average price per CFV being CNY 176 thousand, the cost per CFV is approximately 50–60% of the selling price [41], and the cost per NEV is approximately 80% of the selling price. Therefore, the unit revenue of CFV is set at CNY 80 thousand. The average cost of an NEV is CNY 20 thousand higher than that of a CFV due to the cost of the power battery system and the indirect costs (R&D costs, depreciation costs, etc.) of the new energy vehicle [8]; therefore, the unit incremental cost of producing per NEV is set at CNY 20 thousand. Referring to the study in [34], the incremental income is therefore set at CNY 30 thousand.
According to the Average Fuel Consumption of Chinese Passenger Vehicle Manufacturers and New Energy Vehicle Credit Accounting Table and the China Automotive Industry Yearbook, the 2019 NEV credits were 4,173,300, and the total sales of new energy passenger vehicles were 1,129,700, so the average NEV credits for 2019 was 3.36; therefore, the average NEV credits was set at 3.36. The Ministry of Industry and Information Technology (MIIT) issued Parallel Management of Average Fuel Consumption of Passenger Vehicle Enterprises and New Energy Vehicle Credits, which stipulates that the annual percentage target for NEV credits for 2019 was 10%, so was set at 10%. According to China’s Stage IV fuel consumption standards, the CAFC target for 2019 was 5.5 L/100 km, so the CAFC target for CFVs was set at 5.5. Statistics from the Ministry of Industry and Information Technology’s Announcement on Average Fuel Consumption of Chinese Passenger Vehicle Enterprises and New Energy Vehicle Credits, the actual 2019 CAFC value for the 144 passenger vehicle companies in the country was 5.56 L/100 km, so, the actual CAFC of CFVs was set at 5.56.
6.2. Parameter Estimation
The research data of conventional fuel vehicle market sales were taken from 1996–2018 and were brought to the formula fitted by MATLAB software by using a nonlinear least squares method. The parametric equations are in good agreement with the actual data, as shown in Table 8. The results of the fit according to the table and graph are shown in Table 9 and Figure 4. For the model, in approximately 2030 China’s conventional fuel vehicle market sales gradually reaches saturation, with a saturation value of approximately 26.663 million units. Therefore, in this paper, the maximum market capacity of conventional fuel vehicles was set to 26.663 million units, and the maximum market capacity of new energy vehicles was set to 30 million units due to the stronger sustainable market development of new energy vehicles [42].

Table 8.
The initial values of the parameters.

Table 9.
Parameter estimation results.
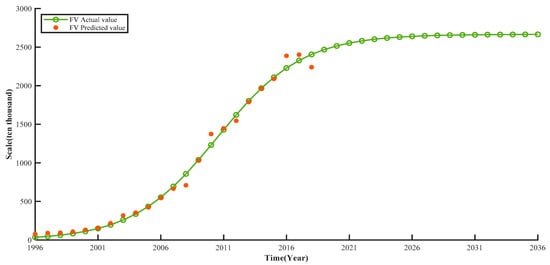
Figure 4.
Trends in market share evolution when conventional fuel vehicles are developed independently.
7. Simulation Result
7.1. Simulation Analysis of the Evolutionary Game Model
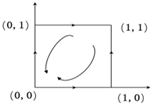
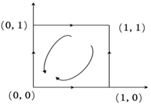
According to the initial values in Table 8, the simulation result graph of automakers’ strategy evolution under the ideal phase was obtained, as shown in Figure 5a where abscissa “q” represents the probability that automaker 2 chooses the NEV production strategy, and ordinate “g” indicates the probability that automaker 1 chooses the NEV production strategy. Setting 8.5, and , the simulation result graph of automakers’ strategy evolution under the initial phase was obtained, as shown in Figure 5b, and both sides’ strategy choices converge at two equilibrium points, (0, 0) and (1, 1), respectively. In the ideal phase, when the dual credit policy is effective, automakers producing new energy vehicles can make up for the incremental cost of producing new energy vehicles by selling credits, which promotes the transformation of automakers away from producing conventional fuel vehicles and makes more automakers produce new energy vehicles in the market.
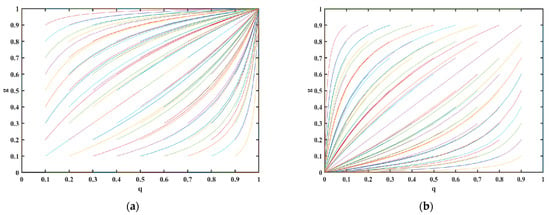
Figure 5.
Random graph of the evolutionary trend of each phase, (a) is the simulation result graph of automakers’ strategy evolution under the ideal phase; (b) is the simulation result graph of automakers’ strategy evolution under the initial phase.
7.2. Simulation Analysis of the Competition Density Game Model
The competitive density game model of new energy vehicles and conventional fuel vehicles can be used to reveal the new energy vehicle and conventional fuel vehicle market size evolution process in China. The and in Figure 6 represent the evolutionary trend when new energy vehicles and conventional fuel vehicles, respectively, develop independently, and and y represent the evolutionary trend of competition between new energy vehicles and conventional fuel vehicles.
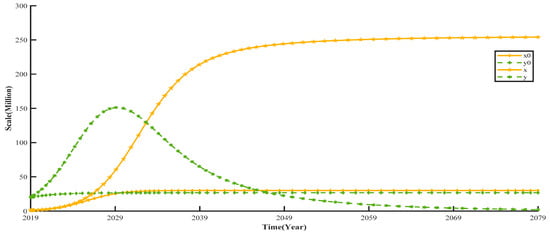
Figure 6.
Model evolution time series diagram.
As seen from Figure 6, when not affected by the game payment of automakers and the competitive relationship between new energy vehicles and conventional fuel vehicles, the market diffusion of new energy vehicles and conventional fuel vehicles follows the growth law in the natural state, with a slow growth rate at the beginning stage and then a rapid rise to reach its maximum market capacity; that is, the market saturation stage.
The maximum environmental capacity of both new energy vehicles and conventional fuel vehicles is significantly increased when influenced by the game payment of automakers and the competitive relationship between new energy vehicles and conventional fuel vehicles, justifying the model hypothesis. There is a relationship competition between new energy vehicles and conventional fuel vehicles. New energy vehicles have greater market advantages, and their position in the automotive market is gradually stabilizing, while the status of conventional fuel vehicles has declined. Our findings confirm the results of Li et al. [41].
7.2.1. The Standard Value of the CAFC Impact on the Evolutionary Trends of the Automotive Market
Figure 7 shows the impact of the standard value of the CAFC on the evolutionary trend of the automotive market. In this paper, other parameters of the market competition system between new energy vehicles and conventional fuel vehicles were kept unchanged, and the CAFC attainment value were set as ,,.
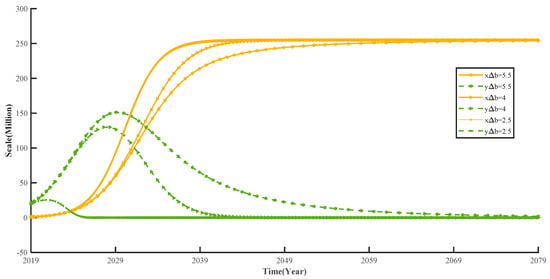
Figure 7.
Impact of standard value of the CAFC on the evolutionary trends of the automotive market.
China’s Stage IV fuel consumption standards stipulate that the average fuel consumption target for passenger cars in 2019 was 5.5 L/100 km, China’s Stage V fuel consumption standard, promulgated in 2021, stipulated that the CAFC compliance level is projected to drop to 4.0 L/100 km by 2025. China’s target fuel consumption value standards for conventional fuel vehicles are on a tightening trend. At the same time, the market share of new energy vehicles increases to the maximum environmental capacity value at an accelerated rate, while conventional fuel vehicles are inhibited, and their market size gradually shrinks at an accelerated rate. The reason is that declining target fuel consumption values for passenger vehicles should prompt more automakers to choose to produce new energy vehicles. The production of conventional fuel vehicles should decrease due to the difficulty of obtaining more positive credits. To complete the dual credit policy assessment, the decrease in the value of CAFC compliance increases automakers’ purchases or reduces the cost of their own fuel consumption, and ultimately should force automakers to electrify. This finding also confirms some conclusions of Ma et al. [17] and Lou et al. [18], but they did not study the evolution of the impact of the value of CAFC compliance on the market share of the two types of vehicles. Our findings also confirm the views of Li et al. [12], but they do not consider the impact of NEV credit market prices on the evolution of the overall auto market share based on the competitive environment. NEV credits price impact on the evolutionary trend of the automotive market.
Figure 8 shows the impact of NEV credit prices on the evolutionary trend of the automotive market. In this paper, the other parameters of the market competition system between new energy vehicles and conventional fuel vehicles were kept unchanged, and the NEV credit prices were set at ,,, because the market credit price is on an upward trend.
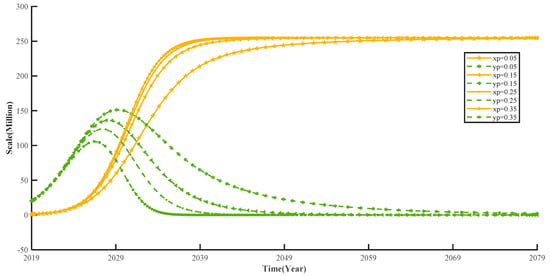
Figure 8.
NEV credits price impact on the evolutionary trend of the automotive market.
As seen from Figure 8, the competitive relationship between new energy vehicles and conventional fuel vehicles gradually tends to increase as the market price of credits increases. The price of credits facilitates the growth of the NEV market share, but credit prices that are too high do not stimulate the growth of the NEV market share to a significant degree. When the price of NEV credits exceeds approximately CNY 1500 per credit, the sustained price increase cannot significantly accelerate the growth rate of the new energy vehicle market scale. According to the Annual Report on the Implementation of Parallel Management of Average Fuel Consumption and New Energy Vehicle Credits for Passenger Vehicle Enterprises released by the Ministry of Industry and Information Technology, CNY 1204 per credit in 2020 and CNY 2088 per credit in 2021. The price of credits that are too high does not stimulate the growth of the NEV market share to a significant degree. The reason is that when the transaction price of new energy vehicle credits gradually rises and even exceeds the unit credit cost borne by conventional fuel vehicle companies, conventional fuel vehicle companies are unwilling to buy credits and choose to reduce the output of conventional fuel vehicles to meet the compliance requirements of the dual credit policy. The demand for new energy credits decreases, and the credit income earned by new energy vehicle companies decreases, reducing their enthusiasm for producing new energy vehicles. However, the continued rise in NEV credit prices has made new energy vehicles less attractive than traditional fuel vehicles, and the rate at which conventional fuel vehicles’ market share is shrinking has sped up. The reason is that automakers that choose to produce conventional fuel vehicles must purchase new energy credits from the market. When the price of new energy credits rises, the production costs of conventional fuel vehicle companies will be greatly increased. Thus, the production of conventional fuel vehicles will decrease. Comparing the simulation graphs in Figure 7 and Figure 8, we can see that when the CAFC compliance value is tightened to 54.5%, it enhances the market share of new energy vehicles and accelerates the shrinkage of the share of conventional fuel vehicles compared to the 600% increase in credit price. Our findings also confirm the views of Li et al. [12], but they do not consider the impact of NEV credit market price on the evolution of the overall auto market share based on the competitive environment.
7.2.2. The Annual Percentage Target for NEV Credits Impacts the Evolutionary Trend of the Automotive Market
Figure 9 shows the impact of the new energy vehicle credit ratio requirement on the evolutionary trend of the automotive market. The NEV credit price was set at , and the annual percentage target for NEV was set at ,,,.
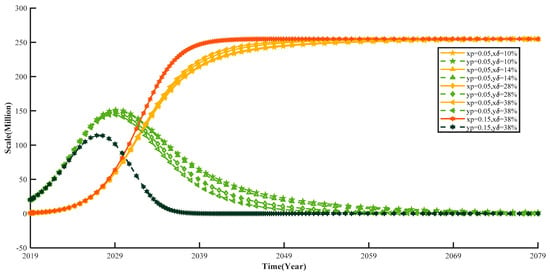
Figure 9.
The impact of the annual percentage target for NEV credits on the evolutionary trend of the automotive market.
Compared to the point price and CAFC compliance value, the new energy vehicle point ratio requirement has less impact on the competitive intensity of new energy vehicles and conventional fuel vehicles. In 2022, the Ministry of Industry and Information Technology’s Decision on Amending the Parallel Management Measures for Average Fuel Consumption of Passenger Vehicle Enterprises and New Energy Vehicle Credits (Draft for Comments) proposed setting the assessment ratio of new energy vehicle credits for 2024−2025 at 28% and 38%, but when the assessment ratio of new energy vehicle credits was set at 38% it still had limited effect on stimulating the market share increase in new energy vehicles and accelerating the market share reduction in traditional fuel vehicles. However, the combination of a higher new energy vehicle credit ratio requirement and higher credit price is more likely to increase the competitive effect of new energy vehicles on conventional fuel vehicles, accelerate the increase in market share of new energy vehicles significantly, achieve a dynamic steady state and sustainable development, and accelerate the rate of market size reduction in conventional fuel vehicles. This is because when the percentage of new energy vehicle credits is increased, more positive credits are needed to offset regulation zero for automakers producing conventional fuel vehicles, and the higher price of credits increases the cost for these automakers, prompting them to choose to produce new energy vehicles. Yu et al. [15] found that an increase in the production ratio of new energy vehicles inhibited the production of conventional fuel vehicles, but they did not further explore the impact of the production ratio requirements of new energy vehicles combined with higher credit prices on the market share of conventional fuel vehicles. In the credit market, when the price is low, the negative points generated by the production ratio requirements of new energy vehicles can be easily compensated. Thus, the role of this indicator is greatly reduced.
8. Conclusions
Utilizing density game theory, in this article we explore how the dual credit policy affects the evolution of the auto industry by influencing micro mechanisms such as game strategies among automakers in the context of the conventional and advanced dynamics of the Chinese auto industry under the dual credit policy. Based on actual industry data, the current policy system, and the market situation, the development and evolution of China’s auto market size are derived through simulation, and the impact mechanism of the quantitative parameters of the dual credit policy on the auto market is analyzed. The main conclusions are as follows:
(1) The increase in the income of new energy vehicle companies from selling credits will stimulate their enthusiasm for production, while the increase in the cost of purchasing credits for conventional fuel vehicle companies will reduce their enthusiasm for production. The reason is that under the dual credit policy the profit of automakers depends on two components: the profit from vehicle production and sales; and the additional income or cost of point transactions. Fluctuations in credit sales revenue or credit purchase costs will have an impact on the total profit of automakers, and the total profit from the production of vehicles will ultimately affect the scale of automakers’ production of vehicles; (2) The tightened fuel consumption standards for conventional fuel vehicles will have a stronger stimulating effect on the increase in the market share of new energy vehicles, which can effectively reduce the market share of conventional fuel vehicles. Because the reduction in fuel consumption of conventional fuel vehicles requires more innovation costs, strict standards will help automakers give priority to the production of new energy vehicles or improve fuel economy; (3) The price of credits facilitates the growth of the NEV market share, but credit prices that are too high do not stimulate the growth of the NEV market share to a significant degree. At the same time, the continuous increase in the price of credits can accelerate the decline in the market share of conventional fuel vehicles; (4) The increase in the proportion of credits required for new energy vehicles and the increase in the price of credits together help to reduce the market share of the conventional fuel vehicles and increase the market share of new energy vehicles.
Policy suggestions: (1) It is necessary for the government to form a reasonable transaction price for credits, establish a regulatory mechanism for the credit trading market, guarantee the price of credits, and reduce the risk of imbalance between credit supply and demand. (2) The design of the government’s fuel economy standards needs to study the response behavior of enterprises comprehensively and in depth, strengthen the guidance to improve the fuel consumption of conventional fuel vehicles, introduce policies to support and encourage low fuel consumption vehicles, accelerate the reduction in the fuel consumption of conventional fuel vehicles, and ease the industry’s dual credit compliance pressure. (3) It is necessary for the government to keep the credit price at an appropriate level, actively explore credit pools and price guidance measures, issue a credit-guided price mechanism, strengthen the supervision of credit trading platforms, reduce credit price fluctuations, and regulate credit price ceilings. (4) Additionally, it is necessary for the government to guide the establishment of a benign credit supply and demand guidance mechanism in the market, increase the adjustment mechanism of the credit trading market, stabilize the credit price and credit value, consider the actual situation of different types of automakers in the market, and set different calculations for the rules for different types of automakers.
Limitations: (1) The calculation rules of the dual credit policy are simplified in our model. Thus, a more detailed portrayal may help subsequent studies to more accurately evaluate the effectiveness of the dual credit policy in promoting NEVs in China. (2) In reality, there are still many factors that can affect the production decision-making behavior of automakers.
Future research: (1) Future research will complicate the calculation rules of the dual credit policy and will consider the situation in which automakers retain some remaining credits to deal with market uncertainties. (2) Future research will complicate the payment matrix, adding the impact of consumer choice on the evolution of the Chinese auto market.
Author Contributions
Conceptualization, Y.X. and J.W.; methodology, Y.X. and H.Z.; software, Y.X.; validation, Y.X., J.W. and H.Z.; formal analysis, Y.X.; investigation, Y.X. and H.Z.; resources, J.W.; data curation, Y.X.; writing—original draft preparation, Y.X.; writing—review and editing, Y.X., M.R. and L.W.; funding acquisition, J.W. and L.W. All authors have read and agreed to the published version of the manuscript.
Funding
This research was funded by the National Social Science Foundation of China (No. 19FGLB029), the National Natural Science Foundation of China (Grant 71904084), Postgraduate Research & Practice Innovation Program of Jiangsu Province (No. KYCX20_3169), the Ministry of Education of Humanities and Social Science project (22YJCZH192), the Social Sciences Foundation of Jiangsu (22GLC008), and the General project of Philosophy and Social Sciences in Jiangsu Universities (sk20210080 #).
Institutional Review Board Statement
Not applicable.
Informed Consent Statement
Informed consent was obtained from all subjects involved in the study.
Data Availability Statement
The data used to support the findings of this study are included within the article.
Conflicts of Interest
The authors declare no conflict of interest.
References
- Pan, X.; Wang, L.; Dai, J.; Zhang, Q.; Peng, T.; Chen, W. Analysis of China’s oil and gas consumption under different scenarios toward 2050: An integrated modeling. Energy 2020, 195, 116991. [Google Scholar] [CrossRef]
- International Energy Agency (IEA). CO2 Emissions from Fuel Combustion; Highlights; IEA: Paris, France, 2019. [Google Scholar]
- Zhang, J.; Peng, J.; Song, C.; Ma, C.; Men, Z.; Wu, J.; Wu, L.; Wang, T.; Zhang, X.; Tao, S.; et al. Vehicular non-exhaust particulate emissions in Chinese megacities: Source profiles, real-world emission factors, and inventories. Environ. Pollut. 2020, 266, 115268. [Google Scholar] [CrossRef] [PubMed]
- Zhang, R.; Hanaoka, T. Deployment of electric vehicles in China to meet the carbon neutral target by 2060: Provincial disparities in energy systems, CO2 emissions, and cost effectiveness. Resour. Conserv. Recycl. 2021, 170, 105622. [Google Scholar] [CrossRef]
- Yu, Y.; Li, S.; Sun, H.; Taghizadeh-Hesary, F. Energy carbon emission reduction of China’s transportation sector: An input–output approach. Econ. Anal. Policy 2021, 69, 378–393. [Google Scholar] [CrossRef]
- Li, J.; Ku, Y.; Li, L.; Liu, C.; Deng, X. Optimal channel strategy for obtaining new energy vehicle credits under dual credit policy: Purchase, self-produce, or both? J. Clean. Prod. 2022, 342, 130852. [Google Scholar] [CrossRef]
- Wang, S.; Wang, J.; Li, J.; Wang, J.; Liang, L. Policy implications for promoting the adoption of electric vehicles: Do consumer’s knowledge, perceived risk, and financial incentive policy matter? Transp. Res. Part A Policy Pract. 2018, 117, 58–69. [Google Scholar] [CrossRef]
- Liao, H.; Peng, S.; Li, L.; Zhu, Y. The role of governmental policy in game between traditional fuel and new energy vehicles. Comput. Ind. Eng. 2022, 169, 108292. [Google Scholar] [CrossRef]
- Peng, L.; Li, Y. Policy Evolution and Intensity Evaluation of the Chinese New Energy Vehicle Industry Policy: The Angle of the Dual-Credit Policy. World Electr. Veh. J. 2022, 13, 90. [Google Scholar] [CrossRef]
- Chen, K.; Zhao, F.; Hao, H.; Liu, Z.; Liu, X. Hierarchical Optimization Decision-Making Method to Comply with China’s Fuel Consumption and New Energy Vehicle Credit Regulations. Sustainability 2021, 13, 7842. [Google Scholar] [CrossRef]
- Ou, S.; Lin, Z.; Qi, L.; Li, J.; He, X.; Przesmitzki, S. The dual-credit policy: Quantifying the policy impact on plug-in electric vehicle sales and industry profits in China. Energy Policy 2018, 121, 597–610. [Google Scholar] [CrossRef]
- Li, J.; Ku, Y.; Yu, Y.; Liu, C.; Zhou, Y. Optimizing production of new energy vehicles with across-chain cooperation under China’s dual credit policy. Energy 2020, 194, 116832. [Google Scholar] [CrossRef]
- He, H.; Li, S.; Wang, S.; Chen, Z.; Zhang, J.; Zhao, J.; Ma, F. Electrification decisions of traditional automakers under the dual-credit policy regime. Transp. Res. Part D Transp. Environ. 2021, 98, 102956. [Google Scholar] [CrossRef]
- Peng, L.; Li, Y.; Yu, H. Effects of Dual Credit Policy and Consumer Preferences on Production Decisions in Automobile Supply Chain. Sustainability 2021, 13, 5821. [Google Scholar] [CrossRef]
- Yu, Y.; Zhou, D.; Zha, D.; Wang, Q.; Zhu, Q. Optimal production and pricing strategies in auto supply chain when dual credit policy is substituted for subsidy policy. Energy 2021, 226, 120369. [Google Scholar] [CrossRef]
- Zhu, X.; Ding, L.; Zhu, H.; Guo, Y. The dual-credit policy model, a production strategy decision-making algorithm and application to Chinese automakers. Neural Comput. Appl. 2022, 1–15. [Google Scholar] [CrossRef]
- Ma, H.; Lou, G.; Fan, T.; Chan, H.K.; Chung, S.H. Conventional automotive supply chains under China’s dual-credit policy: Fuel economy, production and coordination. Energy Policy 2021, 151, 112166. [Google Scholar] [CrossRef]
- Lou, G.; Ma, H.; Fan, T.; Chan, H.K. Impact of the dual-credit policy on improvements in fuel economy and the production of internal combustion engine vehicles. Resour. Conserv. Recycl. 2020, 156, 104712. [Google Scholar] [CrossRef]
- Dimitropoulos, A.; van Ommeren, J.N.; Koster, P.; Rietveld, P. Not fully charged: Welfare effects of tax incentives for employer-provided electric cars. J. Environ. Econ. Manag. 2016, 78, 1–19. [Google Scholar] [CrossRef]
- Sierzchula, W.; Nemet, G. Using patents and prototypes for preliminary evaluation of technology-forcing policies: Lessons from California’s Zero Emission Vehicle regulations. Technol. Forecast. Soc. Chang. 2015, 100, 213–224. [Google Scholar] [CrossRef]
- Yu, L.; Jiang, X.; He, Y.; Jiao, Y. Promoting the Diffusion of New Energy Vehicles under Dual Credit Policy: Asymmetric Competition and Cooperation in Complex Network. Energies 2022, 15, 5361. [Google Scholar] [CrossRef]
- Liu, H.C.; You, X.Y.; Xue, Y.X.; Luan, X. Exploring critical factors influencing the diffusion of electric vehicles in China: A multi-stakeholder perspective. Res. Transp. Econ. 2017, 66, 46–58. [Google Scholar] [CrossRef]
- Chen, W.; Hu, Z.H. Using evolutionary game theory to study governments and manufacturers’ behavioral strategies under various carbon taxes and subsidies. J. Clean. Prod. 2018, 201, 123–141. [Google Scholar] [CrossRef]
- Fan, R.; Dong, L. The dynamic analysis and simulation of government subsidy strategies in low-carbon diffusion considering the behavior of heterogeneous agents. Energy Policy 2018, 117, 252–262. [Google Scholar] [CrossRef]
- Liu, C.; Huang, W.; Yang, C. The evolutionary dynamics of China’s electric vehicle industry–Taxes vs. subsidies. Comput. Ind. Eng. 2017, 113, 103–122. [Google Scholar] [CrossRef]
- Ji, S.; Zhao, D.; Luo, R. Evolutionary game analysis on local governments and manufacturers’ behavioral strategies: Impact of phasing out subsidies for new energy vehicles. Energy 2019, 189, 116064. [Google Scholar] [CrossRef]
- Kong, D.; Xia, Q.; Xue, Y.; Zhao, X. Effects of multi policies on electric vehicle diffusion under subsidy policy abolishment in China: A multi-actor perspective. Appl. Energy 2020, 266, 114887. [Google Scholar] [CrossRef]
- Jiao, Y.; Yu, L.; Wang, J.; Wu, D.; Tang, Y. Diffusion of new energy vehicles under incentive policies of China: Moderating role of market characteristic. J. Clean. Prod. 2022, 353, 131660. [Google Scholar] [CrossRef]
- Kong, D.Y.; Ma, S.J.; Tang, W.C.; Xue, Y.X. The policy effect on automobile industry considering the relationship between technology, market and production: The dual-credit policy as an example. Transp. Lett. 2022, 1–15. [Google Scholar] [CrossRef]
- Shi, Y.; Wei, Z.; Shahbaz, M.; Zeng, Y. Exploring the dynamics of low-carbon technology diffusion among enterprises: An evolutionary game model on a two-level heterogeneous social network. Energy Econ. 2021, 101, 105399. [Google Scholar] [CrossRef]
- Novak, S.; Chatterjee, K.; Nowak, M.A. Density games. J. Theor. Biol. 2013, 334, 26–34. [Google Scholar] [CrossRef]
- Huang, W.; Hauert, C.; Traulsen, A. Stochastic game dynamics under demographic fluctuations. Proc. Natl. Acad. Sci. USA 2015, 112, 9064–9069. [Google Scholar] [CrossRef] [PubMed]
- Wang, Z.; Zhang, J.; Zhao, H. The selection of green technology innovations under dual-credit policy. Sustainability 2020, 12, 6343. [Google Scholar] [CrossRef]
- Li, Y.; Zhang, Q.; Tang, Y.; Mclellan, B.; Ye, H.; Shimoda, H.; Ishihara, K. Dynamic optimization management of the dual-credit policy for passenger vehicles. J. Clean. Prod. 2020, 249, 119384. [Google Scholar] [CrossRef]
- Ministry of Industry and Information Technology (MIIT). Announcement on the Corporate Average Fuel Consumption and New Energy Vehicles Credits of Passenger Vehicle Companies in 2019. 2020. Available online: https://www.miit.gov.cn/xwdt/gxdt/sjdt/art/2020/art_de5c8433fad54cd89c7ae2be2aa5e76c.html (accessed on 22 June 2020).
- Ministry of Industry and Information Technology (MIIT). Announcement of Average Fuel Consumption and New Energy Vehicle Credits of Chinese Passenger Vehicle Enterprises in 2020. 2021. Available online: https://www.miit.gov.cn/jgsj/zbys/wjfb/art/2021/art_69ba8336123a4a3ba96a20771c494c08.html (accessed on 15 July 2021).
- Argasinski, K.; Broom, M. Interaction rates, vital rates, background fitness and replicator dynamics: How to embed evolutionary game structure into realistic population dynamics. Theory Biosci. 2018, 137, 33–50. [Google Scholar] [CrossRef] [PubMed]
- Govaert, A.; Zino, L.; Tegling, E. Population games on dynamic community networks. IEEE Control Syst. Lett. 2022, 6, 2695–2700. [Google Scholar] [CrossRef]
- Huang, D.; Delang, C.O.; Wu, Y. An Improved Lotka–Volterra Model Using Quantum Game Theory. Mathematics 2021, 9, 2217. [Google Scholar] [CrossRef]
- Friedman, D. On economic applications of evolutionary game theory. J. Evol. Econ. 1998, 8, 15–43. [Google Scholar] [CrossRef]
- Li, Y.; Zhang, Q.; Liu, B.; McLellan, B.; Gao, Y.; Tang, Y. Substitution effect of new-energy vehicle credit program and corporate average fuel consumption regulation for green-car subsidy. Energy 2018, 152, 223–236. [Google Scholar] [CrossRef]
- Sun, S.; Wang, W. Analysis on the market evolution of new energy vehicle based on population competition model. Transp. Res. Part D Transp. Environ. 2018, 65, 36–50. [Google Scholar] [CrossRef]
Disclaimer/Publisher’s Note: The statements, opinions and data contained in all publications are solely those of the individual author(s) and contributor(s) and not of MDPI and/or the editor(s). MDPI and/or the editor(s) disclaim responsibility for any injury to people or property resulting from any ideas, methods, instructions or products referred to in the content. |
© 2023 by the authors. Licensee MDPI, Basel, Switzerland. This article is an open access article distributed under the terms and conditions of the Creative Commons Attribution (CC BY) license (https://creativecommons.org/licenses/by/4.0/).
